1
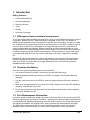
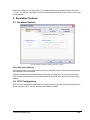
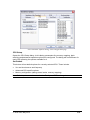
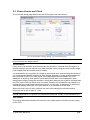
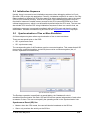
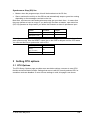
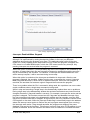
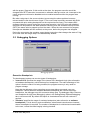
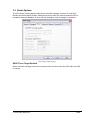
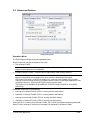
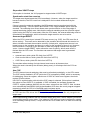
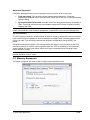
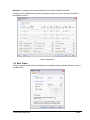
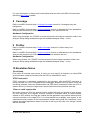
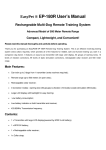
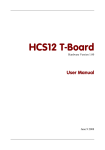
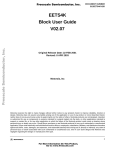
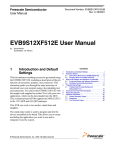
_ V9.12. 225 Technical Notes Freescale S12X Family In-Circuit Emulation This document is intended to be used together with the CPU reference manual provided by the silicon vendor. This document assumes knowledge of the CPU functionality and the terminology and concepts defined and explained in the CPU reference manual. Basic knowledge of winIDEA is also necessary. This document deals with specifics and advanced details and it is not meant as a basic or introductory text. Contents Contents 1 1 Introduction 1.1 Differences from a standard environment 1.2 Common Guidelines 1.3 Port Replacement Information 2 2 2 2 2 Emulation Options 2.1 Hardware Options 2.2 CPU Configuration 2.3 Power Source and Clock 2.4 Initialization Sequence 2.5 Synchronisation of Two or More Emulators 3 3 3 5 6 6 3 Setting CPU options 3.1 CPU Options 3.2 Debugging Options 3.3 Reset Options 3.4 Advanced Options 3.5 Memory Expansion 7 7 9 10 11 13 4 Debugging Interrupt Routines 14 5 Memory Access 15 6 Access Breakpoints 16 7 Trace 7.1 On-Chip Trace 7.2 Bus Trace 17 17 22 8 Coverage 23 9 Profiler 23 10 Emulation Notes 23 iSYSTEM, May 2015 1/24 1 Introduction Debug Features Unlimited Breakpoints Access Breakpoints Real-time Access Trace Profiler Execution Coverage 1.1 Differences from a standard environment The In-Circuit Emulator emulates the target CPU, which is removed from the target, as good as possible. Beside the CPU, additional logic is integrated on the POD. The amount of additional logic depends on the emulated CPU and the type of emulation. A buffer on a data bus is always used (minimal logic) and when rebuilding ports on the POD, maximum logic is used. As soon as the POD is connected to the target instead of the CPU, electrical and timing characteristics are changed. Different electrical and timing characteristics of used elements on the POD and prolonged lines from the target to the CPU on the POD contribute to different target (the whole system) characteristics. Consequentially, in worst case signal cross-talks and reflections can occur due to bad target connection, capacitance changes, etc. Beside that, pull-up and pull-down resistors are added to some signals. Pull-up/pull-down resistors are required to define the inactive state of signals like reset and interrupt inputs, while the POD is not connected to the target. Because of this, the POD can operate as standalone without the target. 1.2 Common Guidelines Here are some general guidelines that you should follow. Use external (target) Vcc/GND if possible (to prevent GND bouncing), Make an additional GND connection from POD to the target if the Emulator behaves strangely, Use the reset output line on the POD to reset the target whenever Emulator resets the CPU, Make sure the appropriate CPU is used on the POD. Please refer to the POD Hardware reference received with your POD. No on-chip or external watchdog timers can be used during emulation (unless explicitly permitted). Disable them all. 1.3 Port Replacement Information In general, when emulating the single chip mode, some ports have to be rebuilt on the POD because original ports are used for emulation – typically ports used as address and data bus in extended mode. Standard integrated circuits are used to rebuild "lost" ports. Rebuilt ports are logically compatible with original CPU’s ports, but electrical characteristics may differ. The differences may become relevant when standard integrated circuits are used and operating close to electrical limits, e.g. when input voltage level is close to specified iSYSTEM, May 2015 2/24 maximum voltage for low input level (“0”) or specified minimum voltage for high input level (“1”) or if, for example, the target is built in the way that the maximum port input current must be considered. 2 Emulation Options 2.1 Hardware Options Active Emulator Options dialog, Hardware page Clear Emulation Memory This option allows you to force clearing (with the specified value) of emulation memory after the emulation unit is initialized. Clearing emulation memory takes about 2 seconds per megabyte, so use it only when you want to make sure that previous emulation memory contents don't affect the current debug session. 2.2 CPU Configuration With In-Circuit emulation besides the CPU family and CPU type the emulation POD must be specified (some CPU's can be emulated with different PODs). iSYSTEM, May 2015 3/24 Active Emulator Options dialog, CPU Configuration page CPU Setup Opens the CPU Setup dialog. In this dialog, parameters like memory mapping, bank switching and advanced operation options are configured. The dialog will look different for each CPU reflecting the options available for it. Set Default This button will set default options for currently selected CPU. These include: Vcc and clock source and frequency Advanced CPU specific options Memory configuration (debug areas, banks, memory mapping) Note: Default options are also set when the Family or a POD is changed. iSYSTEM, May 2015 4/24 2.3 Power Source and Clock The Vcc/Clock Setup page determines the CPU's power and clock source. In-Circuit Emulator Options dialog, Vcc/Clock Setup page Note: When either of these settings is set to External, the corresponding line is routed directly to the CPU from the target system. Clock Source Clock source can be either used internal from the emulator or external from the target. It is recommended to use the internal clock when possible. When using the clock from the target, it can happen that the emulator fails to initialize. It is dissuaded to use a crystal in the target as an external clock source during the emulation. It is recommended that the oscillator is used instead. Normally, a crystal and two capacitors are connected to the CPU's clock inputs in the target application as stated in the CPU datasheet. A length of clock paths is critical and must be taken into consideration when designing the target. During the emulation, the distance between the crystal in the target and the CPU (on the POD) is further more increased; therefore the impedance may change in a manner that the crystal doesn't oscillate anymore. In such case, a standalone crystal circuit, oscillating already without the CPU must be built or an oscillator must be used. When the clock source is set to Internal, the clock is provided by the emulator and its frequency can be set in steps of 1 kHz. Note: The clock frequency is the frequency of the signal on the CPU's clock input pin. Any internal manipulation of it (division or multiplication) depends entirely on the emulated CPU. Vcc Source This setting determines whether the emulator or the target system provides a power supply for the CPU. iSYSTEM, May 2015 5/24 2.4 Initialization Sequence Usually, there is no need to use initialization sequence when debugging with an In-Circuit Emulator (ICE) a single chip application. Primarily, initialization sequence is used on On-Chip Debug systems to initialize the CPU after reset to be able to download the code to the target (CPU or CPU external) memory. With an ICE system, the initialization sequence may be required for instance to enable memory access to the CPU internal EEPROM or to some external target memory, which is not accessible by default after the CPU reset. The user can also disable CPU internal COP using initialization sequence if there is a need for that, etc. Initialization sequence is executed immediately after the CPU reset and then the code is downloaded. Detailed information may be found in the Initialization Sequence help topic. 2.5 Synchronisation of Two or More Emulators S12X development system allows synchronization of two or more emulators. There are two special pins on the POD: SR - synchronous reset SS - synchronous stop The corresponding pins of all Emulators must be connected together. This means that all SR pins must be connected together, and all SS pins must be connected together (but, of course, separated from each other). Synchronization Options The Emulator operation is specified in a special dialog, the 'Hardware/In-circuit emulation/Synchronization' tab. Both, SR and SS line can operate independent of each other as master or slave. The user must specify the operating mode in the 'Synchronization' tab. Synchronous Reset (SR) line Master: when the CPU resets, the reset will also be broadcast on the SR line; Slave: only monitors the activity on the SR line. iSYSTEM, May 2015 6/24 Synchronous Stop (SS) line Master: when the program stops, this will be broadcast on the SS line; Slave: monitors the activity on the SS line and automatically stops or goes into running depending on the messages received on the line. Both lines, synchronous reset and synchronous stop are open drain lines – it means that they can operate as input or output. If you define the Emulator as master, open drain line (SR, SS) operates as output and if you define the Emulator as slave it operates as input. RESET Emulator Target Entry (RUNRESET) Immediate Immediate Exit (RESETRUN) 150 E cycles Immediate Note: If you are using two emulators with S12X CPU running on the same clock, they will start synchronously. Also the RESET output line on the POD is delayed until the CPU starts. You can use this line to synchronize a third CPU. Run/Stop Emulator Entry On next source line (RUNWAITING) Exit (WAITINGRUN) 0-12 s 3 Setting CPU options 3.1 CPU Options The CPU Setup, Options page provides some emulation settings, common to most CPU families and all emulation modes. Settings that are not valid for currently selected CPU or emulation mode are disabled. If none of these settings is valid, this page is not shown. iSYSTEM, May 2015 7/24 CPU Setup, Options page Interrupts Enabled When Stopped Source step debug command is considered as a stop mode from the debugger’s standpoint although it is implemented by setting breakpoints (hidden to the user) on adequate addresses and running the program up to them. This particular option refers to the stop mode, but it really impacts source step behaviour only. When the program is stopped, the CPU enters in so-called BDM mode in which the CPU cannot service any interrupt. Any pending interrupts are serviced after the program is resumed. When this option is checked, I (Interrupt Mask) flag in the CCR register is not modified by the emulator. It means that when the user program is stopped or stepped through the sources, I flag is not affected by the emulator. For instance, if interrupts are enabled and there is an active interrupt request, it will be serviced during source step. When this option is unchecked, the interrupts are disabled in stop mode. After the user program is stopped, the emulator, hidden from the user, memorizes the current I (Interrupt Mask) flag state and sets it, which result in disabled interrupts. When the user program is resumed, the emulator first restores original I flag and then resumes the program. There is no problem when the ‘Run’ command is being used, but a problem can occur under certain conditions when a single step command is being used. While in stop and executing a single step in the disassembly window there are no problems. During single step in the disassembly window the emulator itself detects any instruction that changes the state of I flag and handles it correctly. For example, interrupts are active and the program is stopped. The emulator memorizes the I flag state and disables interrupts. Now the user executes single steps in the disassembly window and, for example, once the SWI instruction (software interrupt) is stepped. At this moment, the CPU pushes the content of the CCR register to the stack, where the Interrupt Enable flag is stored and jumps to the address where the interrupt vector points to. Before the user’s program was stopped (from running), the interrupts were active (I flag cleared) and after the program was stopped, they were disabled (I flag set) by the emulator. Therefore an incorrect I flag value (CCR register) is now pushed to the stack. Since the emulator can detect such an instruction it modifies the stack iSYSTEM, May 2015 8/24 with the proper I flag value. If this would not be done, the program execution would be changed after RETI instruction is executed on software interrupt routine exit. Interrupts in the user’s program would now be disabled and not enabled as before while the program was running. But when using step in the source window (source step) the above problem becomes relevant and the user should never forget it. The source step is actually executed with RUN command with prior setting breakpoints on the required source lines. If for instance SWI (software interrupt) occurs during the source step execution, the CCR value with disabled interrupts will be pushed to the stack and after returning from the software interrupt routine (RETI) the same value is popped up from the stack. When the user resumes his program, interrupts are disabled and not enabled, as they were, before the program was stopped. During the source step the emulator cannot detect instructions that changes the state of I flag as it is the case with single step in the disassembly window. 3.2 Debugging Options Debugging options Execution Breakpoints The development system can use two types of breakpoints: 'Internal CPU' specifies the usage of the internal CPU breakpoint logic (also referred to as hardware breakpoints), which features four breakpoints. The main advantage of this option is that the code is not being modified; the program memory is only used for program storage. Note that the debugger, when executing source step debug command, uses one breakpoint. Hence, when all available hardware breakpoints are used as execution breakpoints, the debugger may fail to execute debug step. The debugger offers 'Reserve one breakpoint for high-level debugging' option in the Debug/Debug Options/Debugging' tab to circumvent this. By default this option is checked and the user can uncheck it anytime. 'Emulator' specifies the usage of emulator breakpoints (also referred to as software breakpoints). This is done by code modification, where break instructions are inserted, where a breakpoint is required. The number of breakpoints is unlimited and unnoticeable to the user, unless the code integrity is being checked. iSYSTEM, May 2015 9/24 3.3 Reset Options The CPU Setup, Reset page provides some emulation settings, common to most CPU families and all emulation modes. Settings that are not valid for currently selected CPU or emulation mode are disabled. If none of these settings is valid, this page is not shown. CPU Setup, Options page RESET from Target Enabled When checked, the target reset line is sensed, which can then reset the CPU while the CPU is running. iSYSTEM, May 2015 10/24 3.4 Advanced Options Advanced options Operation Mode The POD supports single chip and expanded mode. Single chip mode can be emulated in two ways: Use internal FLASH In this case, Synchronization of multiple emulators, Task breakpoints and Break on trigger functionalities are not available! Emulate internal FLASH - Internal flash is replaced by RAM overlay memory. In this case, Synchronization of multiple emulators, Task breakpoints and Break on trigger functionalities are available only when emulator breakpoints are used! Due to the CPU pitfall, S12XDP512 mask L15Y runs only up to 33MHz (ECLK) when running from the overlay memory (Emulate internal FLASH). If the target application runs at higher frequency, ‘Use Internal FLASH’ mode must be used! This option is not available for S12XEP100, S12XF512 and S12XHZ512 ActivePRO PODs only Expanded mode can be emulated by running from internal FLASH (CPU is running without wait states) emulation of internal FLASH (CPU is running without wait states) running from external FLASH (CPU is running with wait states) emulation of external FLASH (CPU is running with wait states) When the CPU is running from internal FLASH, the FLASH is programmed during download. When FLASH (internal or external) is emulated it is replaced by emulator’s RAM. iSYSTEM, May 2015 11/24 Stop when XGATE stops If this option is checked, the X12 program is stopped when XGATE stops. Synchronize start from reset on The target reset signal resets the CPU immediately. However, when the target reset line becomes inactive, the CPU reset line is delayed for few hundred milliseconds by the emulator. If there is an active external watchdog, the CPU restart must be synchronized with the external watchdog. Then this option and 'RESET From Target Enabled' option must be checked. The watchdog timer event allows reset synchronization on the rising edge of external watchdog (target) reset. Note that the external watchdog must be a periodic signal (while forcing the CPU to a reset state). After the CPU starts, the external watchdog must be refreshed by the application, which ensures the target reset line not to be active. Assume target RESET When the CPU is reset by an internal CPU reset source (e.g. COP), the CPU reset line is driven actively. This reset can be detected by the emulator which extends this reset to be able to initialize and start the emulation correctly. At that point, original reset source is no longer known to the emulator and there is no way for the emulator to figure it out. However, this information is required for the emulator to fetch the program counter from a proper vector. ‘Assume target RESET’ option allows the user to specify, which reset vector is fetched after the CPU reset. The emulator can assume that target reset is generated because of: external reset, which yields PC fetch from 0xFFFE Clock monitor failure, which yields PC fetch from 0xFFFC) COP Failure, which yields PC fetch from 0xFFFA) The emulator allows testing of single internal reset source at the same time. When the reset is issued by the emulator (debug reset), it will always fetch the PC from 0xFFFE. Use COP The CPU has an internal watchdog, that must be refreshed periodically, or the CPU resets. The COP can be disabled in STOP (while the CPU is stopped by BDM), which is necessary for debugging. Since the register, which turns off COP is a write-once register, the whole register must be written. Use COP is a global option with which the COP usage is selected. If this option is enabled, the option to insert COPCTL is available. If COP is enabled, the software presets the COPCTL register (address 0x003C) with the value, entered into the COPCTL field. It makes sure automatically that RSBCK (the bit that disables COP when the user's program stopped respectively when the CPU is in the BDM mode) is always active. When COP is enabled and used, the RESET From Target Enabled option must be enabled. At COP reset the CPU drives the CPU reset line, which the emulator can only recognize as target reset. When experiencing problems with the emulator when using COP, check, whether you have a correct/valid interrupt vector table. If for instance COP interrupt vector is defined by mistake as a watchdog interrupt vector, it may look like the COP resets the CPU when the interrupt occurs. iSYSTEM, May 2015 12/24 Advanced Operation If software breakpoints are used, the program memory can be used in two ways: Task debugging. This operation mode enables task breakpoints. These are breakpoints, available only in a certain task, which can be set in the 'Debug/Operating System' dialog. Synchronization/Trace break. Normally, there is a delay when the stop command is used. This mode minimizes the time needed to stop the CPU and is used for quickly stopping the CPU. ‘Advanced Operation’ setting is available only when ‘Emulate internal FLASH’ operation mode is selected and ‘Use emulator breakpoints’ is selected for the execution breakpoints. Clock Selection The CPU has a XCLKS pin, which controls whether a crystal in combination with the internal loop controlled Pierce oscillator is used or whether full swing Pierce oscillator/external clock circuitry is used. The XCLKS pin selects the oscillator configuration during RESET low phase. Using the development system, XCLKS signal from the target is not connected to the CPU since the same pin is used for other purposes when the CPU is operating in the emulation mode. Instead, the user must define which clock type is implemented in the target using Clock Selection setting. Make sure that ‘Full swing Pierce oscillator or external clock source’ is selected when the internal emulator clock is used. 3.5 Memory Expansion This page configures the mode of the on-chip memory expansion unit. Memory Expansion iSYSTEM, May 2015 13/24 Memory Expansion Enabled If Memory Expansion is being used, this option must be checked. According to this selection, the mapping on the POD is automatically configured. ROMHM This option sets the ROMHM bit in the MISC register. With this bit turned on, access to the Flash Memory in the area of 0x4000-0x7FFF is turned off. ROMHM=0 - The 16K byte of fixed FLASH EEPROM in location 0x4000-0x7FFF can be accessed ROMHM=1 - disables direct access to 16K byte FLASH EEPROM from 0x4000-0x7fff in the memory map. The physical location of this 16K byte FLASH can still be accessed through the Program Page window. The option must be checked, if direct access to FLASH 0x4000-0x7FFF is disabled. The ROMHM must have the same value as the user uses in his application. Erase FLASH before download When the option is checked, a mass erase of the internal flash is performed prior to the debug download. When the option is unchecked, the debugger erases only sectors which need to be programmed during the debug download. This behaviour is typically required when program flash is additionally used for the EEPROM emulation, where it may be undesired to lose the EEPROM emulation data stored in the flash due to the flash mass erase performed before the debug download. Note: This option is available for S12XEP100, S12XF512 and S12XHZ512 ActivePRO PODs only. Bank FD Mapping S12X 0xFD bank (bank address: 0xFD8000-0xFDBFFF) is a mirror picture of a logic area 0x4000-0x7FFF. The same memory area can be accessed either as a bank 0xFD or as a logical area 0x4000. The user must select this setting based on how the application is linked. Trace, profiler and execution coverage results rely on this setting. Wrong setting will yield bad results in the trace, profiler and execution coverage. 4 Debugging Interrupt Routines An interrupt routine can only be debugged when the interrupt source for this routine has been disabled; otherwise you will keep reentering the routine and thus run out of system stack. For example, there is an interrupt routine with 10 source lines. Let’s assume that the interrupt routine is called periodically by a free running timer. A breakpoint is set on the first source line in the interrupt routine. Program execution stops at the breakpoint. Now source step is executed. Source step is actually executed using RUN command with prior setting of breakpoint on adequate source line. In this particular case, while source step is executed, the CPU executes the code and before the source step actually completes, a new interrupt call is generated by the timer. Consequentially new values are pushed onto the stack and the CPU stops on breakpoint again. If you repeat source steps in such interrupt routine new values are pushed to the stack and you can easily run out of stack. An interrupt source can be disabled in two ways: Disable the interrupt process when the program is stopped (stop mode) – refer to Interrupts Enabled When Stopped chapter. Stop mode is entered whenever the CPU is iSYSTEM, May 2015 14/24 stopped and the emulator remains in stop mode until the Run command is executed. (During Step, Step over, etc. commands, stop mode persists). Do not place a breakpoint on any instruction in the interrupt routine where interrupts are not yet disabled. You should also not step over any instruction that re-enables the interrupt, but run the program only up to that point. 5 Memory Access S12X development system feature standard monitor memory access, which require user program to be stopped and real-time memory access based on BDM interface, which allows reading and writing the memory while the application is running. Real-Time Memory Access All S12X development systems feature real-time memory access. The debugger can access CPU memory without disturbing the program being executed. Using hardware commands and on-chip BDM firmware, the debugger can access required resources in real time. In general, on-chip BDM firmware uses CPU dead cycles, when real-time read or write memory access is required. In worst case, some CPU cycles might be stolen. Note: Real-time access is available only for memory, which can be accessed through single memory read/write access. Watch window, memory window and SFRs window can be updated in real time. Monitor Access When monitor access to the CPU’s memory is requested, the emulator stops the CPU and instructs it to read the requested number of bytes. Since all accesses are performed using the CPU, all memory available to the CPU can be accessed. The drawback to this method is that memory cannot be accessed while the CPU is running. Stopping the CPU, accessing memory and running the CPU is an option, which, however, affects the real time execution considerably. The time the CPU is stopped for is relative and cannot be exactly determined. The software has full control over it. It stops the CPU, updates all required windows and sets the CPU back to running. Therefore the time depends on the communication type used, PC's frequency, CPU's clock, number of updated memory locations (memory window, SFR window, watches, variables window), etc. iSYSTEM, May 2015 15/24 6 Access Breakpoints The same on-chip debug resources are shared among hardware execution breakpoints, access breakpoints and on-chip trace trigger. Consequentially, debug resources used by one debug functionality are not available for the other two debug functionalities. In practice this means that no trace trigger can be set for instance on an instruction address, when four execution breakpoints are set already. Access Breakpoints dialog Four hardware comparator combinations are available, including a match and state machine. For each comparator, the appropriate core (S12X or XGATE) can be selected and the address, area, type, access type, data and mask can be specified. Please, refer to the On-Chip Trace and the On-Chip Trace & Access Breakpoints Troubleshooting Scenarios chapters on how to configure access breakpoints. Trace trigger and access breakpoints use the same debug resource and consequentially, the dialogs look alike. The only difference is the final action, which is either a program break or a trace trigger. iSYSTEM, May 2015 16/24 7 Trace The development system features full CPU bus trace named Bus Trace, which is implemented externally to the CPU. It’s “limited” to the S12X bus and does not allow recording of XGATE activity. Additionally the development system supports on-chip trace, which allows recording of both, S12X and XGATE activity. On-chip trace has many drawbacks comparing to the Bus Trace: small trace buffer, very limited data trace, no time stamps, limited trigger and no qualifier at all. Primarily Bus Trace is used when tracing the application. It makes sense to use on-chip trace only when XGATE activity must be analyzed. Trace operation mode is selected in the ‘Hardware/Analyzer’ dialog. ‘iTrace’ must be selected for Bus Trace use. All address entries in the trace trigger & qualifier dialogs take bank address by default unless there is memory area selection next to the address item. 7.1 On-Chip Trace The same on-chip debug resources are shared among hardware execution breakpoints, access breakpoints and on-chip trace trigger. Consequentially, debug resources used by one debug functionality are not available for the other two debug functionalities. In practice this would mean that no trace trigger can be set for instance on instruction address, when four execution breakpoints are set already. S12X on-chip trace features 64 x 8 Bytes trace buffer, which can record X12 and XGATE program changes. Trace uses branch-trace mechanism. Then it’s up to debugger to interpolate the program trace for sequential instructions from a local image of program memory contents. In this way, the debugger can reconstruct the full program flow. Trace can record 128 program changes iSYSTEM, May 2015 17/24 when recording only X12 or only XGATE activity. 64 program changes can be recorded when recording both, X12 and XGATE activity. Reconstructed program normally contains over 1000 program instructions, which may sound a lot but in practice it’s negligible considering that the code is written in C language and comparing to the size of the Active Trace buffer. Trace can record in three modes: Normal mode records all code fetches when the program fetches Loop mode records all program fetches except if there are two or more consecutive Detail mode records 64 data accesses. Each data access is identified by address, data, and access type (RD/WR). It cannot be found out which code caused each data access since no code fetches are recorded. Please read the technical document titled Trace Concepts in order to become familiar with the coverage technology, background and possible use cases. Trace is integrated in the Analyzer window together with the coverage and profiler functionality. Refer to a separate user’s manual titled Analyzer explaining the analyzer window. It can be found in ‘Help/winIDEA Contents’ or by simply having focus on the Analyzer window and pressing F1. On-Chip Trace & Access Breakpoints Troubleshooting Scenarios Following examples demonstrate on-chip trace use. Note that the same examples apply also for the access breakpoints where a trigger event becomes a breakpoint event. Trace Trigger and Access Breakpoints dialogs are almost identical since the same on-chip debug resources are used to break the CPU (access breakpoint) or trigger the trace. First, select ‘On-Chip’ Analyzer operation mode in the Hardware/Analyzer Setup dialog. This setting is not relevant for access breakpoints use. iSYSTEM, May 2015 18/24 Example: The application writes to a memory range 0x1020-0x1040 although normally it shouldn’t. Trace will trigger on first CPU write into the memory range from 0x1020 to 0x1040. Setting Mask to 0 ignores specific Data value. Trace configuration Equivalent access breakpoints configuration iSYSTEM, May 2015 19/24 Example: The application misbehaves when an unexpected 0x08 byte is written to address 0x1064. Following trace configuration will record program around the event ‘write 0x08 to the address 0x1064’. Trace configuration Equivalent access breakpoints configuration iSYSTEM, May 2015 20/24 Example: In the application, an unexpected 0x15 byte is written at address 0x101D. This example differs from the previous example in the address alignment. The on-chip comparator configuration is different when setting trace trigger or access breakpoint on an odd or an even address. Trace configuration Below access breakpoints configuration stops the application on first CPU byte write 0x15 to the address 0x101D. Equivalent access breakpoints configuration iSYSTEM, May 2015 21/24 Example: I’m getting an unexpected 0x150A word written at address 0x1200. Following trace configuration records the program around the event ‘word write 0x150A to the address 0x1200’. Trace configuration 7.2 Bus Trace ‘iTrace’ operation mode must be selected in the ‘Hardware/Analyzer Setup’ dialog in order to use Bus Trace. iSYSTEM, May 2015 22/24 For more information on these trace functionalities and use refer to winIDEA Contents Help describing Bus Trace in details. 8 Coverage Refer to winIDEA Contents Help, Coverage Concepts section for Coverage theory and background. Refer to winIDEA Contents Help, Analyzer Window section (or alternatively to the standalone Analyzer.pdf document) for information on Coverage user interface and use. Hardware Configuration When using Coverage, the ‘iTRACE’ must be selected for the Analyzer operation mode in the Analyzer Setup dialog available through the Hardware/Analyzer Setup… menu. 9 Profiler Refer to winIDEA Contents Help, Profiler Concepts section for Profiler theory and background. Refer to winIDEA Contents Help, Analyzer Window section (or alternatively to the standalone Analyzer.pdf document) for information on Profiler user interface and use. Hardware Configuration When using Profiler, the ‘iTRACE’ must be selected for the Analyzer operation mode in the Analyzer Setup dialog available through the Hardware/Analyzer Setup… menu. 10 Emulation Notes Clock Setup Even when an external clock source is used, you must specify its frequency to allow BDM synchronization (used by Emulator) after the CPU is released from reset. STOP Instruction STOP instruction is completely supported by the emulator. After the STOP instruction is being executed, the CPU is stopped and the debugger displays HALTED status. Note that the debug windows cannot be updated while HALTED status is displayed. When the CPU is awaken either by interrupt or target reset, the emulation/execution proceeds normally. 'Clear on read' register bits Be careful, when the CPU has special function register bits that are cleared on read access. Do note that when such register (memory location) is accessed either by memory/watch window or SFR window, the flags are cleared and the application may behave different when using the emulator or the target CPU. It is recommended not to display such register or the associated memory location in the memory/watch window during final test. Otherwise, it may happen that target application doesn't work due to the bug in the code even though it works with the emulator. iSYSTEM, May 2015 23/24 For instance, the user makes a mistake and does not clear a flag in the application. Using the emulator, the application works correctly since the user uses the SFR window, which clears the flag when the window is updated. Internal CPU FLASH The internal FLASH is disabled during the emulation and cannot be used in any way except when ‘Emulate internal flash’ emulation mode (available on S12XDP512 Active PRO/GT POD only) is selected in the ‘Hardware/Emulation Options/CPU Setup/Advanced’ tab. The user program should not enable or disable the internal flash (ROMON bit in the MISC register) since this may conflict with the emulation. Note that the S12XDP512 Active PRO/GT POD runs at full CPU speed only when ‘Emulate internal flash’ emulation mode is selected! Refer to Operation Mode chapter for more details on the emulation mode selection. Internal EEPROM or RAM In case of S12XDP512 Active PRO/GT POD, download to the internal EEPROM or the internal RAM must be done through the ‘Target download’. Additionally, when downloading the code to the internal EEPROM, the user is required to write the ECLKDIV register to divide the oscillator clock down to within the 150kHz to 200kHz range. Refer to the CPU datasheet for more details. ECLKDIV register can be configured prior to download using initialization sequence. In case of S12XEP100 Active PRO/GT POD, the program and data flash are programmed through the standard debug download. Checksum Remove all emulator breakpoints when performing any kind of checksum since they may impact the checksum result. Disclaimer: iSYSTEM assumes no responsibility for any errors which may appear in this document, reserves the right to change devices or specifications detailed herein at any time without notice, and does not make any commitment to update the information herein. iSYSTEM. All rights reserved. iSYSTEM, May 2015 24/24