1
•••••••••••••
• • • • • • • • • • • • • • • • • • • • 0 • • • • • • • • e • • • •
HYDATAAdvancedTraining Workshop
•
•
•
•
Institute for Meteorological
Trainingand Research
Report to the OverseasDevelopment
Administrationand the World Meteorological
Organisation
14-25 February1994
•
•
•
•
This report is an official document prepared
under contract between Overseas Development
Administration and the Natural Environment
Research Council. It should not be quoted
without permission of both the Institute of
Hydrology and Overseas Development
Administration.
•
Institute of Hydrology
Crowmarsh Gifford
Wallingford
Oxfordshire
OXIO 8BB
UK
Tel:
0491 838800
Fax: 0491 832256
Telex: 849365 Hydrol G
ODA 94/3
••••••••••••••••••••••••••••••••••
•
•
•
•
•
Contents
Page
INTRODUCTION
2
•
3
THE WORKSHOP
2.1
Advanced training
2.2
Main workshop
2
RECOMMENDATIONS AND CONCLUSIONS
3
•
•
REFERENCES
•
•
•
110
Appendix A Programme of the workshop
6
Appendix B The course participants
7
Appendix C Lecture material provided to IMTR
11
••••••••••••••••••••••••••••••••••
•
•
•
1
Introduction
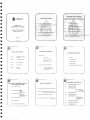
HYDATA
is a hydrological database system for personal computers which was developed at
the Institute of Hydrology in the United Kingdom.
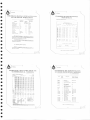
HYDATA has been used in more than
50 countries worldwide including more than 20 African countries (see Figure I).
•
In November 1990, a 1 week HYDATA
workshop (ref. I) was held in Nairobi, Kenya at the
Institute for Meteorological Training and Research (IMTR) which is part of the Kenyan
Meteorological
Department. The workshop was attended by 12 working hydrologists from
10 African countries and aimed to give the participants practical experience in using personal
computers and databases for the analysis of hydrological data, together with an in-depth
knowledge of the H Y DATA system. The workshop was jointly funded by ODA (through IH)
and WMO, and was envisaged as a first step in developing a homogeneous hydrological
database system throughout the SADCC and 1GADD countries of Africa. As a direct result
of this workshop, HYDATA was adopted as the national database system for Uganda (ref.2)
and several of the other countries represented have since obtained funding for the system and
the associated computer hardware.
Following the success of this first workshop, it was decided to hold the course annually to
give African hydrologists from other organisations a chance to see and usethe system. WMO
recommended that the workshop should in future be timed to coincide with the WMO
sponsored Regional Postgraduate Diploma course in Operational Hydrology at IMTR.
This
nine month course aims to bring working hydrologists and hydrometeorologists from African
countries up to date in the latest hydrological measurement and analysis techniques.
The
participants can come from any African country but must be educated to at least BSc standard
and must be working in an operational hydrology or meteorology deparment. Two such
workshops were organised on this basis and were held in 1992 (13 participants from 8
African countries - ref.3) and 1993 (12 participants from 9 African countries - ref 4).
Following
the 1993 workshop, IMTR and
jointly proposed that IMTR should be
established as a regional training centre for HYDATA and that an advanced training course
should be organised to provide IMTR staff with the expertise to run HYDATA workshops
in future with only limited support from IH. This report describes the outcome of this
advanced training.
Funding for the Institute of Hydrology contribution was again provided
by ODA through the project "HYDATA
dissemination" (ODA Research Scheme no. D120)
and funding for the IMTR contribution was provided by WMO.
•
•
•
•
•
2
Theworkshop
2.1
ADVANCED TRAINING
The advanced training was held from 14-18 February 1994 at the Institute for Meteorological
Training and Research in Nairobi and also continued as a background activity during the main
HYDATA
workshop which was held in the following week 21-25 February 1994 (Appendix
A). The advanced training was given by two staff members of the Institute of Hydrology.
Three computers were loaned by IMTR and the WMO Drought Monitoring Center (DMC)
for the duration of the course:
•
•
•
•
•
•
•
•
•
•
•
•
•
•
•
•
•
•
•
•
•
•
•
HYDATA USERS in Africa
NE
National
Project/Regional
•
•
•
•
•
•
•
•
•
Educational
[PZ Regional Training
Centre
Figure 1
2
1110
•
•
Type
Processor
Memory
BULL MICRAL 600
DEC STATION 300
BULL MICRAL 200
80386
80386
80286
640K RAM
640K RAM
640K RAM 4 extended
VGA
VGA
VGA
Screen
Disk drive
3 5 inch
3.5 inch
3 5 inch
1.44 Mb
1.44 Mb
1.44 Mb
DMC also lent an IBM proprinter and an Epson dot tnatrix printer. Several
other computers
owned by IMTR or DMC and used in the previous workshops were either
in use on other
projects or were too outdated to run the latest and most powerful version
of HYDATA
(Version 3.10A) used for the workshop. An additional laptop computer and
2 Canon portable
printers were also lent by the Institute of Hydrology for use on the course.
The computing
equipment was installed in a lecture room which was reserved for the duration
of the course.
All of the details of course administration and registration were dealt
with efficiently by
IMTR.
IMTR nominated six staff to attend the advanced training course (Appendi
x B).
The
nominees all had previous teaching experience and together encompassed
a wide range of
research interests:
•
Organsiation
Postion
Researchand teaching interests
IMTR
Deputy Director
Low flow and flood frequency analysis
IMTR
Meteorologist
Rainfall runoff modelling
DMC
Systems Manager
Drought forecasting/computer systems
management
DMC
Ilydrometeorologist
Regional evaporation estimation and
water balances
MWD
Hydrologist
Operational hydrology
UNMD
Lecturer
Flood frequency analysis
.•
•
0
•
•
IMTR
DMC
UNMD
MWD
=
=
=
=
Institute for Meteorological Training and Research
WMO Drought Monitoring Centre
Head Office of Ministry of Land Reclamation, Regional and Water Developm
ent, Nairobi
Meteorology Department. University of Nairobi
•
As the main aim of the HYDATA training courses is to give the participan
ts practical 'hands
on' experience of using a hydrological database system, the main part
of the advanced
training was centred around the set of practical exercises which the
participants were to
attempt during the main workshop in the following week.
These include 18 prepared
exercises and a post-flood assessment project. The background to these
exercises and the
'model' answers to the questions were covered in detail together with
revision of the
underlying theory. Once the full course material had been covered, individual
lecturers were
allocated specific topics to cover in more depth, and further training was
given on a 'one to
one' basis in each of the topics chosen. In general, the nominated lecturers
were already
familiar with much of the theory and quickly picked up the skills needed
to operate the
H Y DATA system.
•
3
•
•
11/
One further aspect of the advanced training was to simulate some of the
hardware and
software related problems which, in our experience, often occur during software
training
courses. For thesc exercises, two of the lecturers were nominated as 'System Managers
' and,
during the main workshop, were presented without warning with a range
of simulated
hardware and software failures to fix. These includod problems like accidenta
lly deleting or
corrupting
key program files, accidentally introducing computer viruses to the course
computers, incorrectly modifying the computer's configuration files and various
problems
with setting up and operating printers and plotters. The ability to 'troubleshoot'
problems of
this type is vital when running software training courses for users with
only limited
computi ng cxper ience.
2.2
1110
MAIN WORKSHOP
The main workshop followed on immediately from the advanced training. Eight
participants
from four African countries attended the workshop (Appendix
B).
Apart from the
introductory
lecture, all of the lectures and individual tuition were given by IMTR's
nominated lecturers. Overall, the workshop ran smoothly with little assistance
from the two
Institute of Hydrology staff, other than to provide additional advanced training.
As in previous courses, the participants were supplied with copies of the teaching
material
used during the course and with various technical papers giving more backgroun
d information
on the software. Copies of the HYDATA manual and the UK Low Flow Study
report, which
were donated to the IMTR library in 1992, were also made available for reference.
The
participants worked mainly in pairs but also had the opportunity to work alone
during lunch
and coffee breaks.
Appendix A lists the program of the workshop and the subjects which were
covered. The
first two days were spent on the basic operations of entering, plotting and editing
data and
developing rating curves. The third day was spent on aspects of data transfer
and system
management.
The discussion included a description of the responsibilities of the System
Manager in setting up and maintaining a database system ready for operational
use. The main
analysis options in HYDATA,
and the underlying theory, were covered on the fourth day and
the final day was given over to revision and demonstrations of other software.
Also, a
revised week-long project was included which is designed to demonstrate the way
HYDATA
is actually used operationally in many hydrological departments.
The project consisted of
entering a backlog of historic river level and discharge data for a site, developin
g a rating
equation for the site, convening the levels to flows and then deriving various
flow statistics
for use in a hypothetical post-flood assessment study.
Several related topics were also covered during the course. For example, a
half day was
spent on a general introduction to personal computers and the DOS operating
system. This
was useful preparation for the data transfer exercises and is essential knowledge
for anyone
who uses personal computers on a regular basis. The following related hydrologic
al software
packages were also used or demonstrated:
- HDBINS
- HYTRAN
- HYFAP
Installation and customisation program for HYDATA
A program for loading data directly onto a HYDATA
A flood frequency analysis package
•
•
4
•
•
database
•
•
More information on these packages is given in the technical leaflets at the back of this
report.
Together, these components provide an integrated system for the capture, routine
analysis and storage of hydrological data.
•
•
3
Recommendations
and conclusions
•
IMTR's nominated lecturers generally coped well with mastering and delivering the course
material. The course was kept on schedule and the project - which was more difficult than
in previous years - was completed by the end of the week. Initial feedback from the eight
participants was that it had been a useful although intensive week and many expressed the
intention to use HYDATA on their main course project, due to start in the second semester
of the Operational Hydrology
course. Also, this year, most of the participants thought it
likely that they will use HYDATA when they return to their normal duties at the end of the
course since, with only two exceptions, HYDATA
is already used in the Head Office of all
the departments represented.
For use on future courses, IMTR were presented with copies of all the overhead
transparancies used on the course and with a set of briefing notes for the lecturers (Appendix
C). IMTR was also given a 20 user educational licence for the full HYDATA system. This
will allow IMTR to keep HYDATA permanently loaded on several machines for use both in
teaching and in project work by the participants. IMTR and DMC staff will also be able to
use HYDATA
in their own research work if they wish (and IH would encourage this as a way
of becoming more familiar with the system).
•
Several discussions were also held about future workshops.
On the evidence of this first
IMTR-managed course, IMTR will have little difficulty organising HYDATA training courses
in future. However, some continuing annual support will be required from the Institute of
Hydrology
in the form of updated lecture notes, participant training packs, updates to
software and, possibly, additional advanced training. In particular, for the next course, we
strongly recommend that IMTR are provided with the following items:
I.
2.
3.
The HYFAP flood frequency analysis package
The HYRROM rainfall runoff model
A laptop computer and computer screen projection
panel
The HYFAP and HYRROM packages link into HYDATA and would be a useful complement
to existing modules in the Operational Hydrology course while the laptop computer and
projection panel would make demonstrating the exercises on the computers much easier.
•
For the future, we anticipate that the IMTR-managed HYDATA
courses will continue to
provide working hydrologists with useful direct experience of the advantages of using
computers for processing hydrological data and will further encourage adoption of the
HYDATA
database system in many African countries. Indeed, experience from past courses
does suggest that several countries have subsequently submitted requests for HYDATA
systems after seeing the system in use either at IMTR or in other African countries.
IMTR
may also wish to provide direct regional support of existing HYDATA users possibly through
organising advanced regional HYDATA
training workshops themselves. The Institute of
Hydrology would strongly support this approach if adopted. It is worth noting that, of the
•
5
•
•
•
SADCC and IGADD countries, most now have at least one organisation using the HYDATA
package and, in many of these countries. HYDATA is used as the nationaldatabase system
for archiving hydrological data.
•
References
I. The HYDATA Workshop, Institute for Meteorological Training and Research, 19-23
November, 1990. IH report to the Overseas Development Administration and the World
Meteorological Organisation, December 1990.
•
•
2. A hydrological database system for Uganda; installation and training. IH report to the
British Development Division in East Africa, Nairobi, Kenya, May 1992.
3. HYDATA workshop, Institute for Meteorological Training and Research, 7-11 April,
1992. 1H report to the Overseas Development Administration and the World Meteorological
Organisation, May 1993.
4. HYDATA workshop, Institute for Meteorological Training and Research, 21-26 March,
1993. IH report to the Overseas Development Administration and the World Meteorological
Organisation, ODA 93/4.
•
•
•
•
AppendixA Programme
of theworkshop
IMTR, FEBRUARY 21 25, 1994
-
Monda
Februa
21
Introduction and Welcome
General principles of operation
Plotting and printing
Entering and editing river level data
•
Tuesda
Februa
22
Entering and editing river level data (continued)
Introduction to DOS and hardware
Entering and editing discharge measurements
Rating curve development
Introduction to project
Wednesday Februar
23
Introduction to system management
Data backup and restore options
Monthly data and other data types
Project work (continued)
•
Thursda
•
Februa
24
Comparison plot options
Double mass curves
Flow Duration curves
Low Flow analysis routines
Project work (continued)
•
Frida
Fehruar
25
Data transfer methods
Demonstrations of other software
General discussion of project work
Closing speeches and presentation of certificates
•
•
•
•
•
•
Course exercises
The course was based around a set of 18 prepared exercises covering the following topics:
General principles of operation, plotting data
•
Examining contents of database
•
Stage data editor, printing and plotting stage data
•
•
Gauging data editor. Plotted and printed output for gaugings
5. Fitting rating curves
6. Conversion of stage to discharge or storage
7. Conversion of daily to monthly values
8. Allocating spaceand setting up stations
9. Loading data from a file
10. Backing up data to floppy disc
11. Installing and customising a HYDATA database
12. Revision of edit, print and plot options for daily data
•
•
Comparison plots
Double massplots
•
Flow duration curves
•
Low flow statistics (base flow index, annual minima)
•
Transferring data using HYTRAN and HYDATA macro files
•
Introduction to DOS
•
•
•
•
•
•
8
•
•
•
•
•
AppendixB Thecourseparticipants
Advanced trainin
course
I. Philip D. Munah
Deputy Director
Institute for Meteorological Training and Research
Kenya Meteorological Department
PO Box 30259
Nairobi
Kenya
•
2. Julius N. Kabubi
Meteorologist I
Institute for Meteorological Training and Research
Kenya Meteorological Department
PO Box 30259
Nairobi
Kenya
•
3. Joseph M. Kimani
Senior Meteorologist: Systems
WMO Drought Monitoring Centre
Kenya Meteorological Department
PO Box 30259
Nairobi
Kenya
4 Johnson Maina
Hydrometeorologist
I
WMO Drought Monitoring Centre
Kenya Meteorological Department
PO Box 30259
Nairobi
Kenya
•
5 Mr E.M.Mnyamwezi
Senior Hydrologist
Ministry of Land Reclamation,
PO Box 30521
Nairobi
Kenya
Regional and Water Development
6 Mr Alfred 0. Opere
Lecturer (1lydrometeorology)
Department of Meteorology
University of Nairobi
Nairobi
Kenya
•
9
•
•
•
•
•
•
•
Main workshop
1 Harnis G.K. Mbaruku
Senior Assistant Geologist
Water Research Section
Ministry of Water. Energy and Minerals
P.O.Box 35066
Dar es Salaam
Tanzania
2 Projestus Magezi Rwiza
Executive Engineer
Operations and Maintenance
Ministry of Water, Energy and Minerals
P.O.Box 35066
Dar es Salaam
Tanzania
•
3. Atakelte Teferi
Geoscientist 11
Ethiopian Valleys Development
PO Box 1086
Addis Ababa
Ethiopia
Authority
•
4. Muchai Shaban Mugwika
Hydrologist II
Ministry of Land Reclamation,
PO Box 30521
Nairobi
Kenya
Regional and Water Development
•
•
5. Stanley
District
Ministry
District
PO Box
Kisumu
Kenya
Nyaga Mime
Hydrologist
of Land Reclamation,
Water Office
4571
Regional and Water Development
•
•
•
•
10
•
•
•
•
•
6 Aaron Bundi Aduna
Hydrologist
Hydrology Division
Architectural and Engineering Services Corporation
PO Box 3969
Accra
Ghana
•
•
•
7 Namusasi Edward Masibaye
Meteorologist II
Kenya Meteorological Department
PO Box 30259
Nairobi
Kenya
8. Gerald Muhara
Meteorologist-Climatologist
Kenya Meteorological Department
PO Box 30259
Nairobi
Kenya
•
Appendix C Lecture material provided to IMTR
IMTR
were provided with the following
material for use on future courses:
C.1 A full set of all the overhead transparancies used on the course. These comprise some
120 colour transparancies divided into ten I hour (approx.) lectures on the following themes:
,
Introduction
General principles of operation
Editing data
DOS and hardware
Gaugings and rating curves
System Management
Analysis I
Analysis 2
Data Transfer
Project
C.2 Lecturer's briefing notes. These comprise some 40 pages of notes on various aspects
of the HYDATA package. These notes are designed to supplement the information provided
in the HYDATA
manual and on the overhead transparancies, and are grouped into the
following themes:
•
introduction to HYDATA
General principles of operation
Editing data
Rating curves
System Management
Data analysis
Data Transfer
DOS and hardware
C.3 HYDATA
tutorial notes. A set of 18 prepared exercises which test participants on
various aspects of the HYDATA
system, together with 'model answers to the questions at
the end of each exercise (not included here).
•
C.4 Notes for the course project.
The project is designed to run over several days and
simulates a miniature 'crisis' in a hydrological department.
In a short space of time,
participants are required to enter a backlog of historical data and to derive various statistics
relating to an imaginary flood event. The answers are required for use in justifying or
rejecting possible compensation claims following failure of a flood protection embankment.
The project material consists of a set of notes and some 80 observer record cards containing
the project data (not included here).
•
•
•
•
12
•
•
H
H,T)ATA
HISTORY OF COURSE
_
,A1410BtOURBE,
INSTITUTE OF
IWDRODCSGY
.
RJR=
VT
...1—.7.meleknoscassof
Anna=
ADMIPCIt1014(004)
/
Worldag
\
of RI
kØwledgt
-hydnkele
HYDATA
TRAINING COURSE
as
DATA
kalt•P•aal
commec
WEif
rjralr_
Institute
for
Training
‘
Meteorological
and
\
Intrsidne4
1A4ES
,
Research
f lys)/
\ lkevls\1/21-ilydLio0:\iidS/
\
`.....ntkiL
REGIONAL
Demon/gratlk_mf
APRICANKY
rinCIA 1.3 .501MEIENAMCA Mae
MAC(
Nairobi
COURSE MATERIAL
PLAN OF COURSE
COURSE CONTENT
rmatcirAM-S
DAY I
btrsclualon
•
Eliting dam
DAY 2
Canine
HYDATA
lectors
!AC tures
noel.
Capin
el treorporendes
Demossirations
•nd Ratings
Asada
alas
Course exercises
Notes on course Project
DAN'
3
System management
Count
DAY 4
AnovRs asses
DAY 5
Ration
fro/ ea lark
%IA FIRIAIROM
WI R I I DRAM
1:1, Mod
%Atka
Profecl
Tulorlals
and advanced
oplions
Report
I. IA Lee Moo Studies Report
IWIDAT A Manual
1111)FEATURES OF HYDATA
WHAT IS HYDATA
WHY USE A HYDROLOGICAL
DATABASE SYSTEM
Fall
milting
Rating
Civa
rapid setae
curve
(scuttles
for thus
editor
io /ma
Hydrae.,
d•thinn
An".
In
reflood
(avow)
Conversion
options
Levels—iv-.
Fronds
Alan
bigh query
sapoi.
newt&
abase
yartnoli
ostipul
for aorta
a date ••••• mat commonly
eamouteel
tars rosary.
undies
gam I. be anola•lv
calm novo
sow anon
Used bv more Mao 50 muoirla
curvet
worlande
eau "WM
Spina
data worry
aim
options
I. more Man
couotela
mottatien
- Low
Menu
wad efficiency
1
Duration
- Comparboo
driven
Graphical/
Improve...off
Monthly
Summary
- Flow
ostiona. lamina
-•••
Installation program
c•Ri•
It sed
Immos..
Daily
analysis
hainalab
improve
Flows
—RN-Morn<
Alen
Itydrological
(•
mouse)
tables
year
otapui
Flows
Plots
OLOCISTN
Ns.
HISTORY OF HYDATA
HYDA TA
•
•
Based
'rd.',
ern mainframe
selffaffi
DIssenslustion
database
I.e Poffonsl
•upported
natoto toed Lova recants
dots
Ise I IS Itrystroloral
Regional ..11.1.bapi
nab affe
farnPaIn
Input sad output
klendff
Ost.o.Ue tralalag
by.
Is
Arria• sod ffseohert
courses
n !noir uts of 110,040
aelplInt
rerunnentty
staffed
IS mootbs
free advlat
a
aff local governments
•
_wind
•
•
aft alK
bon,
Daseffteffths
•
AND DFATELOPMEN
SUPPORT
Sargsnffabff°
MeIraeoisabot
Nses,s,ataa
snit ate
cestetnIons
for roomful
dff
Nest re rdons
Inns
on Icatatholoo
adinfittstrottem
Deveaoptcen1
Oreessos
Lto, sibe„
I -1 ttttt
to en
rele•sed
tI
charge,
>-
rare Wl\OOSrlsbse.lea.,d
sod nomad.
A otos
III Dal
Oneludlon
HYDAT A I:SER.S
itsice • tear
hood
fseottener
I IL.Noltsare
IsetlItle•
sod
ND DJ
BACKGROI.
INS II FIAT. OF Ill MUM A
in Africa
IhnIn
Nino,
1
Ciuurel
kWEAVeces
astabffshed
k
„„,„fin
Gbra
Ntre eft
(n. C.••••
dalahan
tt•If
1411professicsoal
Funded
tor foci water
k nation./
be
,ot
•ar,,,t,..
ita.rnoioar
s„rs
(moor...
itoorars
„
r. too,
o•no
rountonat
RN.**
Is-
quaint
ooze,
Sunimn
non
todrometeorolopIrd
moon..
smeaSnd
Towns
In dr oloolcst
Ur].
tralnlog
tuna.,
Zombis
Ammo.
EXAMPLE OF A
FIYDATA MENU
HYDATA MENUS
IIYDAIA ts opeewacl b Staten'
GENERAL
me0u zywern
PRINCIPLES
^,
OF OPERATION
list
Arisesuks
cd options
FOR
Special
HVOATA
hays
kr
using
100A1
end
d•Il•
noir,
DA I A SH EC HON
-teats--
fin no
Ill
Quo
/2)
19.1100 No. :
[31 Year
HI
PC LP
REDA
I
IL
[5( '
110,12
END
EN CI
Find dais
110123]
119911
1
HYDATA menu structure
SPECIAL
KEYS IN HYDATA
TYPES OF DATA
STORED IN HYDATA
GENERAL
FI
HELP MESCAGES
1.3
QUI
F4
READ
Esc
RIVER LEVEL
FM/Ant
4.
I ILI
GO NMI:
FLOW
RESERVOIRIAKE
I LEVEL
GAU(;INGS
my us
STORAGE
aed
RATING
LEVEL/STORAGE
CURVES
CURVES
RAINFALL
GENERAL
OA I
VI RI
D. I
1105W
WATER
BOXI
1511
0111
DATA
DATA
Bk.SP
t' STATIONS
DATA STORAGE INTERAATS
IN HYDATA
e.g. MET
QUALITY
- GENERA I . PRINCIPLES
-
g
All 41.11/ Ii, II)
-
DA1A
•re sored
In station%
chin
are .14,144
I
99,A9V-90
(But
A: Ch.M...
11/Blei
-
DIM:.
1100
\ IR
11 \ 11I
Al
V
MON
\
II
1DA
!
'1
IA
IRAI\F
I
II
MIA
L2o'
/
:4:
NICEr
r
•••
...then
All
practical
exer the.
I GFNERA1
datahise
Sanas
repAted
on HIRAI-
sessions
provided
SESSION I
are based
with
RAINIALL
F NI 0NIS)
111427CAI
(.1,44,
14427DAR
N
free.
HYDATA
LOAN
Imam]
• RATNGS
S 1.11),A Ok% ERACI I
10511115
RAINIA1
are based
dots
The dermestratioadatebsse
415 IR
I S11 iItAI,E
MONTIR
Ii Ids •ao e
oa the set of
the coarse
vole,
• RATING
jolly
DAIL
be Elloc•ted
PRACTICAL
d 1 VEI:RAINFAld
It1rd
PAILS
must
SYSTEM
I he exercisee
DAIL
Irre
OF STATION
NUMBERING
101105
DAIL',
e
4.111o0 Idenhilk
EXAMPLE
Mallon type. on H YDAI A
GALGIN“
ill
1.1 Ft
I
EVENT
Is ins
;
II
•
I 111
A •uldd
7 "7:
II DA
1
40427DAIIRAI•4
1647'mov1111
Ali
I R‘1,1A1
OMAl
I 111,151
•
•••••••• 1.434.14••••••
as • deraosistratios
several
differest
Is described
countries
is ilw
EXERCISES
(based
on
Using
the
demonstration
aid
MENUS
DATABASE
database)
SPECIAL
1 and
data
Gauging.
!Ten
ratings
levels
Using
hat an editor
roe..
The editors
to flows
I slog spend
Monthly
station
TOPICS COVERED
and
Converting
Dire used I.eeateringetata
the keybOard
keys
or trora
Me
trot,
r
dant
COMPARISON
DOUBLE
Producog
MMUS
MASS
FLOW
FLOM
plot.
Many
rt
puns
DURATION
BASE
EDITING DATA
mammy
Lambed
Editing
INTRODUCTORY EXERCISE
+ EXERCISES 1/2
KEYS
Producing
d•L•hase
optimist are availabk
Apply
Enter
CURVES
ANALYSIS
Use with
binding
Setting
correction
Interpolate
finnan
data
or
futon
(jaoll conversion)
tor missing
data
,
flap
without
a None
data
up
• dat•hase
E011
MOVING
A ROUND
1 II(
INC
(SING
A MOUSE
(optional)
:MORS
MA< 0.010
MA,. up • vac(
I A I &Any
IA.
(EY I
4t•inr•
P.M+
lin• I:
ISph.
Menu
Yaw. set MAG. ciff•u If purantrA•
durmill
fin
ins
ea rekewchnw,
ft_
EDITING DATA VALUES
-(;NTG1NGS
EDITOR COMMANDS
Shnialla.neotn
Inns4101Oentf
of ksel and flow
D.C. value font.
nph. • rewrawf
k the ow•
•mbar
160
called cineharte
t salt%
flooR
Deno
made acme ralTrat
throw tiblewsv
dock Aida.
measuremeetts
Delaull
nags
Ad 1,A1 bkftek
&lamAunt
In II1DAI
...IAA
A. •Is.
measurements
eeln
En wsdhailn
A.b0 lloaletheoretinl
hosTfrow
•pptles
to shnlInneow,
of tale or ...wreak
\Icy,
kriglo•E
!wino!.
Ran
IAA INT
loOt..ilerp•IAA
HMI
I imoto
Date F.-attired enents
of
low!,
AI WAYS
List
OA, A
j AGS
WHi V t
If)PNG
DATA
nww dwohnt
OCT51 en
wehi
and I
1.1,ARI.A
t
mAlon•I
aol to
• bd.:lee)
methods
\ 1.10C 11511
/-
ortIon•I
I D If [ninny
levels wed storage
DATE
11KV
SN
CURVES
RATING
IS H yum-A
DATA
GAUGING
MEASUREMENTS
DISCHARGE
-
BASIC CONCErIS
SETUP FOR
TYPICAL
'
7
EX(1
DE
APPI
WEIGHTING
par
(AG
c)
Q— :Oh
:Tad' r
1). uhtru4
1)11 I.. [
I
IJ.
F I OM
j
IA.NORF
IDEQ'I.WhIDRI11,-()_]
14;2\
:4 I
t4
PROBLEMS
IN
CURVE DEVEI
..,
CURVE CALCI. I ATIONS
RVIING
PAIIM;
CONVERSION
OPMEN1
IN HY DATA
SF AsON
I or.
Ill
SQUARES
451
II
t.
_Deduct,
Et
AI
F I D tech.
I of
v
iin4
DM
10S
S
IF H EFFECI
A
lava
I r111111••••
U, FIND
DES I I ANDS
IISD.
DI PI
1001.1-0Ratraft(112)1-
IFsI
(
II
I
((NNE
rtfat
- (Iota
t
rtc.
II ‘Nr-F
it
kIN
0011PI
II
ban.]
ratan
56111
ind
c nt.S. out
haat
Dept.
.FLON•
••• •1••
I nglacaring
11010•11
Off
ION
Al
%NH.
TIM I
IN
I 0 26 SHIFTS
AP
at'
VI mi
e g 51DM.
.( HA F.
, FA, PHD
11,F)
SI
F rn
IN A
hart
MannIna
-7 /
nn-
M4NAGEMEN1
SYSTEM
SYSTEM
MANAGED
A WF-IT.
JUST
THAN
MORE
A HYDATA
CONSIST
-
S OF
ON
HINTS
MANAGER
ROLE OF THE SYSTEM
dm!.
up •
a kepi
decnocet•Clon
Ve.ure
L
near
Ion nAmpl,
Ill
Super
—
dale
•nd
en."
bacl••••
1150*51
11•1••
performed
In
(Weir
k
fa, T
HVLIATA
an.
Sot
Ow Imuallelen
• ro•ra
• ...p••••
ItP.10
•
•••••••,••
patts°6
actInInt
knnp,(ti
setting
Ilea:book
•I••
•••S{.•
••
pray-am
•••
•••••••
f•••••••
• I.
I •••••••
pf,
,
olye
nth..
DATABAS.
0•••••1•1••••
or Dorm)
la a Ire
ntliart•
II 1. -
•dd
deka
break
natal
computer
woe..
••11.1.11on
twdamanctl
FIVOATA
Oil-
lac
output
F.
cb( tiAltbsts..4"
••PE
(stnIttn(t•
• •••••"
."
avastablat
Ill
output
Hydra...
IN-DD•nd
I data
pint
plata
on databs
detailed
bete
'
PS
e•Dan..1
11.1.
urtein4
1.."nirksr
rmanu
—
_
I
HAW
IA
DA
PERFORMING
DATABASE
hadnInn
Junta
•
de/
ad.
attt•
Data
PublkhInt
I he cl••
••1•••••r•Oln•
din a r•••••••
tal
au it dalattattc
of prob
othn
orystl•alov•
(acacia
Num,
lem.
..rIlydrolec
,
kendatra
id tan
lou
Service
S
talc
brad
aerate
taple•
caw
•
•
•
•
HINTS ON
ADDING A NEW STATION
DATA BACKUPS
wm
YOBOAMOYSKM0
1 Backup
DATASS
tbe Database
before
ROBINS
THERIVATA
mosgli
space
mom
of
sawn
HYDATA
st
Taoword,
0
Iamb
A••••••••ne
floppy
Mao
or. cheap SA Ow One scent sting
Omsk
Ne.
readings
- Data
formal
May
poor
rtorratpletten
elMa S !remind.
Tbe
matron
of mambo)
ItettafrAr
Hydrologleal
- Type
and elmeklat
to be Soaped
(or all fel are
requirements
a) Stage smiles.-
PROGRAM
startles
Allem
2 Allocate
INSTALLATION
rem be ran
mod
ol
Pee
In nags
el
Siontbly
MUT
- Missing
Gnarl
Original
Logger
Estimate
Radio
Observer
Lockage
Mow
SLYER
AITIR
to am
momlan
(114.R.I.
THE
STARTING
TO
HYDROLOGICAL
tOAD
DATA
I FAR
OS
A DATABASE
stations
1900 - 2000
A olomaticall)
STATION FILES
DOCUMENTATION
I
SYSTEM DOCUMENTATION
These
rnIottmat
A database
Is NO
on the data
loaded
am
without
aod
detailed
lbe analyses
Ohl
Amid
roadol
AI
perforate
Retool
of
Record
of problems
swIap
should
contoin
of
record.
derumeomtlon
relevoot
repair
•
Thoff
I
trf
lot
Math
1)Pa
ce
of documenislan
•
emounteral
mummer
Moab..
System
with
lambda.
meth
post
harthearcsolle•
to operstInt
the
Plots
Moho..
ond
Tr
pool
oil
floe
up to for
Al
MI
VI
to ItMARI
front
H IDA
I
notes
per footled
entry
and
valdstIon
Nod.
AL
Oft..
ANALYSIS
ROUTINES IN HYDATA
al ad reastemIa
produced
DFDATA
movidassae
coMPARISON
bask mobs:knob=
ROW
1.4)
KOW
on the
sham.,
beeper,
--
ping
YPAP
disrhope
table,
on
fro
o.tIdotloo,
and
en•lo
dr
took
IbtottlIon
on oda(
errors
torte
to
orldInal
development
LoA
lame
Iti000
0erl.otob.
graph
Olsen
mare
due
I year
.idt
daft
t•
be
VMS
p.ttasd.otsIda
.pkssaiyi.sfabe
IMMUlal
and
Moir
pleu
4•••• •• •
a g II
one
RIM
Abe
HYDATS
plat meson mew
malfalisoM
planed
ANALYSIS
*anal
Ma.
•
MASS ROTS
DORARONCURVM
Damao.
•
do
PLOTS
TID
LOW
sandaled
SOME TYPICAL USES OF
COMPARISON PLOTS
Tumult
DOCILE
of dl
homing P.n.' "IS
SI. deleted due to
Nolo
COMPARISON PLOTS
•
date
A
Detailed
of arm
door
mom
tHdrogophs
ratilep
Mooed
wont
flood
mop.
to
doeunientallon
,O
to • rthtlon
performs
TAWS
sena
F6.1 tn,...7
Matt
(mirk
now
remstr marsh
u out:
L •
L
di
4.EW
remit
COMPARISON
PLOTS
DOUBLE
OPTIONS
not
data
(e.g.
D1S'ert
(e.g.
Oa Ilan
or
dee
helogradi
one
serkt
•ln
iildlOgrame
Id
HYDA
TA. double
Ihe
mess
ooe
(e g
serlea
with
10 eStinlate
tilling
Of &sod
respect
the
Mote are based
on daily
data
cumulative
flows
lag
to the
between
or rainfall
at 2 stations
craw
Assaf
'
peaks)
Oualrly
clecta
other
•
Typical
on data
correlations
between
stations
fleCK)
uses
tWO StatiOrd)
Shows
Piot the logarithms
(e g to examine
WITH
MASS PLOTS
rainfall)
Compare
10 exa Mine
ERRORS
DOUBLE
Examining
Lag
IDENTIFYING
MASS PLO TS
IN HYDATA
of the
low flow
data
behavom)
I A break
Dan
In Ole
the
CUNT
md•Cates
posse*
data error Marling
from Jan
1973
problem
a pasts.
data
`ON
. IETHODS
SOME POSSIBLE CA USES OF—BREAKS'
IN DOUBLE MASS PLOTS
FLOW
DATA
Results
s(ation
FLOW
DURATION
CURVES
IN HYDATA
CURVES IN IIYDATA
on the same river)
Share percentage
Shill
USED TO CALCULATE
FLOW DURATION
of erne • given
now exceeded
I. r•tkag
Abstract:0ms
between
TrIbulary
Inflow
Ihe I natio.,
bens tee
the 2 stations
Rased on dads
dat•
(up to 5 woo
es
1.•
RAD:FALL
D Al
Ram pug,
A 0
nearby
rain:mote°
(hoiput
Moly
of ninny
cut don.
changed
building
COM
dry ned
le.g. tree
new
Is meal
pond
uses
Measurefneni
•
Guide
GENEltAI
1
f
(Thane
I.
Chace
la maneremeol
Clamge
is recordon
of floe
to catchment
V•lidation
2
IAD,
noosed
Expos..
'
or
relishdos
characterisocs
of omput
for hydrologle•I
matt
observer
•usts
eV/planI
C
EXAMPLES
FLOW
CakahtSg
OF USES OF
DURATION
the swediwa
flow
sad
PLOW
CURVES
-
DURATION
OPTIONS
CURVES
IN HYDATA
Q95
D
Del
LOW FLOW ANALYSIS ROIFTINES
IN HYDATA
*pads
%Perth
cliv
dee
Dentin
preled
ei
!Div
Lme
DID
BASE
Weide
Id
AD.
tertmelbe
Dvt
t
amen
fie
FLOW
rempuloce
i,
1De anew
M.O.
Isms Flow
MIAMI...)
este luwe•I
ruars
DOCARITIEHIC
OF HYDROGRAPHS
of loweleek
RECESSION
Comparing.
INDEX
coke
•11 team
PLOTS
rnpont
ANNUAL
sone,
Ma'
1
•
1)1.14et0
emtchnwet
ex a
MINIMA
PLOTS
clines
holy
apt.'s
pomade to pewee
• brief
illtredenliall
here.
Deo.
I'.
t
roe evepethei
ladeaD1
yeah...a)
Far, further
InforamOws.
refer to the HVIJAI
A nutowl
I
LOW FLOW
ROUTINESBASE
FLOW
CALCULATION
INDEX
METHOD
FOR
BASE FLOW INDEX
•
Tim methods are brad
tow
•
el these rereeendel
Mew Studio. Report
Alba*
ter tem
ameloped
centric&
I. Ile UK
Mt
kw its UI
Glee
the ROY&
are merle&
• mean
el die properties
from ersemdweIn
escrow
A bill
BM MISR.
• Sri.
A R.
RTI I/Spikes
el Oa
trantleater
BR •
Mal
nerer
erlikhetine
Al/A2
revertribifil.00
T•ill
•
Tbe rent comm.
tem •
the Ms Iles routine.
Derloteg rotehroa•
EatImatins
Devele•Int
•
Im RHO*
n.
Map el BPI gin • mebel add.
so • reglemel male
Ism
Hew lake
Selassie'
Areal
ant
to catchment reposes
ALGORITHM
de•
Terclettler•
mad Fat reillanVisterotkool
Smile •
tetchment response e.g. TREND project I. West Africa
Soothers Md.
tootribotion
me:
chereclerletka
relle•IRY
m.d.b
MR eerfece reser
an eon Wee be mad In regromiee eq.-mime ler predlc
other Wm flew etatistIre
(9 rencnrinl
e.g.
,so OFT
b
•
The IITLIATA
missal Elva lull Setae
elierlEb•
sled
•
•
•
ESTIMATING
BASE
FL,OWINDEX OLTPUT
LOGARITHMIC
PLOT
THE
FROM
OPTION
RECESSION
CONSTANT
A LOGARITHMIC
PLOT
•
Output can be provided ea tbe terns
or Cs• printed ROI
Els
OPT hen
si • Insitheek
bosh
14K,
044.1
•
The hvdreete-IS
ten Re. Is Sot"
l met to name.
•
•
•
I he A ,,,,
1/41. Hos tAlli)
rvoreloalow
pee rem...
Leelm coml..",
Ii,
crimple. tie le tired le whew.
me...emir
preemie.
respire. tor use le 1.111111.0onnew loreconler
III
TOR
It
Q
then
RECESSION
WQi
Uwe
LOW FLOW
FREQUENCY
PLOTS
PLOT OPIION
Erwin
An shores/ye
)ore
PLOT
Obeffeed
RECESSION
1.1
• =
method let atlesatIng
Temnestles
none
"Plot!
pion mamma]
retire
minis=
Been
pollee
THEORY
rtrflella
Werke wen en same 1.1: dots
Optimum
res.tved
mks
tear.
*NS
benneled IR se towage
the slope
at9
e
rune
Goers
Welhal
Dlerribodeed Grimed.
Motes.
parities
tri
Famelese cum
Ns wieldy need -
premated /or reseal
Lanai
only
usedI. admen Eel
tellahOlty
ctX-.
However, ma. be mai
le seine Mafioso
[A
Q.
ADF
Slope
Oblerred
—Co e
Beers
e4. Anew]
mliknum
Rae
ler tim IN
year return period
d
( 641-
EXAMPLE
FORTRAN
ay
OF
SUBROUTINE
()urn
LOW FLOW FREQUENCY
LIBRARY
OPTIONS
FXM ANALYSIS
OF DATA
OPTIONS IN HYDATA
For eimpbelly,
D-Day
option
Dorton, ....
males,
smog preleed lor flows ugl
HYDATA
ma/
PrwRia
• 8•Sted
ono
wittlom
Day
Span
1.41.1
Other
1.1•41.
MtsaMg
doss option
DeSnes mailroom
number
of miming MO
In CYMIT,
an
••
ADE' &DM.
Mandardbm
017.•
Include.
the data to • spreadebmt
(Tang
VII M1.1,1.1”.
CALI
opdons far data anthyde
Export
'Write
ew etatislitol
pstkage
file' or 1111/OUT)
per /Nu
farmed
r
0
ID Write
option
mutts
by Me merit,
day
flow
FORTRAN
FORTRAN
routines
Subroutine
using the HYDATA
Lihrom
9.1.1714‘.411
:01,1)•• •
0
tn
nitwits
portages
whIch MA directly
to HYDATA
MAM
Yandmdtsee
results M the wan
mous)
1.13i111111
ug,
HATA?
HYRROM
I
Plotted
or MIDAIR
output
OPTIONS FOR
DATA TRANSFER
INIO
IIYDATA
DATA INPUT AND OUTPUT
(EXERCISES 9 and 17)
03
I
Keyboard
2
I24
3
124 r Macro
4
HYMAN
3
IIVCOM
Datafile
file
( from (
It OM I
I OF IIA DA t A
I
Oraphs
2
Write I ile option
I
IINIX1121
4
/ bk
k AN Subroubne
IPrd O54 ( todi
EXAMPLES OF METHODS FOR
EXAMPLES OE METHODS FOR
DNI A TRANSFERS
(al
WPM
r--moon
DATA TRANSFERS
lot
F.
—
19,
1
FILE
SPIN SHOW
r
CITCOM
WRITE' FHA
E tbror
II OM I
IINTRAN
,
1
!IAD VrA
111C0M
IIIDA
I A]
flood frequency
rainfall
•oalyzie
month:not/41m
•F
•
6
HiBAIA.
EXERCISE
3 EDIT SOME EVENT DATA
I \I/I
\I
6
HYOATA
tv,INII,II
1 H.
6
\III.
\I
(.1
[Pr HAI A
I
V\1I'I
I I)I
\
_
w:
'171
•
rel:r.
le
msal
les
IV.
TIME
•••••••••••1
o)
11MIAIA
EXAMPLE
OF SUMMARY
(EXERCISE
INFORMATION
2)
LIST OF inontA
1u11105N11
Eon
1,1
COMMANDS
WOOS
gemsm
e•
ANY
COMM
Il•
Ct1101
XI OCT
Is••••••
comem•le
CC*
...meg
Kerma
are
•• • ease
SY 1 el •••••••••11mg
•
same
el • t ••••
S.
•••••••••
X
TOR
IMCM
11 mn
re Men
melee..
tle
um.
Mel
Oa
Mo.
rem91.
se
•
1mm
11.1
••
PI/
14nr.
Nor
Seem,
Tem
Le
or
he*
Olt
.11
&me
1.1
• 2 asplam
mbar
•••1
flans
•
COO
1.•
emu
norm.
to<
R.
Immo
es/
mom.
1....melom
•
X.
•••mem
so.
oIS,.
el
Mee
COT/
Menem
SESE•Ile•
Ir•
Mem
famemaa
mem..
I we
MOM
11
TM
11
114 emmas
embed
•••/
et
ban
Mural
wers.
d
•••1•01•1
ew
3
TEM
•
4.
la
••••••••••
Me% MVO/
Swam
Tthe
1.
bum
1.40...4
apple
wasem•
mew
COO
Taal
• I••nsis
Mae
lama
/4. SPICO1••• IC It MANS••••••••
*1 ••••••
rm.
Mem • 631.11114
Km.
who
Me
•
C••• •••
ma)
des
• meady
m m to 11 Ammer.
t•••
*Mos.
1 ...••••
mem
leas.
•• ream
m.
ms
•• • bee 1.
fla mem.
rem.
TOR
mowed
•••m
Memel
•
6.1.
4spemil
l0mena•
ATM1m.•
man.
Mr
44
•
3111
ee•••111
my"90",'":"(
I.
I 10
655
11YDAI
11Y11.1.1A
LIST OF DYDATA
Elm
COMMANDS
1
,,,,,
1
A
LIST OF inuxrn
EDIT COMMANDS
•1
..emeg
Oh
111m1
...l••
de
ma
Ise.
et
es.
op••••••...emoissit
•••••0
1.,
••••104
OS *a
1••11 remiing
.11 mem,
••••
freed
emery
mho..
MP •
mime
slypelars
.00
woe..
Mt
mem
'31111
&feel
0.•
•
mil.
Is
TII
•
St
is•
•••••••••11
ra.
101 us
So
al
mil
male..
STT
ea
ma
ways•
1101
A.11
LIME
•
Mew
Ph.
•••
lsu.
•••
rim
1•••••
mlue
las
*Rod
mem
•I•Ims
r
-Wm
lees
sem.
00
eg MOVE.
ram
•
0)
X0040
Mu
ear
!Menet
TO
S.
imam
Xs.
mei
la
2 101.111C
(ews
rem,
wpfse0.07
-•• ••••1
meg
by
1.1•••
de.
am •
II)
mewl
once
ono
Mem
S S.
usly le Ile
a•ma 1111el
la
S•
"V.v.,
IN a.
•••
woe
re•
ems
•••11
Mc.
EVO1
Milt
el
4.y.
10
• 'Ma
1•••• •• P•••••••
is
11111
TM
pa..4••••
EVENT
MI
au..
yew
me.
Mai
11.•
a I.
4.1 wee
a sm. dune.*
ft eem•MlIME
Se My I.
dm
med..
semouss
bh.el
RI
2 *Mem
...re
a
Ma
MOT
••••
de
el
Mole.
sus*
I.
haw
se••••emcomals
mertm
•••
12
catar•MX
•••
1,1:0031.....1
Om
•••••••••
Plo
I.
sn
WM...0
•a•4
•••
epees
Is'l0team
men.
.4 (m
MOVE
de
• .1.1.
PM Ilemml
Mr
1. mos
mem}
yenta
memmas
Emmy
•••••Me
••4
•,
teems
mats
1111 MP •
••
we.
1,4m1,
mmed
poi
Re
m ea. ciao
1.1. 5..
1•••• L•11. weal
am
rums
She .61,0
s. my
1m,
Mao
.0
MO
so ihe
ra
ware.a
*rile.
••
11
art seal
Wm' 1•••• %SI
F.0
113.33k
mgmaly
let le
10 CO Sams Sy
a
14 0111
01054
mama
mdsp• 11.• •••
mad
4.1..
TIN1E mem
memo
Mel lat•
11••• • Messes'
des
1•• me,Ms.
44.
pm.
T.M.
I
-
HY”ATA
EXERCISE
\ I
It
\
ION
GAUGINGS
4,5 AND 6 AND RATINGS
•
EXAMPLE
OF
GMIGING
EDITOR
PRIN'IOI
EXAMPLES
OF RATIN(;
11)I10R
(HTPIrE
CURVE
6
HYDATA
HYDATA
cliArrER
9 ANALYSIS
PROGRAMS
EXAMPLE
OF FLOW DURATION
SHORT PRINTOUT
(IlAPILSO
1 Dam
low
Purse
on
ANALYSIS
ARM MR 11101111.044
Curve
0
=
:tat
1
1
Num
9 1 Exampk
Row Sumo.
curve
plot
Tab/.
9
I 1.4.404 9IRe..
dmmoon ma/mos them pnotopt
9 I0
6
..
HYDATA
ClIAPTEK
HYDATA
9
ANAITSIS
PROGRAMS
94
e•..10..
ltI*fleeeoiItIpi.i
Inds.
F:
:
tcu..cr
Oi.ch.rp.
:11
mt.
hmee
9 4 Emenpk
of bnelbo
'Men
plot
Table
910
94
Lumplo
of moorm
of 1111
HYDATA
EXAMPLE OF nyDATA
YEARBOOK OUTPUT
WITH NOTES ON VALIDATION
WORK
CIIIAMell
7
I/All
'I
.• •1-•
PM
A
•
, ••
._
•_
•• •
I-
'•
•-
• •,
-•
---
—
e
Imo r
Iceo-1
Z
- Modelled
..,• ,1•••
TIM)
(Oelell
4j
7 )
leen&
pnnsme
el
daly
now
de)
l‘j
IIYDATA
EXAMPLE OF COMPARISON PLOT OUTPUT
(NOTE Y AXES SHIFTED TO SEPARATE THE LINES)
6)HYOATA
-
EXAMPLE
OF DOUBLE MASS PLOT OUTPUT
Al
Centanien
se
11YDAYA
HYDATA
411j)
THE HYDATA MANUAL GIVES A FULL LIST
OF THE SPECIAL HYDATA KEYS
tiara
Melva
key
11DM
lhalatlel
Mil
Wank
DI
askew
DI
lave
fty.4
horn
lea
......
VI
11.uuDd.I.l
neve
Id
menu
PEI
TE
•
U
of dmal
.1,
Fan
VI,
Page
Dian
Aral
For
acsainp
aerate
the
the
ihe
Wail
Up
Page
Ill,.
Ole lag
esa
ea
thy
IBM
611.1
barn
HYDAT
ha
HYDATA
A
r
or
•
5c
II
II
I
!Eve
yrpj
Q
11,1,
00111
mad
E
thy
Eva
la
ease
manual
On
1E1
rypng
ee
00
keyboard
other
0
may
by
I2lI.d
replay
ilve
be
y
by
Wm
carriage
ray
13
1.-1.0e
approval,
the
5abovth
sr fec.ed
by
lo the
Ella
nefIll.CIJ
Key
SeIeDing
vent
--,
arta
20 1Enurll
2.3
mita
the
Graughal
KR
am
IyD,lIthk.
ma move
on
ley s Iltelunel
1E1
key
nate
d chant
mem
Page
11141
III
VIII[111141121
ang
key
I_
Navel
End
May
.• ••
the
Top
rev
EERIE
1-1
0
Mon
_
INeEnplo.
1.2/21
Paced
irleavore
EXAMPLES OF PRINTED ()Input
FROM liVDATA
HArn.
menu ()Opts
cavolled
or eu.uu.d.
by
211Cling
enIcted
wane
Ea
'ave.
your
petaled
the
ot
fiur
PI d1PIIFF4
I
6,1
EXAMPLE OE A DATA TABLE FROM THE
UK HYDROLOGICAL
YEARBOOK
.,•,.••.,
•
..•
•
6,
HYDATA
CONTENTS OF THE DEMONSTRATION
DATABASE (FROM IIYDATA MANUAL)
••.•
I•le
Ept
Station
Pena]
Neale
Even!
ell Record
Mania
I
(Vega
RE.
lb
level
19102
Feaclingt/d•y
12K1110
el
of
mediae
1912
I
kVel
(21 1.1,1
1980
te
1981
(Stage)
Feeling
Eye.
g•ogings
I Eng
I
equal,
Sveretconge
_
ll
p0M11.
I4
Siage
retvage
REEL
Rat
;EVER,
Pea
OEly
mean
no.y
970
even
00.0
9/I
Fla
equara
to
1984
1994
Gent•el
Fa
Erapwarem
Wady,
urs
m
1996
Generel
Pan
keeporation
WEI,/
985
w
1985
General
Meumum
duly
926
ume!“,..Y
Geneve
9 1,1
ItTrICIAKIM
Orly
ReunIell
Rua
Sae
1)Gly
01
age
Tit
antall
Day
ant
Duly
(recap,
III
DE
ell
10 m
1985
VI to
190
921
Ivan
den01151IIIII.n421
re
197S
Yaoto
191,1
z
IIYDATA
FIYDATA
CHAIM
EXAMPLE
OF FLOW DURATION
C114.1911111
ARAI
OM
CM
AR
AM
I. 11 4
ANAMIS
AMN
CURVE PLOT
s
Low
.1
Liam
maw
9 3 Curnpin
II
1.13••
Dm,.
cm
flaw
dorm.
cum<
Flo.
Fregarmu
Stn.
1
Cm-now
Om
RIM.,
97
Fompk
of
flow
Ireciummy
9 10
9 26
6
HYDATA
HYDATA
HYFAP
llydrulrig44.1
Salmare
1 lememy
I
11110
HYDATA
Analysis
lawomme
ol
FORTRAN SUBROUTINE
Ilydunlagy
10 1
FIRMED
IIVIARatimaiesII..
paranteren
of ANNUAL
111ITAP
1113AP
MAXIMUM
mewl
perform
a frequenc,
can
be
to commie
am.,
"FAY
44.
used
a
numb..
al
prohabilly
DONN
....
Nmm
smemOnd
I In
subroannes
ard
functions
hang
a um*
magnitmles
MOM
can
piton
ola
LIBRARY
I•ackam
woh
marbobsed
1.110111“4,
dala
paminAlm
Wimp
.11ing
lily
other
111'
sutwoMme
Ronk
magnnudes
1."991
4•4911
magnitude.
01
OK
Him
Amon
II1TS
End',
31•
HID!
Gem
Rana.
mentlen
asc cm II YDATA
0.11.
details
ir
such
HYDATA
as (1aw.
IMw4e
•nd
Moms&
411414411y
Madmen
dimensionlmi.
iegroaa1
fiIi9&y
flir.,
In/
111017
OE
II VG,'
Gets
ilddriwinalnianondeindowd,
as ammonium
inoliment
KEY
DO
FrAniaEs
Mcnu
"ODD.
Choice
and
Amuse
°punted
Ill4
ofT
and
of IR Maintain.,
iaan
and
(Kapimal
re
Mimg
(1116,1
Geo
• year
N
oar
day
Imil
ERGS
Gas
mit
eacm
0•1
HIGG
Gas
• /In/
10
IMO
MGM
Gnu.
monthly
HIGn
Gms
ImmaI
lmi)
11119
C(O1yVIC•f11110
km)
art
RIO
Emma.,
Useful
A
detailed
sonic
animal
The
• mom
Dolly
data
tqmilian
dam
data
no.
dad,
rowone
or all
dminpiron
dam
dady
Him
gaugmt
0.11)
Gem
daily
el
ihe
Row
Mr
dam
lundbm
u bowmen
Allem,
bat
noys
paramems
ol
the
whowline
or
I uncinam
Allows
INT
•
REAL
c..4
Noma
MN
4 bre
LOGIC
Normal
•
CHAR•n
arc
deGred
array
am
thc re
Ii
INTEGER
REAL
by,.
Ckarany
call
Au
UDGICAL
NMI
k.ntib
CHARACTER
Winer,
HI
blankets
atnammoat
parmarrs
For
IOF
are
comple
rad
ckniem
Kray6
thc dimensions
1E741001
beam
wewld
41 bytes
10 3
meani
lcmg
of Re
ng.
urn,
Dna
of
The DOS Path
The
ISOS filename
separated
is madeup
of Iwo
parts
'I The firm pan should
by a
pan shoal°
and the second
he topic
related
indicate
the file type.
for example
MYDATA
Ilk
II
disk
Floppy
Extension
Each item is separated
ihems by the backslash
the adjacent
CT
CCM puter
Me
Indita
ten
current director\
adaa
les
parent
MC)
"
&oretory
r-
disk
llopp),
from
Special files
The Personal
5"
DAT
C.+IYDATADEMONYDA1A
DAsT
Name
5.25"
A typical DOS path would
consist of one or more directories
and a filename. It may also
have a drive name.
\
e untIlort
-
Si stem
SYS
files
L:15Ern
said
BA
parallel
I
Balch
Tiles
socket
Shandard
25 pm D plug
I female)
S:aiRtud
25 pm D pg
male)
!lard
O pin
I) pliu: Urnial
disk - also known
as • Winchester
\
I -I
I
Has iL IX)S
commands
(dial/nandSkiiaI
TI does
aAtlaHiDA;,
The Penooal
DOA
PioW.W.II, alSA,
114,1(1. - (
Elfe
I id ILIek in a CLIfiton
41) [den
Crrale,
computer
or
a Inc-ton
Ip.R]
•
RI)
',In\
III I
1,1)))
Prn,),Rvecon
acleta
aa
krt.':
n)lii
RA.I
ParacrEP
AAIJUI
I
COP \
[bidpH
P.1))+AMI
[I I,
Renal),
a fir
lie
•
main frame
IORMAI
•
•
•
•
•
CONFIG.SYS
•
•
Directories and
Subdirectories
DDS
C‘
II< I.
ai .1.
I
WPDXPWS
123
\I
\ III
Si \
III
II
I R1=0-I
I i I
I II I
IIR I 11.-ON
I)o no! pIkic 55411,15
'II
N ,ae,li.asi.ssi.sss
•
•
•
•
•
•
•
•
•
•
•
•
•
•
tifI
dais
C3
DisDo
nut
lidnd
Ives
Open
Iii pr,
t=1
Closed
k 'LTk
•
•
•
•
•
•
•
•
•
•
•
•
•
•
•
•
•
•
•
•
•
•
•
•
•
•
•
•
•
•
•
•
•
•
HYDATA
INTRODUCTION
What is HYDATA
HYDATA
?
is a hydrological
database system for personal computers which is used in more
worldwide.
The system is designed to store the types of data most
required in water resources studies, including river, reservoir and lake levels,
than 50 countries
commonly
river flows,
rainfall
data and reservoir and lake storage values. Output is provided in the
form of 'yearbook' style tabulations of data, graphs and powerful data transfer facilities.
HYDATA also includes facilities for developing rating equations relating river levels to flows
and reservoir and lake levels to storage. Options are also provided for routine hydrological
analyses such as the calculation of flow duration curves and low flow statistics.
Several
related software packages are also available from the Institute of Hydrology for more
sophisticated tasks such as flood frequency analyses and rainfall runoff modelling. HYDATA
is operated using on-screen menus which can optionally also be operated using a computer
'mouse'.
Both English and other language versions are available, including a full French
version and partial Spanish and Portugese versions. Other language versions can be supplied
on request.
HYDATA
has been in use for more than 10 years and was developed by the Institute of
Hydrology,
which is the United Kingdom's main research centre for hydrology.
The
Institute provides technical support through newsletters, by organising training courses,
through a permanently staffed helpline and by offering a 'disaster recovery' service to
retrieve accidentally
lost data.
HYDATA
was initially
developed from the Institute
of
mainframe data storage system for UK hydrological data; since then it has been
developed to meet the needs of users world-wide and in particular the needs of users with
only a limited experience of personal computers. HYDATA is constantly under development
Hydrology's
and improved
versions are released every 1-2 years.
HYDATA
INTRODUCTION
What types of data can be stored
?
HYDATA
stores the types of data most common
ly required in water resources stud
ies.
Several categories of data are defined
in HYDATA.
These include storage locations for river
levels, lake levels and reservoir leve
l data, river flow data, reservoir and
lake storage data,
river discharge measurcments and ratin
g curves and rainfall data. A general
storage category
is also defined, suitable for storing
any type of daily or monthly time serie
s data, such as
measurements of water conductivity,
sediment content or *meteorological data
such as wind
speed, evaporation or temperature. Data
can be stored at intervals of up to 100
readings per
day, corresponding to a minimum data
storage interval of about 15 minutes.
This allows
data from automatic data loggers or
chart digitisers to be stored on the syste
m. Within the
system, several facilities are provided
for conversion between data types; for
example, for
conversion between river levels and
flows, or between daily flows and mon
thly flows or
between daily rainfall and monthly rainf
all.
There are few limitations on the amo
unt of data which can be stored.
HYDATA
uses
efficient data compression techniqu
es to ensure that the data occupy
as little space as
possible. Data storage requirements
vary widely from country to country
so it is difficult
to give general guidelines on the stora
ge space required; however, of those
countries using
HYDATA as the national database syste
m, many have found that the entire natio
nal database
can be accommodated in a few meg
abytes of disk space, equivalent to a
few floppy discs.
HYDATA
applications for specific water resource
s projects typically require considera
bly
less storage space.
•
HYDATA
INTRODUCTION
How are data values entered and retrieved
?
HYDATA
•
accepts data from a wide range of sources. Manual observations by observers and
watchmen can be entered directly at the keyboard. In-built quality control routines
check all
values entered against minimum
and maximum
permitted values defined by the user.
records from charts and loggers are usually entered automatically, using either
the
data input facilities built into the package or additional software provided as
part of the
standard package. These facilities can also be used to transfer data automatically
from other
personal computer or mainframe database systems, including the CLICOM database
system
developed by the World Meteorological
Organisation for storing meteorological data.
Repeated operations can be automated using a macro facility available within
HYDATA.
Digitised
Data stored on HYDATA
•
can be retrieved (exported) automatically either from within or
outside the system. Within HYDATA, facilities are provided to export data in yearbook
style
or in a form suitable for input to many other software packages, such as spreadsh
eets and
various other commercially
available database and analysis packages.
From outside
HYDATA,
standard software supplied with the system allows data to be retrieved in a wider
range of formats, including formats compatible with CLICOM and with various
software
packages developed by the Institute of Hydrology, including a flood frequenc
y analysis
package (HYFAP) and a rainfall runoff model (HYRROM).
For users with FORTRAN
programming
skills, a subroutine library of data access routines is also provided to allow data
stored on HYDATA
to be used by their own software.
Using these routines, quite
sophisticated packages can be written; for example, these routines have been used
within the
Institute of Hydrology to write a real time flow forecasting system and a GIS based
rainfall
analysis package.
•
GENERAL PRINCIPLES
HYDATA
How is HYDATA operated ?
•
HYDATA is operated using a series of on-screen menus. A menu is a list of options each
of which causes HYDATA to perform an operation or receive information provided by the
user. Each menu has a unique name and code number. The HYDATA manual gives full
details on the operations which can be performed by every menu. Also, a display chart at
the back of the manual shows all the main menus and how they are related.
The menus have two types of option. The first type causes HYDATA to perform certain
types of operation, such as saving data, displaying a graph or moving to the next menu. The
second type allows data to be entered such as the station identifier or theyears for which data
are required. The usual way of moving between menu options is to use the up and down
arrow keys on the keyboard. Alternatively, the option number may alsobe typed in directly.
Options are selected by pressing the [ENTER] key. There are also several special keyboard
commands defined in HYDATA. These are described in Section 2 of the HYDATA manual
and include:
•
•
•
•
•
[HOME] Move to top of menu
[END]
Move to bottom of menu
[ESC]
Abandon an operation
[PGUP] Move up several lines
[PGDN] Move down several lines
The [DEL] and [BKSP] keys may also be used to edit data that has been wrongly entered.
Three other keys also have special meanings:
•
[Fl]
[F3]
[F4]
•
•
•
•
•
•
•
•
Display help menu
Quit HYDATA
Read data input or macro file
The [Fl] key may be used at any time to display a help message relevant to the type of
operation currently being performed in HYDATA. Shorter messages also appear at the
bottom of the screen describing the type of operation expected or the cause of any errors
which may occur. The HYDATA menus can also be operated using a mouse if this is
available. To use the mouse, the user simply points at the option or data entry box required
and then 'clicks' on the option using the mouse. HYDATA then performs the operation
selected.
HYDATA
GENERAL PRINCIPLES
Keys to avoid when using HYDATA
HYDATA is extremely robust and will rarely cause problems in normal operation.
However, there are two sets of keys which must never be used when operating HYDATA
since using them risks damaging the database or loosing data entirely. Firstly, HYDATA
must never be interrupted by using the [CTRL] [ALT] and [DEL] keys together to reboot
the computer. If HYDATA appears to be taking a long time to perform anoperation, simply
be patient and wait ! Secondly, the on/off power switch must never be used to interrupt
HYDATA for similar reasons. Normally, if HYDATA is interrupted using either of these
methods, it will be necessary to reload the database from the most recent data backup
available - an operation which should be avoided if possible since any dataentered since the
backup was performed will be permanently lost.
• -Lb
HYDATA
GENERAL PRINCIPLES
How does HYDATA store data ?
•
•
•
HYDATA stores data for a location using the concept
of stations. Stationsarc described by
the type of data they hold and their identifier. Iden
tifiers in HYDATA are numerical and
can have numbers up to 8 digits long i.e. in the rang
e 1 to 99,999,999. Once a station has
been set up on HYDATA, data can be entered for any
year defined for that station provided
that storage space has already been allocated for that
year. There are many optional entries
which can be given to describe the characteristics
of a station, including the latitude and
longitude of the station, its altitude, the maximum
and minimum values permitted for the
station and the name of the station. The 'name' entry
can be up to 32 characters long and
appears on all graphical and tabulated output for that
station - this allowscountries which use
alphanumerical station identifiers to link the local statio
n identifiers tothe numbering system
defined on HYDATA.
For a given location, stations are required for each
of the data types recorded at that station.
The main data types are EVENT, GAUGING AND
RATING, DAILY FLOW, DAILY
GENERAL, DAILY RAINFALL, DAILY STORAG
E and MONTHLY. Event stations are
used for any data type with more than 1 reading per
day e.g. river levels, digitised rainfall
records. The DAILY GENERAL category can be
used for any type of data defined by the
user and stored on a daily basis e.g. electrical conductiv
ity, wind speed, sediment load. The
MONTHLY category is used for any type of data
(e.g. flow, rainfall, general) stored on a
monthly interval.
As an example, consider a flow gauging station wher
e river levels are monitored by a chart
recorder and discharge measurements are made using
a cableway. For this site, four stations
with the same identifier could be defined to accept
(1) the river level data (2) the discharge
measurements/rating curves (3) the daily river flow
s calculated from the river levels and
rating curves and (4) the monthly river flows calcu
lated from the daily values.
HYDATA
EDITING DATA
Data editors
Perhaps the simplest and most widely used method to enter
data is by typing values in from
the keyboard. In HYDATA,
this is done from the station editors. Every station defined on
HYDATA
has an editor associated with it and all editors (except for gaugin
g station editors)
are operated using the same general principles.
When an editor is selected, a table appears on the screen giving
the current values stored on
the database for the dates shown. New values are entered
simply by typing in the new
number.
A data flag may be added by typing a comma and the flag numbe
r (1 or 2) after
the value e.g. 12.7,2 assigns flag 2 to the value 12.7. The
flag is assumed to be flag 1 if
no flag is specified. Values can be set missing simply by typing
the letter m. When a new
value is entered, it is plotted on the graph displayed alongside
the data table. If a mouse is
available, the amount of data displayed in this graph can be
changed by 'clicking' on the
control symbols marked beneath the graph. Alternatively, the
POINT command may be used
if no mouse is available (see the HYDATA manual).
The editors have many features to help speed up data entry.
These are described in full in
the HYDATA
manual and can be summarised by pressing the [Fl] key whilst
using the
editors.
Examples include the facility to define blocks of data so that
the same operations
can be performed on all values within the block e.g. set
values to missing, apply a
multiplying factor, change the data flag.
The parameters used in BLOCK operations can
be defined in the editor menu (Menu TS1) which is reached by
pressing the [ESC] key whilst
using the editor. For example, the permitted maximum and
minimum values can be changed
temporarily to allow an unusually large or small data value
to be entered.
•
•
•
•
•
•
•
•
•
Once the data values have been entered, the data values
should then be saved.
Before
saving data, it is a good idea to plot the values first to check
that they are sensible. For
example, typographical errors when entering level or flow
data can often be spotted
immediately from a graph. When plotting edited data, it is
important to note the distinction
between 'file' values and 'edit' values. 'File' values are the
values stored on the hard disc
of the computer while 'edit' values are those which have been
entered using the data editor
but not yet saved. The plot menus in HYDATA contain a
'Plot edits' option which allows
the 'file' and 'edit' values to be compared on the same plot.
The 'edit' values should only
be saved if they seem to be correct.
HYDATA
EVENT
EDITING DATA
data editors
•
For EVENT
data, the station editors include some additional features. The most usual types
of data stored in these editors are observer readings of river levels, digitised chart or logger
records of river levels, or digitised pluviograph or logger records of rainfall.
Up to 100
readings per day can be stored, allowing
for a minimum data storage interval slightly
less
than 15 minutes.
Within
each EVENT
station editor, the times of the readings are given as well as the day.
The default is to give the times at equal intervals; for example, for an EVENT station with
3 reading per day, the default times might be 0800, 1600 and 2400. Note that the installation
program HDBINS includes an option 'Water Day Start time' which defines the way
HYDATA
displays the time for midnight e.g. 0000 or 2400.
can also be defined (as used in some UK studies).
A water day starting at 0900
•
It is important
to note that the times displayed in the editor can be changed and need not be
at equal intervals.
For example, if an observer takes river level readings at times of 0900,
1200 and 1600 each day, these values can be used instead of the defaults suggested by
HYDATA.
To change the values, the TIM command should be used. The only restriction
is that, within each hydrological year, all days have the same set of times. Between years,
the times used and the number of readings per day may be altered. To change the times for
all years for a station, the editor for each year must be entered and the required times set.
This can be tedious so it is usual to automate this process by writing a HYDATA
macro
procedure which will allow the changes to be performed in a single operation (see HYDATA
manual).
HYDATA
EDITING DATA
Data flags
Data flags allow the source of a data value to be stored on the database. Flags can indicate
the method used to make the measurement (e.g. observer, logger), whether the value
is
measured or estimated by modelling, or whether the value is thought to be reliable.
Flags
are a valuable feature of HYDATA and should be used whenever possible.
Within
111
entering
HYDATA,
flags are entered by adding a ,1 or ,2 after the data value. For example,
12.7,2 indicates a value 12.7 with data flag 2. If no flag is entered, the flag is
assumed to be 1. The meaning of the flags is defined by the user within the 'Station details'
mcnu for the station. The default values are 'Original' for flag I and 'Estimate' for
flag 2.
However, for each database, eight possible flags are defined and any two of these
can be
chosen. The choice of flags is defined by using the 'Data sources and flags' option
in the
installation program HDBINS (see Appendix B of the HYDATA
manual). The default set
of flags is Missing, Original, Estimate, Observer, Chart, Logger, Radio, Model. In the
case
of the flag for missing data, the default value is 'm' when typing in data and '-'
on any
•
tabulated printout
of the data. For the 'Original'
flag, the default is to print no flag on data
flag, the default is to print the letter 'e' after each value with this
flag e.g. 12.7e. On graphical output, the flag names will appear in the keys to the lines
and
the lines will be coloured according to the flags used.
tables.
For the 'Estimate'
It is strongly
recommended
that data flags are used for all data values entered onto a
database. This is particularly important when a mixture of observed and estimated
values
is entered; for example, when infilling missing periods in a record. This then
allows
estimated values to be easily identified if the infilling method is later changed. Also,
the
estimated values will be indicated on any printed output giving an indication of the accuracy
•
•
•
•
•
•
•
•
•
•
•
•
•
•
of the modelling
method and the amount of original data available.
•
FP/DATA
EDITINGDATA
•
•
•
•
•
•
•
•
Hints on infilling missing data
River level and flow records often contain many gaps. Gaps can arise for many reasons; for
example, an automatic logger breaking, an observer falling sick, or the recording equipment
being damaged in a flood. It is often desirable to infill missing periods in a record in order
to improve estimates of the long term statistics of the record, such as theannual total flows
or the long term mean annual runoff.
There are many methods which can be used for infilling data. For example, it may be
possible to estimate flows at a station by regression with flows at a nearby upstream or
downstream station. Alternatively, flows can often be estimated from catchment rainfall
records by regression techniques or using a rainfall runoff model. The choice of method is
the responsibility of the hydrologist and requires considerable experience and a knowledge
of the behaviour of the catchment under consideration. However, for short periods of
missing data, HYDATA provides two basic methods for infilling missing values. These are
linear and logarithmic interpolation. Both methods are available within the station editors.
The procedure used to infill a missing period is to first define a block which covers all the
missing values AND the data values immediately before and after the first and last missing
values. The LIN command is then used for linear interpolation and the LOG command for
logarithmic interpolation. The values are then infilled automatically for the whole block.
It is good practice to first set the default data flag to flag 2 in Menu TS1 before doing any
interpolation. The interpolated values will then be indicated on all output. Also, before the
values are saved, they should first be plotted against the observed values using the 'Plot Edit'
option in the plot menu. This will immediately show if the values are reasonable and blend
smoothly with the existing values. If possible, checks should also be made against flow
records for other stations on the same river and against rainfall records for the catchment to
ensure that no flood peaks have been missed when performing the interpolations. Only when
all these checks have been made should the interpolated values be saved on the database.
Normally, interpolation is only suitable for missing periods of a few readings. For longer
periods, regression techniques, rainfall runoff modelling or flow routing models are normally
more appropriate.
• -4
HYDATA
RATING CURVES
Rating curves in HYDATA
Water levels are easy to measure but flows and storages are not. This is
why rating curves
are used to relate observations of levels to the flow/storage values required
for water
resources studies. HYDATA uses the following form for a flow rating
curve:
•
Q=a(hi-cp
•
where Q is flow,
•
h is the watcr level and a, b and c are constants.
to relate volumes to levels:
A similar form is used
V :=a(h+c)b
•
where V is the reservoir
or lake volume.
Some countries may use a different
form of
for man-made sections such as weirs and for level-storage equations.
However, experience shows that the above form often provides just as good
a fit in many
cases. Users with FORTRAN programming skills may also use the HYDATA
FORTRAN
subroutine library to apply any specified rating curve to level data and
then re-load the
resulting flows back onto HYDATA.
equation, particularly
•
For many gauging stations, multi-part ratings are required to represent the
form of the rating
curve over the full flow range. In HYDATA, rating curves can have up
to 6 parts.
Often
it is possible to relate the levels over which the curves apply to levels at which
real changes
ocur in the channel cross section. This is particularly true for man-made
sections and for
level/storage rating curves.
•
HYDATA
provides comprehensive graphical facilities for fitting rating curves (i.e. estimatin
g
the parameters a, b and c). The procedure used is to guess successive values
for c and then
to estimate a and b by a least squares procedure in logarithmic co-ordinates.
The user can
specify maximum and minimum allowed values for each parameter and,
for multi-part
ratings, can specify the range of levels over which each rating applies.
HYDATA
also
provides the option to weight curves towards the high flow measurements.
This is done
•
using the Q*2 option (see HYDATA manual). When fitting multi-part
ratings, HYDATA
checks that the individual curves cross close to the specified upper and lower
limits of each
curve. An error message occurs if this does not happen, in which casethe
rating should be
re-fitted using a slightly different set of control parameters (e.g. upper/lo
wer limits, ranges
for a, b and c). Rating curves may also change over time due, for example
, to changes in
channel cross section following flood events. In HYDATA, each single or
multi-part rating
is identified
•
•
•
•
•
by a code letter e.g. A, B, C. Each code applies over a specified period
e.g.
1978 to 1985. Up to 20 letters can be used at any station to identify shifts
in ratings.
HYDATA
RATING CURVES
Advice on fitting rating curves in HYDATA
NOTE:
Fitting
rating curves is a job only for experienced hydrologists and rating curves
should not be altered without the permission of the System Manager.
•
The normal procedure is to begin by typing in the raw data on which the
curve(s) are to be
based. For flow data, this consists of the date of the measurement, the level
(stage) and the
estimated discharge. If available, the mean velocity and cross-sectional area
should also be
entered; if these are not known, dummy values of 1.0 can be entered.
For level/storage
curves, levels and storages should be entered with values of 1.0 for the 'velocity'
and 'area'
entries.
•
•
•
Once the measurements are on HYDATA, they should be plotted to seeif
they all fall near
the same line. If not, then attempts should be made to see whether the
rating may have
shifted over time. One way to do this is to fit a single rating curve over
all time and then
to see from the gauging editor whether, in certain periods, all measurements
lie above or
below the line. The < < and > > symbols shown in the editor and
printouts help to
identify such periods (see HYDATA manual). Local knowledge of flood events
etc may also
help to identify hydrological reasons for shifts in a curve.
Once the shifts have been identified, the measurements should be grouped
using the letters
A, B, C etc. Single or multi-part rating curves can then be fated to each
group separately.
Data points which seem to lie well away from the lines (outliers) can be
excluded using the
? code in the editor.
Alternatively, particularly valuable high flow measurements can be
included in all groups using the + code in the editor. Also, the Q*2 option
may be used if
required to help force the curves through the high flow measurements.
Great care should
be taken not to extrapolate the curves to unrealistically high or low flows.
An upper limit
of applicability may be imposed if it is not clear how to extrapolate the
curve.
•
•
•
•
•
•
Once a satisfactory
fit has been obtained, the curves can be used to convert levels to flows
(or storage) using the 'Conversion' option in HYDATA.
To do this, it is necessary to first
save the new curves. To make sure poor curves are not saved accident
ally, HYDATA
deliberately makes this a two stage process. The curve must first be
saved in computer
memory from the rating curve editor before it can be plotted on a 'Gauging
Plot' and then
must be saved again from the Menu GDD1 to save it to hard disc. Only
curves saved on
disc are used in conversions. Needless to say, good documentation must
be kept stating the
parameters of the new curves and the reasons why the old curve was changed
. Note that the
converted values may differ slightly from those obtained by hand or from
other systems
since, to obtain the best possible estimates, HYDATA
uses an interpolation procedure to
estimate the variation in flows over each day, and then integrates the resulting
instantaneous
flows to estimate the daily mean flow (see HYDATA manual).
HYDATA
I
SYSTEM MANAGEMENT
I
D
1
D
D
D
i
41
•
to
0
•
•
•
•
•
•
•
•
Advice
on system management
In a busy hydrological
HYDATA
department,
database. Typically,
several people may need access to the department's
this will include data entry assistants and hydrologists
who
require access to the data for modelling and data validat
ion work. In this situation, it is vital
to appoint a System Manager who takes overall respon
sibility for maintaining the system.
The manager should be the only person allowed to create
or delete stations on the database
and should also determine who has access to the databa
se and the schedule for entering
historical and current data onto the database. The manag
er should also be responsible for
ensuring that data backups are performed regularly. To
help the System Manager, HYDATA
has a password protection system to restrict access to the
system. Passwords are set up using
the HDBINS program and have 3 possible levels. At
the lowest level, users can only look
at the data. At the second level, users can also save data
but cannot create or delete stations.
At the highest level, which is normally used only by the
System Manager, the user has access
to all the facilities in HYDATA.
For extra security, the HDBINS program can be kept only
on floppy disc so that only the System Manager can
change the passwords.
The information
stored on a database is only of value if the users of the
database understand
the sources of the data and the quality of the data. For
this reason, it is vital to keep good
notes on how the database has been set up and where
the data have been obtained from.
Typically, the System Manager will keep an up to date
'System summary' printout from the
database and a series of files containing up to date plots
and tables of all values stored on the
database together with notcs describing the rating curves
used to generate these values. The
System Manager should also keep detailed notes on any
checking, editing or infilling of the
data which has been performed, and on the methods used
to develop the rating curves stored
on the system. The original observer, chart or logger
records should also be kept in case it
is necessary to check back against these in the future.
In a well maintained system, it should
be possible at all times to provide up to date and reliabl
e printouts or plots of any of the data
on the system. Typically, a busy hydrological depart
ment will receive a steady stream of
such requests from other ministries, consulting engineers
and development agencies working
in the country. In some cases, large amounts of inform
ation may be required in a short time,
particularly during flood and drought events. These reques
ts will normally be accompanied
by additional questions regarding the sources of the data
and any validation or infilling work
performed to improve the quality of the data. Detaile
d notes are essential in order to meet
these requests satisfactorily.
Se
HYDATA
SYSTEM MANAGEMENT
Advice on creating stations
Stations are created in HYDATA by followin
ga simple set of menu operations starting from
the 'Increase data storage' option. However
, some care is needed so normally stations
should only be created by the person nom
inated as the System Manager. The first
consideration is that the new station will incr
ease the size of the database. The System
Manager should therefore always check that
there is sufficient space on the hard disc of
the
computer to accept the new station. Also
, particularly on old or poorly maintained
computers, there is always a slight risk of a
hardware failure which could corrupt (damage)
the database. The existing database should
therefore always be backed up before creating
space for a new station or stations.
111
•
Another factor to consider is that the database
will operate more efficiently if all the storage
space for the station is allocated in a single
operation. For this reason, space should be
created in a single operation for every curr
ent and anticipated need for that station. For
example, if a station opened in 1950, say, and
is still in operation, spaceshould be allocate
d
from 1950 to several years in the future, even
if only a few years of data are to be entered
initially. The numbering system used shou
ld also be consistent with the numbers used
for
the stations already stored on the database.
When a station is created, some descriptive
information can also be entered for that stati
on,
such as its latitude and longitude or its altit
ude. These entries are optional and can be
entered or changed later at any time from
the station editor. Normally, though, it
is
advisable to enter at least the correct station
name and quality control limits (max/min/m
ax
change) when the station is created. For EVE
NT stations, it is also advisable to define the
numbers of the corresponding rating equation
and flow/storage stations at the outset to avoi
d
mistakes being made later when the data are
converted. The default is to use the same
station number for the rating and flow/storage
stations. Also, the data format entry should
be correct, since this will determine the deci
mal place accuracy and data flag system for
all
data subsequently entered for that station (see
HYDATA manual for details).
•
•
•
•
SYSTEM MANAGEMENT
HYDATA
Data backups
Although
modem
personal
computers
are mostly
very reliable, failures do occur
under hot, dusty or humid conditions, or when the electrical power
supply is unreliable. Computers may also be stolen, vandalised or damage
d in disasters such
as floods, fire or earthquakes. For these reasons, it is ESSENTIAL to make regular
backups
of your database and all other essential data files on your departm
ent's computers.
Remember - the floppy discs used for backups only cost a small amount
but the time and
effort spent entering and validating data is irreplacable.
occasionally,
particularly
•
The following
•
system is recommended and is used by several countries. Under this system,
two sets of backup floppy discs are used and backups are made every week
on the same day.
The sets of discs are used alternately. This way there are always two recent
backups, with
the most recent backup made within the past week. Every 1 to 2 months,
one of the sets is
taken out of use and replaced by a new set of blank discs. The set taken out
of use is stored
with the other older sets which are no longer used, preferably in a different
building to the
computer containing the HYDATA database.
In addition to floppy discs, some users also maintain a recent copy of their
main HYDATA
database on a separate computer. Users with tape backup facilities may
also make regular
backups of the whole hard disc onto tape. Also, for a small annual fee, HYDATA
users can
make use of the 'Disaster Recovery Service' operated by the Institute of Hydrolog
y.
Under
this system, backup discs are sent periodically to the UK for safe storage.
Before storage,
the integrity of each database is checked. The data then remains strictly
confidential to the
user and is not accessed without a specific request from the user.
•
As a final point,
HYDATA
it may be of interest to know some of the most common reasons for
files and other data files being lost.
In our experience, these are:
•
Data losses caused by computer viruses
Computcr hard disc failures
Hardware failures due to fluctuating
•
•
•
•
•
•
•
electrical supplies
HYDATA
SYSTEM MANAGEMENT
Advice on starting a new database
A user can create as many HYDATA
databases as required on a single machine.
For
example, a single computer might contain the
national flow database, a smaller personal
database for analysis work and a third database
for rainfall data. Of course, great care must
be taken to keep the databases separate. It is often
helpful to set up several DOS batch files
containing the commands required to access each
database.
Each HYDATA
database
u be
n 'n
in a
te ir
. A database consists of
files with the name HDB**, where ** is a numb
er in the range 01 to II, a file called
HDBIN and two index files called INDEX I and
INDEX2.
In a new, empty database the
HDB** files all ocupy 128 bytes of disk space.
As stations are created, these files gradually
fill up, and may reach several Mb in size on
a large database. Since all databases use the
same 14 filenames, great care must be taken
not to over-write one database with another.
Each new empty database is generated from
the HYDATA
installation discs using the
HYINA program. Before setting up a new datab
ase, enough free space must be made on the
hard disc to accept the new data.
II
•
Once the database has been created, it can be
customised as required using the HDBINS
program from within the directory containing
the database e.g. passwords, titles on output.
This will then modify the HDBIN file. If you
already have a HDBIN file set up on another
database, you could instead copy this to the new
directory to get an identical configuration
to the existing database (although note that you
CANNOT copy individual INDEX or HDB**
files; these must always be kept together for a
given database). Whichever method is used,
the hydrological year MUST be defined corre
ctly using HDBINS since this cannot be
changed after starting to create space for statio
ns on the database.
In summary then, there are only a few serious
mistakes which can be made when starting a
new database. As described above, these are:
(a) Accidentally
over-writing
an existing database
•
•
Not allowing enough disk space for the new datab
ase
•
•
Forgetting
database
to define the hydrological
year before starting to add space for stations to
the
•
(d) Accidentally
using the wrong database when loading data
With care, all these mistakes can be avoided.
•
•
•
•
HYDATA
DATA ANALYSIS
Data analysis routines in HYDATA
Com ad on I t
The comparison plot option allows the hydrogr
aphs or time series for 2 daily stations to be
plotted on the same graph. This is useful
for comparing records at nearby stations, data
validation work and modelling work. Typical
uses might be to estimate the lag time between
two locations on the same river or to compare
rainfall records and runoff response. This
option is also useful for plotting more than I
year of daily data for a single station. Options
provided by HYDATA include the facility
to plot the records as histograms, to invert
one
of the series on the plots, to lag one series
with respect to the other and to plot the data
in
logarithmic coordinates. The two y-axes may
also be scaled independently, allowing the two
lines to be separated vertically.
D u le m s
•
41
•
•
I ts
Double mass plots compare the daily records
for 2 stations on a cumulative basis. Typical
uses might be to examine the correlations betw
een stations or to check for data errors. For
2 identical records, the double mass plot will
be a perfect straight line. More generally,
if
the stations are close to one another and expe
rience similar hydrological regimes, then the
double mass plot will be close to a straight
line, but with a slope greater than or less than
1. This might be the case for rainfall records
for the same catchment, or flow records for
nearby stations on the same river. Sudden
changes in slope ('breake) indicate a possible
problem with the data. For example, when
considering 2 nearby raingauges, the break
may
correspond to one of the raingauges being
moved or the exposure of one of the gaug
es
changing. For flow stations, abstractions or
inflows between stations are possible causes
of
changes in slope. More generally, brea
ks may be caused by a change in observer
,
measurement units or recording equipment.
Flow du ti n curve
Flow duration curves show the percentage
of time that a given flow is exceeded. For
example, the Q95 flow is normally the daily
flow exceeded 95% of the time and is a usef
ul
measure of low flow reliability. Flow dura
tion statistics also give a guide to catchme
nt
response and can be useful in validating the
output from hydrological models. HYDATA
provides options to specify the flow averagin
g period used in calculating a flow duration
curve. The minimum period is daily, called
the 1-DAY flow. Other periods (e.g. 5-DAY)
can also be used. Up to five curves can be
plotted on a single graph. For comparing
the
curves from different stations, the values
may be divided (standardised) by either
the
average daily flow (ADF) or the flow per unit
catchment area. The curves may be for the
whole year or just for specified seasons. Plot
s may be on linear or logarithmic axes.
•
HYDATA
DATA ANALYSIS
Low flow analysis routines in HYDATA - 1
HYDATA
provides a range of routines which can be used to
characterise the low flow
behaviour of a catchment. The methods are based on
those developed from a major research
study on the low flow response of catchments in the
UK (NERC Low Flow Studies Report,
1980). These methods have since been applied widely
throughout the world.
B se Fl w index
•
•
The Base Flow Index option allows the base flow
component to be estimated for a given
hydrograph.
The BFI is a measure of the contribution to the total
flow from groundwater
sources. It also provides a useful indicator of catchm
ent response. HYDATA estimates the
BFI using an algorithm set out in the "Low Flow
Studies report" and summarised in the
HYDATA
manual. The calculations are based on daily flows,
and attempt to identify the
turning points in a hydrograph automatically so
that the baseflow separation may be
performed.
The results of this separation can be plotted and tabula
ted as required.
arithmic
I t
•
•
This option allows the daily flows for a station to be
plotted in logarithmic coordinates. This
is useful for examining the low flow part of a hydro
graph. In particular, during recession
periods, the flow may decreBse in an approximate
ly exponential manner. The recession
constant can then be estimated from the average of the
slopes over several typical recessions.
This is useful for developing models of recession behav
iour; for example for infilling missing
flow data or predicting future flows during a period
of drought. The recession constant is
also another useful indicator of catchment response.
Recession plots
•
The 'Recession Plot' option provides a more object
ive, although less widely used, method
for estimating the recession constant. The basis of
the method is to plot the daily flows for
each day against the daily flows for the day N days
before, where N is specified by the user.
During recession periods, the resulting lines will
all tend to be bounded by a single
'envelope' curve, whose slope can be related theore
tically to the recession constant. Under
UK conditions, it was found that, for many catchm
ents, the best estimate of the recession
constant was given by the slope of the envelope curve
at a flow equal to 0.25 of the average
daily flow (ADF).
•
HYDATA
DATA ANALYSIS
Low flow analysis routines in fiYD
ATA - 2
Low fl w fr
en
lo s
This option extracts the minimum
flow in each year in a record and
plots the values on a
single graph with the exceedance
probability on the x-axis. The flow
s may be the minimum
daily values or may be averaged
over longer periods e.g. 5-DAY
average flows. To allow
the flows to be related to return peri
ods, the values are plotted using
the Gringorten plotting
position assuming a Weibull distr
ibution.
For many catchments, the annual
minima plot
close to straight line when plotted
on this basis, although this is not
assumed in the analysis.
Low flow frequency plots provide
an alternative to flow duration plots
for estimating flow
reliability,
and are particularly useful for desc
ribing rare events with return peri
ods of 10
years or more.
Within HYDATA,
several options are provided to cust
omise the output.
For example, the number of miss
ing days allowed per year can be defin
ed and the results can
be divided by the average daily
flow (ADF) or mean annual mini
mum (MAM).
Both
graphical and tabulated output is
provided.
1)
HYDATA
DATATRANSFER
•
•
Input of data to HYDATA
The simplest way to enter data into HYDATA is using the keyboard. This is the best way
to enter handwritten or typewritten data, such as observer records or yearbook data.
However, if the data are already on computer disc, it should almost certainly be possible to
transfer the values into HYDATA
automatically without re-typing
the numbers.
•
Several possible methods are provided in the HYDATA system for automatic input of data,
provided that the data are in normal text (i.e. ASCII) data files. The simplest method is
designed for when the data values appear in the file as one value per line, and the period of
•
111
data is the same or less than that covered by the station editor (e.g. 1 year for daily flow
data). This type of file can be entered simply by pressing the [F4] key and specifying the
name of the file whilst in the appropriate station editor. The values will then be loaded into
the editor one per line and can be saved to the database after checking that the correct values
are present using plots or printouts of the data. Some tips for using this method are that,
before pressing the [F4] key, the cursor must be on the date/time corresponding to the first
data value in the file. Also, before pressing the [F4] key, the S key can be pressed to 'lock'
the screen temporarily.
On slow computers, this will greatly speed up the data entry. Once
the file has been read, the screen can then be 'unlocked'
by pressing the S key again.
The [F4]
method of data input can also be used in conjunction with HYDATA
macro
commands.
This allows several files with one value per line to be entered in a single
operation.
The method used here is to add the appropriate HYDATA macro commands
needed to 'chain' the files to the start and end of the data in each file. The final lines in each
file should be the macro commands which call the name of the next file. Alternatively,
the
data and macros for all years may be merged into a single large file.
The most sophisticated method of data entry is to use the HYTRAN program. This allows
for a wide range of file formats, and allows many years of data to be entered in a single
operation.
HYTRAN is also be used in conjunction with several other software packages
from the Institute of Hydrology,
allowing data from telemetry,
packages to be entered onto HYDATA
•
•
•
•
•
•
•
•
•
•
logger and other database
•Dt-
•
_Co
HYDATA
Data input
DATA TRANSFER
using HYTRAN
The program HYTRAN
allows many years of data to be entered into HYDATA in a single
operation.
Full instructions for using HYTRAN are given in the HYTRAN manual and a
simple example of using HYTRAN is given in the tutorial notes.
The only main restrictions when using HYTRAN are that the data values must be contained
in a normal text (i.e. ASCII) data file and must be organised into blocks of throughout the
file. There are also limits on the maximum width of each line and the total number of lines
in the file (see the HYTRAN manual). The basic principles when using HYTRAN are to
•
define the structure of the file (i.e. the blocks), the dates of the values, the type of data and
the HYDATA
station in which the data are to be loaded. There are many ways in which the
file structure can be defined and full details are given in the HYTRAN manual.
•
After defining the file structure, the file is then scanned to check that the values are assigned
the correct dates and fall within the limits defined for the HYDATA station. If the scan is
successful, the values can then be loaded onto HYDATA.
During the loading operation, the
same general guidelines apply as when saving data from within HYDATA i.e. never interrupt
the transfer using the [CTRL] [ALT] and [DEL] keys together or the power switch as this
may corrupt (i.e damage) the database. Also, it is good practice to make a backup of the
•
•
database onto floppy disc before using HYTRAN.
Once a file's structure has been defined successfully, the HYTRAN
into a format file for use with other files with the same format.
Also, a batch facility is
available for loading many files of the same format in a single operation. This is useful, for
example, when transferring data from another database system to HYDATA.
•
•
•
•
•
•
•
•
•
•
•
•
commands can be saved
A,
HYDATA
DATA TRANSFER
Exporting data from HYDATA
HYDATA
has comprehensive facilities for obtaining plots and printouts of data. However,
it is often useful to obtain copies of the data on computer disc for transfer to other
database
systems or analysis packages. The standard HYDATA package includes several
methods for
exporting data to disc.
The simplest
method is to use the 'Write
File'
option
available for every
station
in
This produces a file containing all the data values for the editor being used (e.g.
I year of daily data for a daily flow editor). Values are written one per line with
the data
flag following the data value. This form of output is simple to obtain and
can be read
HYDATA.
directly
•
into many commercial spreadsheet and statistical packages for further analysis.
An
alternative method is to 'Print' the data but to type the letter F when prompted
to press the
[ENTER] key. HYDATA
then prompts for a file name and the output which would have
been directed to the printer is written to the file instead. This facility s useful,
for example,
if a user wishes to make changes to the standard HYDATA yearbook style
printouts, or
simply requires the data values in a file in yearbook style for further analysis.
Note that,
when using this option, several printer control codes will appear in the file.
These can be
edited out using a screen editor if required. Also„ the file can be printed out at
a later date
using the REPRINT program supplies with HYDATA.
A second method of obtaining data on disc is to use the utility program HYDOUT
with HYDATA.
This allows data to be obtained in a wide range of formats and
•
supplied
for several
years, or several stations, at a time. Examples of the types of output are annual
maximum
flows, daily flows and monthly flows. HYDOUT is menu operated and is supplied
with a
comprehensive user manual. This method is widely used by many users.
•
For users with FORTRAN
programming
skills, the final and most flexible method to read
data from HYDATA is to use the library of FORTRAN sub-routines (HYLIB)
supplied with
HYDATA.
The data can then be accessed from within the users own programs and used or
written out as required.
Sophisticated packages can be produced using this method; for
example, within the Institute of Hydrology, these routines have been usedin conjuncti
on
a GIS rainfall analysis package and a real time flow forecasting package.
As a final point,
•
•
•
•
•
•
with
several other software packages produced by the Institute of Hydrology
include facilities for accessing data from HYDATA.
These include the program HYCOM
for accessing data in a form suitable for input to the WMO's meteorological database
system
CLICOM,
and the package HYRROM, which is a rainfall runoff modelling system for
personal computers.
DATA
Personal Computers
Prior to the early 1980's the term personal computer did not exist, although
it is true that there
were a variety of microcomputers available, including the Apple and Commo
dore range of desk
top micros. In 1980 IBM launched its Intel 8088 based microcomputer
and marketed it as a
Personal Computer, thus coining the term PC. During the 80's Intel develop
ed further the CPU.
The 8086 was not far behind the 8088, then came the 80286. By this
time IBM had lost its
monopoly and hundreds of new companies were set up, producing PC
clones. Companies like
Compaq, Dell, NEC, and Bull are now as well established as IBM in the
PC market place
•
•
(
•
With the increase in consumer choice, came massive reductions in the price.
Consequently, the
PC really did become an affordable tool for the individual. The leading
processor in the Intel
range is now the 80486 with the Pentium (often referred to as the 80586)
close on its heels. With
each improvement in the processor, Intel increased its capability and perform
ance, enabling it to
carry out tasks that were traditionally done by much bigger mainframes
or minis. Not only did
the processors improve, the memory expanded also, the original PC had
only 64K of ram. Now
it is not uncommon to find '486' machines with 16M or more, although
the most common
memory size seems to be 4M on most 386 and 486 PCs.
•
(
•
•
•
•
•
•
•
•
•
•
Most PCs have three distinct components, the CPU, the monitor and the
keyboard. The desktop
CPU is probably the most common. However, over the past four or five
years users have tried
to reclaim their desks, consequently tower and mini towers are now
becoming very popular.
Also, advances in technology have led to the down sizing of the major
components enabling
manufacturers to produce smaller and more portable 'notebook' and even
'palm-top' PCs..
DATA
At your command
The processor is the hardware brain of the system, but until the user tells it do
something it will
just sit there. On all computers the user communicates with the CPU via a program
.
A program
is a series of commands that the CPU understands. Each command doesver
y little, however
when they are executed according to the program order, the processor canbe
made to perform.
The language of this program is call machine code. Machine code is both hard
and slow to write.
It is, however fast to run. To make life easier for the user, a special program
(or series of
programs)
were developed and became the operating system. Using this system, program
s
written in more structured languages such as BASIC, FORTRAN
(
operating system used on the IBM range of PCs and its clones is Microsofts DOS
(Disk Operating
System).
Like the processor it too has developed, the most recent version of MSDOS
version 6.2.
being
The operating systems primary function is to allow the user to use the
CPU
constructively.
•
and C could be executed. The
Commands are issued to a command interpreter, this is also a program, without
which the PC will not work. The command interpreter on the PC is COMMAND.COM
be found on all startup disks.
and can
The interpreter receives its commands from the user via the
keyboard. As each command received it is interpreted and acted upon.
If the command is a valid
internal DOS function the command is executed. External dos commands are
really just programs
and are loaded and executed by the interpreter. The DOS manual indicates those
commands that
are internal and those that are external. The following commands are internal
commands: DIR,
MKDIR
(MD),
CHDER (CD),
external commands are: FORMAT,
RMDIR
(RD),
DEL,
FDISK, CHLDSK,
ERASE
EDLIN,
See the MSDOS reference guide for a full list and description
•
•
•
•
•
•
•
•
•
and COPY.
LABEL,
KEYB
Examples of
and MODE.
each command and what it does.
-5
ATA
Files and File names
There are two types of file found on PCs, programs and data, they
are store together on either
floppy or hard disks. Each program or data file must have a unique
name. These names are
made-up of two parts, the filename and the extension separated by a
dot (.). The filename should
ideally be subject related and the extension should be type specific
. For example, executable
program files will have an extension of either COM or EXE,
SYSTEM files will have the
extension SYS, and batch files will have the extension BAT. What
remains, by definition, must
be a data file (BAT are really data files COMMAND.COM).
Data file can have many different
extensions or even none, though the latter is not advised. Typical
ly the extension: WP5
(wordperfect),
DAT or DTA for numeric data, FOR, PAS, BAS, C and ASM
for program
source code which are just data files for programs known as compile
rs .
The filename part of the name can contain up-to eight characters and
the extension can have up-to
three characters. Both the filename part and the extension can
include any alpha-numeric
character on the keyboard. Although others characters can be used,
it is best to avoid them,
especially punctuation characters. Some commonly used non alpha
numeric characters are the
_ , - , , ( , and the &. The * , ? and should be not be used in the
file name. The * and ? are
used by DOS as wild card search characters in commands like DM,
COPY and RENAME.
•
Two special files which are used to set-up the computer when it starts-u
p are CONFIG.SYS
AUTOEXEC.BAT.
IIIMEM.SYS
•
CONFIG.SYS
and EMM386.EXE.
and variables (see PATH later).
and
is used to load special device drivers such as ANS1.SYS,
AUTOEXEC.BAT
is used to set-up environment programs
-4
DATA
Directories
and Subdirectories
To help the user organise the files on the disks, the operating
system allows the disk to be
arranged
into a DIRECTORY.
This directory
can then be subdivided
into
SUBDIRECTORIES.
The directory structure can be look on as an inverted tree, with
its
branches spreading out downwards. Keeping to this analogy,
the top most directory is known
as the ROOT directory. If your computer was started from its
internal hardisk then the prompt
that you would see would be the name of the root directory that
contained COMMAND.COM
and should be C:\.
Subdirectories
:
DOCUMENTS,
can be used to keep similar files, such as .WP5 files in a subdire
ctory
or all DOS related files in a subdirectory called DOS.
called
Packages will create their
own directory structure when they are installed, consequently a hard
disk might have subdirectory
names such as 123, WINDOWS, QUATFRO, and NORTON.
Each of thesesubdirectories may
have additional subdirectories below them.
•
The contents of a given directory can be viewed by using the interna
l DOS command DIR. DIR
has two useful options, DIR AV and /P. The /W option or switch
is used to display the file names
in rows. The /P switch tells the DIR command to pause after
a screenful has been displayed.
More recent versions of DOS allow the user to sort the files
in a variety of different orders,
including date and time.
•
•
•
•
•
•
•
•
•
•
•
•
•
•
•
•
•
•
•
•
•
•
•
•
•
•
•
•
•
•
•
DATA
The DOS Path
In order to find these files it is necessary to know
their address. This address is known as their
PATII.
For example, there is a file called MYDATA.DAT
in the subdirectory DATA on the
hard disk known as D:. The path of this file is
DADATA \MYDATA.DAT.
If the subdirectory
DATA contained another subdirectory called MYD
ATA and the file was in there, its path would
be DADATA \MYDATAWYDATA.DAT
. Each subdirectory is separated from the one
above
by a ‘, and this is one reason why you can not
use the \ in the file name
To move from one subdirectory to anothcr the intern
al DOS command CD is used.. For example
if the current directory is the root direct
ory of D: then, to get to the subdirecto
ry
DADATMMYDATA,
the command CD \DATA \MYDATA
[rtn] would be issued. In order to
move up the tree to DATA, CD \DATA comm
and can be issued. However DOS provides a
shortcut. Each subdirectory has a parent directory,
the parent of DATA is D: and the parent of
MYDATA
is DATA. The parent directory is listed in a
DIR of the disk as .. , therefore by
issuing the command CD .. the parent directory
becomes the current directory
.
The word PATH is also used to describe the
search path that DOS usesto look for programs.
The search path is set up by the user in a
special file called AUTOEXEC.BAT.
The line
PATH=CADOS;C:\WP5;C:\123
tells the command interpreter to search each of paths
separated
by the ; for the request program before failing.
•
•
•
DATA
Disks and Disk drives
At the heart of the file system is the hardware and media that allow the data and program code
stored in the files to be maintained safe. The floppy disk is the most common storage medium that
the user will have actual contact with. Few will encounter a hard disk directly. Many megabytes
of data are stored on floppies, often in a very haphazard way. Most people tend to take the
continued
infallible,
•
integrety of the data on those disks for granted.
they can be all to easily damaged.
However, floppy disks are not
Disks are vulnarable to high temperatures and
humidity, which can cause media damage. Another cause of data loss from floppies arises from
data corruption.
Currupted data is most often caused by inadvertent exposure to magnetic fluxes.
The user of floppy disks must remember that many pieces of equipment have strong magnetics
(
associated with their use. The most obvious are monitors and loud speakers. Less obvious
sources of magnetic fluxes are power cables, the more convoluted they are the greater the flux.
•
If a large number of floppy disks are used to store data for long periods of time, then these disks
•
should be stored in a dry cool place well away from adverse magnetic fluxes; in properly design
disk boxes; more than one copy should be made with both copies be stored in different locations.
In addition to the above those users who use large hard disks have to deal with disk management
problems.
In the days of room sized mainframes there would be a large team of computer
operators to backup the disks, sort out file structures and maintain the software.
Now the PC
users must do all that themselves. Again in all probability, these tasks are all to often neglected.
The PCs of today have the computing power and data storage facillities of the mainframes of the
70's, which
•
would be unavailable to users for up to half a day a week for disk and file
maintenance, PC users should allow the same period for their maintenance. Time spent thus could
save many hours of work from being lost through disk crashes. Most disk crashes are preceded
by tell-tale
signs: slow data access, the odd corrupted character, they are not all typographic
errors and intermitant read and write errors.
•
•
•
•
•
•
•
•
YDATA
Usin
Disk.s
Floppy disks come in two forms, the 5.25" and the 3.5". Both types have two
sizes, 360K and
I .2M for the 5.25", and 720K and I .44M for the 3.5" disks. Many readand
write errors from
floppies are caused by the disk not being inserted properly. Always make sure
the disk is fully in
and the door shut and always wait for the drive active light to go out before
you open the drive
•
and extract the disk. Never remove the disk while it is being written to or read
from. Though the
disk read/write heads are not touching the disk, they are extremely close, less
than the thickness
of a human hair
•
When using hard disks, especially those that are cached (buffered) the user
must wait until the
drive becomes inactive before power down. This may not be immediate, so a
few seconds should
be allowed.
If a power down occurs while processing an application, then there is a strong
likelihood that data could be lost. Many applications use temporary files, if there
is a power loss
in mid-use then these become unassociated, DOS knows very little about them,
they have no name
and no owner.
•
All it does know is that there is data present. These files are totaly hidden
and
known as LOST CLUSTERS.
Each cluster typically takes up a minimum of 2048 bytes of disk
space. They are invisable to the user unless the progrm CHKDSK
is used. CHKDSK
can also
be used to recover these lost files. Another less common result from prematu
re power down is
CROSS
LINKED
FILES,
this is where two files share the same cluster on a disk.
potentially the more serious, as one of the files will lose data. Again CHKDSK
find and recover the one intact file. CHKDSK
This is
can be used to
is not the only program that can be used for disk
repair. There are a number of packages available for total disk maintenance,
such as NORTON
utilities
•
•
•
•
•
•
•
•
•
•
•
ATA
The bits on the back
The back of the PC can often be a nightmare of cables. Aside from the power,
keyboard and
monitor cable, there maybe cables to printers, a mouse, plotters and modem links.
The 'sockets'
for these cables come in many forms, they arc though easily identified.
The printer port will be
a 25 pin D-socket (female) or a centronics edge. The serial mouse and plotter ports
are serial
devices and use either a 9 pin or 25 pin D-plug (male). The monitor socket has more
pins than
the serial 9 pin.
Serial cable come in two forms. One form is used as an extension and the other can
be used on
its own. The latter differs from the former in that pin 2 goes to pin 3 and vice
versa. The parallel
printer cable usually has a centronics socket on one end, the printer will have the oposite
gender.
Many communication
problems come from poor wiring due to lack of maintenance and abuse.
Pulling a cable out by the flex will ultimately lead to broken wires.
A few seconds extra spent
unplugging properly can save hours of work and fewer burnt fingers (from the soldering
iron).
DATA
Security
11
As mentioned earlier, the backup duties and general file maintenance were performed by system
operators
on the mainframes.
Now these tasks are down to the individual user of the PC
Regular backups of the data should be made
These should be done on a weekly basis using
either the DOS backup system or for HYDATA's datasets, the HYDATA
backup system (see the
System Managment Options) .
•
•
Mother aspect of machine security is anti-virus protection.
•
In an ideal world, this should not be
necessary, however, because of a variety of reasons from pure malice to practicle jokes there are
now many thousands of computer viruses lurking on disks all over the world. These viruses are
(
just waiting for the unsuspecting to inadvertently load them on to their machines, where they
wreak havoc. The appearance of such entities has spurned a whole new family of software call
anti-virus software.
hours of work.
•
•
•
•
•
•
41
•
A few hundred dollars spent on a good AV package WILL save many many
DATA
HYDATA
The HYDATA
installation program HYINA
creates on the PCs hard disk a directory structure
that spreads out from a subdirectory called HYDATA.
The subdirectories are:
PROGS,
DEMO, and DATA. The PROGS subdirectory contains all the HYDATA run time programs
and support files,
the
DEMO subdirectory contains all the data files for the demonstration
dataset, and the
DATA subdirectory contains an empty but initiallized database for future use.
To run HYINA
the user should make drive A the current drive by typing A: [tin].
•
At the A:
prompt the user must type
HY1NA. The initial screen display is the HYINA imenu. This menu
should be read carefuly.
Option 2 installs HYDATA, option 3 installs a new empty database,
option 4 will upgrade an existing HYDATA 3.01 database and option 5 installs the
demonstration
database. Select
option 2 and follow the instructions, reading each subsequent
Full details of
HYINA are given in the HYDATA user guide. NB. Do not
menu carefully.
change any of the default values if you want the structure describe in the previous paragraph.
•
In the
PROGS subdirectory, there is a file call CGI.CFG. This file tells HYDATA
up for graphics, it contains information about the PCs graphics capabilities.
how to set
Only the drivers
selected during the installation process will be present on the hard dsik. The others can be found
on the distribution disks Graphicsl through to 4.
to the
If they are required they can simply be copied
FROGS subdirectory.
•
Another important control file is
it.
HDBIN, this tells HYDATA about the database associated with
HDBIN can be found in each of the DEMO and DATA subdirectories. The parameters
that
are contained in this file can be changed using the program
•
24 main options.
Each of these options are describerd
HDBINS.EXE. This program has
in detail in the HYDATA user guide.
Many database features are set using this program and care should be taken when using it.
•
•
•
•
•
•
•
•
415
YDATA
h
'n
1
HYDATA
Insufficient
disk space: HYDATA
requires in excessof 7 megabyes of free disk spac
e to install
HYDATA
•
will require additional space as the database
increases in size To rcover more disk
space, check for LOST CLUSTERS and
temporary files. Try removing old unused
files
and packages.
Insufficient memory:
•
•
•
HYDATA
requires about 490 Kbytes of conventional ram.
It does not
use extended or expanded memory. If DOS
5 or above is the current operating system
then
extra conventional memory can be recovered
by putting TSR's and drivers in high mem
ory
(memory above 640K).
HYDATA
loads OK but does not display graphs or the
editor:
program DRIVERS is run prior to running HYD
ATA.
there is insuficient memory to load the transient
drivers.
,111
•
HYDATA requires that the
Either the program has not been run or
Exit IIYDATA
and if necessary run
DRIVERS,
or free more conventional memory (see abov
e), also prior to running DRIVERS,
ensure that the environment variable
CGIPATH
is set in AUTOEXEC.BAT
(See
installation guide). If neither of the previous
solutions work then try changing the scree
n
driver. More drivers can be found on the
distribution disks. (See notes on CGI.CFG))
•
HYDATA
fails to load and returns a protection error
:
HYDATA is a copy protected
package. The protection system has to be trans
fered from the installation floppy disk to the
hard
disk. Only one copy per licence (except for
site licences) is allowed per installlation. Run
the
transfer program on the distribution disk
labelled PROGRAM 3. (See additional note
s on
copy protection).
•
Parts of HYDATA
•
•
•
•
•
programs.
do not work or cause the program to crash
:
HYDATA is a collection of
The programs are loaded when required by
a shell program. HYDATA needs to
know where all its component programs are.
This information is contained in the HDBIN
file for
each dataset. Check to see if the program
nanes are set correctly in HDBIN.
(Use the
HDBINS program).
Cont....
•- 5
ATA
noting can
Make sure that the program resource directory is set for
the directory that contains the
programs. Ensure that the environment variable PATH in
AUTOEXEC.BAT
is set (See
installation guide).
General
(
Accessing the hard disks is slow or with many read/write
errors: This is a clear indication
that the hard disk needsto be checked. There may be LOST
CLUSTERs and fragmented files
which need to be fixed There may also be bad media which would
need to be flagged to prevent
future use. To recover LOST CLUSTERS run the DOS
program CHKDSK /F. If the
access remains slow then use a disk maintenance tool and defrag
program such as the one.
supplied with DOS 6 or Norton Utilities.
DATA
--"N-6
I
FG
II
HYDATA Versions 3.10 and 3.10A
MANUAL CONFIGURATION
FOR GRAPHICS SETUP
The graphics drivers used by HYDATA
•
I
are usually installed and set up automatically
through the
HYDATA installation program (HYENA)
HYDATA will not work properly if incorrect
printer
(or plotter), screen and mouse drivers are selec
ted. If any of the graphics devices are changed
the
HYDATA configuation can be altered by runni
ng HYINA again. The graphics configuration
can
be set up manually if necessary and the meth
od is described below.
The configuration
information
CGI.CFG in the HYDATA
•
•
•
•
•
•
•
•
•
for HYDATA
graphics drivers is contained in a file name
d
program directory. This file describes the name
and location of the
graphics drivers riiiequired by HYDATA. MI
of the graphics drivers called by CGI.CFG must
also
be present in the HYDATA program directory.
Two examples of the CGI.CFG file are given
below. The required drivers should be subs
tituted for those given in the examples. The
lines
beginning with semi-colons are remarks and can
be omitted. For the purpose of the examples
the
HYDATA program files are assumed to in a
directory \HYDATMPROGS
on disk drive C. The
correct drive and path should be substituted.
• _Ló
YDATA
.
Q_Example I
;CGI.CFGconfiguredfor a VGA monitortype,Microsoft
;compatiblemouseand a HewlettPackardplotter
;Drivers
driver = CAHYDATATROGS\HPPLOT.SYS
/G:OUTDEV
driver = CAHYDATA\PROGSUBMVGAI2.SYS
/G:CRT
driver = C:\HYDATA\PROGS\MSMOUSE.SY/G1PO
S
INT
,
driver = CAHYDATA\PROGS\GSSCGI.SYS
/t
•
display= IBMVGAI2
mouse = MSMOUSE
•
plotter = HPPLOT
,Plotter settings
•
FLAGGING= XONXOFF
LOGICALBUF= 128
HP TYPE = 7475,A,6,N,N
COM1 = 96,E,7,I
•
•
HPLOT = COMI
;Fonts
•
•
fonts = dl\HYDATA\PROGS\
;End of example
•
•
•
•
•
•
YDATA
CCI.CFC Exam le 2
;CGI.CFG configured for an IBM PS2 with VGA monitor, HP laser printer and an IBM
PS2
mouse
; Declare GSS*CGI drivers to be loaded
•
•
(
driver = CAHYDATA\PROGSUBMVGA12.SYS
/G:CRT
driver = CAHYDATATROGSTS2MOUSESYS
/G:INPUT
driver = CAHYDATA\PROGS\LASERJET.SYS
/G:OUTPUT
driver = C:\HYDATA\PROGS\GSSCGISYS
;
Declare environmental defaults
•
display = IBMVGA12
printer = LASERJET
mouse = PS2MOUSE
•
;End of example
•
•
•
•
•
•
•
•
•
•
•
/t
Hyute
drologyof
CO)Instit
Maclean
Building
Crowmarsh
Gifford
Wallingford
HYDROLOGICAL
SOFTWARE
COPY PROTECTION
Oxfordshire
OXIO 8138
rIblephone
(0491) 838800
racsimile
(0491) 832256
Mier
849365 HYDROL G
NOTES
Software from the Institute of Hydrology is
protected from illegal copying to safeguard your
rights
as a user The installation procedure should be
described in your user manual. If the copy prote
ction
system fails to work properly, please study
these notes carefully. Some of our software
insta
llation
routines automatically try to perform the trans
fer of the copy protection system but it is
alway
s
possible to perform this operation manually
if necessary.
e,
Copy protection is manually transferred from
a floppy disk to a hard disk using a batch file
called
TRANSFER.BAT
that is supplied on one of the program disks
. To run this file you must type the
following command, substituting the correct
drive and path names for your system:
TRANSFER
s• thtpath
where s: is the source drive, ci: the destinatio
n drive and path the directory where the softw
are
programs will be stored. As an example, if you
had your floppy disk with TRANSFER.BAT
in drive
A and wanted to transfer the copy protection
system to a subdirectory called \HYDATATROG
S
on
hard disk drive C, you would type TRANSFER
A: CAHYDATA \PROGS. Please note that
if
you
want to place the protection in the root direc
tory you should indicate this by use of the back
slash
(e.g. TRANSFER A: CA).
•
•
It is not absolutely essential that the copy prote
ction system be transferred into the same direc
tory as
the prow-am (as long as the path to its locat
ion is added to the AUTOEXEC.BAT
file) but it is
highly recommended that both protection syste
m and program files are placed in the same direc
tory.
Problems can occasionally arise when this advic
e is ignored
If the copy protection needs to be moved to
a different computer, hard disk drive or subd
irectory, it
must first be moved back to the original flopp
y disk and then to the new destination. The
command
for transferring the protection back to the flopp
y disk is:
TRANSFER
s:Ipcith
d:
where s: is the source drive, path the
subdirectory containing the protection and
d: the destination
drive. Using the installation example above,
the command to transfer the protcction back
to a floppy
disk in drive A would be:
•
•
TRANSFER
CAHYDATATROGS
A: (or from the root directory TRANSFER
CA A:)
The copy protection may then be installed into
its new location
WARNING ! Remember
every installed
warning
to transfer
software package
label on any machine
all copy protections
before reformatting
containing
back to the appropriate
a hard disk. We recommend
copy pmtection.
floppy
disksfor
that you place
a
8)CP
HYDATA
DATA TRANSFER
•
•
HYDATA
macro files
A macro file is a file containing a sequence of HYDATA commands and, possibly, data.
Macro files allow repetitive operations in HYDATA to be automated saving time and effort
by the user. Some typical uses are:
•
(a) to automate data entry using the [F4] command
to infill many missing periods of data
to change the storage times in several years for an EVENT
station
•
•
Macro
files can be created manually using a screen editor, or can be generated as output
from computer programs written by the user.
The usual way to set up a macro file is to first perform
the set of HYDATA
commands
manually, and to note down the commands in the order in which they are typed in. Note that
there are special macro symbols to represent certain HYDATA commands; for example, the
* symbol has the same effect as pressing the [ESC] key. A full list is given in Section 2 of
the HYDATA
manual.
Once the appropriate commands have been noted, they can be typed
one per line into the macro file or the user's program can be modified to output the
commands to a normal text (ASCII)
•
the [F4] key and then giving the name of the macro file.
perform
by pressing
It is important here that the [F4]
key is only pressed when the cursor is placed on the HYDATA
first command in the macro file.
•
file. The macro is then read into HYDATA
menu corresponding
If the file has been set up correctly,
HYDATA
to the
will then
all of the commands in the file automatically.
For macro files which save data to the database, a useful tip is to first try out the files
without the 'Save Edits' commands present. Then, if there any errors in the files, this will
avoid saving values wrongly to the database. It is also good practice to make a backup of
0(
•
•
•
•
•
•
the database before using any macro files which save data to the database. Data entry can
also be made faster by inserting the screen lock command S into the macro to freeze the
editor screen as data values are entered.
4iViisiereirome•••••••••••••••••••••