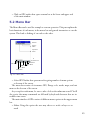
1
Todarmal 1.0
Neighbourhood Mapping GIS Software
USER MANUAL
Mapping
the
Neighbourhood
• Dept. of Science and Technology
• Dept of Space
Chapter 1
Neighbourhood Mapping
1.1 Introduction
The process of development is under constant change incorporating the change in
the physical form, settlement pattern, economic and social aspect, and the current
concern is to analyze the problems and related issues with the changing process in
order to offer solutions in the form of planning proposals that necessitates availability of the sound data base for the analysis and making future development strategies
which could be resolved through creating up-to-date data base with effective mapping process entailing the varied changes in the different regions of the world that
are further subdivide into district, city , town and so on.
1.1.1 What Is A Region:
Regions are geographic divisions of the Earth’s surface with similar traits
Regions are better understood with the help of their attributes. Each region has:
• An Area: -An area as all regions takes up space.
• Boundary: - A boundary, which may be natural or artificial, may not
always be sharp boundaries, may be transition zones.
• A Location: - A location, which may be absolute or relative. -They are
not permanent but are always changing over time
1.1.2 Types Of Regions
1) Formal Regions- An area that is internally homogenous or uniform in
some selected characteristic. For e.g. the Arab world or the Corn Belt.
However formal regions are usually not completely homogenous. The
definition also ignores movement across boundaries.
2) Functional Regions- Dynamic entities that interact with other geographic
regions in national and global patterns. They are defined by functional
integration. Functional specialization and movement are very important
to integration. For e.g. a metropolitan area and the surrounding suburbs
and farmland.
3
There are different scales at which geographers study regions: Local scale, regional
scale and global scale. However, geographers never lose sight of the interconnectivity
and connectivity between local, regional and global scales. The ability to move
between scales is important to obtain an understanding of contemporary world
regional geography because of the manner in which globalization has connected all
people and places.
1.2 Need For Map Preparation
The change in the town structure in terms of land use patter, Physical structure and
socio-economic activities has not kept pace with the growth as a result of which
many towns do not have up to date base maps so mapping of all these physical
changes is necessary for effective land use planning and other development activities as this would facilitate the current situation of the areas for the development
projects there are number of techniques for the preparation of maps which will far
reaching impact on the entire system of land use planning. Availability of accurate
base maps with proper spatial information could be used as useful resource for
planning and development of an area as a self-sufficient.
It has been well realized that initiation of any development projects needs an
insight that unfolds the potentiality of resources of an area in terms of its scope for
development that opens the avenues for resource mobilization and attracting investors to undertake meaningful workable projects.
Neighborhood Mapping however have taken the challenge to utilize the local
resources optimally to furnish useful and timely information in respect to improved
and accurate spatial geographical information, with GIS input to achieve the goal
of effective planning process through preparing maps with advanced technical input.
1.2.1 Maps As The Primary Tool Of A Geographer:
• Used for portrayal of location or representation of the earth’s surface.
• Different types of maps are used by geographers: thematic maps, topographic maps, dot maps.
• Map scale determines the level of generalization. The scale is the ratio of
4
the distance between two points on the map and actual distance between
two places on the earth’s surface.
• Small-scale maps show large areas and very little detail whereas largescale maps show less area and more detail.
1.3 Basics Of Maps
To star with the process of mapping one must be aware about the different types
and the details of mapping.
1.3.1 What Is A Map
A map is a graphical representation drawn to scale of natural and artificial features
(objects) on the Earth’s surface. A map is a portrayal of the real world. Other features such as names of places, boundaries or heights are added to the map because
of the importance that they have for the map user.
1.3.2 Position (Location)
A map gives the location or position of places or features. The positions are usually
given by the coordinates of the place, either as the cartesian coordinates (x, y) in
meters or as geographical coordinates (latitude and longitude) in degrees, minutes
and seconds.
1.3.3 What Can Be Found On A Map
A topographical map shows natural and human made features on the Earth’s surface and added to this are names and boundaries of importance. The features or
objects are represented on the map as symbols in different colors - as point’s symbols, lines and areas. The cartographer uses different colors and symbols for each
type of object in a way that will make it easy for the map user to identify.
1.4 Basic Elements Of Maps
1.4.1 Title:
States what the map shows
5
• Appears at the top of the map
• On topographic maps, the title is usually the name of the largest settlement in the region Grid Lines
• A series of vertical and horizontal numbered lines drawn on a map
• Used to locate features
1.4.2 Scale
Shows the size of the map compared to the actual size of the area that the map
represents. Helps us to calculate the size of a feature on the Earth’s surface.
1.5 Types Of Symbols:
Symbols can be of different shapes and sizes
• The size or thickness of a symbol shows the importance of a feature .
• Certain colors are used to represent certain features
1.5.1 Line Or Linear Symbols
Represent line features like roads, railway tracks, rivers and power lines.
1.5.2 Height Symbols
• To show the exact height of a physical feature, a trigonometrical station
is used.
• This is a circular disc placed in the ground to show the specific height of
the place.
• On maps, a trigonometrical station is shown by a triangle symbol with
the height above sea level written beside it.
1.6 Value Of Map
• Maps can be used to present information of large area and even the world.
• People have been using maps for a very long time.
• Maps are even more widely used today there are several reasons why this
is so:
6
1.6.1 Valuable Sources Of Information
• Maps tell us where we are, how far it is between two places, what direction to take to go to a place, what the different ways to go to a place are
and what we will find there
• Tourists use maps to find their way to tourist information centres, places
of interest and historic landmarks.
1.7 Types Of Maps
There are many types of maps that are used by geographers. Physical Maps, Political Maps, Precipitation Maps, Climate Maps, Mineral Maps, Population Maps,
Road Maps are just a few that they use. The activities on this page require you to
read and interpret these types of maps in order to answer the questions about them.
1.7.1 Special Purpose Maps
Some maps are used for special purposes. This mineral map shows the mineral
deposits that can be found in the state of Utah. Use the link below to help you
answer the questions about this special purpose map.
1.7.2 Topographical Maps
A topographic map is a detailed and accurate graphic representation of cultural and
natural features on the ground. Most topographic maps use contour lines, joining
points of equal height or depth, to indicate elevation. Other topographic maps,
called relief maps, use different colors or shadings to indicate elevation.
Contours
Contour lines are used to show the change in elevation from some fixed point (usually
sea level). For the most part, the actual elevation described by the line is not useful. It is
the change in elevation that is useful. A change from 500 feet to 700 feet is a change of
200 feet. By looking at a topographic map, you can determine whether you will need
sneakers or climbing equipment to get from the first point to the second. If the lines are so
close together that you cannot tell them apart, bring the rope.
1.7.3 Characteristics Of Topographic Maps
The very first thing you need to know about topographic maps is how to interpret
the colors and symbols found on them. These are the common colors used on
7
topographic maps; and what they mean.
• BLUE: This indicates water, such as rivers, lakes, etc.
• BROWN: Brown lines (also called contour lines, discussed below) show
the elevation above sea level.
• GREEN: This usually indicates vegetation (like trees)..
• BLACK: Black is used for showing the location of man-made structures
(buildings, roads, power lines, boundary markings, etc.). It is also used
for lettering and symbols.
• RED: Red is used to highlight major roads, and survey lines.
• VIOLET: Violet is used to show updates to the map made from aerial
photography, but that have not been verified for accuracy.
1.7.4 Physical And Political Maps
Political maps show cultural features like the outlines of countries, states, and cities.
Physical maps show natural features such as mountains, rivers, lakes, and shorelines. Use the site below to compare some physical and political maps of Europe
and Africa. Then answer the questions
1.7.5 Road Maps
Road maps show major and minor highways, cities and towns, often with
campgrounds, parks, and other tourist features.
1.7.6 Weather And Climate Maps
Weather maps show weather conditions such as fronts, temperatures, rain, snow,
and fog at a particular time, or ranges during a particular period. Climate maps tell
about the weather of an area over a period of time.
1.8 Purpose Of Mapping
Mapping surveys are done to identify the location of the earth’s features, both natural and cultural. Once the size, shape and location of these features are determined
they can be represented on maps.
8
1.8.1 Natural Features
Shown on maps may include drainage features such as river, streams, lakes and
ponds; vegetation; and the shape of hills and valleys.
1.8.2 Cultural Features
Are those items produced by people, and include roads, railroads, buildings, bridges,
etc.
1.9 Concept Of Neighbourhood Mapping
It is method of recording the spatial information that includes different geographical features such as water resources, kind of vegetation, street pattern, built structures on maps within a distance of six to ten kilometers that forms the neighborhood.
The information thus preserved to be utilized by the various organizations and
developments authorities for the decision making process.
It is basically a simple mapping exercise in small areas with a judicious mix of
basic theory and techniques. The process shall be intuitive and aimed at developing
individual understanding of the area to be mapped. The outcome shall be low cost
maps and interpretation of areas in a hands-on and practical shade.
Part of this exercise is to introduce you to the ‘art’ of mapping the landscape
around you; of seeing and recording a neighborhood geographically. By mapping
the features of the neighborhood we can obtain a first impression of its character, its
major changes and its condition as a place to live. We can recognize its cultural and
social flavor, its economic vitality and its environmental problems.
1.10 Experimental Learning
A new approach followed that relates the process of mapping while learning as
students are involved into the process of mapping during their study sessions which
is initiated to take the latest technology to the school level in order to understand
the development process of a particular area to ensure minimization of problems as
far as possible.
Neighborhood mapping have tried to find ways to make the mapping system
quick and efficient that fulfills the desired goals and objectives of accurate and
9
precise geographical information required for the number of activities. For this
purpose, the teams are equipped both with conventional devices like palmtop computers with a built-in GPS receiver to enable the school children to start mapping
their neighborhood. Mapping here will mean not only mapping of the physical
features, but also mapping of natural resources, cultural resources and traditional
knowledge resources of the community. The village government, i.e. the Panchayat,
will be integrally involved in the exercise so that the information generated feeds
directly into the process of decentralized community governance. For the children,
production of knowledge would become the primary means of learning.
1.11 Aims:
Neighborhood mapping aims at imparting the technique of collecting information
of the surrounding area on maps through integrating technology at the school level
which includes various students inter-group activities.
1.12 Objectives Of Neighbourhood
Mapping
• Neighborhood mapping focuses on creating awareness of the environment among the locales.
• It identifies the issues and problems of the natural environment through
information generation.
• It aims at preparation and updating maps with the basic features.
• To take the technical education to the root level to meet the changing
requirements of the area.
• It is designed in a way that inculcates the intellectual and physical exercise to the group of students.
• It takes into account the interest of the various groups /stake holders.
1.13 Features Of Neighbourhood Mapping
• Student’s Development Programme: One of the main features of
neighborhood mapping is to provide information through maps, which
10
•
•
•
•
•
•
•
involves children participation at school level.
Promoting Environment Knowledge: Neighborhood mapping makes it
easier to keep a track of the surrounding environment from time to time.
Qualitative Teaching Approach: It emphasizes on teaching students in a
creative way in order to retain the interest of the students.
Skill Acquisition: Neighborhood mapping helps students work on skills
such as teamwork, collaboration, that further develop the art of professionalism.
Supportive Mechanism: Neighborhood mapping is a kind of support
mechanism to help the learners utilize the information in the real life
related issues.
Economizing Resources: Another important feature of the neighborhood
mapping is that the maps are prepared as a part of the student’s curriculum, which economize the time, and energy of the students as well as
trainers.
Technology Promotion: Easily accessible and use of effective techniques
makes the information approachable to the different groups for multipurpose uses.
Integrative Approach: Neighborhood mapping focuses on tapping the
vast potential of the resources available that is made possible through
integration of precise information with different development projects
in future.
11
Chapter 2
Understanding Gis
2.1 Defining Gis
A GIS is an information system designed to work with data referenced by spatial /
geographical coordinates. A GIS engine is a database system with specific capabilities for spatially referenced data while it also has a set of operations for working
with the data. It may also be considered as a higher order map.
GIS technology integrates common database operations such as query and statistical analysis with the unique visualization and geographic analysis benefits offered
by maps. These abilities distinguish GIS from other information systems and make
it valuable to a wide range of public and private enterprises for explaining events,
predicting outcomes, and planning strategies. (ESRI)
A Geographic Information System is a computer-based system, which is used to
digitally reproduce and analyze the features present on earth surface and the events
that take place on it. In the light of the fact that almost 70% of the data has geographical reference as its denominator, it becomes imperative to underline the importance of a system which can represent the given data geographically.
The help of various definitions given below can understand a typical GIS: • A Geographic Information System (GIS) is a computer-based tool for mapping and analyzing things that exist and events that happen on Earth.
• Burrough in 1986 defined GIS as,
“Set of tools for collecting, storing, retrieving at will, transforming and
displaying spatial data from the real world for a particular set of purposes”.
• Arnoff in 1989 defines GIS as,
“A computer based system that provides four sets of capabilities to
handle geo-referenced data:
o
Data input
13
o
o
o
Data management (data storage and retrieval)
Manipulation and analysis
Data output.”
A Geographic Information System is a tool that allows you to organize and analyze
data that can be referenced spatially—that is, data that can be tied to a physical
location. Many types of data have a spatial aspect, including demographics, marketing surveys, and epidemiological studies.
Hence GIS is looked upon as a tool to assist in decision-making and management of attributes that needs to be analyzed spatially. You to interact with data by
selecting features and performing actions based on those selections. GIS software
enables you to access, manage, analyze, and present your data easily.
2.1.1 What Is Gis
A GIS is a mapping tool, which links information about where things are with
information about what these things are like. Unlike a paper map where “what you
see is what you get,” a GIS map can combine many layers of information, most of
which are not visible at first sight.
To use a paper map, all you need to do is unfold it. Spread out before you then
have a representation of cities and roads, mountains and rivers, railroads and political boundaries. The cities are represented by little dots or circles, the roads by black
lines, the mountain peaks by tiny triangles, and the lakes by small blue areas.
Just like on the paper map, a digital map created by GIS will have dots, or points,
that represent features on the map such as cities; lines that represent features such as
roads; and small areas that represent features such as lakes.
The difference is that this information comes from a database and is shown only
if the user chooses to show it. Beside the information on where cities or roads lie,
the database contains further information like, how long the road is, and even how
many square miles a lake occupies.
Geographic Information System (GIS), computer system that records, stores,
analyzes, and displays spatial features that exist and events that happen on, above,
or below the earth. A GIS can generate two- or three-dimensional images of an
area, showing natural features such as hills and rivers with artificial features such as
roads and power lines.
14
2.2 Gis Software Uses Two Basic Types Of
Data
• Spatial data: containing the coordinates and identifying information describing the map itself.
• Attribute data: containing information that can be linked to the spatial
data—for example, matching addresses or coordinates in the spatial data
2.2.1 Spatial Data
Spatial data contain the coordinates and identifying information for various map
features. Three types of features can be represented in the map: points, lines, and
areas. The various physical aspects of the map—political boundaries, roads, railroads,
waterways, and so forth—are organized into layers according to their common
features.
Thematic layers can use different graphical attributes to classify the features in
the layer. For example, a thematic area layer representing sales regions could use
different colors to show the quarterly sales performance of each region. A thematic
line layer representing highways could use different line widths to show the classes
of roads.
2.2.2 Attribute Data
The second type of data used in a GIS is attribute data. With GIS software, data
views can be associated with the map through links to the spatial data. For instance,
the spatial data might represent a country and contain information for city boundaries, census tract boundaries, streets, and so forth. An attribute data set with population information for each census tract can be linked to a map by the corresponding
tract value in the spatial data.
Two of the ways in which you can use attribute data in GIS include:
• Using variables from the attribute data as themes for layers. For example,
an attribute data set containing population data could provide a theme
for a map of census tracts.
• Creating actions that display or manipulate the attribute data when fea15
tures are selected in the map. The actions can range from simple, such as
displaying observations from an attribute data set that relate to features
in the map.
Interacting with Your Data
One of the key concepts with GIS software is selecting features from the map and
then performing actions on the attribute data associated with those features. Actions can be defined to:
• Display observations from the attribute data sets that relate to the selected map features
• Open additional maps that relate to selected map features
• Display graphic images that relate to the selected map features
• Interactively subset the attribute data sets according to the subset of selected map features.
2.2.3 Spatial Data
Spatial data includes points, lines and areas.
Points: Represent anything that can be described as an x, y location on the face
of the earth, such as shopping centers, customers, utility poles, banks, and physicians’ offices.
Lines: Represent anything having a length,
such as streets, highways, and rivers.
Areas Or Polygons
Describe anything having boundaries,
whether natural, political or administrative,
such as the boundaries of countries, states,
cities, census tracts, postal zones, and market
Fig 2.1: Points showing forest area
areas. With a vector model, each feature is
defined by x, y locations in space (the GIS
connects the dots to draw lines and outlines, creating lines and areas)
Another model is the raster model. With the raster model, features are represented as a matrix of cells in continuous space. A point is one cell, a line is a continuous row of cells, and an area is represented as continuous touching cells.
16
Polygon
Fig 2.2: Boundary of Dinapani village
2.4 GIS Data Base
Fig: 2.3: Polygon representing houses
Many GIS databases consist of sets of features
called layers. Each layer represents a particular type of geographic data. The GIS
combines these layers into one image, showing how various types of data relate to
one another. One may attach any relevant attributes or events to these features, and
the
GIS utilized to analyze both spatial and attribute data. A GIS accepts geographic
data from a variety of sources, including paper and digital maps, Global Positioning
Systems (GPS), satellite imagery, aerial photography, and printed text and statistics.
Operators program the GIS to process the information and to produce the images
or information they need.
2.4.1 Layer Information
A Geographic Information System combines layers of information about a place to
give you a better understanding of that
place. What layers of information you
combine depends on your purpose—
Line
finding the best location for a new shop,
Point
analyzing environmental damage, Each
piece of information in the map sits on a
layer, and the users turn on or off the
layers according to their needs. One layer
Polygon
could be made up of all the roads in an
Fig 2.4: Map with different layers
17
area. Another could represent all the lakes in the same area. Yet another could represent all the cities.
Each GIS map displays some of these layers, depending on what information is
needed.
2.5 Gis Data Types And Models
Data for a GIS comes in three basic forms:
2.5.1 Spatial Data
Spatial data, made up of points, lines, and areas, is at the heart of every GIS. Spatial
data forms the locations and shapes of map features such as buildings, streets, or
cities.
2.5.2 Tabular Data
Tabular data is information describing a map feature. For example, a map of customer locations may be linked to demographic information about those customers.
2.5.3 Image Data
Image data includes such diverse elements as satellite images, aerial photographs,
and scanned data—data that’s been converted from paper to digital format.
In addition, this data can be further classified into two types of data models:
2.5.4 Vector Data Model
Discrete features, such as customer locations and data summarized by area, are
usually represented using the vector model.
2.5.5 Raster Data Model
Continuous numeric values, such as elevation, and continuous categories, such as
vegetation types, are represented using the raster model
2.5.6 Tabular Data
If you have lists, spreadsheets, or databases about information like customer lists,
where offices are located, or others, you can use this information in a GIS. If you
18
have the correct spatial data the GIS can link your tabular data with the spatial data.
For example, you can create points on a map of office locations. Or you can link sales
information with postal code areas, allowing you to map sales volume by postal code.
2.5.7 Image Data
Images can be displayed as maps along with other spatial data containing map
features. Image data offers a quick way to get spatial data for a large area and is more
cost- and time-effective than trying to collect layers of data like buildings, roads,
lakes, etc,. one at a time. However, image data is one file, or layer, so you cannot
break down the different components and attach data to them separately.
Images can also be attributes of map features. In other words, you can add images to other map features so that clicking on the feature would display the image.
A satellite image can be used as a map or as an attribute of a map feature. Almost
any document or photograph can be scanned and stored as an attribute in a GIS
database. Photos of houses for sale can be linked to a real estate map; field data
forms can be linked to sample sites; and scanned permits can be linked to building
sites. GIS lets you access this information when you need it by simply clicking on
the relevant map feature.
2.5.8 Vector Data
Vector data represents each feature as a row in a table, and feature shapes are defined by x,y locations in space (the GIS connects the dots to draw lines and outlines.) Features can be discrete locations or events, lines, or areas. Locations, such as
the address of a customer, or the spot a crime was committed, are represented as
points having a pair of geographic coordinates.
Lines, such as streams or roads, are represented as a series of coordinate pairs.
Areas are defined by borders, and are represented by closed polygons. They can
be legally defined, such as a parcel of land; administrative, such as counties; or
naturally occurring boundaries, such as watersheds
2.5.9 Raster Data
The raster data model represents features as a matrix of cells in continuous space.
Each layer represents one attribute (although other attributes can be attached to a
cell). And most analysis occurs by combining the layers to create new layers with
19
new cell values.
The cell size you use for a raster layer will affect the results of the analysis and
how the map looks. The cell size should be based on the original map scale and the
minimum mapping unit. Using too large a cell size will cause some information to
be lost. Using a cell size that is too small requires a lot of storage space, and takes
longer to process, without adding additional precision to the map.
2.6 Advantages Of Gis
The Geographic Information System has been an effective tool for implementation
and monitoring of municipal infrastructure. The use of GIS has been in vogue
primarily due to the advantage mentioned below:
•
•
•
•
Planning of project
Making better decisions
Visual Analysis
Improving Organizational Integration
2.6.1 Planning Of Project
Advantage of GIS is often found in detailed planning of project having a large
spatial component, where analysis of the problem is a pre requisite at the start of the
project. Thematic maps generation is possible on one or more than one base maps,
example: the generation of a land use map on the basis of a soil composition, vegetation and topography. The unique combination of certain features facilitates the
creation of such thematic maps. With the various modules within GIS it is possible
to calculate surface, length, width and distance.
2.6.2 Making Decisions
The adage “better information leads to better decisions” is as true for GIS as it is for
other information systems. A GIS, however, is not an automated decision making
system but a tool to query, analyze, and map data in support of the decision making
process. GIS technology has been used to assist in tasks such as presenting information at planning inquiries, helping resolve territorial disputes, and citing pylons in
such a way as to minimize visual intrusion.
20
2.6.3 Visual Analysis
Digital Terrain Modeling (DTM) is an important utility of GIS. Using DTM/3D
modeling, landscape can be better visualized, leading to a better understanding of
certain relations in the landscape. Many relevant calculations, such as (potential)
lakes and water volumes, soil erosion volume (Example: landslides), quantities of
earth to be moved (channels, dams, roads, embankments, land leveling) and hydrological modeling.
Not only in the previously mentioned fields but also in the social sciences GIS
can prove extremely useful. Besides the process of formulating scenarios for an Environmental Impact Assessment, GIS can be a valuable tool for sociologists to analyze
administrative data such as population distribution, market localization and other
related features.
2.6.4 Improving Organizational Integration
Many organizations that have implemented a GIS have found that one of its main
benefits is improved management of their own organization and resources. Because
GIS has the ability to link data sets together by geography, it facilitates interdepartmental information sharing and communication. By creating a shared database one
department can benefit from the work of another—data can be collected once and
used
many
times.
As communication increases among individuals and departments, redundancy is
reduced, productivity is enhanced, and overall organizational efficiency is improved.
Thus, in a utility company the customer and infrastructure databases can be integrated so that when there is planned maintenance, affected people can be informed
by Computer-generated letters.
21
Chapter 3
PDA Hand Held Device
3.1 Introduction
Compaq’s iPAQ pocket PC combines a real Intel processor, new hardware, and a
sleek industrial design that fits in your hand to create a powerful and stylish PDA
you can take anywhere. It offers 32 MB of RAM and 16 MB of ROM—enough
memory to hold a robust package of applications while leaving you a lot of room
for your own applications. The color TFT screen produces 4,086 colors, and you
can view the screen from many angles and in a variety of lighting situations. The
Compaq iPAQ wraps the power of a Microsoft Windows operating system in a new
interface designed for ease of use in a portable format. Even if you’ve never used a
computer or digital organizer, learning to use the Compaq iPAQ is easy.
Other highlights of the Compaq iPAQ include a microphone and a speaker as
well as an audio-in jack. It features an infrared port for wireless data transfer. The
Compaq iPAQ uses five buttons plus a five-way joystick. The iPAQ connects to
either USB or serial ports. The iPAQ allows you to input data in your own handwriting, by soft keyboard, by voice recorder, or through inking. Both audible and
visual alarms alert you when you have a scheduled event.
What sets this Pocket PC apart from similar devices on the market is its sleeve
like expansion-pack system. The expansion-pack system allows you add functionality to suit your particular needs. Expansion-pack options currently include a Compact Flash pack, the ability to attach a Compact Flash card slot to your iPAQ, an
executive leather and PC Card expansion pack, and a water-resistant sports pack. In
the future, Compaq plans to release a global positioning system pack, so you can
make your iPAQ pocket PC into a GPS unit.
The Compaq iPAQ is sporty and small. At 5.11 by 3.28 by 0.62 inches and 6
ounces, it fits in your hand or slides into your pocket with ease. Don’t let the size
fool you into thinking you don’t get many applications with your iPAQ.
iPAQ Skills
The following section describes the basic concepts of using an iPAQ H3800 Pocket
PC.
23
Front Panel Components:
Item
Component
Function
1
Stylus
2
Power Button
3
Alarm/Charge Light
4
Light Sensor
5
Speaker
Allows you to tap or write on the screen. Push
the stylus release button (12) to release it from
the compartment.
Powers the iPAQ H3800. Press and Release
the button to turn on or off your iPAQ
H3800. Press and hold the button for one
second to toggle on or off the backlight.
Serves as both a battery charge indicator and
a visual alarm indicator.
• Flashing green: Notification alarm signal.
• Flashing amber: Battery is charging.
• Solid amber: Battery is fully charged
Detects the ambient light level so that the
backlight level adjusts to suit the environment
(onlyavailable on iPAQ H3600 Series Pocket
PCs).
Sounds alarms and plays back sound record
ings.
Fig3.1: Front Panel Components
24
6
iPAQ Navigator/
Action Button
7
Application Buttons
8
Record Button
9
10
11
Microphone
Headphone Jack
Infrared Port
12
Stylus Release Button
Allows you to scroll through a list (similar to
pressing the arrow keys on a keyboard). In
the list view of a program, you can use your
iPAQ Navigator to scroll to the item you want
to view. Can also be used as game buttons
within a game application. The center of the
button can be used as an Action button to
open a selected item.
Allow quick access to four applications. By
default, the applications are Calendar, Con
tacts, QMenu, and QStart. You can change
the functions of the application buttons to
open different applications.
Activates the record function in Notes. You
can change the function of the Record but
ton so that it opens a different application.
Allows you to record voice messages.
Lets you connect standard headphones.
Enables you to exchange data with other
Windows-powered devices. The infrared port
can transmit at speeds up to 115.2Kb per sec
ond.
Lets you eject the stylus from its
compartment.
Back Panel Components:
Item
1
Component
Communications
2
Reset Button
3
On/Off Switch
Function
Connects your iPAQ H3800 to the cradle or
auto Port sync cable.
Lets you reset your iPAQ H3800. For more
information.
Allows you to clear all data, and reset your
system if you have forgotten your password.
Clearing memory deletes all data and restores
25
Fig 3.2 : Back Panel Components
4
DC Jack
5
iPAQ Expansion
your iPAQ H3800 to its default settings.
Allows you to connect to external power with
the supplied AC adapter.
Pack Connector Connects to the connector
of an (optional) iPAQ Expansion Pack.
3.2 Cradle And Ac Adapter
Your iPAQ H3800 comes with either a cradle or auto-sync cable, or an AC adapter.
This allows you to recharge your iPAQ H3800, as well as synchronize the informa-
Fig 3.3 : Cradle & AC Adapter
tion between your iPAQ
H3800 and a computer using ActiveSync.
For more information on synchronization, see ActiveSync Help on your computer.
Note: The cradle or auto-sync cable must be plugged into an appropriate port on
26
the back of your computer. Example, you must plug the serial cradle into a serial
port and a USB cradle into a USB port.
3.3 Recharging The Battery
Fig 3.4: Rechargeable Battery
Your iPAQ H3800 contains a rechargeable Lithium Polymer battery that is recharged each time you place your iPAQ H3800 in the cradle and connect the cradle
to an external power source with the AC adapter. You never need to replace the
battery. Just place your iPAQ H3800 in the cradle for three to four hours for an
initial charge before you use it the first time. Next, place it in the cradle for a short
time each day to recharge the battery to its full capacity.
Note: You can also use the AC adapter to connect your iPAQ H3800 directly to
the external power source.
If the battery gets very low, your iPAQ H3800 displays a warning message. If this
occurs, save any unsaved data you are working on, perform synchronization with
your computer, then turn off your iPAQ H3800. Don’t try to restart your iPAQ
H3800 until you have connected to external power. The battery acts like a rechargeable backup battery by protecting your data if your iPAQ H3800 shuts down.
If your iPAQ H3800 does shut down, you still have about 24 hours to recharge the
battery before you lose the data on your Pocket PC.
27
3.4 Compaq IPAQ Expansion Pack System
Fig:3.5 Expansion system
Your iPAQ features the iPAQ Expansion Pack System, which allows you to personalize the appearance of your iPAQ H3800 or add extra functionality. iPAQ Style
Packs offer a range of styles to customize your iPAQ, while Expansion Packs, such
as the Compact-Flash Card, or PC Card Expansion Pack, let you add extra features.
Compaq iPAQ Expansion and Style Packs are designed to easily slide on and off
your Pocket PC without having to power off your Pocket PC.
Note: For information on ordering Compaq iPAQ Expansion Packs, see the
Accessories Information card included in the shipping box.
To add a Compaq iPAQ Expansion Pack:
• Slide the iPAQ H3800 into the Expansion Pack until it clicks into place. The
Pocket PC will alert you when the Expansion Pack is ready to be used.
Note: You can disable the sound made when you insert the iPAQ 3000 into the
Expansion Pack. Press the QMenu button, tap Expansion Pack, and then select
Disable Insertion Sound.
3.4.1 To View The Expansion Pack Properties:
Press the QMenu button, and then tap Expansion Pack. If the Expansion Pack is
installed properly, the name of the Expansion Pack will appear in the Expansion
Pack Properties screen.
28
3.4.2 To Remove A Compaq Ipaq Expansion Pack:
• Slide the Expansion Pack down and off your iPAQ H3800
3.4.3 Compaq Ipaq Cf Card Expansion Pack
Fig 3.6: Compaq IPAQ
The optional Compaq iPAQ CF Card Expansion Pack supports Type I and Type II
Compact Flash cards. The Compact Flash slot allows you to install storage cards for
backup and storage of data and applications. It also allows you to install communication devices such as a LAN adapter or a fax/modem.
To insert a Compact Flash card:
• Remove the Compact Flash slot cover.
Note: The Compact Flash slot cover can and should be replaced only when the
slot is empty.
• Push the card, connector-side first into the slot until it stops.
Note: Do not force the card into the slot. If the card does not seem to fit, verify
that it is facing the correct direction and that you are not inserting the card at an
angle.
To remove a Compact Flash card:
29
• Close all applications on your iPAQ H3800 that have open files on the
Compact Flash card.
Fig3.7:
• Lever the Compact Flash card out of the slot using a fingernail.
3.4.4 Guidelines For Using Compact Flash Cards
• Your iPAQ H3800 automatically recognizes a wide range of Compact
Flash cards approved for use with ActiveSync. If you are ever instructed
to install card-specific iPAQ H3800 drivers provided by a Compact Flash
card manufacturer, be sure to install only device drivers specifically designed for the operating system on your iPAQ H3800. If you are unclear
about installation instructions, call your Compact Flash card manufacturer for more information.
• Some Compact Flash cards consume large amounts of power. To avoid
battery drainage when using a Compact Flash card, connect your iPAQ
H3800 to AC power wherever possible.
• If the battery is very low, you should not attempt to save data to a Compact Flash card. This may result in the loss of data. First connect to AC
power.
• Do not turn off your iPAQ H3800 or remove the Compact Flash card
when you are in the middle of performing an operation, such as saving
30
data to your Compact Flash card.
Fig 3.8 : Stylus
• Keep your Compact Flash card in a protective case when not in use to
protect it from dirt and moisture.
3.5 The Stylus
Your iPAQ H3800 has a stylus for selecting items and entering information. To use
the stylus, press and hold the stylus release button while pulling the stylus upward
out of its compartment. To replace the stylus, just insert it back into the compartment, then push it until it clicks into place.
The following actions are available with the stylus:
• Tap. Touch the screen once with the stylus to open items and select options.
• Drag. Hold the stylus on the screen and drag it across the screen to select
text and images. Drag within a list to select multiple items.
• Tap-and-hold. Tap and hold the stylus on an item to see a list of actions
available for that item. Tap the action you want to perform on the popup menu that appears.
Note: The stylus tip can also be used to press the reset button or set the On/Off
switch.
31
3.6 Compact GPS And PDA
Compact GPS introduces a GPS module in Compact Flash interface. Compact
GPS represents the latest ingenious GPS technology from the leading GPS receiver
manufacturer. Inserting it and implementing map or navigation software, Compact GPS will convert the compatible devices for GPS functions, such as locate one
or multiple objects, conduct personal & vehicle navigation, and / or apply for geographical surveys.
A GPS device receives the GPS data from satellites and then converts the GPS
data into longitude, latitude, and altitude (LLA) data, velocity, time and etc. Position and navigation information is vital to a wide range of professional and recreational activities covering surveying, search and rescue, tracking, hiking, navigating,
and so forth.
3.6.1 Description Of The Interfaces
3.6.2 LED Function
• LED off GPS receiver switch off
• LED on GPS receiver searching signal
• LED flashing GPS signal is fixed.
3.6.3 Reset Button
When push the Reset button, it will initialize and restart the CompactGPSTM
system.
3.6.4 External Antenna Connector/External Gps
Antenna
This connector is designed for external GPS antenna. Please refer the Accessory
Specifications for detail descriptions and specification of external antenna.
3.6.5 When To Use The External Antenna
When you are in a car, or any environments that GPS signal is blocked, the external
GPS antenna will help to receive better GPS signal. Please place the external GPS
antenna in an outdoor open-space to ensure a better GPS performance.
32
Fig 3.9 : Compact GPS
3.7 How To Install & Operate Compact
GPS3
The CompactGPSTM supports plug and play.
• If your PDA has a Compact Flash slot just plug your CompactGPS into
the slot.
• If you don’t have the Compact Flash slot but you got a PCMCIA slot,
then you can apply an adapter to connect your CompactGPSTM to
PCMCIA slot.
Note:
• In order to see NMEA0183 navigational data, use the Hyper Terminal
program of Windows 95/98Ò. Please setup the COM port connected
with CompactGPSTM to:
•
•
•
•
•
•
Baud rate: 4800
Data bit: 8
Parity: None
Stop bit: 1
Flow control: None.
Refer to NMEA 0183 data format.
33
3.8 System Specifications
Feature
Processor
Memory
Display
Backlight
Audio
Infrared
Communications
Indicators
Battery
IPAQ H3800 Series
StrongARM SA-1110
32-MB SDRAM
Color TFT, 240 x 320 pixels,4K-color
support, .24-dot pitch
5-level brightness, light sensor for automatic
adjustment of brightness level
Speaker, 3.5 mm stereo headphone jack
IrDA, data transfer up to 115.2 kb per second
Communication port, Expansion Pack connector
3 mode alarm notification: flashing green LED,
tone, popup message. Charge light: flashing/solid
amber LED
Lithium Polymer
3.9 Battery Warning
This computer contains an internal lithium polymer battery pack. To reduce the
risk of fire or burns, do not disassemble, crush, puncture, short external contacts, or
dispose of in fire or water. A Compaq authorized service provider using the Compaq
spare part for this computer should only do replacement.
34
Chapter 4
An Interface With The User Software
4.1 GPS Fundamentals
GPS in very simple terms explained as Global Positioning System that in a broad
sense means providing accurate information. Function of GPS receivers converts
SV signals into position, velocity, and time estimates.
Minimum four satellites are required to compute the four dimensions of X, Y, Z
(position) and time.
4.2 What Is GPS
The Global Positioning System (GPS) is a satellite-based navigation system made
up of a network of 24 satellites placed into orbit 12,000 miles above the Earth
Fig 4.1 GPS
Using triangulation of signals from four of the satellites by the U.S. Department of
Defense. A GPS device receives the GPS data from satellites and then converts the
GPS data into longitude, latitude, and altitude (LLA) data, velocity, time and etc.
Position and navigation information is vital to a wide range of professional and
recreational activities covering surveying, search and rescue, tracking,
hiking,.1navigating, and so forth.
35
GPS was originally intended for military applications, but in the 1980s, the government made the system available for civilian use. GPS works in any weather
conditions, anywhere in the world, 24 hours a day. There are no subscription fees or
setup charges to use GPS. GPS is a satellite-based system that allows consumers
who use electronic receivers to determine their location and receive timing information
4.3 Compact GPS
Compact GPS introduces a GPS module in Compact Flash interface. Compact
GPS Represents the latest ingenious GPS technology from the leading GPS receiver manufacturer. Inserting it and implementing map or navigation software,
Lower portion of
PDA front panel
Compact Slot of a
Compact GPS
Fig 4.2: Compact GPS
Compact GPS will convert the Compatible devices for GPS functions, such as
locate one or multiple objects, conduct personal & vehicle navigation, and / or
apply for geographical surveys.
Description of the Interfaces
•
•
•
•
•
36
LED off GPS receiver switch off
LED on GPS receiver searching signal
LED flashing GPS signal is fixed.
Reset Button
When push the Reset button, it will initialize and restart the Compact
Back View
of GPS
Closer View
of GPS inserted
into PDA
Fig 4.3: Back View of GPS
•
•
•
•
GPS system.
External Antenna Connector/External GPS antenna
This connector is designed for external GPS antenna. Please refer the
Accessory Specifications for detail descriptions and specification of external antenna.
When to use the External Antenna
When you are in a car, or any environments that GPS signal is blocked,
the external GPS antenna will help to receive better GPS signal. Please
place the external GPS antenna in an outdoor open-space to ensure a
better GPS performance.
External GPS Antenna
4.4 How GPS Works
GPS satellites circle the earth twice a day in a very precise orbit and transmit signal
information to earth. GPS receivers take this information and use triangulation to
calculate the user’s exact location. Essentially, the GPS receiver compares the time a
signal was transmitted by a satellite with the time it was received. The time difference tells the GPS receiver how far away the satellite is. Now, with distance measurements from a few more satellites, the receiver can determine the user’s position
and display it on the unit’s electronic map. The GPS component shown in the
37
Antenna (upper side)
Bottom Side of
Antenna Contains Magnet
Reversed MMCX Connector
Fig 4.4: External GPS Antenna
figure enables user to start with the functions of GPS.
4.5 Utility Of GPS
Using GPS to survey and map precisely saves time and money in this most stringent of all applications.
GPS makes it possible for a single surveyor to accomplish in a day what used to
take weeks with an entire team. And they can do their work with a higher level of
accuracy than ever before.
Slot for External Antenna
Fig 4.5 : Slot
Mapping is the art and science of using GPS to locate items, then create maps
and models of everything, such as. Mountains, rivers, forests and other landforms.
Roads, routes, and city streets. Endangered animals, precious minerals and all sorts
of resources.
38
4.6 Application Of GPS
GPS technology has matured into a resource that goes far beyond its original design
goals. These days scientists, sportsmen, farmers, soldiers, pilots, surveyors, hikers,
delivery drivers, sailors, dispatchers, lumberjacks, fire-fighters, and people from many
other walks of life are using GPS in ways that make their work more productive,
safer, and sometimes even easier.
The various GPS applications can be clubbed under five broad categories.
Location: Determining a basic position.
Navigation: Getting from one location to another.
Tracking: Monitoring the movement of people and things.
Mapping: It is basically to create maps.
4.7 Using A GPS Device To Create A Map
GPS devices capable of being used to collect track or waypoint data that can be
used as the basis of a map.
Converting the output of your GPS system into a map is much the same as the
process of taking a set of grid co-ordinates collected any other way and loading
these into your mapping software. Depending upon the software you use it may be
necessary to convert between co-ordinate systems to achieve this. GPS and then use
your device to navigate to the exact locations.
4.7.1 How Do Maps Relate To GPS
• Maps are produced to model information on the earth’s surface.
• Maps are produced to scale, so that the positions o maps have the same
relationship in scale, as the real objects.
• GPS can display and log real positions on the earth’s surface. These positions can then b interpreted on any map.
4.7.2 Following A Route
Once you have established your first position, you may try to move around
with your GPS receiver, and it is able to follow your movements and to indicate
in which direction you proceed. In this sense, it will act as a super-compass,
39
giving you this direction in degrees.
Many GPS devices allow storing a series the momentary positions; resulting
in a graphic display of the route you are following. This can be very useful if
you are walking in unknown territory, because it is then possible for you to
follow the same route back again to your starting point without getting lost in
the wilderness or on the sea.
It is also possible to read the distance to the goal (of course, assuming that
you have told it where it is) and, based on the currrent speed with which you
move in this direction, it may tell you the estimated remaining time until you
reach this goal.
If you want to move to a specific location, you may also pre-select a route
from a map, store the coordinates of intermediate points along the chosen route
and then move under GPS guidance to your destination.
4.8 Uses
• Map formed with GPS. Data includes waypoints and routes for use
with handheld GPS and car navigation systems.
• This handheld GPS unit provides much more information than simply your position on the planet, though that feature is the most commonly used. The GPS provides your location, anywhere on the planet,
based on triangulation of the unit and several of the twenty-four satellites that revolve around the earth.
• Initialize it by entering my approximate latitude and longitude as
well as the current date and time With that information, the GPS
unit was able to track the satellites overhead and provide the user
with almost precise location, an approximate elevation, and very accurate time. The reason that my location is not exact as displayed on
the unit.
• The GPS not only provides location in latitude and longitude, it can
also display location in other coordinate systems.
• Surveyors are using GPS to determine the boundaries, area, or elevations of land, rivers and/or countries.
40
4.9 Pre-Condition For Using GPS
GPS is usable everywhere except where it’s impossible to receive the signals such as
inside most buildings, in caves and other subterranean locations, and underwater.
Land-based applications are more diverse. The scientific community uses GPS for
its precision timing capability and position information.
4.9.1 Acquiring The Satellite Signals
A GPS receiver will not work inside buildings that shield the high-frequency satellite transmissions. You must therefore first find the right place to stand, preferably
in a fairly level area with a full horizon, before switching on the GPS receiver.
A number of effective ways for using GPS have been clubbed as under to obtain
or achieve the accurate and précised result.
• A wide area for receiving maximum strength signals from the satellites.
• Fully charged units, since low battery results in inaccurate values.
• For the GPS unit to function properly it needs at least 4 satellites in
horizon (view) to calculate the precise position. Since standing under the
tree would result in few satellites being blocked out of view, forcing inaccurate position to be determined.
• Operating the GPS along the cliffs or obstacles would result in blocking
satellites again resulting in misleading information.
41
Chapter 5
Working With GPS Tracker
The hand held device or a Personal Assistant Device (PDA), gives a qualitative and
quantitative data only if the user properly follows the set of useful instructions for
the use of GPS. GPS, which stands for Global Positioning System, constitutes of a
constellation of satellites whose primary purpose is to provide the global coordinates referring to current location of the unit. Sometimes called the GPS Receiver
the component functions in coordination with a hand held PDA.
5.1 Starting With PDA
This section explains how the user starts with the hand held PDA for working with
the GPS.
GPS (Global Positioning
System) Receiver
PDA (Personal Digital
Assistant)
Select Menu
Fig 5.1: GPS Device Attached To PDA
Fig 5.2: Compaq IPAQ a Personal
Digital Assistant
• To start working press the button in upper right portion of the device to
make the system operational
5.1.1 Using the Stylus
For a Smart Display with a touch screen, the stylus functions much like a computer
mouse. Tapping with a stylus is equivalent to clicking with a mouse.
43
Personal Digital Assistant
Tapping with a Stylus
on the PDA
Stylus
Fig 5.3(a): Stylus
•
•
•
•
•
Fig 5.3(b): Using the Stylus
Do not rest your hand on the screen. The screen is sensitive to touch; pressure
from your hand prevents from functioning properly.
Hold the stylus perpendicular to the screen
Press and tap firmly when using the stylus. The screen is designed to handle the stress
of tapping and dragging with the stylus
Keep the stylus smooth and clean.
Never use a pen, pencil, or other object in place of your stylus. Such objects can dam
age your Smart Display.
5.1.2 GPS Tracker
• Click on the start menu that opens the programme menu with a number
of options.
Start Menu
Fig 5.4(a): Start Menu
Window
44
GPS Tracker
Fig 5.4(b): GPS Tracker
• Click on GPS tracker that opens a menu bar at the lower and upper end
of the main window
5.2 Menu Bar
The Menu Bar can be used for example to start an operation. This part explains the
basic functions of each menu, in the menu bar and general instructions to use the
system. This leads to linking of one task to the other.
Title Bar
Settings
Menu
Operations
Menu
Keyboard Icon
Exit Menu
GPS Menu
Maps Menu
Tracks Menu
Tools Menu
Pinup Menu
Fig 5.5: Menu Bar
• Select GPS Tracker that opens menu bar giving number of menu options
at bottom of the screen.
The menu bar consists of six menus, GPS, Pinup, tools, tracks, maps, and exit
menu at the bottom of the screen.
As you explore each menu, be sure to take a look at the submenus as well. You’ll
also notice that many commands are followed by keyboard shortcuts that are incredible time savers.
The main window of GPS consists of different menu options in the upper menu
bar.
• Select: Using this option the user may choose to work on layer or on
track
45
• Operation: Click operation, in the menu bar, the operation menu is
opened. The operation menu contains the function to finish shape while
creating a particular layer.
• Settings: It contains the options for color selection and changing the
font size.
5.2.1 GPS Menu
Activate: The GPS activation dialogue, which appears, shows two options to be
filled by the user.
• First list box indicates the time intervals after which the GPS coordinates
Close
Time Interval
Port Number
Cancel Button
OK Button
Fig 5.6(a): GPS Menu
Showing Activate
option
Fig 5.6(b): GPS Activation
are to be retrieved from the device. For Example; if you set time interval
at 2 , then after every second of the set time interval it gets the data.
• Second list box indicates the port number to which GPS card is connected. In the model number 3950 is 6, the model number 3850 is 5 and
the model number 3650 is 4.
Deactivate: Once the user has finished working with GPS the user is expected to
deactivate the GPS before closing the application to avoid power consumption.
Start Logging: The logging dialogue that appears by clicking on this option requires three inputs to be filled by the user.
46
Fig 5.7: GPS Menu Showing
Deactivate Option
• The Village Name Button indicates the name of a particular village,
for which data is to be collected.
• The Group Name Button indicates a group for students, who will
capture the given data.
• The Track Number Button indicates a track number, which is being
recorded.
• Choosing one of the values from the combo box can set the respective
fields.
Close
Village Name Button
Track Number Button
Group Name Button
Cancel Button
OK Button
Fig 5.8(a): GPS Menu Showing
Start Logging Option
Fig 5.8(b): Start Logging
47
• File name for particular track consists of three values, First, Village name,
Second, Group name and Third, Track number.
• File chosen to keep recorded information will be displayed with complete path.
Pause Logging: Incase the user wants to stop tracking for some time and doesn’t
want the information to be stored in the track file while still seeing where he/ she is,
Fig 5.9: GPS Menu Showing
Pause Logging
pause logging is the function to invoke. Once logging has been paused the option
changes to resume logging.
Resume logging: By clicking it user can resume his/her normal storing and tracking
work.
Show Current: It can happen the user can get lost while tracking, while clicking on
show current, the current location is brought to the center of the screen and the
zoom is adjusted such that the entire area on the screen is 5400 sq meters.
5.2.2 Pinup Menu
Create: For creating various types of menus use the create option. Incase a pinup
with the specific name already exists; the user is prompted whether it should be
overwritten or the data is to be appended to it.
• Before creating a pinup one has to open a track first or the GPS should
have been activated or a map layer should have been opened, for referencing the clicked point.
48
Create Pinup
Open Pinup
Set Active Pinup
Discard All
Pinup
Save Active
Pinup
Discard Active Pinup
Save All Pinup
Fig 5.10: GPS Tracker Pinup Menu
Open: The previously marked pinups can be opened using this menu.
Set Active: Once the user is working with the multiple pinups, he/she is expected to
set the active pinup layer for modifications, once clicked the user is asked to pick
the pinup he /she wants to work with.
Discard Active: The active pinup is removed from the current working set of pinups.
• Save the Data to the Disk, before discarding the active Pinup.
Discard All: All the pinups are removed from the working set.
Save Active: The active pinup is saved to the disk.
Save All: All the pinups are saved to the disk.
5.2.3 Tools Menu
Zoom In: Any user should be able to easily navigate on the map and find any
particular location and he should be able to view the map at any level of zoom. This
function provides the user to zoom to particular position of projected map and
allows the user to zoom to a different place.
Example: Showing a Normal View of a Map and a Zoom-In view of a Map
Zoom Out: To another point – This feature provides the user to Zoom out to a
point of the projected map and when clicked on, provide the zoom out viewing of
49
Zoom In Tool
Zoom Out Tool
Pan Tool
Track Point Tool
Pinup Tool
Create Object Tool
Fig 5.11: GPS Tracker Tools Menu
the map.
Example: Showing a Normal View and a Zoom-Out view of a Map.
Pan: This feature allows the user to move/pan to adjust the map according to their
choice to the respective position.
Fig 5.12(a): Normal view
Of Map
Fig 5.12(b): Zoom-In
View of Map
Pinup: Once a pin up has been opened or created in order to enter more pin ups to
the active pin up, click on this pin up addition tool, where ever you click a box will
pop up for you to enter data. One can cancel the current operation, modify the
current data, or even remove it incase it was placed at the wrong location.
50
Fig 5.13(a): Normal View
of Map
Fig 5.14(a): View before
Pinup
Fig 5.13(b): Zoom-Out View
Of Map
Fig 5.14(b): View after
Pinup
5.2.4 Tracks Menu
Tracks menu are used to trace the particular track file and add information using
the given tracks.
Open: The previously built tracks can be opened using this menu.
Discard Active: The active track is removed from the working set.
Discard All: All the tracks area removed from the working set.
Show All: The current view is generated such that all the tracks, which are opened,
are visible in the single screen.
51
Open Track
Set Active Track
Discard Active Track
Discard All Tracks
Show All Tracks
Fig 5.15: GPS Tracker Track Menu
5.2.5 Maps Menu
Maps menu can be used to access the maps form the folders; view all the maps on
the screen or a particular map, to record the information.
Create Layer: Creates a layer with respect to a point, polyline or a polygon.
Create Layer
Open Map
Discard Active Map
Save All Maps
Set Active Layer
Discard All Maps
Show All
Maps
Save Active Map
Save Active Map
Fig 5.16: GPS Tracker Maps Menu
52
Open: Opens the previously built Jtv. (Registered maps can be opened using this
menu.)
Fig 5.17(a): View before
Discard
Fig 5.17(b): View after
Discard
Discard Active: The active map is discarded from the current working set of maps.
Discard All: All the maps are discarded from the working set.
Save (Active): Saves all the current active layers at that point of moment.
Save All: Saves all the layers.
Show All: Showa the current view such that, all the maps that are currently opened,
are visible in a single screen.
53
Chapter 6
Creating Map
In the previous chapter Working With GPS, we learned basics of GPS, its operating
system, functions of various menus and their applications.
In this chapter we would study these in a depth like creating tracks, adding pinup,
creating map layers and application of each menus and submenus to perform any
task related to the mapping process.
6.1 Activating GPS
Track creation is only possible once the GPS is activated.
• To activate GPS click on the GPS menu and then click on the Activate
Button.
NOTE: In case the device is not properly connected with the port it gives the
caption port is unavailable that means we can or not proceed. That means to move
ahead the proper port connection is must.
Close
Time Intervals
Port Number
Cancel Button
OK Button
Fig 6.1(a): GPS Menu
Showing Activate Option
Fig 6.1(b): GPS Activation
• Once the GPS device is properly connected we click activate for activating the GPS.A dialogue box pops up asking for user input.
• Indicates the time intervals after which the GPS coordinates are to be
retrieved from the device.
55
• Indicates the port number to which GPS card is connected. In the
model number 3950 is 6, the model number 3850 is 5 and the model
number 3650 is 4.
6.2 Creating Tracks
Tracks are essentially a sequence of points that are automatically recorded to a file,
and displayed on the screen.
Shows Folders
Open a
Track File
Closes the
File Option
Keyboard Icon
Fig 6.2: Tracks at a Glance
Shows both
Folders &
Track Files
Shows
Track Files
Fig 6.3: Open an Existing Track
Once the GPS is activated it starts getting signals from the satellite and the process of visual display of coordinates begins. But still no data is being recorded.
6.3 Adding Pinups
NOTE: Pinups can be added once the process of creating tracks is started
• To create the features on tracks we have pinup menu, which creates various pinups
• Click pinup that opens the pinup menu with the options to open, create,
set active, discard active, discard all, save active and save all pinup layers
56
Fig 6.3: Creating a
Pinup
• Click Create that provides further sub options for adding up various
pinups
• Click on any of the desired option in the sub menu to mark the specific
pinup
Note: Before we click discard active we must know the data is not saved to the
disk. To save the data click on save all.
Example: If we have to mark infrastructure detail, we need to know a particular
category of infrastructure.
• First click on the infrastructure that gives the various categories for infra-
Fig 6.3: Creating
Infrastructure Pinup
Fig 6.4: Categories of
Infrastructure
57
OK Button
Longitude Points
Latitude Points
Text Box
Clear Button
OK Button
Remove Button
Cancel Button
Fig 6.5: Showing the Latitude & Longitude Points
structure, e.g. hotel, building, bridge. Etc. and then select the specific
pinup to be added
• Now click on track and that pops up a text box below the longitudinal
and latitudinal value
• Specify the type of pinup to be created in the text box.
• Enter the field name and field type in the dialogue box and click ‘+’ sign
to add the data in the box below
Fig:6.5(a) Dialogue
box
58
Fig:6.5(b) Dialogue box for
adding text
• To type the pinup in the text box bring the cursor in the text box.
• Click on the key box icon and type the kind of pinup to be added with
the help of the keyboard and click OK. That will create the desired pinup.
Note: To work on particular pinup layer we click on set active that will activate
the desired layer. To remove the particular pinup layer we have an option to click
discard active that removes the pinup layer we have been working on.
6.4 Map Layers
Map Layers means “A representation of the physical features of a portion of the Earth’s
surface graphically displayed on a planar surface”.
Map layers display signs, symbols, and spatial relationships among the features
and organize the display by subject matter (e.g., properties, roads, and parks). In
this program, some map layers are scale dependent, which means, that, if you’re
looking at a map of the full city, you won’t see detailed mapping, such as property
outlines or minor street names. However, as soon as you zoom into an area of the
city, such as a neighborhood street, you will see these map layers become visible
automatically.
Each map layer contains spatially referenced information about a measured
phenomena within the geographic space covered by the map.
6.4.1 Types Of Map Layers
Map layers can be treated like any other document in the Windows world. They
can be opened, copied, duplicated, renamed, or moved. You can make a shortcut of
a map layer; get file information about a map layer. The various physical aspects of
the map—political boundaries, roads, railroads, waterways, and so forth—are organized into layers according to their common features.
A Map layer is a homogeneous layer compromising of various objects of a particular geometry or shape. The geometries, which are currently supported, are divided into three broad categories:
• Points
• Polylines
• Polygons
59
Example: Collection of points that represent telephone poles locations can be
organized into a layer, collection of lines that represent streets can be organized into
a street layer, and the collection of areas that represent parks can be organized into
a park layer.
6.5 How To Create Layer
Performing an operation on one or more existing map layers can generate a new
map layer.
• Click at Maps in the menu bar to create a layer
• Click at create layers that opens the menu options to mark the feature or
information either as point, polyline or a polygon.
Note: If we want the particular information to be marked in a point layer then
Fig 6.6(a): Create a Layer
Fig 6.6(b): Options for
Creating a Layer
select Point. A set of different symbols could be used in the point layer to create
data in a particular layer.
• From the menu bar select map menu and click on create layer having
point, polyline and polygon as options in the submenu
• To get the information in point layer click on point that pops a dialogue
box giving the field, folder and type option.
60
• Do mention the folder to save the data.
• Now click ok which further provides an extension of the dialogue box for
the user to enter the field type and length
• Once you have entered the name and filed type click OK.
6.3.1 Adding Color To Map Layer
(a)
(b)
Fig6.7(a) & (b): Figure showing to click on select option
and selecting on layer.
Font Options
Size for Point
Index
OK Button
Color Options
Point Preview
Cancel Button
Fig 6.8: Point Settings
61
To add color to a map layer, select the portion to which you want to change color,
click select in the upper menu bar and then select On Layer and click on By Point.
• Once this is done, go to settings and click On Point that pops up a
dialogue box, which contains options to change point settings.
• The user may choose the desired font, size, index, and color from the
box.
• Now select the color and click o.k. Which gives the point layer as selected color.
• After selecting the desired settings go to select option and click on De
Select for the selected settings to be applied.
6.3.2 Set Active Layer
For a layer to be visible in the map window, Click on the set active layer. The layers
Lists the
current files
to be Active
Scroll Button
OK Button
Fig 6.9(a): Set Active Layer
Fig6.9(b): File Selection Menu
appear in the order they are listed, with the top layer in the list appearing above the
other layers in the view.
6.3.3 Removing Active Map Layer
If you want to remove a map from a PDA screen click on maps and then discard
active. The active map layer is removed from the current working set of maps.
62