1
FamPipe
Alpha 1.1
(Lastest update: May 20, 2015)
User manual
1
Content
Introduction ................................................................................................................... 1
Run the Program ............................................................................................................ 2
Input files/Output folder:............................................................................................... 3
The PLINK BED, BIM, and FAM Files ....................................................................... 3
The External Program Path File .............................................................................. 4
The External Frequency File (Optional) ................................................................. 5
The Cluster File (Optional) ..................................................................................... 6
The Interval File (Optional) .................................................................................... 7
The GWAS and NGS SNP List Files (Required for running GIGI) ............................. 8
The Annotation File (Required for Association Tests) ............................................ 9
The Folder of Output............................................................................................ 10
Functions ...................................................................................................................... 11
Update Genetic Positions..................................................................................... 11
PedCut .................................................................................................................. 12
IBD Sharing Analysis ............................................................................................. 13
Linkage Analysis ................................................................................................... 16
Imputation Analysis ............................................................................................. 18
Merlin Imputation: ....................................................................................... 18
GIGI imputation:........................................................................................... 21
Association test .................................................................................................... 22
Disease model ...................................................................................................... 24
Disease model type 1: .................................................................................. 24
Disease model type 2: .................................................................................. 27
Other options ....................................................................................................... 29
The Four Commonly Used Scenarios ........................................................................... 30
Citation ......................................................................................................................... 36
Suggestions/Bug report ............................................................................................... 37
2
Introduction
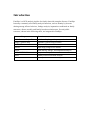
FamPipe is a NGS analysis pipeline for family data with complex diseases. FamPipe
has many commonly used family analysis functions, such as identity-by-descent
sharing among affected relatives, linkage analysis, imputation conditional on family
structures, disease models, and family-based association tests. Several public
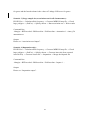
resources, shown in the following table, are integrated in FamPipe.
Resource/Program
Function
1000 Genomes Project Data
Allele and haplotype frequency estimation
Rutger’s genetic map
Haldane’s genetic map positions
PLINK2
File conversion
PedCut
Split large pedigrees for Merlin
Merlin
IBD sharing, linkage, and imputation analyses
GIGI+MORGAN
Imputation analysis
FBAT
Family-based association analysis
OVPDT
Family-based association analysis
1
Run the Program
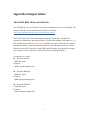
Before running FamPipe on UNIX, we highly recommend the user (especially the
first-time user) to generate the command using the web-based interface (http://XXX).
FamPipe can be launched with a command line like the following, with many options
for different analyses.
./fampipe --BED file_name --BIM file_name --FAM file_name …
For example:
./fampipe --BED test.bed --BIM test.bim --FAM test.fam --Impute 1
2
Input files/Output folder:
The PLINK BED, BIM, and FAM Files
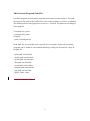
The PLINK bed, bim, and fam files are the three mandatory files to run FamPipe. The
format of the files can be found in the PLINK user manual:
http://pngu.mgh.harvard.edu/~purcell/plink/binary.shtml
The bed file is a binary file containing the genotype information. The bim file
contains the SNP names and map positions. Chromosome number, SNP names (i.e., rs
ID), and physical positions based on hg19 should be specified. The fam file contains
the family structure, where the affection status for each individual in the 6th column
should be specified. If your have both GWAS and NGS data, they should be merged
into a single set of the bed, bim, and fam files before running FamPipe.
Command line options:
Read the bed file
--BED file_name
Example:
--BED example/fampipe.bed
Read the BIM file
--BIM file_name
Example:
--BIM example/fampipe.bim
Read the FAM file
--FAM file_name
Example:
--FAM example/fampipe.fam
3
The External Program Path File
FamPipe integrates several public programs and resources in the analyses. The path
file specifies the path on the UNIX where each of the program or resource is installed.
The default path for each program or resource is ./external. The paths can be changed
in the path file.
Command line options:
--path path_file_name
Example:
--path ./external/path.txt
In the path file, several paths can be specified. For example, assume all executable
programs can be found in /usr/local/bin and Rutger’s Map can be found in ./map. In
the path file:
--plink-path /usr/local/bin
--merlin-path /usr/local/bin
--pedcut-path /usr/local/bin
--fbat-path /usr/local/bin
--ovpdt-path /usr/local/bin
--morgan-path /usr/local/bin
--gigi-path /usr/local/bin
--rutger_folder ./map/
4
The External Frequency File (Optional)
Programs like Merlin and GIGI included in FamPipe require a frequency file.
Therefore, for IBD, linkage, and imputation analyses, a frequency file will be
generated. By default, FamPipe estimates allele frequencies from the sample to
generate the frequency file. If you have a small sample, an external file with
frequencies estimated based on other samples from the same population can be given
to FamPipe. Then frequencies in the frequency file for Merlin and GIGI will be
estimated jointly based on the sample allele frequencies and external allele
frequencies. Please see the technical note for the joint estimation of the allele
frequencies. The format of the external frequency file is the same as the PLINK
frequency file, which contains six columns:
CHR
SNP
A1
A2
Chromosome
SNP identifier
Allele 1 code (minor allele)
Allele 2 code (major allele)
MAF
Minor allele frequency
NCHROBS Non-missing allele count
Please see http://pngu.mgh.harvard.edu/~purcell/plink/thresh.shtml#maf
The external frequency file can be either obtained automatically from our ftp site or
provided by the user. When connecting to our ftp site, a list of frequency files for the
6 super populations (i.e., AFR.freq, AMR.freq, EAS.freq, EUR.freq, and SAS.freq)
estimated from the 1000 Genomes Project Data will be shown. Please select an
appropriate frequency file for your sample.
Command line options:
Download the external frequency file from our ftp site
--Freq_file ftp
Provide your own file
--Freq_file file_name
Ex: --Freq_file my.freq
Note: Because the frequency files are large, downloading the files from our ftp site for
each analysis can be time consuming. Alternatively, these files are packaged into a
single file and can be downloaded directly from the FamPipe website. Please
5
download the file and use --Freq_file file_name to avoid the download for each
analysis.
The Cluster File (Optional)
A cluster file, which contains haplotype frequencies, is used in Merlin to account for
linkage disequilibrium (LD). For IBD and linkage analyses using Merlin, a cluster file
is not required in FamPipe as the markers have been pruned for LD automatically in
FamPipe. But for imputation analysis, a cluster file can be specified. By default,
FamPipe does not use the cluster file. However, if specified, FamPipe can
automatically generate the file by estimating the haplotype frequencies in the sample.
We also compiled a list of the cluster file for the 6 populations with haplotype
frequencies estimated from the 1000 Genomes Project Data (i.e., AFR.cluster, AMR.
cluster, EAS.cluster, EUR.cluster, and SAS.cluster), which can be downloaded from
our ftp site. The cluster file can also be provided by the user.
The format of the cluster file is the same as the cluster file from merlin. For example:
CLUSTER snp1165473 snp1165474 snp1165475
HAPLO 0.7662 1
1 1
HAPLO 0.0060 1
1 2
HAPLO 0.0222 1
2 1
HAPLO 0.0671 2
1 1
HAPLO 0.1384 2
1 2
Command line options:
Generate the cluster file based on the sample
--Cluster_file generate.
Download the pre-compiled cluster file from our ftp site
--Cluster_file ftp
Provide your own file
--Cluster_file file_name
6
The Interval File (Optional)
As imputation using either Merlin or GIGI for a large region is computationally
intensive, it is recommended to run the imputation analysis only in linkage regions or
in user-specified intervals. The files containing the user-specified intervals should be
named as “range_chrX.txt”(X is the chromosome number). Files must include two
columns, the first column is the start of the physical position and the second column is
the end of the physical position, for each interval.
For example:
In range_chr1.txt:
118754941 119491686
119486998 119491486
In this example, two intervals are defined on chromosome 1 and imputations will only
be performed in these intervals.
Note: please name the interval files for each chromosome as range_chr1.txt,
range_chr2.txt…, and place them in the same folder as the one you place the bed,
bim, and fam files.
Command line options:
--interval
7
The GWAS and NGS SNP List Files (Required for running GIGI)
GIGI requires a sparse set (e.g., the GWAS SNPs) and a dense set (e.g., the NGS
SNPs) of markers for imputation. Therefore, SNP sets for each chromosome should be
provided before running GIGI. These files should be saved in the same folder where
you launched FamPipe. The SNP set file has one column, where each row is the name
for each SNP in the set. The GWAS SNP files should be named as gwas_snpsX.txt,
where X is the chromosome number. The NGS SNP files should be named as
ngs_snpsX.txt, where X is the chromosome number. For example, the GWAS and
NGS SNP files for chromosomes 1 and 2 are:
gwas_snps1.txt
gwas_snps2.txt
ngs_snps1.txt
ngs_snps2.txt
The content of the file is like
gwas_snps1.txt:
snp1149977
snp1149980
snp1149981
snp1149997
snp1149998
...
ngs_snps1.txt:
snp1149972
snp1149977
snp1149978
snp1149980
snp1149981
…
8
The Annotation File (Required for Association Tests)
Gene-based association tests are performed using FBAT and OVPDT. Therefore, an
annotation file is required to define gene regions. Moreover, IBD sharing statistics
and disease model status will be added to the annotation file if the file is provided.
The file must have at least three essential columns, starting with the column names
chromosome position geneList
For example, in annotation.txt:
chromosome position geneList
1 7324503 CAMTA1
1 7324547 CAMTA1
1 7324959 CAMTA1
1 7326621 CAMTA1
1 7326747 CAMTA1
1 7331060 CAMTA1
Extra columns can be added in the file. The annotation file should be based on NCBI
37/hg19.
Command line options:
--Anno_file filename
Ex:
--Anno_file annotation.txt
9
The Folder of Output
User can assign the name of data output folder. If user doesn’t specify the output
folder, FamPipe will create a folder with the name “famepipe_date_time”. FamPipe
will also create a folder for each chromosome (dir_1,dir_2,dir_3…) under the data
output folder.
Command line options:
--out folder_name
For example,
--out test
FamPipe will create a folder named as “test”. If the input file contains information of
chromosomes 1 and 3, you will see the “dir_1” folder and “dir_3” folder in the “test”
folder, and analysis results for each chromosome are saved in its own folder.
10
Functions
Update Genetic Positions
Programs such as Merlin and GIGI use the Haldane’s map functions for the genetic
positions. By default, FamPipe reads the genetic positions from the third column in
the bim file. The positions can also be updated based on the Rutger’s Map.
The values in the third column (genetic positions) in the bim file will be updated
using this function. More details of how FamPipe updates the positions can be found
in the technical note. The latest version of Rutger’s Map can be downloaded from
http://compgen.rutgers.edu/download_maps.shtml. The map file for each chromosome
should be named as “Rutger_Map_chrX.txt”, where X is the chromosome number.
Also please make sure the path for --rutger_folder in the external program path file
points to the folder where the map files are placed.
Note:
1. If you use this function, there must be more than one SNP in the bim file that have
identical names in Rutger’s Map.
2. If you use your own genetic positions in the bim file, please follow the rules for
the bim file:
- The genetic positions in the third column cannot be duplicated
- Every value of the genetic position must be less than 500.
Command line options:
--Rutger_Map
Output
An updated map (new_XXX.bim) will be saved in the output file folder.
11
PedCut
FamPipe automatically splits large pedigrees using PedCut in order to run Merlin. For
more information about the PedCut algorithm, please refer to the PedCut user manual,
which can be downloaded at: http://mga.bionet.nsc.ru/soft/pedcut/pedcut_1.19.tar.gz
Output
In the data output folder, you will find the file family_pedcut_info, which contains the
information of the PedCut results. For example, the file may look like:
1: 3 4 5
2: 6 7 8 9
There are two pedigrees in the fam file. The first pedigree is split into 3 sub-pedigrees
with family IDs 3, 4, and 5, and the second pedigree is split into 4 sub-pedigrees with
family IDs 6, 7, 8, and 9. Families are recoded with the new IDs for the Merlin
analyses.
Related options:
Specify the bit size for PedCut and Merlin. The bit value is calculated as two
times the number of non-founders minus the number of founders. The default
value is 20, which worked in our server with 96 GB of memory. You may reduce
the value to save memory or turn on the --smallSwap option.
--bit value
Example:
--bit 15
12
IBD Sharing Analysis
IBD Sharing Analysis is based on the Merlin IBD Estimation using the --extended
option in Merlin. FamPipe identifies the regions that have higher IBD sharing among
affected individuals. A pair of affected individuals who can be traced to a common
ancestor and who have P(IBD≠0) for a region greater than IBD_threshold is defined
as an IBD pair for the region. Parent-offspring pairs are not considered as they always
share 1 allele IBD. The proportion of IBD pairs in all pairs of affected individuals
(excluding parent-offspring pairs) is calculated for each variant. For more details
about how FamPipe defines IBD sharing regions, please refer to the technical note.
Command line options:
To run the IBD sharing analysis, use this option:
--IBD_Sharing
Related options:
IBD threshold for P(IBD). The default value is 0.5. You can specify a higher
threshold to get higher specificity (i.e., more non-IBD regions will be filtered).
However, this may sacrifice the sensitivity (i.e., may miss more IBD regions).
--IBD_threshold value
Example:
--IBD_threshold 0.8
To filter IBD regions based on a threshold, the Sharing_threshold can be
specified. The default value is 0.5. Positions with the proportions of IBD pairs in
all possible pairs of affected individuals > Sharing_threshold will be reported.
--Sharing_threshold value
Example:
--Sharing_threshold 0.5
Grid of map positions for calculating the IBD probabilities. The default value is
1. Please refer to the Merlin user manual for more information of the grid option.
--grid value
Example:
--grid 0.5
13
PLINK prune threshold (variance inflation factor, VIF). FamPipe uses PLINK to
prune SNPs in LD using the VIF. SNPs that are not correlated are used for the
IBD analysis. The default value of VIF is 2. Please see the PLINK manual
“Linkage disequilibrium based SNP pruning” for more information.
--vif value
Example:
--vif 1.5
IBD Sharing Output:
merlin.s15: Output file for the Extended IBD state information from Merlin.
Extended IBD states track sharing of maternal and paternal alleles separately and
also provide additional information for inbred pedigrees.
Notable grid file. The file saves the positions with the proportions of IBD pairs
in all possible pairs of affected individuals.
Example: notable_grid_chr1
position: 148.108 rate: 0.28 count: 35 num_of_pair: 125
position: 149.108 rate: 0.28 count: 35 num_of_pair: 125
The position corresponds to the genetic position in the bim file. Assume the value of -grid is 1. Therefore, the position from row to row increases by 1. Rate is the
proportion of IBD pairs in all pairs of affected individuals. The number of pairs is the
number for all possible pairs of affected individuals (excluding parent-offspring
pairs).
Range file. The file contains the chromosome regions where the proportion of
IBD pairs > Sharing_threshold. Each row specifies one region, with the start and
end physical positions.
For example: CHR1_range.txt
118992458 119203063
If CHR1_range.txt file is not generated, it means that no positions met the
Sharing_threshold.
Annotation file: If an annotation file is provided using the --Anno_file option,
the IBD statistics will be added as extra columns in the annotation file.
14
Error/Warning:
-Warning: could not find the result in IBD_Sharing Analysis.
If you see this message, the notable grid files were not generated.
-Warning: There is no IBD_rate larger than Sharing_threshold(threshold) in
‘notable_grid_chr1’ that will not generate interval file.
If you see this message, you won’t get “CHR1_range.txt” as there is no rate greater
than Sharing_threshold in the IBD Sharing Analysis (notable_grid_chr1).
15
Linkage Analysis
Linkage analysis function is provided by the Merlin linkage function and FamPipe
selects the regions with p-values less than Linkage_pvalue (the default value is 0.05).
Command line options:
Calculate the Whittemore and Halpern NPL all.
--Linkage --npl:
Calculate the Whittemore and Halpern NPL pairs.
-Linkage --pairs:
Related options:
Specify the threshold of linkage p-value (default value is 0.05)
--Linkage_pvalue value
For example:
--Linkage_pvalue 0.1
Specify the grid for linkage analysis (Default is 1)
--grid value
For example:
--grid 0.5
Memory saving option. Turning on this option will significant reduce the
memory consumption in Merlin.
--smallSwap
PLINK prune threshold (variance inflation factor, VIF). FamPipe uses PLINK to
prune SNPs in LD using the VIF. SNPs that are not correlated are used for the
linkage analysis. The default value of VIF is 2. Please see the PLINK manual
“Linkage disequilibrium based SNP pruning” for more information.
--vif value
Example:
--vif 1.5
Output:
Two files (CHRX_linkage.txt and CHRX_range.txt) will be generated for each
chromosome. CHRX_linkage.txt saves the Merlin linkage results and
CHRX_range.txt saves the linkage regions (each row specifies the start and end
physical positions) with p-values less than Linkage_pvalue.
16
Error/Warning:
-Warning: could not find the result in linkage Analysis.
If you see this message, it means Merlin did not generate results.
-Warning: There is no pvalue smaller than Linkage_pvalue(threshold) in
‘CHR1_linkage.txt’. Interval file will not be generated.
If you see this message, you won’t get “CHR1_range.txt” as there is no pvalue less
than Linkage_pvalue threshold in Linkage output file (CHR1_linkage.txt).
For more information about the linkage analysis in Merlin, please see MERLIN
Tutorial -- Linkage Analysis.
http://www.sph.umich.edu/csg/abecasis/merlin/tour/linkage.html
17
Imputation Analysis
FamPipe provides imputation analysis based on two popular family-based imputation
tools Merlin and GIGI.
Command line options:
--Impute 1: Merlin Imputation
--Impute 2: GIGI Imputation
Merlin Imputation:
Merlin Imputation is performed using the --infer option in Merlin. PedCut is
automatically executed by FamPipe to split large pedigrees into sub-pedigrees, with
the bit size specified by the user. After imputation, the sub-pedigrees are merged
based on the original pedigree structures. If an individual is in several sub-pedigrees,
the individual may be imputed multiple times. During the merge, concordance calls
for the individual are reported and others are set as missing.
An interval file for each chromosome is required for running Merlin imputation.
Imputation will only be performed within the intervals defined in the interval file.
There are two ways to provide the interval file:
1. Generated by FamPipe after executing Linkage Analysis or IBD Sharing
Analysis. The interval files will be automatically used for the GIGI
imputation.
Note: If you see an error message “Error :: could not find interval file.”, that
means there were no intervals that met the threshold of Linkage_pvalue or
Sharing_threshold.
2. Provided by the user.
See “The interval file” in the input file section.
18
Related options:
The user can provide a cluster file to account for LD for the imputation.
--Cluster_file file_name
Ex:
--Cluster_file merlin.clusters
If the sample size is large, haplotype frequencies can be estimated automatically
based on the samples in FamPipe. FamPipe uses the Merlin options --rsq 0.1 -cfreq to generate the cluster file.
--Cluster_file generate
The haplotype frequencies estimated based on the 1000 Genomes Project can be
downloaded from our ftp site.
--Cluster_file ftp
Note: if running Merlin Imputation without any cluster file, you will see
“WARNING! - Could not open file 'CHR1.clusters' with clustering information!” on
console. Also please note that if the cluster file is not generated based on the samples,
markers in the haplotype that is observed in the sample but not in the cluster file are
dropped by Merlin. Please refer to the Merlin tutorial “Modeling marker-marker
linkage disequilibrium” for more details.
19
Merlin Imputation Output:
-merlin-infer.ped: the first five columns are Family_ID, Individual_ID, Father_ID,
Mother_ID, and Sex. Others represent each marker for every five columns
(Most_likely_genotype, Expected_Number_Alleles, P(G1), P(G2), P(G3)).
For example:
1 1 0 0 1 A/A 0 0 0 1 G/G 2 1 0 0
1 2 0 0 2 C/C 2 1 0 0 T/T 0 0 0 1
1 3 1 2 1 A/C 1 0 1 0 G/T 1 0 1 0
-merlin-infer.dat: Corresponding to the five columns of each marker in ped file.
For example:
M rs77544915
T COUNT(1,rs77544915)
C P(rs77544915=1/1)
C P(rs77544915=1/2)
C P(rs77544915=2/2)
M rs2154354
T COUNT(1,rs2154354)
C P(rs2154354=1/1)
C P(rs2154354=1/2)
C P(rs2154354=2/2)
Merged file: (X is the chromosome number)
check_infer_chrX.ped: The PLINK format ped file.
check_infer_chrX.map: The PLINK format map file.
check_infer_chrX.prob: the first six columns are the same as the fam file, others
represent each marker for every three columns (probability of genotypes 1/1, 2/1, and
2/2).
check_infer_chrX.dosage: the first six columns are the same as fam file, other
columns are the Expected_Number_Alleles for the SNPs.
20
GIGI imputation:
GIGI can use large extended pedigrees for the imputation. Therefore, pedigrees are
not split in GIGI. These three input files are required for the GIGI imputation:
1. A GWAS file for each chromosome
2. A NGS file for each chromosome
3. An interval file for each chromosome if not running FamPipe with IBD or linkage
analysis
Please place them in the same folder that you placed the bed file, bim file, and fam
file.
Please refer to the descriptions of GWAS and NGS SNP List Files in the input file
section for the format of the files. The interval file can be generated in the same way
as described in the previous section (Merlin imputation).
GIGI Imputation Output (X is the chromosome number):
merge_chrX.ped: The PLINK format ped file.
merge_chrX.map: The PLINK format map file.
merge_chrX.prob: The first six columns of this file are the same as the Fam file.
Other columns represent each marker for every three columns which are the
probabilities of genotypes1/1, 2/1, and 2/2.
merge_chrX.dosage: the first six columns are the same as fam file, other columns are
the Expected_Number_Alleles for the SNPs..
21
Association test
Two family-based association tests can be performed in FamPipe. If imputations were
performed, FamPipe will use the ped file with the imputed data to run the association
tests.
Command line options:
Running OVPDT. OVPDT is a SKAT-type family-based association test for rare
variants.
-- Association 1
Running FBAT. FBAT is a burden-type family-based association test for rare
variants.
-- Association 2
Related options:
An annotation file is required to run the association test.
--Anno_file filename
Ex:
--Anno_file annotation.txt
Association in the presence of linkage. By default, association tests will be
performed for all genes provided in the annotation file. Alternatively, association
tests can be performed in linkage regions to save running time. This is
particularly useful when imputation is performed in linkage regions and
association tests are performed based on the imputed data. This option should be
used with --Linkage.
--APL
22
Error/Warning:
Error : could not find '--Anno_file'.
If you see this message, please check your Annotation_chr1.txt file whether is in the
same folder that you place bed file, bim file and fam file.
Association test Output:
For example: Association_chr1.txt
Gene
#_of_SNPs p_value
TBX15 354
0.551
There are three columns in the association test result file. The first column is the name
of genes, the second column is the number of snps in genes and the third columns is
the association p_value.
23
Disease model
FamPipe offers two types of disease model. For the first type of disease model, a
variant will be predicted as a dominant, recessive, or none disease mode using the
disease model identification (DMI) algorithm.. Segregation score and rareheterozygote-rule-out (RHRO) mapping status for each variant will also be calculated.
For the second type of disease model, FamPipe checks whether SNPs within a gene
follow the rules of compound heterozygosity.
Command line options:
The first type of disease model.
--Disease_model 1
--Freq_score threshold_file
Compound heterozygosity.
--Disease_model 2
Disease model type 1:
Predicted disease model:
The dominant and recessive mode for a variant is predicted by checking whether the
allele transmissions in families follow a Mendelian dominant or recessive disease
patterns. We assume the minor allele is the disease allele (i.e., D). The disease models
are determined by the following rules:
Disease model d:
The SNP follows a dominant model. For an affected individual, the genotype at this
SNP should be DD or Dd. For an unaffected individual, the genotype at this SNP
should be dd.
If the percentage of people who match this rule is greater than
Disease_model_threshold and the percentage of missing value is less than (1 Missing_tolerance_threshold), this SNP will be defined as d.
Disease model r:
The SNP follows a recessive model. For an affected individual, the genotype at this
SNP should be DD. For an unaffected individual, the genotype at this SNP should be
Dd or dd.
24
If the percentage of people who match this rule is greater than
Disease_model_threshold and the percentage of missing value is less than
Missing_tolerance_threshold, this SNP will be defined as r.
Disease model n:
The SNP follows neither a dominant nor a recessive model.
Disease model m:
The percentage of Missing value is greater than Missing_tolerance_threshold.
Note: if you only have a few pedigrees, please consider using external allele
frequency file (e.g., by specifying the --Freq_file) so that D and d can be properly
determined.
Segregation scores:
The segregation scores are calculated based on the algorithm in MendelScan
(http://gmt.genome.wustl.edu/mendelscan).
Assuming a dominant model, for a variant, an individual is scored as follows:
Affected with dd: 0.5
Affected with DD: 0.8
Unaffected with Dd: 0.1
Other: 1
A dominant segregation score is calculated by multiplying the scores for all
individuals for the variant.
Assuming a recessive model, for a variant, an individual is scored as follows:
Affected with dd: 0.1
Affected with Dd: 0.5
Unaffected with DD: 0.1
Other: 1
A recessive segregation score is calculated by multiplying the scores for all
individuals for the variant.
RHRO status:
The RHRO status is determined also based on the algorithm in MendelScan.
Assuming a dominant model, if all affected individuals have Dd at a variant, the
variant is labeled as SharedHet. If at least one affected have Dd and at least one
affected have dd, the variant is labeled as RareHet. The variant is labeled as RuleOut
for other situations.
25
Predicted disease model:
If --Freq_score is specified, The dominant and recessive mode for a variant is
predicted by checking whether the allele transmissions in families follow a Mendelian
dominant or recessive disease patterns. We assume the minor allele is the disease
allele (i.e., D). The disease models are determined by the following rules:
Disease model d:
The SNP follows a dominant model. For an affected individual, the genotype at this
SNP should be DD or Dd. For an unaffected individual, the genotype at this SNP
should be dd.
If the percentage of people who match this rule is greater than
Disease_model_threshold and the percentage of missing value is less than (1 Missing_tolerance_threshold), this SNP will be defined as d.
Disease model r:
The SNP follows a recessive model. For an affected individual, the genotype at this
SNP should be DD. For an unaffected individual, the genotype at this SNP should be
Dd or dd.
If the percentage of people who match this rule is greater than
Disease_model_threshold and the percentage of missing value is less than
Missing_tolerance_threshold, this SNP will be defined as r.
Disease model n:
The SNP follows neither a dominant nor a recessive model.
Disease model m:
The percentage of Missing value is greater than
Missing_tolerance_threshold.FamPipe will use the DMI algorithm to classify each
variant into a disease model (autosomal dominant (coded as d), autosomal recessive
(coded as r), or none (coded as n)). The DMI algorithm needs a threshold file, which
contains thresholds for different minor allele frequencies. The DMI algorithm will
classify a variant into a disease model if its segregation score is greater than the
threshold with similar minor allele frequency to the variant in the threshold file. The
thresholds are determined by pedigree structures and therefore should be generated
based on the pedigrees you are analyzing. Step-by-step instructions of how to
generate a score file can be found here (link to the get score file).
Note: if you only have a few pedigrees, please consider using external allele
26
frequency file (e.g., by specifying the --Freq_file) so that D and d can be properly
determined.
Related options:
--Disease_model_threshold value (Default value is 0.8)
Ex:
--Disease_model_threshold 0.9
--Missing_tolerance_threshold value (Default value is 0.1)
Ex:
--Missing_tolerance_threshold 0.2
Output:
The output of the disease model shows the predicted disease model status, segregation
scores and RHRO status of every marker.
For example:
valid_marker_chr1
marker_name Predicted_model Dominant_Segregation_Score
Recessive_Segregation_Score
RHRO
snp1 r
4.97323e-33 1
RuleOut
snp2 n 1.26218e-29 1e-96
RuleOut
snp6 n 6.25e-45 3.55271e-60 RaredHet
snp7 n 1.03398e-27 1.2207e-87 RaredHet
snp8 n 1.26218e-29 1e-96
RuleOut …
…
Disease model type 2:
The five rules proposed by Kamphans et al. (PLOS ONE 2013), with some relaxation
based on different thresholds, were used to determine whether SNPs in a gene follow
compound heterozygosity:
1.
A variant has to be in a heterozygous state (Dd) in at least
(compound_rule1*100)% of affected individuals. (The proportion of affected
people who match this condition must be greater than compound_rule1.)
2.
A variant must not occur in a homozygous state in at least
(compound_rule2*100)% of the unaffected individuals. (The proportion of
27
3.
4.
5.
unaffected people who match this condition must be greater than
compound_rule2.)
A variant that is heterozygous in an affected child is heterozygous in exactly one
of the parents. At least (compound_rule3*100)% of affected children must
follow this rule.
A gene has two or more heterozygous variants in at least
(compound_rule4*100)% of the affected individuals.
In an affected child, there is at least one variant transmitted from the paternal
side and one transmitted from the maternal side. At least
(compound_rule5*100%) of the affected children follow the rule.
Note that when all compound_rule thresholds are set to 1, the rules are the same as the
rules described in Kamphans et al. (PLOS ONE 2013).
Related options:
--compound_rule1 value (Default value is 1)
--compound_rule2 value (Default value is 1)
--compound_rule3 value (Default value is 1)
--compound_rule4 value (Default value is 1)
--compound_rule5 value (Default value is 1)
28
Output:
There are two columns in the output of compound heterozygosity, the first column is
the name of gene, the second column is the count of SNPs in the gene which match
the five rule.
For example: compound_heterozygosity_result_chr1.txt
Gene_name #_of_SNPs
TBX15 5
Other options
--verbose:
By default FamPipe does not output the screen output for the external programs to
keep the screen clean. Use this option to check the running details for the external
programs.
29
The Four Commonly Used Scenarios
The four commonly used scenarios are discussed in the FamPipe paper. We described
the workflows for each of the scenarios.
Scenario 1 (Small sample size, filtering based approach):
PLINK files -> Calculate allele frequency -> Generate MERLIN map file -> Check
large pedigree -> (PedCut) -> Split by chrom -> Prune for LD -> IBD sharing analysis
-> Disease model -> Filtering -> Write results
Command line:
./fampipe --BED test.bed --BIM test.bim --FAM test.fam --IBD_Sharing -Disease_model 1 --Anno_file annotation.txt
Output:
For example: Association_IBD_chr1.txt
This output file contains all columns in the annotation file and additional four
columns which are IBD_rate, IBD_count, IBD_num_of_pair and Disease_model.
Scenario 2 (Large sample size, association test in linkage regions):
PLINK files -> Calculate allele frequency -> Generate MERLIN map file -> Check
large pedigree -> (PedCut) -> Split by chrom -> Prune for LD -> Linkage analysis ->
Generate intervals -> (Generate cluster file -> Imputation -> Merge the imputed file) > Run association test -> Write results
Command line:
./fampipe --BED test.bed --BIM test.bim --FAM test.fam --Linkage --npl -Association 1 --Impute 1 --Anno_file annotation.txt
Output:
For example:Association_linkage_chr1.txt
Gene_name #_of_SNPs p_value Linkage_LOD
TBX15 354
0.516
0.01
This output contains four columns, the first column is the name of genes, the second
column is the number of SNPs in genes, the third columns is the association p_value
30
for genes and the fourth column is the values of Linkage LOD score for genes..
Scenario 3 (Large sample size, association test for all chromosomes):
PLINK files -> Calculate allele frequency -> Generate MERLIN map file -> Check
large pedigree -> (PedCut) -> Split by chrom -> Run association test -> Write results
Command line:
./fampipe --BED test.bed --BIM test.bim --FAM test.fam --Annotation 1 --Anno_file
annotation.txt
Output:
Please see “Association test Output”.
Scenario 4 (Imputation only):
PLINK files -> Calculate allele frequency -> Generate MERLIN map file -> Check
large pedigree -> (PedCut) -> Split by chrom -> Generate intervals (from external
interval files) -> Generate cluster file -> Imputation -> Merge the imputed file
Command line:
./fampipe --BED test.bed --BIM test.bim --FAM test.fam --Impute 1 …
Output:
Please see “Imputation output”.
31
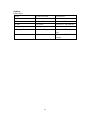
Option:
Input/output
option
Parameter/default
Description
--BED
“file_name”
Please see “The bed file”
--BIM
“file_name”
Please see “The bim file”
--FAM
“file_name”
Please see “The fam file”
--Freq_file
0/”file_name”
Please see “The freq file”
--Cluster_file
0/generate/file_name
Please see “The cluster
file”
--out
“file_name”
Please see “The folder of
output”
32
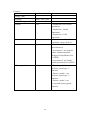
Function
option
Parameter/default
--Rutger_Map
0
--Linkage
{null}/--npl/--pairs
--IBD_Sharing
0
--Impute
0/1/2
Description
--Imputation 0: No execute
imputation
--Imputation 1: Merlin
Imputation
--Imputation 2: GIGI
Imputation
--interval
0
File name must follow this
regulation “range_chrX.txt”
--Association
0/1/2
--Association 0: No execute
association test.
--Association 1: use Ordered
subset Variable threshold
Pedigree Disequilibrium Test
(OVPDT).
--Association 2: use Family‐
based Association Test (FBAT).
--Disease_model
0/1/2
--Disease_model 0: not use
“Disease_model type 1”
function.
--Disease_model 1: use
“Disease_model type 1”
function.
--Disease_model 2: use
“compound heterozygosity”
function
33
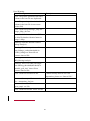
Threshold
option
default
Description
--Linkage_pvalue
0.05
--IBD_threshold
0.5
if p_value< 0.05, the grid is reported.
If 有 IBD 的機率>0.5, the pair of
individuals is defined as IBD sharing.
--grid
1
The gap of position in the output file of
Linkage and IBD Analysis.
--plink-vif
2
plink --indep 50 5 2
--Sharing_threshold
0.5
If the number of pairs with IBD sharing/
number of pairs > Sharing_threshold, the
grid is reported.
--Disease_model_threshold
0.8
The percentage of people who matches
the rule for each marker has to be greater
than this threshold.
--Missing_tolerance_threshold
0.9
The percentage of non-missing value for
each marker has to be greater than this
threshold.
--compound_rule1
0.1
--compound_rule2
0.5
--compound_rule3
0.5
--compound_rule4
0.8
--compound_rule5
1
--smallSwap
0
--verbose
0
--plink-path
--merlin-path
--pedcut-path
--Freq_score
34
Error/Warning:
Error/Warning
Description
Error: The genetic position in the third
column in the bim file are duplicated.
Error: The genetic position in the third
column in the bim file is not correct.
(value<500)
Error: could not open Rutger_Map file ::
Rutger_Map_chr1.txt.
Error: Can’t find more than one SNP in
the bim file that has identical name in
Rutger’s Map.
Warning: could not find the result in
linkage Analysis.
Warning: There is no pvalue smaller
than Linkage_pvalue(threshold) in
‘CHR1_linkage.txt’ that will not
generate interval file.
Warning: could not find the result in
IBD_Sharing Analysis.
Warning: There is no IBD_rate larger
than Sharing_threshold(threshold) in
‘notable_grid_chr1’ that will not
generate interval file.
Error: could not find interval file.
Cannot find any interval for GIGI
imputation, please see “Interval file”.
Error: could not open file Annotation
file :: Annotation_chr1.txt.
Error: could not find file
'gwas_snps1 .txt' file.
Error: could not find file 'NGS1.lst' file.
35
Citation
Please cite the FamPipe paper:
Kang CY, Yao PJ, Tsai WY, Chung RH. 2015. FamPipe: An automatic analysis
pipeline for analyzing sequencing data in families with complex diseases. Submitted.
Because different resources are integrated in FamPipe, please cite the corresponding
papers if you performed analyses based on the following approaches:
PedCut:
Liu, F., et al. An approach for cutting large and complex pedigrees for linkage analysis.
European journal of human genetics : EJHG 2008;16(7):854-860.
Merlin:
Abecasis, G.R., et al. Merlin--rapid analysis of dense genetic maps using sparse gene
flow trees. Nature genetics 2002;30(1):97-101.
GIGI:
Cheung, C.Y., Thompson, E.A. and Wijsman, E.M. GIGI: an approach to effective
imputation of dense genotypes on large pedigrees. American journal of human
genetics 2013;92(4):504-516.
FBAT:
De, G., et al. Rare variant analysis for family-based design. PloS one
2013;8(1):e48495
OVPDT:
Chung, R.H., Tsai, W.Y. and Martin, E.R. Family-based association test using both
common and rare variants and accounting for directions of effects for sequencing
data. PloS one 2014;9(9):e107800
36
Suggestions/Bug report
Please contact us if you encounter any difficulties running FamPipe. If you would like
FamPipe to include your software or would like to suggest new functions in FamPipe,
you are also welcome to contact us. The email should be sent to [email protected].
37