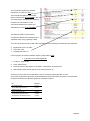
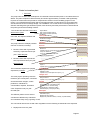
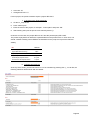
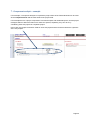
1
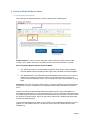
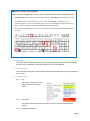
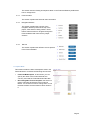
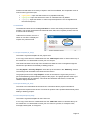
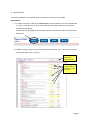
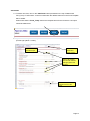
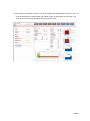
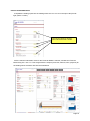
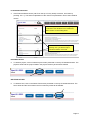
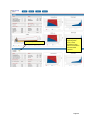
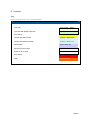
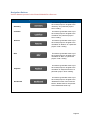
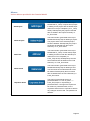
Assignment 29: Strategic UDF Investing and Project Structuring Appendix 3a: Project Structuring and Strategic Investing – User Manual Version 02d 6 September 2013 DISCLAIMER: This document has been produced with the financial assistance of the European Union. The views expressed herein can in no way be taken to reflect the official opinion of the European Union. Sole responsibility for the views, interpretations or conclusions contained in this document lies with the authors. No representation or warranty express or implied will be made and no liability or responsibility is or will be accepted by the European Investment Bank or the European Commission in relation to the accuracy or completeness of the information contained in this document and any such liability is expressly disclaimed. This document is provided for information only. Neither the European Investment Bank nor the European Commission gives any undertaking to provide any additional information or correct any inaccuracies in it. Table of Contents 1. Disclaimer ..................................................................................................................................... 4 2. Purpose of the Financial Model .................................................................................................. 5 3. Financial Model guidance sheet ................................................................................................. 7 4. 3.1 Opening the Financial Model ........................................................................................ 7 3.2 Map sheet ..................................................................................................................... 8 3.3 Table of contents .......................................................................................................... 8 3.4 Instructions Sheet ......................................................................................................... 8 3.5 Inputs Sheet .................................................................................................................. 9 3.6 Dashboard .................................................................................................................. 10 3.7 Project Template (Pr_temp)........................................................................................ 10 3.8 Project Summary (Pr_Sum) ........................................................................................ 10 3.9 Fund Template (Fund_temp) ...................................................................................... 10 3.10 Fund Summary (Fund_Sum) ...................................................................................... 11 3.11 Holding Sheet ............................................................................................................. 11 Instructions ................................................................................................................................. 12 ADD A PROJECT ........................................................................................................................................ 12 ADD A FUND ............................................................................................................................................. 14 UPDATE THE HOLDING INPUTS ................................................................................................................ 16 IF THE CHECKS ARE ACTIVE....................................................................................................................... 17 DELETING A PROJECT................................................................................................................................ 17 NAVIGATING BETWEEN THE THREE LEVELS ............................................................................................. 18 USING THE DASHBOARD .......................................................................................................................... 18 USING THE SUMMARY SECTION ............................................................................................................... 19 MACROS WARNING .................................................................................................................................. 19 DASHBOARD ............................................................................................................................................. 19 NAVIGATE BETWEEN SHEETS ................................................................................................................... 21 UNPROTECT SHEETS ................................................................................................................................. 21 5. Funding assumptions ................................................................................................................ 22 6. Case studies – examples........................................................................................................... 25 7. Component analysis - example ................................................................................................ 30 Page 2 8. Annexes ...................................................................................................................................... 31 Key Colour coding used in the Financial Model ............................................................................. 31 Navigation Buttons Various buttons present in the Financial Model for client use ................... 32 Macros Various Macros provided in the Financial Model .............................................................. 33 Definition list ...................................................................................................................................... 34 Page 3 1. Disclaimer On 15th March 2013, the Mazars Consortium was appointed to carry out the 29th Assignment issued under the European Investment Bank's Framework Agreement for services to be provided within the context of the JESSICA initiative, titled Strategic UDF Investing and Project Structuring. The Financial Model and the accompanying user guide has been built under the Assignment as a tool to assess the impact of introducing Financial Instrument on the viability of urban investments at the different investing levels i.e. at project and project portfolio level. It should not be used for any other purpose. Users should note that the Financial Model is of a medium level of complexity, therefore, it is suggested that users will need to familiarise themselves with its operations as set out in this guide. Please note that the Financial Model does not contain the full complexities of a full project finance Financial Model and users may need to adopt some “simplified” assumptions when entering project data. Page 4 2. Purpose of the Financial Model The Financial Model is a tool to assess the impact of introducing Financial Instrument on the viability of urban investments at the different investing levels: Project Level Fund Level and Holding Level This Financial Model has been designed for relevant stakeholders currently involved or interested in using Financial Instrument. It is specifically designed for Managing Authorities and prospective fund managers, etc. who does not have high-level modelling tools to evaluate the impacts of Financial Instruments on projects or funds in order to make strategic investment decisions. For each level, a cashflow is calculated as well as key indicators such as the payback periods, Internal Rate of Return (IRR), Net Present Value and the financial index (see the definition list in Annex). The Financial Model has the flexibility to add and delete projects and funds using macros. All the calculations present in the Financial Model are before tax. The impacts of the tax legislation which vary between countries within the European Union are not taken into account in this Financial Model. An analysis outside the Financial Model should be carried out to take into account the tax impacts. Please find below the conceptual map of the Financial Model: Page 5 Model Inputs Project Level Fund Level E.g. Project 1 - Fund 1 Project 2 - Fund 2 Project 3 - Fund 1 Project Start Project Template Project 1 Project 1 Project 2 Project 3 Project 2 Project 3 Projects Summary Fund 1 Fund 2 Holding Level Fund Start Fund Template Fund 1 Fund 2 Fund 3 ¦ ¦ ¦ ¦ ¦ ¦ ¦ ¦ Project n Fund n Project End Fund End Funds Summary Holding Fund Key Outputs and Graphs Key Outputs and Graphs Dashboard Page 6 3. Financial Model Guidance Sheet 3.1 Opening the Financial Model When opening the Financial Model, you will be directed to the following tab: Enable Content: In case of security warnings, before continuing, please press 'Enable Content'. Then, please choose the calculation mode to be used: automatic or manual. Select Automatic Mode or Manual Financial Model The “Automatic mode” is recommended for beginner Excel Users. Using Automatic Financial Model will avoid pressing further keys to fully calculate the Financial Model. The “Manual Mode” is recommended for proficient/advanced Excel Users. To see the results of any changes to inputs you make, you will need to press the F9 key. All macros include a calculation routine, so you should not need to press F9 after running these. Disclaimer: Once, the calculation mode chosen, you will be directed to the disclaimer sheet. Please press “Accept” to signify that you understand and accept the disclaimer contained there. Please note that the Financial Model utilises a limited amount of VBA (Visual Basics for Applications) and therefore you may need to adjust your security settings to allow the code to run. Additionally several of the Financial Model calculations rely on functions contained within the Analysis Tool pack add-in, which you will need to make sure is installed (the Excel help function can assist with this). The Financial Model has been build using the FAST Financial Modelling standard. For more guidance on the standard and how you can best use its structure, please visit www.faststandard.org. Page 7 QUICK TIP – (Under a UK keyboard) Below are some navigation tips to enable you to move efficiently around the Financial Model: Ctrl+page down will move you one worksheet to the right. Ctrl+page up will move you to the left. To navigate to the source of a figure or value in the Financial Model, press Ctrl+ [. This is particularly helpful if you want to navigate from a value in the working sheet back to the source input, or from an output in the summary sheet to where it is calculated. Once you’ve used Ctrl+ [you can return to your original location by pressing the F5 key followed by ‘enter’. 3.2 Map sheet This sheet displays graphically the flow of the Financial Model. It illustrates the three levels (project, fund, and Holding Fund levels) building up the Financial Model. 3.3 Table of contents This sheet lists all the sheets of the Financial Model and provides links to bring you directly to each of them. 3.4 Instructions Sheet 3.4.1 Key This section explains the colour coding used in the Financial Model. 3.4.2 Instructions This section lists the instructions to follow in order to use the Financial Model correctly. 3.4.3 Funding assumptions Page 8 This section lists the funding assumptions taken in the Financial Model by default and how to change them. 3.4.4 Financial Index This section explains the financial index calculation. 3.4.5 Navigation Buttons This section explains the purpose of the navigation buttons present at the top of the project, fund and the holding sheets. These buttons make it easier to navigate through the Financial Model and reach the key output sections. 3.4.6 Macros This section explains the different macros present in the Financial Model. 3.5 Inputs Sheet This sheet includes the basic assumptions used in the Financial Model. It includes the following two sections: • • Financial Model Inputs: in this section you can specify the name of the Financial Model, the currency used and the Financial Model start date. Non-changeable Technical Inputs: this section is used to set basic parameters of the Financial Model. You should not need to change them. It has the basic timeline and the tolerance level values in it. Page 9 Please note that there are a variety of inputs in the Financial Model, and a separate colour is used for each type of the input: Light yellow: input cells which have to be populated manually. Light green: input cells which have a link or calculated value by default. Light grey: input cells where no value is expected (these are non-changeable and the technical inputs). 3.6 Dashboard The dashboard sheet shows the key indicators to monitor the holding fund and a particular portfolio. This section summarises the Financial Index, IRR, NPV, Payback periods, Sources of Funds and the Gearing. Under the fund section, there is a switch on cell ‘E51’ to display the outputs of a particular fund. 3.7 Project Template (Pr_temp) The sheet is a general template for the project level. A new copy of this sheet is created whenever the “Add Project” button is clicked at the top of the worksheet. You will be able to name your new Project. This sheet has buttons at the top of the worksheet to allow the user to navigate through the sheet and to provide the functionality of adding projects. The “Key Inputs” and “Key Outputs” are at the top of the sheet in the “Summary” section. The workings and calculations are below this first section. The graphs present in the “Key Outputs” section of the sheet are a good way to have a quick understanding of the underlying shape of the project. The graphs present at the top of the sheet display the net cashflow, commercial and JESSICA debt service, Private and JESSICA Equity distributions. 3.8 Project Summary (Pr_Sum) This sheet is an intermediate sheet which let to summarise all the projects calculations. No inputs are required in this sheet. This sheet is dynamic and is updated automatically when adding or deleting projects. 3.9 Fund Template (Fund_temp) The sheet is a general template for the Fund level. A new copy of this sheet is created whenever the “Add Fund” button is clicked at the top of the worksheet. You will be able to name your new Fund as you like, for example: LEEF, Foresight, Merseyside, or Evergreen Page 10 This sheet has buttons at the top of the worksheet to allow the user to navigate through the sheet and to provide the functionality of adding funds. The sheet includes general fund characteristics such as name, Indexations, revenue sources, Costs and Management Fees, which is entered as a % of JESSICA loan Balance. The consolidated cashflows of the projects constitutes the cashflows of the fund (of which the project is a part of) and are further used at a portfolio level for the calculations of the key indicators such as Financial Index, IRR, NPV, Payback periods, Sources of Funds and the Gearing, which go to the Fund Summary and finally to the Dashboard. As for the project sheet, the graphs present in the Key Output section of the sheet show the net cashflow, commercial and JESSICA debt service, Private and JESSICA Equity distributions. 3.10 Fund Summary (Fund_Sum) This sheet is an intermediate sheet which summarises all the funds cashflows. This sheet then flows to the “Holding” Sheet and “Dashboard” Sheet. 3.11 Holding Sheet The sheet is a final calculation sheet. This sheet has buttons at the top of the worksheet to allow the user to navigate through the sheet. The sheet includes the general requirements such as name, Indexations, revenue sources, Costs and Management Fees, which is entered as a % of JESSICA loan Balance. The consolidated cashflow of all the funds constitutes the cashflow of the Holding Fund. . This cashflow is then used in to calculate key indicators at holding level: financial Index, IRR, NPV, Payback periods, Sources of Funds and the Gearing. This information can be found at the top of the Holding Fund sheet or at the top of the Dashboard. Page 11 4. Instructions This section explains in more details step-by-step how to use the Financial Model. ADD A PROJECT 1.1 To add a new project, click on the 'Add Project' button presented on the top of Dashboard/ Pr_Temp / Projects sheet. A new project sheet with the default values as in the Project Template will be added. Please note that 'Pr_Temp' is the template sheet for the project level. No inputs should be added here. 1.2 Update the project inputs into the particular project sheet from row 13 to row 75 in the input cells (format: light yellow + border). Financial Model and Project specific checks All the light yellow marked cells with borders are used for input. Page 12 1.3 Input the Portfolio / Fund name of which the project is a part of in cell F14. Portfolio / Fund name/number input cell. Choose the fund name from the drop down list. 1.4 If the selected calculation mode is manual, calculate the Financial Model using Ctrl + Alt + F9. This will generate the outputs (Cash flow, Returns, NPV, and Payback) for the projects. The Cash flow of the projects would also flow into the selected fund. Page 13 ADD A FUND 2.1 To add a new fund, click on the 'Add Fund' button presented on the top of Dashboard/ Fund_Temp / Funds sheet. A new fund sheet with the default values as in the Fund Template will be added. Please note that the 'Fund_Temp' sheet is the template sheet for the fund level. No inputs should be added here. 2.2 Update the fund inputs into the particular fund sheet from row 13 to row 43 in the input cells (format: light yellow + border). Macro generated Input, Fund no. Financial Model and sheet specific Input to be entered into the cells marked with light yellow and borders. IRR details of the projects active in this fund. Page 14 2.3 If the selected calculation mode is manual, calculate the Financial Model using Ctrl + Alt + F9. This will generate the outputs (Cash flow, Returns, NPV, and Payback) for the funds. The Cash flow of the funds would also flow into the holding sheet. Page 15 UPDATE THE HOLDING INPUTS 3.1Update the holding inputs into the holding sheet row 13 to row 43 in the input cells (format: light yellow + border). Inputs to be entered into the light yellow cells marked with a border. 3.2If the selected calculation mode for the Financial Model is manual, calculate the Financial Model using Ctrl + Alt + F9. This will generate the outputs (Cash flow, Returns, NPV, payback) for the holding which will further flow into the Dashboard. Page 16 IF THE CHECKS ARE ACTIVE 4 If the Financial Model checks (cell G2 on the top of every sheet) are active, trace them by pressing 'Ctrl + ['. The further explanations of the checks are presented in front of the individual checks. Press ‘Ctrl + [‘on cell ‘G2’ of the Holding/ Project/ Fund sheet. This will direct to the ‘Checks and Alerts’ section on the Holding Sheet. The check links can be traced by pressing ’Ctrl + [‘or with the help of instructions written on the side. DELETING A PROJECT 5 To delete a project, click on 'Delete Project' button presented on the top of Dashboard sheet. The project's sheet and the project's data in the project summary sheet will be deleted. DELETING A FUND 6 To delete a fund, click on the Delete Fund button presented on the top of Dashboard sheet. The fund's sheet and the fund's data in the fund summary sheet will be deleted. Page 17 NAVIGATING BETWEEN THE THREE LEVELS 7 To navigate to different parts of a Project / Fund / Holding sheet use the different navigation buttons provided at the top of these sheets. (Summary, Cashflow, Returns, NPV, Payback). USING THE DASHBOARD 8 To navigate to the Dashboard sheet from the Project / Fund / Holding Sheet, use the navigation button provided at the top of these sheets. The Dashboard provides the user with an additional functionality of Deleting Projects and Funds. Dashboard Button Page 18 USING THE SUMMARY SECTION 9 'Summary' section presented at the top of Projects / Funds / Holding sheets consists of 'Key Inputs', 'Key Outputs' (Financial Index, IRR, NPV, Payback periods, Sources of Funds, Gearing %) and Graphs. MACROS WARNING 10 When saving the Financial Model, you may have a privacy warning, just press ‘Ok’ to continue. Press to Save the File. DASHBOARD 11 Other information: The Dashboard has a switch to change between funds in the funding section which can be used to see the output graphs of a particular fund. Page 19 Switch to change the fund Key Output Graphs depicting Cash flows, Loans, Equities for each Fund in accordance with the switch selected. Page 20 NAVIGATE BETWEEN SHEETS 12 In order to navigate more easily between the sheets, a window has been created with the list of the sheets available in the Financial Model. Press: Ctrl + Shift + J and the following window will appear: If you want to go to the ‘Dashboard’ sheet for example, just click on ‘Dashboard’ and press ‘Activate’. Click ‘Cancel’ to close the window. UNPROTECT SHEETS 13 Once open, the Financial Model will be automatically protected which means that only the cells in yellow could be modified. If you are an advanced user of excel and want to make any changes in terms of Financial Modelling, you have the possibility to do so by unprotecting the Financial Model and use the following password: ‘Mazars’. However, please note that should the sheets be deleted or renamed manually, the macros not will worked properly. FINANCIAL MODEL SPEED 14 After adding 10 projects and 10 funds approximately, the Financial Model may operate slightly slower, and therefore, can take up to 1 minute to add a new project or a new fund. Page 21 5. Funding Assumptions 1. In the Base Case, 100% of the debt is provided as a commercial loan. However, it can be divided into commercial loan and JESSICA loan as and when required. Similarly, equity funding is 100% from private equity which can be divided into private equity and JESSICA equity as and when required. Enter the % input for’ Commercial Loan ‘and ‘Private Equity’. JESSICA % will get automatically calculated. Page 22 2. By default, the debts are repaid on an annuity basis. However, this can be changed in cells F61 and G61 by selecting ‘2’ and then by entering a manual profile row 269 and 292. Enter the Repayment term and select the repayment profile, ’1’ for ‘Annuity’ and ‘2’ for ‘profiled’. Page 23 3. In the Base Case, Private equity and JESSICA equity are repaid equally depending on the cash availability. As, Private Equity and JESSICA equity repayments are one time repayments on the dates entered by the user, the date can be changes, for example to repay the JESSICA equity before the private equity. By default the repayment date is the end of the concession. Enter the ‘%age Share in Cash for Repayment of Private Equity’ and the redemption date. Page 24 6. Case studies – Examples In this section, there are examples on how to use the Financial Model step-by-step with two simple case studies. a. Multicentre (Urban project) i. Summary The project is the construction of a multicentre in France and involves a multi-functional facility for 2 culture, entertainment, and commercial purposes. The Centre will be approximately 15,000 m . The construction will start in 2013 and will last two years. In France, the expected inflation rate (RPI) is 3% per year. All spaces created by the Project will be commercialized and relevant agreements signed with large retail and service chains. Revenue from ticket sales (cinemas, artist exhibitions, other entertainment facilities) : expected revenue per year : €80.000/year Rent collection from the leasing of newly developed commercial space (large retail, food, and services chains) : expected revenue per year : €600.000/year Based on the business plans, the investors are planning to sell the multicentre after 25 years of concession with a yield of 7.5%. Project Name Part of which Portfolio (name) Part of which Portfolio (number) Time Inputs Construction Start Year Construction Length Operations Length Indexation RPI Index Revenue Revenue 1 Revenue 2 If profile revenue, provide inputs here (Crtl + [ >>) Lump sum Revenue to be turned on to Lump sum Revenue Receipt Date Yes Project is of Real Estate? Rental Revenue Revenue from Property Sales? If yes, Revenue Yield % Capex Capex 1 Capex 2 If profile capex, provide inputs here (Crtl+ [ >>) Multicentre Fund1 1 label label # 2013 2 25 year# years years 3.00% % p.a. 80,000 31/Dec/39 € /year € /year link € date Yes 600,000 Yes 7.50% 1=Yes / 0=No € /year 1=Yes / 0=No % 7,000,000 - € € link F F Operating Cost Operating Cost 1 Operating Cost 2 If profile cost, provide inputs here (Crtl+ [ >>) 80,000 - Lifecycle Cost Lifecycle Cost 1 Lifecycle Cost 2 If profile cost, provide inputs here (Crtl+ [ >>) 100,000 - Funding Project Gearing [debt / (debt+ equity)] Commercial Loan % of Debt Funding JESSICA Loan % of Debt Funding Private Equity % of Equity Funding JESSICA Equity % of Equity Funding Debt Inputs Arrangement Fees % Loan Rate (%p.a.) Repayment Term (years) Repayment profile to be used (1=annuity, 2=profile based) If profile repayment, provide inputs here (Crtl+ [ >>) Grant Funding F € /year € /year link F € /year € /year link 80.00% 100.00% 100.00% - % % % % % Commercial Loan 1.00% 3.50% 15 1 F Page 25 JESSICA Loan - 20 1 F The investment requirement (capital expenditure or Capex) is €7m. There would potentially be associated labour costs as well: €80.000/year. The main project operating costs would be related to the maintenance of the commercial infrastructure space also called lifecycle costs: €100.000/year. The different parties involve want to calculate the different keys indicators and cashflows firstly using a gearing of 80%. The commercial loan terms are still under negotiation but the following characteristics are expected: Repayment terms: 15 years Loan rate: 3.5% Arrangement fees: 1% For this project, the private investors expect a project IRR of 10%. ii. In practice in the Financial Model 1. Go the Pr_Temp sheet 2. Press “Add Project” 3. Enter the name of the project, for example : “Multicentre” and press “OK” 4. Start entering the inputs as per the case summary above (i). Under this current case, the project IRR is 10.57% and the private equity IRR 14.15%. The private equity IRR is above the expected IRR from the private sector, therefore, it is reasonable to assume that this is an attractive project to the private investor. IRR Nominal Private Equity IRR 14.15% Project IRR before financing 10.57% Payback period Project Payback Period 15 years Private Equity Payback Period 19 years Commercial Loan Payback Period 14 years Page 26 b. Waste Incineration plant i. Summary The project will consist of the development of Combined Heat and Power plant on an industrial area in Wales. The plant will produce both electricity and heat of approximately 10.0 MW. It will significantly improve the environment and provide a comprehensive solution for the landfilling program in the region. It is envisaged that the facility will process approximately 153,000 tonnes of municipal waste and 36,500 tonnes of wet sewage sludge. The installation is to consist of two technological lines, an efficient multi-stage flue gas treatment system, with electricity and heat produced to be transmitted to the power grid and local heating network. The construction will start in 2013 and will last three years. In the UK, the expected inflation rate (RPI) is 3% per year. The project will have multiple potential sources of revenue, including: Revenue from sale of generated electricity; expected revenue per year : €300.000/year; Revenue from sale of produced heat; expected revenue per year : €220.000/year The investment requirement (capital expenditure) is €10m. The main project operating costs are related to gas consumption, connection and transmission charges, carbon production, maintenance, consumables, disposal, and labour costs. Expected costs per year: €70.000/year The different parties involve want to calculate the different keys indicators Project Name Part of which Portfolio (name) Part of which Portfolio (number) Power Plant Fund1 1 Time Inputs Construction Start Year Construction Length Operations Length 2013 3 25 Indexation RPI Index 3.00% Revenue Revenue 1 Revenue 2 If profile revenue, provide inputs here (Crtl + [ >>) Lump sum Revenue Lump sum Revenue Receipt Date 300,000 220,000 F 31/Dec/40 Project is of Real Estate? Rental Revenue Revenue from Property Sales? If yes, Revenue Yield % Capex Capex 1 Capex 2 If profile capex, provide inputs here (Crtl+ [ >>) No No 10,000,000 - F Operating Cost Operating Cost 1 Operating Cost 2 If profile cost, provide inputs here (Crtl+ [ >>) 70,000 - Lifecycle Cost Lifecycle Cost 1 Lifecycle Cost 2 If profile cost, provide inputs here (Crtl+ [ >>) - F F Funding Project Gearing [debt / (debt+ equity)] Commercial Loan % of Debt Funding JESSICA Loan % of Debt Funding Private Equity % of Equity Funding JESSICA Equity % of Equity Funding 70.00% 100.00% 100.00% Commercial Loan Debt Inputs Arrangement Fees % Loan Rate (%p.a.) Repayment Term (years) Repayment profile to be used (1=annuity, 2=profile based) 1.00% 4.50% 22 1 and cashflows firstly using a gearing of 70%. The commercial loan terms are still under negotiation but the following characteristics are expected: Repayment terms: 22 years Page 27 Loan rate: 4% Arrangement fees: 1% For this project, the private investors expect a project IRR of 8%. ii. In practice in the Financial Model 5. Go the Pr_Temp sheet 6. Press “Add Project” 7. Enter the name of the project, for example : “Power plant” and press “OK” 8. Start entering the inputs as per the case summary above (i). Under this current case, the project IRR is 2.75% and the private equity IRR 4.28%. The private equity IRR is far below the expected IRR from the private sector. In such case, one should consider including some JESSICA investments into the project to improve the financial viability. IRR Nominal Private Equity IRR 2.75% Project IRR before financing 4.28% Payback period Project Payback Period 20 years Private Equity Payback Period 29. years Commercial Loan Payback Period 17 years iii. Cashflow improvement At the top of the sheet, you will notice that one alert is activated. By pressing Crtl + [, on cell G3, the following elements will be shown with the details: Page 28 The alert indicates that the cash balance is negative in some periods. The revenues are not sufficient to cover the operating costs and service the debt in some periods. The following approaches could be taken to improve the cashflows: - find new sources of revenue without increasing the costs; optimise the financing : introduction of Financial Instruments or grant This list above is not exhaustive and will depend on each project, financing structure, and cost/revenue sources. c. Fund level With these two case study examples, one project (Multi-Centre) has an IRR which meet the private sector expectations and the other project (Waste Incineration Plant) does not. At fund level, these two projects will compensate each others to get a Private Equity IRR of 9.13%. Depending on the expected return of the fund, this could be an acceptable IRR. The fund level allows you to take a ‘portfolio’ approach to strategic investing. Page 29 7. Component analysis - example If for example, a component analysis is required the project sheet of the Financial Model can be used as the component level and the fund sheet as the project level. If for example there is a project composed of commercial space and residential space; and the project managers wants to follow the finances for these two spaces, separately, they can do so by considering each sub-project as a separate project. In this case, the project level will be used for each sub-project and the fund level will be the synthesis of the two projects. Page 30 8. Annexes Key Colour coding used in the Financial Model Cell Type Coding Used Input Cell Light Yellow + Border Input Cell with default value link Light Green + Border WIP Coding HARD YELLOW Counter flow within sheet Icy Blue + Black Font Counter flow between sheets Icy Blue + Blue Font Dead Values Colour Index 24 Import from other sheet MZR Blue Font Export to other sheet MZR Red Font Error Check Red Shade Alert Orange Shade Page 31 Navigation Buttons Various buttons present in the Financial Model for client use Navigation Button Summary Description This button (presented at the top of each sheet) helps to navigate to the 'Summary' of a particular project / fund / holding. Cashflow This button (presented at the top of each sheet) helps to navigate to the 'Cashflow' of a particular project / fund / holding. Returns This button (presented at the top of each sheet) helps to navigate to the calculation of 'Returns' of a particular project / fund / holding. NPV This button (presented at the top of each sheet) helps to navigate to the calculation of 'NPV' of a particular project / fund / holding. Payback This button (presented at the top of each sheet) helps to navigate to the calculation of 'Payback Period' of a particular project / fund / holding. Dashboard This button (presented at the top of each sheet) helps to navigate to the "Dashboard" sheet of the Financial Model. "Delete" Macros are present at the Dashboard sheet only. Page 32 Macros Various Macros provided in the Financial Model Macro Add Project Delete Project Add Fund Delete Fund Unprotect Sheet Description This macro button (presented at the top of Dashboard/ Pr_Temp / Projects sheet) helps in adding a new project with the default input values as in Project Template (i.e. Pr_Temp sheet). Subsequently the project's data will also be added in the Project Summary i.e. Pr_Sum sheet. This macro button (presented at the top of Dashboard sheet) helps in deleting a project. The project sheet of the selected project would be deleted. Subsequently the project would also be deleted from the Project Summary i.e. Pr_Sum sheet. This macro button (presented at the top of Dashboard/ Pr_Temp / Funds sheet) helps in adding a new fund with the default input values as in Fund Template (i.e. Fund_Temp sheet). Subsequently the new fund's data will also be added in the Fund Summary i.e. Fund_Sum sheet. This macro button (presented at the top of Dashboard sheet) helps in deleting a fund. The fund sheet of the selected fund would be deleted. Subsequently the fund would also be deleted from the Fund Summary i.e. Fund_Sum sheet. This macro (presented at the top of protected sheets i.e. from Pr_Start ---> Fund_Sum) helps in unprotecting a protected sheet. If changes are required to be made in a protected sheet, run the Unprotect Sheet macro to unprotect it before any changes can be made. The password is ‘Mazars’. i Page 33 Definition list Annuity repayment The repayment of debt is organised in such a way that the principal and interest payments are repaid over the tenor of the debt in order to produce a series of annual payments. Cashflow Cash flow is the movement of money into or out of a business, project, or financial product. It is usually measured during a specified, limited period of time. Measurement of cash flow can be used for calculating other parameters that give information on a company's value and situation. Cash flow can be used, for example, for calculating parameters: it discloses cash movements over the period. Capex Capital expenditures (CAPEX or capex) are expenditures creating future benefits. A capital expenditure is incurred when a business spends money either to buy fixed assets or to add to the value of an existing fixed asset with a useful life extending beyond the taxable year. Dashboard User interface to summarize the data at fund and holding levels Financial index The Financial index is an index to evaluate financially a project or a fund and compare projects/funds between them. The financial index helps to answer the following questions : Does my project/fund meet my private investors’ requirements? Does my project/fund is profitable? Does my project is in line with my overall financial strategy investment? At project level, the financial index is a weighted average index of 4 components : - - The difference between the Private Equity IRR of a project or a fund. The difference being limited between [-10;+10] The profitability index transformed on a scale of [-10;10] A number on a scale of [-10;10] chosen by the user to evaluate the size of the JESSICA amount used against the financial strategy investment of the fund; A number on a scale of [-10; 10] chosen by the user to evaluate the timing of the JESSICA amount used against the financial strategy investment of the fund. At fund level, the same logic has been applied to calculate the financial index apart for the two questions which only applied at project level. Gearing Gearing, called leverage in the US and some other countries, measures the extent to which a company is funded by debt. One common definition is: debt/ (debt + equity). IRR Internal Rate of Return. It is a rate is a rate of return used in capital budgeting to measure and compare the profitability of investments. Two types of IRR have been calculated: real and nominal. The real IRR is the IRR calculated without the inflation. Page 34 JESSICA Joint European Support for Sustainable Investment in City Areas Payback period The length of time required to recover the cost of an investment. Net Present Value Net present value: is defined as the sum of the present values of the individual cash flows of the same entity. Profitability Index (PI) Also known as profit investment ratio (PIR) and value investment ratio (VIR), is the ratio of payoff to investment of a proposed project. It is a useful tool for ranking projects because it allows you to quantify the amount of value created per unit of investment. Rules for selection or rejection of a project: Yield If PI > 1 then accept the project If PI < 1 then reject the project It is the percentage of rental income for the purchase price. The yield is calculated by dividing the gross annual rental income by the purchase price. Page 35