1
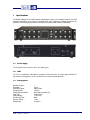
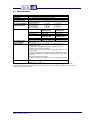
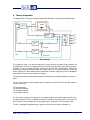
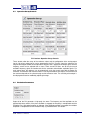
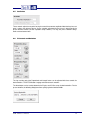
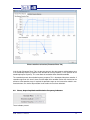
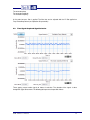
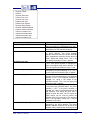
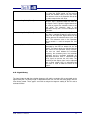
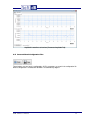
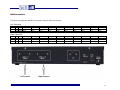
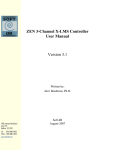
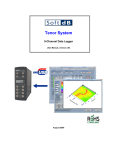
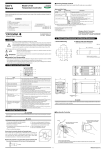
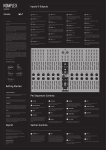
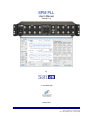
SPM PLL
User’s Manual
Version 1.8
by
In association with
January 2012
1040, avenue Belvédère, suite 215
Québec (Québec) G1S 3G3 Canada
Tél.: (418) 686-0993 Fax: (418) 686-2043
1
SPECIFICATIONS..........................................................................................4
1.1
Power Supply .......................................................................................................................4
1.2
USB .......................................................................................................................................4
1.3
Analog Inputs .......................................................................................................................4
1.4
Analog Outputs ....................................................................................................................5
1.5
PLL Performance .................................................................................................................6
2
THEORY OF OPERATION.............................................................................7
3
SOFTWARE AND HARDWARE INSTALLATION .........................................8
4
PLL USER INTERFACE.................................................................................9
4.1
Phase Detector Time Cte (s) ...............................................................................................9
4.2
Resonator Sweep.................................................................................................................9
4.3
Operation Set-up Controls................................................................................................11
4.4
Excitation Parameters .......................................................................................................11
4.5
Set-Points ...........................................................................................................................12
4.6
PI Controls and Switches..................................................................................................12
4.7
Loop-Response-Test Controls .........................................................................................13
4.8
Phase, Output Amplitude and Excitation Frequency Indicators ..................................14
4.9
Time Signal Graph and Signal Selection.........................................................................15
4.10
Signal History.....................................................................................................................16
4.11
Save and Recall Configuration Files ...............................................................................18
SPM - PLL User’s Manual
3
1
Specifications
The GXSM software for the SPM controller (model Mk3) includes a PLL module. However, the SPM
controller (model Mk3) can be used as a stand alone PLL when using the PC software described in this
document. The next figures present the front and the back of the SPM controller (model Mk3):
1.1
Power Supply
The PLL works with an external 5V (+-5%) power pack.
1.2
USB
The PLL is controlled by a Windows PC through a USB connection. The high-speed USB 2.0 PC
link provides a throughput in excess of 35 Mb/s in the read and write directions.
1.3
Analog Inputs
Number of Inputs:
Resolution:
Raw Noise Figure:
Sampling Rate:
Analog Input Bandwidth:
Input Type:
Input Leakage:
Anti-Aliasing Filter:
Dynamic Range:
Group-Delay:
SPM - PLL User’s Manual
1
16 bits
300 µV RMS
150 kHz
0 to 10 MHz (includes DC)
Single Ended
+-1 µA max
None
+-10V
2 samples
4
1.4
Analog Outputs
Number of Outputs:
Resolution:
Noise:
• 20MHz bandwidth:
• 20 kHz bandwidth:
Offset Drift with Temperature:
Gain Drift with Temperature:
Offset Drift with Time:
Sampling Rate:
Analog Output Bandwidth:
Output Type:
Dynamic Range:
Source/Sink ability:
Anti-Aliasing Filter:
Group-Delay:
•
Output #1 and #2:
•
Output #3 and #4:
•
Output #5
SPM - PLL User’s Manual
5
16 bits
Up to 55 mV pk-pk on FFFFH- 0000H alternating code sequence.
<25 µV RMS
+-2 ppm FSR / degC
+-2 ppm FSR / degC
+-13 ppm FSR / 500 hours
150 kHz
0 to 80 kHz (includes DC)
Single Ended
+-10 V
4mA
None
2.5 samples
2.75 samples
3 samples
5
1.5
PLL Performance
PLL Module Specifications
Input Range
Output Range
Frequency Range
Resonator Test Board
+-10V
+-10V (external 1/100 and 1/1000 attenuators provided)
3.2 kHz to 75 kHz
An active resonator board is included with the SPM controller for easy testing and
setup of the PLL module
PLL Output Signal Ranges Excitation Frequency:
+-2.85 mHz
to +-23.9 kHz
(Stand-Alone Operation)
to +-10 V
Excitation Amplitude:
+-1.19 µV
Resonator Phase:
+-6.83 µDeg
to +-57.3 Deg
Resonator Amplitude:
+-1.19 µV
to +-10 V
PLL Signal Noise Levels*
Phase Controller
Phase Controller
Bandwidth: 1kHz
Bandwidth: 5Hz
Excitation Frequency
60mHz RMS
20µHz RMS
Resonator Phase
4mDeg RMS
200µDeg RMS
Amplitude Controller
Amplitude Controller
Bandwidth: 7.5Hz
Bandwidth: 1.5Hz
Excitation Amplitude
400µV RMS
50µV RMS
Resonator Amplitude
5µV RMS
2µV RMS
Phase/Amplitude (PAC)
100Hz to 10kHz. The bandwidth is automatically adjusted when the loop auto-set
Detector Bandwidth
function is used
Software Features
1) Resonator frequency sweep for automatic measurement of resonator
frequency characteristics
2) Loop-gain auto-set for amplitude and phase controllers. Gains are set
according to desired closed-loop bandwidth
3) In-circuit closed-loop step response measurement function validates the setup
of both controllers
4) Adjustable low-pass filter on PLL signals: Excitation amplitude/frequency and
Resonator phase/amplitude. These filters can be adjusted from 1.5 Hz to 16 kHz
or bypassed
5) Real time monitoring of all PLL signals.
6) Long term monitoring of PLL signals to assess the low frequency stability and
noise
Temperature Coefficient
TCXO Stability:
140 ppb over a temperature range from -20 °C to 70°C
TCXO Precision:
2 ppm
* Note: Noise levels are measured using the resonator board included with the SPM controller (gain –13 dB at the
resonance) and the auto-set of loop gains for both controllers. The new PLL technique ensures that the noise levels are
independent of measurement ranges.
SPM - PLL User’s Manual
6
2
Theory of Operation
The diagram of PLL running on the Signal Ranger Mk3 DSP board is illustrated in the following figure:
PLL schematic
The synthesizer sends a sine wave on output #1. Input #1 measures the output of the resonator. The
phase detector measures the amplitude and the phase of the resonator output signal, with respect to its
excitation. The phase detector algorithm measures the phase of the resonator alone, automatically
correcting for the phase of board’s digital and analog chains. So, no special calibration is necessary
before using the PLL. When working with a second-order resonator, specifying a phase of -90 degrees
will lock the PLL at precisely the resonance frequency.
The amplitude and phase control loops keep the resonator phase and output amplitude at specific setpoints.
The PLL can generate up to four analog signals on outputs #2, #3, #4 and #5. The possible selections
for these signals are:
The resonator phase
The resonator amplitude
The excitation amplitude
The excitation frequency
For each signal, the gain (or the range) can be specified to obtain the desired output sensitivity. Also,
an adjustable low pass filter is added to increase the resolution of the output signals if necessary. An
offset (reference) can be added so the analog output signal is centered on a user-selectable value.
The PLL is controlled and adjusted using a graphical user-interface running on a Windows PC.
SPM - PLL User’s Manual
7
3
Software and Hardware Installation
Note: The software must be installed before connecting the PLL unit to a PC. The software
installs the USB driver automatically. Windows XP, Windows Vista and Windows 7 are supported
on a 32-bit or 64-bit PC.
To install the software, launch the SoftdB_SPM_PLL_1_8.exe
SPM - PLL User’s Manual
8
4
PLL User Interface
PLL interface: Main Tab
4.1
Phase Detector Time Cst (s)
This control adjusts the time constant of the phase detector. We suggest keeping time constant to 20us
(fast set-up), which allows a bandwidth of about 8 kHz. Note that the auto-adjustment functions for the
PI gains of both controllers (amplitude and phase) automatically set the time constant to 20us. This
way, the bandwidth of the controller is only limited by the PI gains and the LP filter.
4.2
Resonator Sweep
The Resonator Sweep button performs a frequency scan of the resonator. A sweep over a limited
frequency range is used to measure the frequency response. The following figure presents the
measurement interface:
SPM - PLL User’s Manual
9
Resonator Sweep Interface
The resonator sweep interface automatically sets the time constant of the phase detector at 1ms to
obtain a precise measurement of both the phase and amplitude. The original time constant for the
phase detector is replaced after the sweep measurement.
Before starting the measurement, the start and stop frequencies must be adjusted along with the
frequency resolution and the excitation amplitude. The Measurement Pause control specifies the
waiting period between a change in excitation frequency and the corresponding measurement. When
the resonator Q factor is large, the stabilization time after the excitation change can be long. For
instance, for a Q factor of 25k and a resolution of 0.05Hz, a stabilization time of 300ms is necessary. At
the end of the measurement, the resonance frequency, the gain at the resonance, the phase at the
resonance frequency and the Q factor are computed and presented by the interface. Two methods are
used to compute the Q factor: 1) phase derivative at the maximum gain and 2) half maximum method.
Use the Quit button to quit the measurement interface. The interface will ask for an update of the
frequency reference and the phase reference. If the user clicks yes, the phase and the frequency
references will be updated with the new phase at the resonance and the new resonance frequency.
Note: The Q factor and the gain at the resonance are important information for the auto-adjustment
function of the amplitude controller.
SPM - PLL User’s Manual
10
4.3
Operation Set-up Controls
PLL interface: Operation Set-up Controls
These controls allow the set-up of the reference values and the configuration of the analog output
signals. Up to four analog signals can be generated by the PLL. For each signal, the reference, the
range and the output number can be adjusted. A low pass filter is applied on the output signals and the
frequency cut-off can be adjusted from a menu. There are two LP filters: one for the phase and
excitation frequency signals and another one for the resonator and excitation amplitude signals. For
each output signal, the reference can be automatically set to the current value with the button Set
reference. The minimum and maximum values in unit are presented for each output. The minimum and
the maximum depend on the selected range and the reference value. The sensitivity of the output is
also displayed and can be modified by adjusting the range.
4.4
Excitation Parameters
Output #1 of the PLL generates a high-purity sine wave. The frequency and the amplitude can be
adjusted with these controls. If the phase controller is engaged, the frequency is not adjustable and the
Excitation Freq. (Hz) control becomes an indicator. If the amplitude controller is engaged, the excitation
amplitude is not adjustable and the Excitation Amp. (V) control becomes an indicator.
SPM - PLL User’s Manual
11
4.5
Set-Points
These controls adjust the set points for the phase and the resonator amplitude. Note that the phase set
point is always the reference phase. So, the set-point adjustment for the phase is done through the
phase reference control (see the Operation Set-up controls). This way, the phase controller always
works centered around zero.
4.6
PI Controls and Switches
The sign and the gain of the Proportional and Integral factors can be adjusted with these controls for
both controllers. The OFF/ON buttons engage or deactivate each controller.
The Auto buttons can be used to determine the PI gains and LP filter set-up for both controllers. For the
phase controller, the following dialog box allows specifying the desired bandwidth:
SPM - PLL User’s Manual
12
Select the desired bandwidth and click ok. Then, the interface will automatically set the LP filter (for the
phase/frequency), the PI gains and the time constant of the phase/amplitude detector to reach the
desired bandwidth.
For the amplitude controller, the following dialog box allows specifying the desired bandwidth:
To be able to determine the proper PI gains, the auto-adjustment function must know the gain at the
resonance and the Q factor of the resonator. These values can be measured with the Resonator
Sweep function. The interface will automatically set the LP filter (for the amplitude signals), the PI gains
and the time constant of the phase/amplitude detector to reach the desired bandwidth.
4.7
Loop-Response-Test Controls
Theses controls allow the testing of the loop response of both controllers. These controls can be used
only if the corresponding controller is engaged. The test function measures the step response of the
controller. An adjustable step is applied on the set-point and the resonator phase or output amplitude is
recorded during the test. The Amp. step and Phase step are used to define the amplitude of the step.
For instance, if the Phase step control is set to +3, the controller set-point will be stepped up by +3 deg
for the test. The set-point step is returned to zero after the test. The Test button launches the following
interface (phase controller case):
SPM - PLL User’s Manual
13
Phase controller test interface (Resonator Phase Tab)
In the first tab (Resonator Phase Tab), the top curve presents the step response and the bottom curve
is the closed-loop frequency response of the derivative of the step response (i.e. the spectrum of the
closed-loop impulse response). This curve allows the evaluation of the controller bandwidth.
The second tab presents the excitation frequency response. This is the output of the phase controller. If
saturations appear on this curve it means that the output of the controller reaches the maximum or the
minimum of the operation range. If required, the operation range can be increased to avoid this nonlinear behaviour, or a smaller step excitation can be used to insure a linear behaviour.
4.8
Phase, Output Amplitude and Excitation Frequency Indicators
These indicators present:
SPM - PLL User’s Manual
14
The resonator phase
The resonator amplitude
The excitation frequency
A first order low pass filter is applied. The filter that can be adjusted with the LP filter applied on
Freq./Phase/Amp control (see Operation Set-up controls).
4.9
Time Signal Graph and Signal Selection
These graphs present various signals of interest in real-time. The selection of the signals is done
through the Signal Select menu. The following table presents the possible choices:
SPM - PLL User’s Manual
15
Signal
Resonator Output
Excitation
Resonator Phase (raw)
Excitation Freq. (raw)
Resonator Output Amp. (raw)
Excitation Amp. (raw)
Excitation Freq. (filtered)
Resonator Phase (filtered)
SPM - PLL User’s Manual
Description
Resonator output time signal in V. This is the
signal measured by the DSP board on input #1.
Excitation time signal in V. This is the signal
generated by the DSP board on output #1.
Resonator phase in degrees, as measured by
the phase detector. The phase detector
algorithm measures the phase of the resonator
alone, automatically correcting for the phase of
board’s digital and analog chains. This is the
raw signal and no low pass filter is applied.
This value (in Hz) is fixed if the phase controller
is OFF. If the phase controller is engaged, this
signal is the output of the phase corrector. This
is the raw signal and no low pass filter is used.
Resonator output signal amplitude, as
measured by the phase detector (in V). This is
the raw signal and no low pass filter is applied.
Excitation amplitude in V. This signal is
constant at the specified value if the amplitude
controller is OFF. If the amplitude controller is
engaged, this signal is the output of the
amplitude corrector. This is the raw signal and
no low pass filter is applied.
Filtered excitation frequency (in Hz). This signal
is constant at the specified value if the phase
controller is OFF. If the phase controller is
engaged, this signal is the filtered output of the
loop controller. The display low pass filter is
applied to lower the noise. For this signal the
Signal control can be used to present the
absolute value or the shift value. The reference
value in the Operation Set-up tab is used to
compute the shift value.
Filtered resonator phase (in degrees), as
measured by the phase detector. The phase
detector algorithm measures the phase of the
resonator alone, automatically correcting for the
16
Resonator Amplitude (filtered)
Excitation Amplitude (filtered)
Output #2, #3, #4 and #5
phase of board’s digital and analog chains. For
this signal the Signal control can be used to
present the absolute value or the shift value.
The reference value in the Operation Set-up tab
is used to compute the shift value.
Filtered resonator output amplitude (in V). The
low pass filter is applied to lower the noise on
this signal. For this signal the Signal control can
be used to present the absolute value or the
shift value. The reference value in the
Operation Set-up tab is used to compute the
shift value.
Filtered excitation amplitude (in V). The low
pass filter is applied to lower the noise on this
signal. For this signal the Signal control can be
used to present the absolute value or the shift
value. The reference value in the Operation
Set-up controls is used to compute the shift
value.
These selections represent the 16-bit signal
generated by the DSP on outputs #2, #3, #4
and #5. The output signals are selected with the
Mux menu of the Operation Set-up controls.
The user can select between the excitation
frequency, the resonator phase, the resonator
amplitude and the excitation amplitude. An
adjustable reference value is subtracted from
these signals to present the shift value. The
sensitivity of the output signal can be adjusted
with a range control. Also, an adjustable low
pass filter is used to lower the noise on all
signals.
4.10 Signal History
The signal history for both the excitation frequency shift and the resonator shift are presented on the
Signal History tab. The history length is adjustable and the user can clear the history graphs with the
Clear History control. These graphs are useful to analyze the long-term stability of the PLL and to
estimate the noise.
SPM - PLL User’s Manual
17
Amplitude controller test interface (Resonator Amplitude Tab)
4.11 Save and Recall Configuration Files
These buttons save and recall a configuration. All PLL parameters are saved in the configuration file.
When a configuration is recalled, both controllers are automatically stopped.
SPM - PLL User’s Manual
18
GPIO Connectors
The GPIOs are located on two dB-25 connectors at the back of the instrument:
Left Connector
13
Gnd
12
Gnd
25
Gnd
11
Gnd
24
Gnd
10
QEP0_B
23
Gnd
9
QEP0_A
22
Gnd
8
GPIO_0(7)
21
Gnd
7
GPIO_0(6)
20
Gnd
6
GPIO_0(5)
19
Gnd
5
GPIO_0(4)
18
Gnd
4
GPIO_0(3)
17
Gnd
3
GPIO_0(2)
16
Gnd
2
GPIO_0(1)
15
Gnd
1
GPIO_0(0)
14
Gnd
10
QEP1_B
23
Gnd
9
QEP1_A
22
Gnd
8
GPIO_0(15)
21
Gnd
7
GPIO_0(14)
20
Gnd
6
GPIO_0(13)
19
Gnd
5
GPIO_0(12)
18
Gnd
4
GPIO_0(11)
17
Gnd
3
GPIO_0(10)
16
Gnd
2
GPIO_0(9)
15
Gnd
1
GPIO_0(8)
14
Gnd
Right Connector
13
Gnd
12
Gnd
25
Gnd
11
Gnd
24
Gnd
SPM - PLL User’s Manual
19