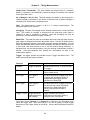
1
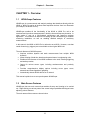
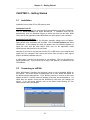
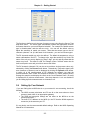
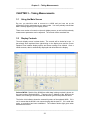
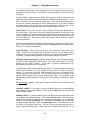
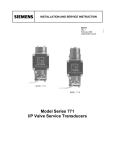
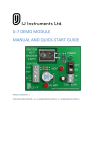
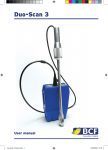
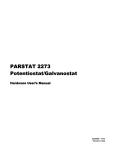
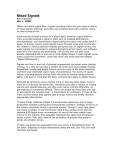
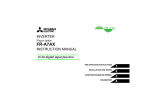
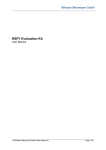
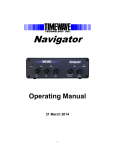
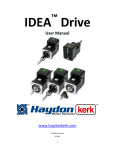
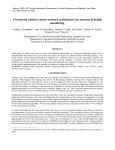
Wireless
Monitoring
WiVibScope
User’s Manual
Revision 1.0
April 2009
3 Raw Holdings
East Calder
West Lothian EH53 0HY, UK
T: +44 1506 885000
F: +44 1506 885501
W: www.iconresearch.co.uk
NOTICE
Information contained in this document is believed to
be accurate and reliable. However, due to ongoing
product developments and revisions, Icon Research
Ltd cannot guarantee the accuracy of this document
after the date published nor can it accept
responsibility for errors or omissions.
This document, and the software and/or hardware
which it describes, is subject to change without notice.
Icon Research Ltd acknowledges that various
products or trademark names referred to in this
document are subject to copyright and/or trademark
by their respective registered holders.
CONTENTS
CHAPTER 1 – Overview
1.1 WiVibScope Features …………………….………
1.1
1.2 Main Screen Features ………………………………… 1.1
CHAPTER 2 – Getting Started
2.1 Installation …………………………...…….……………
2.2 Connecting to a WiVib …...…………………………….
2.3 Defining Your Preferences …………………………….
2.4 Setting Up your Network ……………………………….
2.1
2.1
2.1
2.3
CHAPTER 3 – Taking Measurements
3.1 Using the Main Screen ….……………….……………. 3.1
3.2 Display Controls ……….…………………………..…… 3.1
3.3 Defining Measurement Parameters ……….……….… 3.3
Chapter 1 – Overview
______________________________________________________________
CHAPTER 1 - Overview
1.1
WiVibScope Features
WiVibScope is a measurement and analysis package that interfaces directly with the
WiVib or WiVib Pro series of wireless data acquisition devices from Icon Research
(for example, the WiVib-4/4 Pro).
WiVibScope enables all the functionality of the WiVib or WiVib Pro unit to be
exercised and it produces measurements in both the time and frequency domains. In
other words, it acts as a fully-featured oscilloscope and spectrum analyser
application. This makes it an ideal tool for setting up and commissioning a condition
monitoring installation, as well as enabling detailed analysis of machinery
measurements.
In this manual, the WiVib or WiVib Pro is referred to as a WiVib. However, note that
certain features (eg. triggers) are not available on the original WiVib unit.
The main features of WiVibScope are:
• Acquires real-time dynamic and static measurements from multiple WiVib
channels;
• Allows viewing of both time domain and spectral traces in engineering units;
• Enables all the features of the WiVib hardware to be used, including triggering
and wakeup modes;
• Caters for various sensor types, including accelerometers and proximity
probes;
• Provides comprehensive display options including cursor types, zoom,
autoscale and linear/logarithmic graphing;
• Automatically detects WiVib devices on a network
This manual explains how to set up and operate WiVibScope.
1.2
Main Screen Features
WiVibScope has one main screen that enables all setup and viewing to be carried
out. Right-clicking on various parts of the screen brings up additional dialogue boxes
adjusting various features.
The main areas of the screen are shown below.
1-1
Chapter 1 – Overview
______________________________________________________________
WiVib Device Panel
View WiVib details here
Main Display
WakeUp Control
Panel
Set up WiVib wakeup
mode here
Vertical Axis and
Cursor Control Panels
Move the cursor and
change vertical scaling
Cursor Readout Panel
Right-click to change
sensor type and
sensitivities
Right-click to change
units and display options
Measurement Setup
Panel
Set your measurement
parameters here
WiVib Device Panel: this shows the IP address of the WiVib that you have selected,
the model of the device, and the name that has been allocated to it.
WakeUp Control Panel: this panel enables you to set the device to turn off and
wake up at preset intervals.
Main Display: measurement traces are shown here. By right-clicking anywhere on
the display, display options can be altered.
Vertical Axis and Cursor Control Panels: the vertical scaling can be adjusted using
the up/down arrows, or autoscale can be selected. Additionally, the cursor can be
moved left/right, or it can be set to detect the peak of the displayed trace. The x-axis
cursor position is displayed here, along with the speed being detected by the trigger
selection.
Cursor Readout Panel: this allows channels to be selected or de-selected for
display by clicking on the radio buttons. In addition, the value of the trace at the
cursor position on the y-axis is shown. In the case of process measurements (eg.
1-2
Chapter 1 – Overview
______________________________________________________________
temperature) the process value is displayed. By right-clicking anywhere on the
panel, channel sensitivities and engineering units can be altered.
Measurement Setup Panel: settings for measurements are altered and displayed
here. Time and frequency display options are selected here, and values are selected
from drop-down menus.
1-3
Chapter 1 – Overview
______________________________________________________________
This page is intentionally left blank
1-4
Chapter 2 – Getting Started
______________________________________________________________
CHAPTER 2 – Getting Started
2.1
Installation
Installation is from either CD or USB memory stick.
Installation from CD
If AutoRun is enabled on your computer drive, the installation menu will be displayed.
Click on Install Software and select WiVibScope. If installation does not run
automatically, then use Windows Explorer to select the drive with the label WiVib
Suite, and run the application called WiVibSuite.exe which will be in the root folder.
Installation from USB Stick
When a USB drive is inserted, the Windows Autoplay dialogue box will appear.
Select WiVib Suite Installation and click OK. Click on Install Software and select
WiVibScope. If the Autoplay box does not appear, then use Windows Explorer to
select the drive with the label WiVib Suite, and run the application called
WiVibSuite.exe which will be in the root folder.
Note that, if you wish to copy the files from the CD or USB stick to your computer and
install from your computer, then ensure that all the files are kept in their original
folders, otherwise installation may fail.
In either case, a shortcut will be placed on your desktop. Click on the shortcut to
launch WiVibScope. If you wish to print a copy of this manual, it is available on the
CD/USB stick.
2.2
Connecting to a WiVib
When WiVibScope is launched, the first thing it does is look for available WiVibs on
the network. The screen below will appear and one or more WiVibs will appear on
the WiVib Selection dialogue box. For a WiVib to connect, it must be on the same
network as the PC, have the correct IP address of the host, and be switched on. If a
WiVib does not appear, check with the WiVibConfig utility that your settings are
correct. If you are having difficulty, refer to the section called Setting Up Your
Network at the end of this chapter.
______________________________________________________________
2-1
Chapter 2 – Getting Started
______________________________________________________________
Click on the WiVib that you want to connect to (in the example, there is only one) and
click OK. Traces will now start to appear on the display.
2.3
Defining Your Preferences
One of the first things you will probably wish to do is to set up your transducer and
display preferences, together with your transducer sensitivities. So let’s get started.
First, right-click on the display area, and the menu screen below will appear. Use the
radio buttons to select whether you wish to see:
• metric or imperial units;
• speed in Hz or RPM;
• spectra in RMS or Peak values;
• ordered spectra as numbers of orders or ordered speed.
You can select your cursor style, and whether you wish to see the display in
logarithmic or linear units (this option applies to spectral displays only).
You can also decide whether you want the WiVib to take additional measurements
on each display update. The options are to measure the battery voltage, and also to
read the bias voltage (when using an accelerometer), or the gap voltage (when using
a proximity probe). If you turn these off, the trace update rate to the display will be
faster.
Click OK to exit and your settings are automatically saved. Don’t worry if you are not
sure of your settings at this point – you can change them any time by right clicking on
the display again.
Now we want to set up our transducers and sensitivities. Right-click on the Cursor
Readout Panel to bring up the screen below.
______________________________________________________________
2-2
Chapter 2 – Getting Started
______________________________________________________________
The first item to define here is the type of sensor you are using from the Sensor Type
drop-down menu. The sensor type automatically selects the appropriate units for
that sensor based on your metric/imperial selection. For example, the default sensor
type is Accelerometer, and the units are mv/g. You can use the default value or
adjust the sensitivity to match your sensor. Note that the sensor type on the AC
channels (channels 1 to 4) is the same for all channels – you can’t mix sensor types.
The DC channels enable any unit to be defined. The default is temperature, using a
sensor calibrated as 10mV/ºC. To change units, enter the sensitivity in mV/unit, the
name of the unit you want to display (eg. degC, degF, psi etc) and any offset that the
sensor may have. The offset is used, for example, when a 4-20mA sensor has its
4mA level equal to zero and you wish to remove this offset.
The DC channels (channels 5-8) can be set to provide a single process value only,
selected by clicking the Process radio button. Alternatively, a dynamic signal (such
as a timewave or spectrum) can be displayed by clicking the Dynamic radio button.
In reality, all of the measurements on DC channels are dynamic, but what the
process selection does is take 256 samples at 2560Hz (ie. 100mS sample period),
average the samples, and display the result on the Cursor Readout Panel. No trace
is displayed for a process measurement. Note that channels 1 to 4 are disabled if
you are taking dynamic measurements on channels 5 to 8.
2.4
Setting Up Your Network
If you are finding that a WiVib that is on your network is not connecting, check the
following:
• The WiVib, access point/router and PC are all on the same subnet or have
access to each other via an appropriate gateway;
• The SSID and encryption settings are the same on the WiVib as on the
access point/router;
• The host PC IP address on the WiVib (ie. the PC that the WiVib expects to
connect to) is the same as your PC.
If in any doubt, use the recommended default settings. Refer to the WiVib Operating
Manual for full instructions.
______________________________________________________________
2-3
Chapter 2 – Getting Started
______________________________________________________________
This page is intentionally left blank
______________________________________________________________
2-4
Chapter 3 – Taking Measurements
______________________________________________________________
CHAPTER 3 – Taking Measurements
3.1
Using the Main Screen
By now, you should be able to connect to a WiVib and you have set up the
preferences for the measurements you want to take. You have probably noticed that
data is already appearing in the display screen.
There are a number of controls on the main display screen, as well as fields whereby
measurement parameters can be adjusted. The controls will be examined first.
3.2
Display Controls
The main display screen is shown below. The controls will be looked at in turn. It
has already been explained how right-clicking on the display area and the Cursor
Readout Panel enables display options and sensor scaling to be defined. Once a
WiVib connects, data is automatically displayed and refreshed on the display.
Selected WiVib: Details of the WiVib from which data is being received is shown on
the panel marked Selected WiVib. These are the IP Address of the WiVib on the
network, the model type and the name that has been given to that particular WiVib.
The Active Link indicator shows the connectivity status of the selected WiVib. If it is
red, it means that the WiVib is not communicating with the host PC. If it is solid dark
green, a connection has been established. The indicator flashes light green when
new data has arrived.
______________________________________________________________
3-1
Chapter 3 – Taking Measurements
______________________________________________________________
If the selection was made to read the battery level in the Display Options menu box,
the battery level will be shown. If the WiVib is on external power, the word Ext Power
will appear.
The Bat Timeout (battery timeout) setting is the length of time in minutes that the
WiVib will remain powered without receiving any commands from the host PC. If this
time is exceeded, then the WiVib will power down. This is to save battery power in
the event of a network interruption or the PC being turned off. If you wish to disable
the battery timeout, this can be done by setting the battery timeout to zero. If the
WiVib is externally powered, then the battery timeout function is ignored.
Cursor Panel: The cursor can be moved by clicking on the left and right buttons in
the Cursor panel. It can also be moved by left-clicking anywhere on the screen, and
it can be dragged to a desired position by holding down the left mouse button. The
cursor can also be set to move to the highest peak on each incoming trace by ticking
the Peak Detect box. Note that the peak detect function will be disabled if cursors
are moved manually.
The x-axis cursor position and machine speed (if trigger is enabled) are shown in this
panel. Display update can be paused by clicking the Pause button (note that data is
still read – it is simply not displayed).
Vertical Scaling: Above the Cursor panel is the vertical axis control panel, Vert
Scale. Traces can be boosted and unboosted using the up and down arrows.
Autoscale is turned on by clicking on this button, and a green border indicates that it
is enabled. It is automatically disabled if a boost/unboost button is pressed.
Channels (Channel Selection): Channels can be selected or de-selected for display
by clicking on the appropriate radio buttons. The value of the trace at the cursor
position on the y-axis is shown. In the case of process measurements (eg.
temperature) the process value is displayed.
The right-hand column shows additional information. For Accelerometer and Velocity
Probe sensor selections, the bias voltage of each sensor is shown in the Bias
column. For Proximity Probe and Volts selections, the column is labelled Gap to
indicate this type of measurement. These measurements must be enabled in the
Display Options dialogue box for these readings to be taken. For information, both
bias and gap readings are taken over a period of one second to eliminate AC signal
effects.
By right-clicking anywhere on the panel, channel sensitivities and engineering units
can be altered.
Changing a WiVib: If you wish to change the WiVib that you are communicating
with to another on the same network, you can click the WiFi button at any time and
select a different WiVib.
WakeUp Control: To conserve battery power, the WiVib can be programmed to turn
on (or “wake up”) at preset intervals. This is called WakeUp Mode. The frequency at
which the unit wakes up is defined in the Wakeup Control panel. To turn Wakeup
Mode on, tick the Set for Wakeup box. Now choose the Interval (in minutes) that
you wish between wakeups. Click the PowerDown button. The WiVib will turn off
the Active Link indicator will go red. The time at which the WiVib will wake up is
shown in the Next Wakeup box. When that time is reached, the WiVib will turn on
______________________________________________________________
3-2
Chapter 3 – Taking Measurements
______________________________________________________________
and a set of measurements on the selected channels will be taken. The unit will turn
off again. To leave WakeUp Mode, untick the Set for Wakeup box. The unit will stay
on at the next wakeup time, or you can press the ON/OFF button on the WiVib to turn
it on right away.
Note that the actual time used is the time of the host PC that the WiVib is
communicating with.
Printing and Saving: The screen can be printed or saved using the Print and File
buttons. Various file types are available from the dropdown list.
3.3
Defining Measurement Parameters
The panel below shows the parameters that can be modified to suit the type of
measurement you wish to take.
Measure: The type of measurement is defined here. The options are context
sensitive depending on the type of sensor selected. For example, you cannot
measure acceleration when using a proximity probe. The table below shows the
types of measurement that can be taken with each type of sensor.
Sensor Type
Measure
Accelerometer
Velocity Probe
Proximity Probe
Volts
Acceleration
Y
N
N
Volts
Velocity
Y
Y
N
Volts
Displacement
N
Y
Y
Volts
Bearing
Y
N
N
Volts
The bearing measurement enables the on-board demodulator (enveloping) function
in the WiVib to measure bearing condition.
Display: The selection of a time or spectral display is made here. Additionally, a
Hanning or Flattop window can be selected for the spectrum.
______________________________________________________________
3-3
Chapter 3 – Taking Measurements
______________________________________________________________
Sample Rate / Bandwidth: This field enables the Sample Rate (if a timewave
display is selected) or the Bandwidth (if spectrum display is selected) to be defined
from a drop-down menu.
No. of Samples / No. of Lines: This field enables the number of time samples (if a
timewave display is selected) or the number of spectral lines (if spectrum display is
selected) to be defined from a drop-down menu.
Gain: The channel gain in a range 1 to 50 in 1, 2, 5 steps is selected here. The
same gain applies to all channels.
Averaging: The type of averaging can be selected between None, Linear and Peak
Hold. The number of averages is selected from the drop-down menu which is
enabled if a type of averaging is selected. Note that averaging can only be
performed in the time domain if a trigger is enabled.
Band Filter: The band filter acts as a bandpass filter where the high-pass and lowpass edges are selected from the two drop-down menus. The filter is usually used to
define the passband frequency range when using the bearing demodulator. You will
notice that bandpass default values are automatically set when the Bearing selection
is first made, and these should be set to suit the bearing being measured. A
bandpass filter can be defined without using the bearing measurement function if
desired. Note that bandpass filter settings are remembered for each of the
measurement options.
Trigger: the trigger options are selected from the Trigger drop-down menu. The
table below shows the options available.
Selection
Function
Comments
Disabled
Trigger is disabled
The WiVib will “free-run” ie. it will not wait
for a trigger
Enabled
Trigger is enabled
The WiVib will wait for a trigger pulse to
acquire a data record
Pre Trigger
Pre-Trigger is
enabled
The WiVib will wait for a trigger pulse and
the display will include the number of
samples before the trigger point as
specified in the Delay field.
Post Trigger
Post-Trigger is
enabled
The WiVib will wait for a trigger pulse and
then delay for the number of samples
specified in the Delay field before
acquiring the specified number of
samples.
Trigger + Tacho
Trigger and tacho
measurements are
both enabled
Trigger is enabled and a speed
measurement is also taken which is
displayed in the Cursor panel.
The trigger source (Channel 1 or Channel 2) is selected in the drop-down menu
below the trigger type. Note that channel 1 can be an analog or digital trigger
depending on the jumper setting in the WiVib. See the WiVib operating manual for
details.
______________________________________________________________
3-4
Chapter 3 – Taking Measurements
______________________________________________________________
The final drop-down menu specifies the trigger timeout which is the length of time
that the WiVib will wait for a trigger before abandoning the measurement. If a trigger
is not detected within the timeout period (ie. the timeout expires), a message Trigger
Timeout will appear in the Sample Status box and no data will be read. This will
continue until a trigger is detected or triggers are disabled.
Gates: Trigger inputs can also be used as gates. A set of measurements will not be
taken if the gate signal inputs do not match the criteria specified in the drop-down
menus. Both gates must match. Each gate can either be off, or require a high or
low signal at its input to enable measurement. If the signals on the gate(s) do not
match the gate configuration, then a message Incorrect Gates will appear in the
Sample Status box and no data will be read. This will continue until the gate inputs
match the gate settings or the gates are turned off.
Note that a gate has to be in a matched state for the whole of data acquisition period
for a gate configuration to be valid and data to be read.
If no input is connected to a gate, then that gate input is read as logic low.
______________________________________________________________
3-5
Chapter 3 – Taking Measurements
______________________________________________________________
This page is intentionally left blank
______________________________________________________________
3-6