1
EnergyReporterEXT
V
e
r
s
i
o
n4
.
0
TM
TM
This page intentionally left blank.
EnergyReporter EXT Installation and Operation Manual Version 1.03
Published by:
Electro Industries/GaugeTech
1800 Shames Drive
Westbury, NY 11590
All rights reserved. No part of this publication may be reproduced or transmitted in
any form or by any means, electronic or mechanical, including photocopying, recording, or information storage or retrieval systems or any future forms of duplication, for
any purpose other than the purchaser's use, without the expressed written permission
of Electro Industries/GaugeTech.
© 2014 Electro Industries/GaugeTech
Nexus® and Shark® are registered trademarks of Electro Industries/GaugeTech. The
distinctive shapes, styles and overall appearances of the Nexus® 1500 meter and the
Shark® meters are trademarks of Electro Industries/GaugeTech. HMI EXTTM and
Communicator EXTTM are trademarks of Electro Industries/GaugeTech.
Microsoft®, Excel®, and Windows® are either registered trademarks or trademarks
of Microsoft Corporation in the United States and/or other countries.
Software version 4.0
Modbus® is a registered trademark of Schneider Electric, licensed to the Modbus
Organization, Inc.
Electro Industries/GaugeTech
Electro Industries/GaugeTech
The Leader In Power Monitoring and Smart Grid Solutions
The Leader In Power Monitoring and Smart Grid Solutions
Doc#
E167701
i
Customer Service and Support
Customer support is available 9:00 am to 4:30 pm, Eastern Standard Time, Monday
through Friday. Please have the serial number and a detailed problem description
available. When returning any merchandise to EIG, a return materials authorization
number is required. For customer or technical assistance, phone 516-334-0870 or fax
516-338-4741.
Disclaimer
The information presented in this publication has been carefully checked for
reliability; however, no responsibility is assumed for inaccuracies. The information
contained in this document is subject to change without notice.
About Electro Industries/GaugeTech
Founded in 1975 by engineer and inventor Dr. Samuel Kagan, Electro Industries/
GaugeTech (EIG) changed the face of power monitoring forever with its first breakthrough innovation: an affordable, easy-to-use AC power meter.
More than thirty years since its founding, Electro Industries/GaugeTech, the leader in
power monitoring and control, continues to revolutionize the industry with the highest
quality, cutting edge power monitoring and control technology on the market today.
An ISO 9001:2008 certified company, EIG sets the industry standard for advanced
power quality and reporting, revenue metering and substation data acquisition and
control. EIG products can be found on site at mainly all of today's leading manufacturers, industrial giants and utilities.
EIG products are primarily designed, manufactured, tested and calibrated at our facility in Westbury, New York.
Electro Industries/GaugeTech
Electro Industries/GaugeTech
The Leader In Power Monitoring and Smart Grid Solutions
The Leader In Power Monitoring and Smart Grid Solutions
Doc#
E167701
ii
License Agreement for the EnergyReporter EXT Software Application
This legal document is an Agreement between you, as the end user of EnergyReporter
EXT software ("SOFTWARE") and Electro Industries/GaugeTech ("EIG"). EIG licenses
this SOFTWARE to You only upon the condition that you accept all of the terms contained in this Agreement.
BY SELECTING THE "AGREE" BUTTON BELOW THIS AGREEMENT OR BY INSTALLING,
UPLOADING, ACCESSING, OR OTHERWISE COPYING OR USING ALL OR ANY PORTION
OF THE SOFTWARE, YOU AGREE TO BE LEGALLY BOUND BY THE TERMS OF THIS
AGREEMENT.
IF YOU DO NOT ACCEPT THE TERMS OF THIS AGREEMENT, YOU MUST NOT USE THE
SOFTWARE. If You are proposing to load the SOFTWARE from a disk or other portable
media, select the "DISAGREE" button and the loading of the SOFTWARE will be canceled. If You are proposing to download the SOFTWARE or a License Key, do not do
so. If You have acquired a physical software pack, do not open it. Promptly return the
unopened software pack and other items (including the License Key, written materials, binders or other containers, and hardware, if any) accompanying this Agreement
to the place where you obtained them for a full refund.
INSTALLATION, UPLOADING, ACCESS, OR OTHER COPYING OR USE OF THIS SOFTWARE OR ANY ACCOMPANYING DOCUMENTATION OR MATERIALS EXCEPT AS PERMITTED BY THIS AGREEMENT IS UNAUTHORIZED AND CONSTITUTES A MATERIAL
BREACH OF THIS AGREEMENT AND AN INFRINGEMENT OF THE COPYRIGHT AND
OTHER INTELLECTUAL PROPERTY RIGHTS IN SUCH SOFTWARE, DOCUMENTATION
AND MATERIALS. YOU MAY BE LIABLE TO EIG FOR DAMAGES, AND YOU MAY BE SUBJECT TO CRIMINAL PENALTIES.
1. GRANT OF LICENSE. In consideration of payment of the license fee and your Agreement to abide by the terms and conditions of this Agreement, EIG grants to you the
following non-exclusive rights:
(a) Installation and Use. You may install and use one copy of the SOFTWARE program
on a single computer at a single location, in accordance with the applicable User Documentation and within the scope of this Agreement. The computer cannot have more
than one copy (i.e. session or instance) of the SOFTWARE running at any one time.
EIG's license grant (and, with that grant, Your right to install and use the SOFTWARE
and User Documentation) is conditioned on Your continuous compliance with all
Electro Industries/GaugeTech
Electro Industries/GaugeTech
The Leader In Power Monitoring and Smart Grid Solutions
The Leader In Power Monitoring and Smart Grid Solutions
Doc#
E167701
iii
license limitations, restrictions and other terms in this Agreement. If You violate any
of these limitations, restrictions or other terms, the license grant will automatically
and immediately terminate. The license descriptions in this Section 1 (Grant of
License) define the scope of rights that EIG grants to You. Any usage of the SOFTWARE and/or User Documentation outside the scope of the applicable license grant or
otherwise not in accordance with this Agreement constitutes an infringement of EIG's
intellectual property rights as well as a material breach of this Agreement.
(b) Backup Copies. You may make one copy of the SOFTWARE solely for backup purposes.
(c) Network Use. You may also install a copy of the SOFTWARE on a central storage
device, such as a network server, from which other computers may use it; however,
You must acquire and dedicate a license for each copy (i.e. session or instance) of the
SOFTWARE running at any one time. A license for the SOFTWARE may not be shared
or used concurrently on different computers.
(d) Prohibited Use. EIG does not permit the following use and You acknowledge that
such use and/or actions shall be prohibited:
i.) Use. You may not (and may not permit any third party to) install, access, or otherwise copy or use the SOFTWARE except as expressly authorized by this Agreement.
ii.) Reverse Engineering. You may not (and may not permit any third party to) reverse
engineer, decompile or disassemble the SOFTWARE.
iii.) Transfers. You may not distribute, rent, loan, lease, sell, sublicense, or otherwise
transfer all or a portion of the SOFTWARE, or any rights granted in this Agreement, to
any other person or legal entity without the prior written consent of EIG.
iv.) Hosting or Third Party Use. You may not install or access, or allow the installation
or access of, the SOFTWARE over the Internet, including without limitation, use in
connection with a Web hosting, commercial time-sharing, service bureau, or similar
service, or make the SOFTWARE available to third parties via the Internet on Your
computer system or otherwise.
v.) Notices. You may not remove, alter, or obscure any proprietary notices, labels, or
marks from or on the SOFTWARE.
Electro Industries/GaugeTech
Electro Industries/GaugeTech
The Leader In Power Monitoring and Smart Grid Solutions
The Leader In Power Monitoring and Smart Grid Solutions
Doc#
E167701
iv
vi.) Modifications. You may not modify, translate, adapt, arrange, or create derivative
works based on the SOFTWARE for any purpose.
vii.) Circumvention. You may not utilize any equipment, device, software, or other
means designed to circumvent or remove any form of copy protection used by EIG in
connection with the SOFTWARE, or use the SOFTWARE together with any authorization code, serial number, or other copy-protection device not supplied by EIG directly
or through an authorized distributor. In the case of a network version, You may not
utilize any equipment, device, software, or other means designed to circumvent or
remove the License Manager. You may not utilize any equipment, device, software, or
other means designed to circumvent or remove any usage restrictions, or to enable
functionality disabled by EIG in connection with the SOFTWARE. You may not bypass
or delete any functionality or technical limitations of the SOFTWARE that prevent or
inhibit the unauthorized copying or use of the SOFTWARE.
viii.) Export. You may not export the SOFTWARE in violation of this Agreement, or
U.S., or other applicable export control laws.
2. LICENSE KEY. The SOFTWARE is protected by a lock and may only be used in conjunction with a valid License Key (which may be either a hardware or software device)
issued by or on behalf of EIG. EIG retains ownership of the License Key. You may use
the License Key to operate the SOFTWARE for the term of this Agreement.
3. COPYRIGHT. The SOFTWARE is owned by EIG and is the subject of copyright. You
may be held legally responsible for any copyright infringement which is caused or
encouraged by your failure to abide by the terms of this Agreement. You must not
copy or duplicate the SOFTWARE, the License Key, or any written materials, except as
expressly provided for in this Agreement. EIG has the right to trace serial numbers of
the License Keys at any time and in any reasonable manner.
4. USE RESTRICTIONS. You may physically transfer the SOFTWARE from one computer to another provided that the SOFTWARE is used on only one computer at a time
in conjunction with the License Key. You may not modify, adapt, translate, reverse
engineer, decompile, or disassemble the SOFTWARE or the License Key, or create
derivative works based on the SOFTWARE or the written materials.
Electro Industries/GaugeTech
Electro Industries/GaugeTech
The Leader In Power Monitoring and Smart Grid Solutions
The Leader In Power Monitoring and Smart Grid Solutions
Doc#
E167701
v
5.
TRANSFER RESTRICTIONS. In no event may you transfer, assign, rent, lease, sell
or otherwise dispose of the SOFTWARE, the License Key, or the written materials, on a
temporary or permanent basis, except by returning them all to EIG.
6. TERMINATION. This Agreement is effective until terminated. This Agreement will
terminate automatically without notice from EIG if you fail to comply with any provision of this Agreement. Upon termination for any reason, You must return all copies of
the SOFTWARE, the License Key and the written materials to EIG, including all copies,
whether modified, merged, or included with other software, and shall certify in writing
to EIG that You have not retained the SOFTWARE in any form. Termination of this
Agreement pursuant to this clause does not affect any rights or remedies which EIG
may otherwise have under this Agreement or at law.
7. UPDATE POLICY. EIG may create, from time to time, updated versions of the SOFTWARE. EIG may make such updates available to You only if you have a current SOFTWARE support contract for each SOFTWARE license You hold. Updated versions of the
SOFTWARE will be subject to the terms and conditions of this Agreement and reference to the SOFTWARE in this Agreement means and includes any version update.
8.ALL RIGHTS RESERVED. EIG retains title to and ownership of the SOFTWARE and all
copies thereof, and all other rights and interest, including without limitation, patents,
copyrights, trademarks, trade secrets, and other intellectual property rights, in and to
the SOFTWARE and any copies thereof. You have only the limited rights with respect
to the SOFTWARE expressly set forth in this Agreement and You have no other rights,
implied or otherwise. The structure, organization, and code of the SOFTWARE are
valuable trade secrets of EIG and You shall keep such trade secrets confidential. The
SOFTWARE and User Documentation are licensed, not sold.
9.WARRANTIES AND DISCLAIMER
(a)Limited Warranty. If You follow the instructions, the SOFTWARE will perform substantially as described in the EIG materials that you receive in or with the SOFTWARE.
(b) EIG warrants that any disks on which the SOFTWARE is supplied are free of
defects in manufacture under normal use for 30 days after purchase. During the 30
day period, a defective disk may be returned upon authorization by EIG to an authorized EIG distributor identified by EIG who will replace the disk without charge unless
it has been damaged by accident or misuse.
Electro Industries/GaugeTech
Electro Industries/GaugeTech
The Leader In Power Monitoring and Smart Grid Solutions
The Leader In Power Monitoring and Smart Grid Solutions
Doc#
E167701
vi
(c) EIG warrants that if the License Key is a physical device, it is free of defects in
manufacture under normal use. A defective physical License Key may be returned
upon authorization by EIG to an authorized EIG distributor who will replace the
License Key without charge unless the item has been damaged by accident or misuse.
(d) To the full extent permitted by applicable law, any conditions or warranties
imposed or implied by law are hereby excluded. Insofar as any such provisions cannot
be excluded, then to the maximum extent permitted by the law, liability for breach of
any implied condition or warranty is limited at EIG's option, to either the repair or
replacement of the SOFTWARE or the License Key.
(e) In no event will EIG be liable to you for any loss, damage, or expense of any kind
whatsoever consequential upon or otherwise arising out of its supply of the SOFTWARE or the use of the SOFTWARE by You or any other person. This warranty does
not cover problems caused by Your acts (or failures to act), the acts of others, or
events beyond EIG's reasonable control.
(f) No oral or written information or advice given by EIG, its dealers, distributors,
agents or employees shall create a warranty or in any way increase the scope of the
warranties above and You may not rely on any such information or advice.
(g)Disclaimer. The limited warranty is the only direct warranty from EIG. EIG gives no
other express warranties, guarantees or conditions. Where allowed by your local laws,
EIG excludes implied warranties of merchantability, fitness for a particular purpose
and non-infringement.
10. GOVERNING LAW. This Agreement is governed by the laws of the State of New
York, United States of America, regardless of conflict of law principles.
11.EXPORT CONTROL. The export of products, software, technology or information
may be subject to control or restriction by applicable laws or regulations on the control of export, notably the United States Export Administration Act and the regulations
there under, and the European Union Regulation 428/2009 applicable to dual use and
cryptographic products and technologies. You are solely responsible for determining
the existence and application of any such law or regulation to any proposed export of
the SOFTWARE by You or Your representatives and for performing any declaration or
obtaining any required authorisation in relation therewith. You agree not to export
the SOFTWARE from any country in violation of any applicable legal or regulatory obligations or restrictions on that export. In the event the aforementioned legal or regu-
Electro Industries/GaugeTech
Electro Industries/GaugeTech
The Leader In Power Monitoring and Smart Grid Solutions
The Leader In Power Monitoring and Smart Grid Solutions
Doc#
E167701
vii
latory obligations or restrictions are violated by You or any of Your representatives in
relation with the export of the SOFTWARE, You shall indemnify and hold EIG and its
authorized representatives and/or resellers harmless from any claims and compensate the same against any damages which any third party (including but not limited to
governmental and/or international authorities and/or organizations) will claim against
EIG and/or its authorized representatives and/or resellers as the result of any such
violation by You or Your representative(s).
12.COMPLETE AGREEMENT. This Agreement and any addendum or amendment
included with the SOFTWARE constitutes the entire Agreement between EIG and You
in relation to your use of the SOFTWARE and supersede any other previous or contemporaneous communications, Agreements, representations, warranties or advertising with respect to the SOFTWARE. Any change will be effective only if in writing
signed by EIG and You.
13.SEVERABILITY. If and to the extent any provision of this Agreement is held illegal,
invalid, or unenforceable in whole or in part under applicable law, such provision or
such portion thereof shall be ineffective as to the jurisdiction in which it is illegal,
invalid, or unenforceable to the extent of its illegality, invalidity, or unenforceability
and shall be deemed modified to the extent necessary to conform to applicable law so
as to give the maximum effect to the intent of the parties. The illegality, invalidity, or
unenforceability of such provision in that jurisdiction shall not in any way affect the
legality, validity, or enforceability of such provision in any other jurisdiction or affect
the legality, validity or enforceability of any other provision of this Agreement.
14.NO WAIVER. No term or provision hereof will be considered waived, and no breach
excused, unless such waiver is in writing signed on behalf of the party against whom
the waiver is asserted. No waiver (whether express or implied) will constitute a consent to, waiver of, or excuse of any other, different, or subsequent breach.
15. AUDITS. To ensure compliance with this Agreement, You agree that upon reasonable notice, EIG or EIG's authorized representative shall have the right to inspect and
audit Your Installation, Access, and use of the SOFTWARE. Any such inspection or
audit shall be conducted during regular business hours at Your facilities or electronically, either by EIG or by representatives authorized by EIG for this purpose. If such
inspections or audits disclose that You have Installed, Accessed, or permitted Access
to the SOFTWARE in a manner that is not permitted under this Agreement, then (i)
You are liable to pay for any unpaid license fees as well as the reasonable costs of the
Electro Industries/GaugeTech
Electro Industries/GaugeTech
The Leader In Power Monitoring and Smart Grid Solutions
The Leader In Power Monitoring and Smart Grid Solutions
Doc#
E167701
viii
audit; and (ii) without limitation of Section 1 (Grant of License), and unless EIG otherwise elects in writing, the license grant with respect to the SOFTWARE will terminate
immediately. Any information obtained by EIG or EIG's authorized representative
during the course of such inspection and audit will be used and disclosed by EIG solely
for purposes of such inspection and audit and for enforcement of EIG's rights under
this Agreement and applicable law, unless other uses or disclosures are required
under applicable law. Nothing in this Section shall be deemed to limit any legal or
equitable remedies available to EIG for violation of this Agreement or applicable law.
16.CONSTRUCTION. Ambiguities in this Agreement will not be construed against the
drafter.
Should you have any questions concerning this Agreement, please contact Electro
Industries/GaugeTech at 1800 Shames Dr. Westbury, New York 11590 USA. This legal
document is an Agreement between you, as the end user of SOFTWARE, and Electro
Industries/GaugeTech ("EIG").
Electro Industries/GaugeTech
Electro Industries/GaugeTech
The Leader In Power Monitoring and Smart Grid Solutions
The Leader In Power Monitoring and Smart Grid Solutions
Doc#
E167701
ix
This page intentionally left blank.
Electro Industries/GaugeTech
Electro Industries/GaugeTech
The Leader In Power Monitoring and Smart Grid Solutions
The Leader In Power Monitoring and Smart Grid Solutions
Doc#
E167701
x
Table of Contents
Table of Contents
Customer Service and Support
ii
Disclaimer
ii
About Electro Industries/GaugeTech
ii
License Agreement for the EnergyReporter EXT
Software Application
iii-ix
1: Step 1 - Install the EnergyReporter EXT
Application
1-1
1.1: Overview
1-1
1.2: Installing the EnergyReporter EXT Application
1-2
1.2.1: Installation Procedure
1-4
1.3: Connect to the Database Server
1-15
1.3.1: Specify the Database Server
1-15
1.4: Enter a Software License Key
1-16
1.5: Steps for Using the EnergyReporter EXT Application
1-18
2: Step 2 - Use MeterManager EXT to Automate
EnergyReporter EXT
2-1
2.1: Add Meters to the Meter List Using Auto Discovery
2-1
2.2: Manually Connect to Meter
2-6
2.3: Log Retrieval through MeterManager EXT
2-9
3: Step 3 - Set Up Logging
3-1
4: Step 4 - Configure the EnergyReporter EXT
Application Settings
4-1
4.1: Set Up a Provider
Electro Industries/GaugeTech
Electro Industries/GaugeTech
The Leader In Power Monitoring and Smart Grid Solutions
The Leader In Power Monitoring and Smart Grid Solutions
4-4
Doc#
E167701
TOC - 1
Table of Contents
4.2: Set Up Rate Structures
4-8
4.3: Set Up a Customer
4-35
4.4: Set Up a Location and Add Meters to It
4-37
4.4.1: Adding a Meter Manually
4-47
4.4.2: Meter at Location Example
4-50
4.4.3: Importing External Data
4-52
5: Step 5 - EnergyReporter Dashboard Viewer
5-1
5.1: Accessing the EnergyReporter Dashboard Viewer
5-3
5.2: Usage Dashboard
5-7
5.3: Generating and Viewing Usage Reports
5-14
5.3.1: Executive Summary Usage Report
5-14
5.3.2: Generate Usage Reports
5-16
5.3.2.1: View Usage Reports
5-18
5.4: Generating and Viewing Customer Bills
5-20
5.4.1: Individual Bills
5-21
5.4.2: Generate Bills Manually
5-24
5.4.3: View Bills
5-27
6: Managing Data
6-1
6.1: View/Copy/Export Meter Data
6-1
6.1.1: Export Meters Data
6-5
6.2: Edit Data Errors
6-8
6.3: Re-Aggregate All Locations
6-11
6.4: Rebuild Period Analysis
6-11
Electro Industries/GaugeTech
Electro Industries/GaugeTech
The Leader In Power Monitoring and Smart Grid Solutions
The Leader In Power Monitoring and Smart Grid Solutions
Doc#
E167701
TOC - 2
Table of Contents
7: Additional Features and Advanced Functions
7-1
7.1: Viewing the Action Log
7-1
7.2: Database Maintenance
7-3
7.2.1: Database List
7-4
7.2.2: Archive Database Clusters
7-5
7.2.3: Restore Database Clusters
7-6
7.2.4: Clear Database
7-8
7.2.5: Server Status
7-9
7.2.6: DB Actions
7-10
7.3: Clear Meter Data
7-11
7.4: Option Screens
7-12
7.4.1: Path Setting
7-12
7.4.2: Configuration Setting
7-13
7.4.3: UI (User Interface) Setting
7-15
7.4.4: Language
7-16
7.5: Performing Tasks Using Command Line
7-20
7.5.1: Import Data Using Command Line
7-20
7.5.2: Generate All Bills Using Command Line
7-20
A: Sample Usage Summary Report
A-1
Glossary
GL-1
Electro Industries/GaugeTech
Electro Industries/GaugeTech
The Leader In Power Monitoring and Smart Grid Solutions
The Leader In Power Monitoring and Smart Grid Solutions
Doc#
E167701
TOC - 3
Table of Contents
This page intentionally left blank.
Electro Industries/GaugeTech
Electro Industries/GaugeTech
The Leader In Power Monitoring and Smart Grid Solutions
The Leader In Power Monitoring and Smart Grid Solutions
Doc#
E167701
TOC - 4
1: Step 1 - Install the Application
1: Step 1 - Install the EnergyReporter EXT
Application
1.1: Overview
The EnergyReporter EXT application is a fully customizable software application that
lets you create and view an Energy Dashboard, analyze costs, and automatically generate detailed Energy usage reports and usage bills using either the Communicator
EXTTM application databases or the HMI EXTTM application’s polling engine (see the HMI
EXTTM User Manual and the Communicator EXTTM 3.0 User Manual for additional information on these applications). The EnergyReporter EXT application was created for
use with Electro Industries' Shark® 200 and 200S meters, the MP200 metering system, and all Nexus® series meters. The EnergyReporter EXT application performs
complex calculations, such as multiple entity aggregation, and supports user-programmable rate and tariff structures. This robust application allows for generation,
transmission, distribution, and tax charges, and can be used for steam and other
commodities as well as electrical billing. It also supports detailed usage analysis in the
form of usage reports and trending charts.
The EnergyReporter EXT application has three parts:
•
EnergyReporter Settings Editor: the part of the application you use to set up billing, including customer and location configuration, data import, rate configuration,
and correcting errors in the imported data.
•
EnergyReporter Dashboard Viewer: the part of the application you use to view the
Energy Dashboard, generate and view bills, view and analyze usage data, and generate and view usage reports.
•
Database Server: the part of the application which provides access to the billing
database.
New to EnergyReporter EXT V.4 software are the following features:
•
Support from MeterManager EXT software allows for meter and logging
automation and management
•
Updated Dashboard layout
Electro Industries/GaugeTech
Electro Industries/GaugeTech
The Leader In Power Monitoring and Smart Grid Solutions
The Leader In Power Monitoring and Smart Grid Solutions
Doc#
E167701
1-1
1: Step 1 - Install the Application
•
Weather data added to provide weather vs. load comparisons
•
Meter aggregation feature and virtual meters
•
Ability to archive rate structures that have changed
•
Ability to set up seasonal Fixed charges
•
Ability to set up Tiered rates
•
Ability to export meter’s data
•
New reporting capabilities
•
New technical tools
1.2: Installing the EnergyReporter EXT Application
EnergyReporter EXT software can be run either as a standalone program (the databases are stored on the computer that is running the application) or in a Client/Server
format (the databases are stored on the Server and the application is run on the
Client PCs). Note that the Client PCs can use the Dashboard Viewer, but cannot use
the Bill Settings Editor. See your System Administrator for the setup you will be using.
IMPORTANT! The EnergyReporter EXT application utilizes the MeterManager EXT
automation component, which is installed as part of the Communicator EXTTM 4.0 (or
higher) application. You must have a licensed version of the Communicator EXTTM 4.0
software installed on the PC that will function as the Server. The shareware (LITE)
version does not have the MeterManager EXT automation component and will not
work.
NOTES:
•
The licensed copy of the Communicator EXTTM 4.0 application only needs to
be on the Server, not the Clients, for the MeterManager EXT application to
operate; however, other features, such as being able to use meter addresses other
then 1, still require a Communicator EXTTM application license to be installed on the
Client PCs, as well.
Electro Industries/GaugeTech
Electro Industries/GaugeTech
The Leader In Power Monitoring and Smart Grid Solutions
The Leader In Power Monitoring and Smart Grid Solutions
Doc#
E167701
1-2
1: Step 1 - Install the Application
• The MeterManager EXT application should be configured to download log data only
from the Server, not from the Clients. The Clients will read the data from the Server
PC.
The EnergyReporter EXT application must be run on a computer with one of the following operating systems:
•
Windows 7® Professional Operating System
•
Windows 8® Professional Operating System
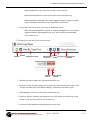
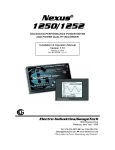
Refer to the diagram below for a graphical representation of the way the software
modules work together.
Meters
Network
Software Applications
TM
Communicator EXT 4.0
Database Application
MeterManager EXT
Automated Data Collection and
Meter Management
Energy Reporter Settings Editor
EnergyReporter EXT System Server
Includes EnergyReporter Dashboard Viewer
Network Connection
Client PC
EnergyReporter
Dashboard Viewer Only
TM
Communicator EXT 4.0
Figure 1.1: Relationship of Software Applications
Electro Industries/GaugeTech
Electro Industries/GaugeTech
The Leader In Power Monitoring and Smart Grid Solutions
The Leader In Power Monitoring and Smart Grid Solutions
Doc#
E167701
1-3
1: Step 1 - Install the Application
1.2.1: Installation Procedure
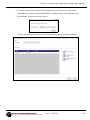
1. Insert the EnergyReporter EXT application’s CD into your PC's CD drive. You will see
the following screen in your web browser.
Electro Industries/GaugeTech
Electro Industries/GaugeTech
The Leader In Power Monitoring and Smart Grid Solutions
The Leader In Power Monitoring and Smart Grid Solutions
Doc#
E167701
1-4
1: Step 1 - Install the Application
2. Click the Software button to open the Setup Wizard screen.
Electro Industries/GaugeTech
Electro Industries/GaugeTech
The Leader In Power Monitoring and Smart Grid Solutions
The Leader In Power Monitoring and Smart Grid Solutions
Doc#
E167701
1-5
1: Step 1 - Install the Application
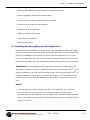
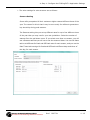
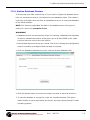
3. Close any open programs and click Next. You will see the screen shown below.
4. This is the license agreement for the EnergyReporter EXT application. Use the scroll
bar to view the entire document. Please make sure you read and agree to the
terms of our End User License Agreement; then click Agree. By clicking Agree, you
are agreeing to the full terms of this End User License Agreement.
Electro Industries/GaugeTech
Electro Industries/GaugeTech
The Leader In Power Monitoring and Smart Grid Solutions
The Leader In Power Monitoring and Smart Grid Solutions
Doc#
E167701
1-6
1: Step 1 - Install the Application
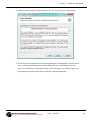
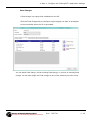
5. You have two options for the database server:
• Local Only: the database server is installed under the current user, and is only
run when the client software (EnergyReporter Settings Editor, EnergyReporter
Dashboard Viewer) is run. Additionally, the database server is only accessible
from the local machine, and only by the installing user. This is primarily used
when installing under restricted accounts, standalone systems or on laptops.
Bills and reports must be manually generated.
• Network Server: the database server is installed under a special user, as a
service. The database is accessible from other machines on port 5432, and is
started when the computer starts. This is the default installation setting, and
allows users on other computers to access the database. This setting requires
that the installing user have permission to create users and set up services. This
is a Client/Server application and as such you may need administrator help to
install the software in this mode. Bills and reports are automatically generated.
Electro Industries/GaugeTech
Electro Industries/GaugeTech
The Leader In Power Monitoring and Smart Grid Solutions
The Leader In Power Monitoring and Smart Grid Solutions
Doc#
E167701
1-7
1: Step 1 - Install the Application
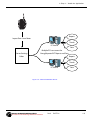
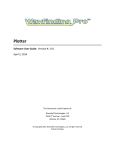
The diagrams below and on the next page show the differences between the
Local and Network database server functionality.
Meter
Figure 1.1: Local Database Server
Electro Industries/GaugeTech
Electro Industries/GaugeTech
The Leader In Power Monitoring and Smart Grid Solutions
The Leader In Power Monitoring and Smart Grid Solutions
Doc#
E167701
1-8
1: Step 1 - Install the Application
Meter
Reports
Import Data From Meter
Trends
PC Viewer
Data
Multiple PC’s can access the
EOFSHZ3FQPSUFS EXT Reports and Data
Server/Settings
Editor
Reports
Trends
PC Viewer
Data
Figure 1.2: Network Database Server
Electro Industries/GaugeTech
Electro Industries/GaugeTech
The Leader In Power Monitoring and Smart Grid Solutions
The Leader In Power Monitoring and Smart Grid Solutions
Doc#
E167701
1-9
1: Step 1 - Install the Application
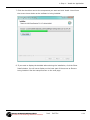
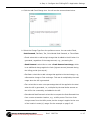
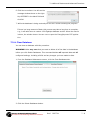
6. Click Next. You will see the screen shown below.
This screen lets you choose the application components you will install on the PC.
• If you are setting up this PC as a Viewing Client only (not able to make
changes to settings), check only the Bill Viewer box.
• If you are setting up this PC as both a Viewing Client and an Editing
Client (able to make changes to settings), click both the Settings Editor
and Bill Viewer boxes.
• If you are setting up this PC as the Network database server, click all
three boxes.
Electro Industries/GaugeTech
Electro Industries/GaugeTech
The Leader In Power Monitoring and Smart Grid Solutions
The Leader In Power Monitoring and Smart Grid Solutions
Doc#
E167701
1-10
1: Step 1 - Install the Application
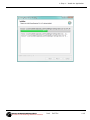
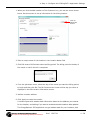
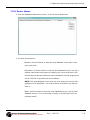
7. Click the check box next to the components you want and click Install. You will see
the screen shown below as the software is being installed.
8. If you want to display the detailed actions during the installation, click the Show
Details button. You will see a display on the lower part of the screen as files are
being installed. See the example screen on the next page.
Electro Industries/GaugeTech
Electro Industries/GaugeTech
The Leader In Power Monitoring and Smart Grid Solutions
The Leader In Power Monitoring and Smart Grid Solutions
Doc#
E167701
1-11
1: Step 1 - Install the Application
Electro Industries/GaugeTech
Electro Industries/GaugeTech
The Leader In Power Monitoring and Smart Grid Solutions
The Leader In Power Monitoring and Smart Grid Solutions
Doc#
E167701
1-12
1: Step 1 - Install the Application
9. When the application has been installed, you will see the screen shown below.
10. Click Finish to close the Setup Wizard.
Electro Industries/GaugeTech
Electro Industries/GaugeTech
The Leader In Power Monitoring and Smart Grid Solutions
The Leader In Power Monitoring and Smart Grid Solutions
Doc#
E167701
1-13
1: Step 1 - Install the Application
11.To run the application, select it from the Start menu:
Start>All Programs>Electro Industries>EnergyReporter EXT>Energy Reporter EXT
Viewer or EnergyReporter EXT Settings Editor
Electro Industries/GaugeTech
Electro Industries/GaugeTech
The Leader In Power Monitoring and Smart Grid Solutions
The Leader In Power Monitoring and Smart Grid Solutions
Doc#
E167701
1-14
1: Step 1 - Install the Application
1.3: Connect to the Database Server
If you are running the EnergyReporter EXT application on a PC that is not the database server, or does not have the database files you want to use, you need to specify
where the application can find the database files you need.
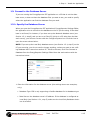
1.3.1: Specify the Database Server
When you open the EnergyReporter EXT application’s EnergyReporter Settings Editor,
the application tries to connect to the database on the PC you are using. If the database is not found, for instance, if you have set up the Network database sever (see
Section 1.2.1, step 6) and you are on a Client PC (which is a PC other than the Network server), you will see a screen with the Configure System icon. Click the icon to
open the screen shown below.
NOTE: If you set up the Local Only database server (see Section 1.2.1, step 5) on the
PC you are using, you do not need to change anything, unless you want to use a billing database that is stored on another PC. If that is the case, click File>Connect to
Database from the EnergyReporter Settings Editor Menu bar and continue with the
instructions below.
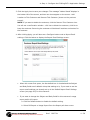
1. Enter the information for the database server (the settings above are examples,
only):
• Database Type: EIG is only supporting a PostGre database for its database type.
• Data Source: the database server’s IP address. If the database is configured as
Local Only (see Section 1.2.1, step 5) make sure the Local Only Database checkbox is selected.
Electro Industries/GaugeTech
Electro Industries/GaugeTech
The Leader In Power Monitoring and Smart Grid Solutions
The Leader In Power Monitoring and Smart Grid Solutions
Doc#
E167701
1-15
1: Step 1 - Install the Application
• Port: the port to connect to the server on. By default, the port is 5432, which displays when you click the Default checkbox.
• Requires Login: Leave this box checked.
2. Click the OK button to process your entries. The software connects to the specified
database.
1.4: Enter a Software License Key
When you first use the EnergyReporter EXT application, you need to enter the software license key that lets you use the full version of the application (the Demo version
lets you set up only one location and does not perform the automatic check for
updates).
1. From the EnergyReporter Settings Editor, click the Upgrade License icon (or click
Help>Upgrade User License).
Electro Industries/GaugeTech
Electro Industries/GaugeTech
The Leader In Power Monitoring and Smart Grid Solutions
The Leader In Power Monitoring and Smart Grid Solutions
Doc#
E167701
1-16
1: Step 1 - Install the Application
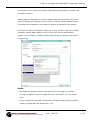
This window opens.
Enter license key here
and click Upgrade
2. Contact EIG’s inside sales staff at [email protected]. In the email give your
name, company name and the Unique ID code shown in the License Info screen.
You will receive a reply email with the software license key.
3. Enter the software license key and click the Upgrade button. The software will be
upgraded to the full version of the application.
Electro Industries/GaugeTech
Electro Industries/GaugeTech
The Leader In Power Monitoring and Smart Grid Solutions
The Leader In Power Monitoring and Smart Grid Solutions
Doc#
E167701
1-17
1: Step 1 - Install the Application
1.5: Steps for Using the EnergyReporter EXT Application
As mentioned at the beginning of this chapter, the EnergyReporter EXT application
generates bills using either Communicator EXTTM log databases or the polling engine
of the HMI EXTTM application. (Because the HMI EXTTM application is specifically configured for each customer site, data setup for the EnergyReporter EXT application is
done when the HMI EXTTM application is installed and configured by a certified system
integrator.)
You already performed Step 1 in this chapter. You need to perform the following steps
in order to set up the database files to be used for Energy and other commodity
logging, and to use the EnergyReporter EXT application to generate usage reports and
bills:
Step 2 - Use the MeterManager EXT application to set up your meters for automatic
log retrieval. Instructions for this step is given in Chapter 2; additional information is
located in chapters 16 and 18 of the Communicator EXTTM 4.0 Software User
Manual.
Step 3 - The EIG meters are already set up for Energy logging - there is nothing additional you need to do. If you need to make any changes, you use the Communicator
EXTTM application to configure your meter(s) to log the values you want to use for
Energy and other commodity logging. The instructions for this are in Chapter 3.
Step 4 - Configure the EnergyReporter EXT application settings: provider, customer,
customer locations, rate structures, meters at location. The instructions for this step
are in Chapter 4.
Step 5 - Use the EnergyReporter Dashboard Viewer: use the Usage Dashboard to
compare usage data for different time frames/meters/dates and compared to weather
data; generate and view usage reports and bills The instructions for this step are in
Chapter 5.
Chapter 6 - Manage data.
Chapter 7 - View the Action log, test the application, and learn additional tips and
advanced options.
Electro Industries/GaugeTech
Electro Industries/GaugeTech
The Leader In Power Monitoring and Smart Grid Solutions
The Leader In Power Monitoring and Smart Grid Solutions
Doc#
E167701
1-18
2: Step 2 - Use MeterManager EXT to Automate EnergyReporter EXT
2: Step 2 - Use MeterManager EXT to
Automate EnergyReporter EXT
You use the MeterManagerEXT application to organize your meters and to set up automatic log retrieval, both of which make the EnergyReporter EXT application very simple to use.
•
The MeterManager EXT application lets you automatically add all of your network
meters to its Meter List. The Meter List is an essential feature for the EnergyReporter EXT application. All you have to do to set up your billing locations is to add
meters to it from the Meter List. All of the meter data you need is then automatically brought into the EnergyReporter EXT application.
•
The MeterManager EXT application lets you set up automatic log retrieval for all of
your meters.
NOTE: The basic steps are described here, but there are other features of the
MeterManager EXT application, which are covered in the Communicator EXTTM 4.0 and
MeterManager EXT Software User Manual.
There are two ways to add meters into the Meter List:
1. Auto Discovery - this is the simplest method. In this mode the software searches
out and locates any meters on the network. Once the meters are found, they are
automatically added to groups (based on the meter type), and the software automatically begins to download stored meter data.
2. Manual Connect - in this mode, you manually connect to the meter using its IP
address. Once the address is entered, the software adds it to a group (based on the
meter type), and automatically begins to collect stored meter data for that meter.
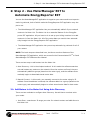
2.1: Add Meters to the Meter List Using Auto Discovery
There are two methods to configure Auto Discovery. Use whichever one best suits
your needs.
•
Auto Scan - searches an IP range you enter for network meters and adds them to
the Meter List.
Electro Industries/GaugeTech
Electro Industries/GaugeTech
The Leader In Power Monitoring and Smart Grid Solutions
The Leader In Power Monitoring and Smart Grid Solutions
Doc#
E167701
2-1
2: Step 2 - Use MeterManager EXT to Automate EnergyReporter EXT
•
Meter Discovery Configuration - gives you access to additional settings for customizing scanning for meters. See Chapter 18 in the Communicator EXTTM 4.0 and
MeterManager EXT Software User Manual for instructions for using Meter Discovery
Configuration.
When you use Auto Scan, the application looks for and adds Network meters in the IP
address range you enter. You have the option of putting the meters into groups based
on meter type, e.g., Shark.
NOTE: The first time you start the MeterManager Monitor after installation, you are
asked if you want to enable Auto Scan. EIG recommends that you do enable Auto
Scan.
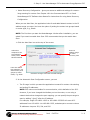
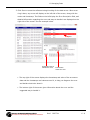
1. Click the Auto Scan icon at the top of the screen.
Enter IP
address range
for meter
discovery here
Unless this
computer is the
Log Collection
server, leave
this box checked
Leave this checkbox selected if you
want meters put in
groups by meter
model, e.g, Shark
Click Save to begin scan with selected settings
2. In the Automatic Scan Configuration screen, you set:
• The IP range in which you want the application to search for meters: the starting
and ending IP addresses.
NOTE: EIG meters use Modbus for communication, which defaults to Port 502.
However, if you have changed the Modbus port on the meter, or are using a
network device that changes the port mapping, you can specify the port range to
scan by adding ":[port]" after the IP address.
For example, range 192.168.0.1:503 to 192.168.0.255:505 will scan all IP
addresses from 192.168.0.1 to 192.168.0.255, and attempt to connect to those
IP addresses via ports 503, 504, and 505.
Electro Industries/GaugeTech
Electro Industries/GaugeTech
The Leader In Power Monitoring and Smart Grid Solutions
The Leader In Power Monitoring and Smart Grid Solutions
Doc#
E167701
2-2
2: Step 2 - Use MeterManager EXT to Automate EnergyReporter EXT
•
Whether or not meters are grouped by meter model. Leave the checkbox
selected to group any discovered meters this way, for example, into Shark or
Nexus groups. Groups are used to perform tasks on multiple meters at one time.
See Section 18.2.2 for information on groups.
•
Disable automatic log retrieval - the default of this screen is that automatic log
retrieval is disabled for the computer (the box is checked). That is because only
one computer in the network - the server, should be enabled for automatic log
retrieval.
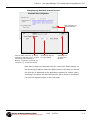
• If this computer is not the Log Collection server, leave the box checked.
• If this computer is the Log Collection server, click on the box to uncheck it
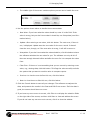
- the screen will change as shown below.
Click to set up a
log retrieval
interval of other
than every 12
hours (not
recommended)
• Now that you have enabled automatic log retrieval for the computer, you
can set the log retrieval interval. The default is every 12 hours, which is
the recommended setting. If you want to change the interval, click the
Configure button and then enter the new interval. See the example
screen on the next page.
Electro Industries/GaugeTech
Electro Industries/GaugeTech
The Leader In Power Monitoring and Smart Grid Solutions
The Leader In Power Monitoring and Smart Grid Solutions
Doc#
E167701
2-3
2: Step 2 - Use MeterManager EXT to Automate EnergyReporter EXT
Changing Log Retrieval Interval screen
Click Configure to
open this screen
Click to select: Interval - to set up
interval log retrieval; Time - to set a
specific log retrieval time; or
Manual - to perform a manual log
retrieval, e.g., to test the system
Click to set interval
for log retrieval
Click Apply to
save the new
interval
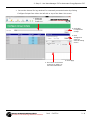
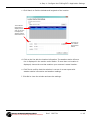
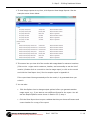
• Click Save to begin the automatic scan for meters with these settings. In
the Searching IP Address field of the Status section, the Meter List screen
will show the IP addresses as the application searches for meters. When
searching is complete, the discovered meters will be shown in the Meters
List (see the example screen on the next page).
Electro Industries/GaugeTech
Electro Industries/GaugeTech
The Leader In Power Monitoring and Smart Grid Solutions
The Leader In Power Monitoring and Smart Grid Solutions
Doc#
E167701
2-4
2: Step 2 - Use MeterManager EXT to Automate EnergyReporter EXT
Electro Industries/GaugeTech
Electro Industries/GaugeTech
The Leader In Power Monitoring and Smart Grid Solutions
The Leader In Power Monitoring and Smart Grid Solutions
Doc#
E167701
2-5
2: Step 2 - Use MeterManager EXT to Automate EnergyReporter EXT
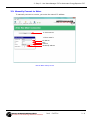
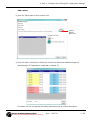
2.2: Manually Connect to Meter
To manually connect to a meter, you enter the meter’s IP address.
2. Click Connect
1. Enter meter’s:
IP address
Port
Protocol
Modbus® address
Manual Meter Setup Screen
Electro Industries/GaugeTech
Electro Industries/GaugeTech
The Leader In Power Monitoring and Smart Grid Solutions
The Leader In Power Monitoring and Smart Grid Solutions
Doc#
E167701
2-6
2: Step 2 - Use MeterManager EXT to Automate EnergyReporter EXT
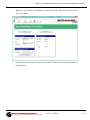
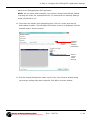
When you click Connect, the software looks for the meter, and, when found, shows
the screen below.
This screen shows meter connection information. Click Connect to add the meter to
the Meter List.
Electro Industries/GaugeTech
Electro Industries/GaugeTech
The Leader In Power Monitoring and Smart Grid Solutions
The Leader In Power Monitoring and Smart Grid Solutions
Doc#
E167701
2-7
2: Step 2 - Use MeterManager EXT to Automate EnergyReporter EXT
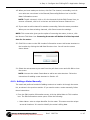
•
You set the interval for log retrieval for a manually connected meter by clicking
Configure Scripts from either the left side or top of the Meter List screen.
1. Select the
group the
meter is in
5. Click Save
to implement
change
2. Click
Configure to
open the
Interval setting
screen
4. Click Apply
3. This screen is the same
as shown on page 2-4:
see instructions there
Electro Industries/GaugeTech
Electro Industries/GaugeTech
The Leader In Power Monitoring and Smart Grid Solutions
The Leader In Power Monitoring and Smart Grid Solutions
Doc#
E167701
2-8
2: Step 2 - Use MeterManager EXT to Automate EnergyReporter EXT
2.3: Log Retrieval through MeterManager EXT
When log retrieval is performed by the MeterManager EXT application, logs for all of
the meters in the group(s) are automatically retrieved at the programmed interval,
making the job of managing multiple meters simple. The EnergyReporter EXT application automatically imports the retrieved logs and uses them to build the EnergyReporter usage database. The usage database is then used to generate usage reports,
bills, and viewing Dashboard data. See the diagram below.
Meters on the
Network
Auto Scan
Automatically
Downloads All
Detected Meters
Each Meter Can
be Mapped into
EnergyReporter
EXT (i.e.,
assigned to
locations)
Auto Connect using
MeterManager
EXT’s Auto Scan
Once Meters are
Mapped,
EnergyReporter
EXT Configures
Meters into the
Application
Auto Scan Puts Meters
in Groups by Type
EnergyReporter
EXT Software
Automatically
Provides
Reporting
For more detailed instructions on the MeterManager EXT application, see Chapter 18
of the Communicator EXTTM 4.0 Software User Manual.
Electro Industries/GaugeTech
Electro Industries/GaugeTech
The Leader In Power Monitoring and Smart Grid Solutions
The Leader In Power Monitoring and Smart Grid Solutions
Doc#
E167701
2-9
2: Step 2 - Use MeterManager EXT to Automate EnergyReporter EXT
This page intentionally left blank.
Electro Industries/GaugeTech
Electro Industries/GaugeTech
The Leader In Power Monitoring and Smart Grid Solutions
The Leader In Power Monitoring and Smart Grid Solutions
Doc#
E167701
2 - 10
3: Step 3 - Set Up Logging
3: Step 3 - Set Up Logging
In most cases, there is no need to do anything special to set up logging for the EnergyReporter EXT database. This is because all EIG meters ship with a default Device
Profile that logs energy values. As long as you haven’t changed this, the automatic log
retrieval set for the meters using MeterManager EXT will get all the data that the
EnergyReporter EXT application needs in order to generate usage reports.
However, in the event that you need to make a change, you set up Energy, Energy in
the Interval, and other Commodity logging in the meter’s Device Profile, accessed
through the Communicator EXTTM 4.0 software.
NOTE: Only the basic steps are given here. For more detailed information, consult the
Communicator EXTTM 4.0 and MeterManager EXT Software User Manual (you can
access the manual online by clicking Help>Contents in the Communicator EXTTM 4.0
Menu Bar).
1. Click Help
2. Click Contents to
view manual
1. Open the Communicator EXTTM 4.0 application by clicking Start>All Programs>Electro Industries>Communicator EXT. You will see the screen shown above.
Electro Industries/GaugeTech
Electro Industries/GaugeTech
The Leader In Power Monitoring and Smart Grid Solutions
The Leader In Power Monitoring and Smart Grid Solutions
Doc#
E167701
3-1
3: Step 3 - Set Up Logging
2. Click the Connect icon in the Icon bar to connect to the meter you are setting up.
Click Connect icon
See the example screen below.
1. Enter Device
Address
2. Enter
Device’s
IP Address
3. Click Connect
Electro Industries/GaugeTech
Electro Industries/GaugeTech
The Leader In Power Monitoring and Smart Grid Solutions
The Leader In Power Monitoring and Smart Grid Solutions
Doc#
E167701
3-2
3: Step 3 - Set Up Logging
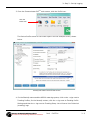
3. From the Communicator EXTTM main screen, click the Profile icon.
Click the
Profile icon
The Device Profile screen for the meter opens. See the example screen, shown
below.
Shark® 200 Meter Device Profile Screen
4. For the Shark® meters and the MP200 metering system, click on the + sign next to
Trending Profiles; for the Nexus® meters, click the + sign next to Trending Profile
Settings and then the + sign next to Trending Setup. You will see a list of historical
(trending) logs.
Electro Industries/GaugeTech
Electro Industries/GaugeTech
The Leader In Power Monitoring and Smart Grid Solutions
The Leader In Power Monitoring and Smart Grid Solutions
Doc#
E167701
3-3
3: Step 3 - Set Up Logging
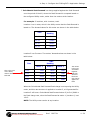
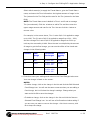
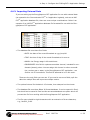
Double-click on the log you want to use to trend energy or other usage. You will see a
screen that lets you select the values you want to log. Refer to the table below for the
values to select for energy logging.
NOTE: For the MP200 metering system there is only one historical log for use with the
EnergyReporter EXT application - either historical log 2 for the MP200-Y three phase
configuration or historical log 3 for the MP200-S single phase configuration. The log is
pre-configured with the data points you need for logging.
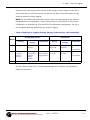
Table of Settings for Logging Energy, Energy in the Interval, and Commodity
Group/Sub-group
Meter
Energy
Interval
Energy
Data Point
Commodity
Energy
Interval
Energy
Commodity
Shark
Energy
Energy in the
Interval
Accumulators
Watt-hours
Received
Watt-hours
Received
Input used
for
accumulation
Nexus
Accumulators
/ Energy/
Scaled
Primary
Interval
Accumulators
/ Energy/
Scaled
Primary
Internal Pulse
Accumulation
/Aggregations
Quadrant
1+4 Wh
Quadrant
1+4 Wh
Input used
for
accumulation
MP200
Pre-configured in Log 2 (MP200-Y) or Log 3 (MP200-S)
See the Communicator EXTTM 4.0 and MeterManager EXT Software User Manual for
detailed instructions.
Electro Industries/GaugeTech
Electro Industries/GaugeTech
The Leader In Power Monitoring and Smart Grid Solutions
The Leader In Power Monitoring and Smart Grid Solutions
Doc#
E167701
3-4
4: Step 4 - Configure the E-Billing EXTTM Application Settings
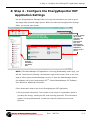
4: Step 4 - Configure the EnergyReporter EXT
Application Settings
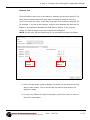
Use the EnergyReporter Settings Editor to set up the information you need to generate usage data, bills and usage reports. When you start the EnergyReporter Settings
Editor you see the main screen.
Icons for setting
up provider,
customer, rate
structure,
importing all
logs, and
accessing the
EnergyReporter
Dashboard
Viewer are in 2
places
Customers,
locations,
and meters
are shown
here
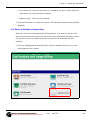
NOTE: If the MeterManager EXT application is running (downloading meter logs), you
will see “Script Service Running” at the bottom right of the screen. Click on the message to either pause the MeterManager service, or open the MeterManager Monitor.
See Chapters 18 of the Communicator EXTTM 4.0 and MeterManager EXT Software
User Manual for additional information.
Follow these basic steps to set up the EnergyReporter EXT application:
1. Set up provider information. The provider is the person or organization which is
providing the energy, sending the bill, and receiving payments. This information
appears on the generated bills, so that the customer knows where to send
payment.
Electro Industries/GaugeTech
Electro Industries/GaugeTech
The Leader In Power Monitoring and Smart Grid Solutions
The Leader In Power Monitoring and Smart Grid Solutions
Doc#
E167701
4-1
4: Step 4 - Configure the E-Billing EXTTM Application Settings
2. Set up rate structures. The rate structure is the collection of settings that determine what rates to apply to the usage values for a commodity, e.g., kWh. The rate
structure includes On Peak and Off Peak settings, holidays, and other charges, such
as taxes.
3. Set up a customer. A customer is the person or organization which is receiving the
bill. A customer may have multiple locations, each of which will get its own bill.
4. Set up the customer’s locations. A billing location is a single unit for which a bill is
generated, e.g., a building. A customer can have multiple locations.
5. Assign the meters and a rate structure to the customer’s locations. Each location
can have multiple meters and a rate structure for each commodity being billed for,
e.g., Energy and gas.
6. A meter billing point can also be an aggregate of more than one metering point;
this is called a virtual meter. For example:
• Meter A + Meter B
• Meter A + 50% of Meter B
• Meter A - Meter B
• Meter A - 50% of Meter B
• Etc.
With virtual meters a user can configure meters to accurately represent the load,
by apportioning the correct amount of energy per meter for the actual circuit
usage.
Electro Industries/GaugeTech
Electro Industries/GaugeTech
The Leader In Power Monitoring and Smart Grid Solutions
The Leader In Power Monitoring and Smart Grid Solutions
Doc#
E167701
4-2
4: Step 4 - Configure the E-Billing EXTTM Application Settings
For example, if your customer owns three apartment buildings, you would set up each
building as a location, and enter all of the meters in a building as well as any rate
structures applied to usage for that building.
See the diagram below.
Water
Meter
Meter
Customer
Meter
Location
Meter
Customer is the
person who
receives the bJll
Gas
Meter
Meter
Some locations
may be large and
have more than one
measurement point
Meter
Location
Meter
Location
Location is the
physical address of
what is being billed
Meter
Device measuring the
actual energy usage
Figure 4.1: Overview of Customer Locations, Meters, Rate Structures
Electro Industries/GaugeTech
Electro Industries/GaugeTech
The Leader In Power Monitoring and Smart Grid Solutions
The Leader In Power Monitoring and Smart Grid Solutions
Doc#
E167701
4-3
4: Step 4 - Configure the E-Billing EXTTM Application Settings
4.1: Set Up a Provider
First set up the provider information. The provider is the person who is sending the
bill to the customer. The provider will get paid for providing the electricity or other
commodity to the customer; the customer is the user of the commodity.
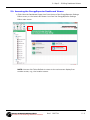
1. From the EnergyReporter Settings Editor main screen, click the Configure Provider
Information icon.
2. For the provider, enter:
• Name
• Telephone
• Address
• The address where payment should be sent
• Email Server Settings:
Electro Industries/GaugeTech
Electro Industries/GaugeTech
The Leader In Power Monitoring and Smart Grid Solutions
The Leader In Power Monitoring and Smart Grid Solutions
Doc#
E167701
4-4
4: Step 4 - Configure the E-Billing EXTTM Application Settings
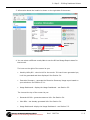
• Click Configure next to Email Server Settings to open the screen below.
The settings on this screen are used by the software to automatically
email bills and enabled reports to customers.
Enter the following:
- From Email: enter the name that will appear in the emails’ From field.
NOTE: When the checkbox next to “Send copy of emails to provider” is
selected (checked), a copy of any bill or report email sent to a customer
is sent to the From email address.
- Host Settings: enter the email’s Host Name, Port, and User name and
Password if being used.
- Send Settings: enter the number of email retries in sending and the
Retry Timeout in milliseconds (the default is 1000ms). If you want to
disable the Retry Timeout, enter 0 in this field.
- Click OK to close this screen. You will see the Provider Information
screen.
Electro Industries/GaugeTech
Electro Industries/GaugeTech
The Leader In Power Monitoring and Smart Grid Solutions
The Leader In Power Monitoring and Smart Grid Solutions
Doc#
E167701
4-5
4: Step 4 - Configure the E-Billing EXTTM Application Settings
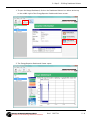
• Report Settings:
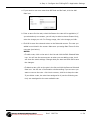
• Click Configure next to Report Settings to open the screen below.
step a.
step b.
step c.
step d.
a. Click Configure next to Email Report Settings to set up automatic
emailing of bills and/or usage reports. The screen below opens.
- Select Bill Report or Usage Report from the pull-down menu.
- Click the Enable checkbox to set the report to be emailed automatically.
- Enter a Subject line and Body text that will appear in the email.
- Click OK to save the settings. The screen closes.
NOTE: If you want to send both Bill Report and Usage Report, repeat this
process.
b. In the Report Settings screen, you have the option to enter a Due
Period. If you want to do so, click the checkbox next to Display Due
Electro Industries/GaugeTech
Electro Industries/GaugeTech
The Leader In Power Monitoring and Smart Grid Solutions
The Leader In Power Monitoring and Smart Grid Solutions
Doc#
E167701
4-6
4: Step 4 - Configure the E-Billing EXTTM Application Settings
Period in Bill and enter the number of days from the bill’s origination date
until the due date.
c. You also have the ability to enter optional text that you want to be
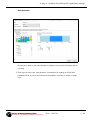
printed on the bill. If you want to do so, click the checkbox next to Enable
Bill Notes and enter the text you want printed on the bill in the Notes
field.
d. Click OK to save your selections. You will be returned to the Provider
Information screen.
• Click Select to choose a company logo for the bill.
NOTE: The image must be 256x128 pixels in size. If it is not, the image will be
scaled by the application, which may result in the image not looking the way you
want.
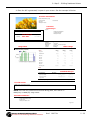
5. Click Store to save your entries and then click Exit to close the screen.
The automatic Bill Report and Usage Report email feature lets you generate hundreds
of automated bills or energy reports. You can configure the system to send out bills to
users automatically on a monthly basis. This feature provides you with an automated
accounting service and eliminates any need for third party billing providers. You
receive feedback of successful transmission for accounting purposes and can set up a
cc address so that you receive a copy of the bill or usage report.
Electro Industries/GaugeTech
Electro Industries/GaugeTech
The Leader In Power Monitoring and Smart Grid Solutions
The Leader In Power Monitoring and Smart Grid Solutions
Doc#
E167701
4-7
4: Step 4 - Configure the E-Billing EXTTM Application Settings
4.2: Set Up Rate Structures
The next step is creating rate structures that will be applied to billed usage at
locations.
• A rate structure is the way in which costing is calculated in monetary numbers. For
example, if in an American jurisdiction, the rates will be set up in US dollars.
• Each utility has a different method of calculating rates for electrical usage. For this
reason, the user can set up the rate structure to mimic what the utility is generally
doing.
• You can set up one rate structure for each commodity at a location.
•
Multiple locations can use the same rate structure.
1. From the EnergyReporter Settings Editor main screen, click the Edit Rate Structures icon.
2. If you have already set up rate structures, you will see those in the box on the left.
To add a new rate structure, click the Add New Rate Structure icon.
Electro Industries/GaugeTech
Electro Industries/GaugeTech
The Leader In Power Monitoring and Smart Grid Solutions
The Leader In Power Monitoring and Smart Grid Solutions
Doc#
E167701
4-8
4: Step 4 - Configure the E-Billing EXTTM Application Settings
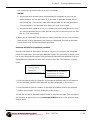
3. Select Seasonal Schedule or Flat Rate from the pull-down menu and click OK.
• Select Seasonal Schedule to set up a rate structure with different rates for
different times of the day, week, and/or year. Then continue with step 4.
• Select Flat Rate to set up a rate structure with a single rate only (no On Peak/Off
Peak, Seasons, Weekend/Weekday or Holiday rates). Then go to step 6.
4. After selecting Seasonal Schedule, you’ll see the screen above. Use this screen to
set up all of the information for this rate. Do the following:
•
Enter a name for the rate structure; this name will appear on the bill.
•
Select Commodity from the pull-down menu. A commodity is a usage value the
software uses when computing the rates for a bill from the imported Energy or
other commodity data. You can select an existing commodity, or Create New. For
Energy usage, select kWh. When the bill is generated, the software uses the rate
structure for the commodity, e.g., kWh, to determine the charge for the amount
of usage the customer has for the billing period, e.g., total kWh.
Electro Industries/GaugeTech
Electro Industries/GaugeTech
The Leader In Power Monitoring and Smart Grid Solutions
The Leader In Power Monitoring and Smart Grid Solutions
Doc#
E167701
4-9
4: Step 4 - Configure the E-Billing EXTTM Application Settings
If you select Create New, you will see the screen shown below, which lets you
set up a new commodity to use.
a. Enter a name for the new commodity.
b. Select the scalar from the pull-down menu - you can select Unit (1),
k(1000), M(1000000) or Custom (Infinity). If you select custom, another
field opens up on the screen for you to enter the Custom Scalar value.
The scalar you select is applied to the commodity’s usage values for all of
the meters. This is important because the meters themselves may have
been set up with different scaling values. The scalar insures that the usage
values will all be scaled the same way in the EnergyReporter EXT application.
When you are tracking usage other than Energy, a custom scalar can be
used to change the unit measured. For example, if you are tracking Condensate (steam), the meter’s pulse accumulator channel, i.e., Digital Input,
records the number of pulses coming from the Condensate meter which is
measuring the steam directly. But you may need to convert the pulse accumulation value to MMBTUs for your billing. In this case, you would use the
scalar to convert the number of pulses to the MMBTU usage value. See the
figure and example screen on the next page.
Electro Industries/GaugeTech
Electro Industries/GaugeTech
The Leader In Power Monitoring and Smart Grid Solutions
The Leader In Power Monitoring and Smart Grid Solutions
Doc#
E167701
4 - 10
4: Step 4 - Configure the E-Billing EXTTM Application Settings
Pulse Accumulation Measurement Example
-This example converts measured condensate to MMBTU's
Measured
Steam
Pulses are
counted
by meter
Meter with
Pulse Output
Meter’s
Digital
Input
Outputs
Pulses
Import
Log Data
(Pulse Accumulator)
MMBTU *
Commodity
EnergyReporter
EXT Application
*
Pulse Values scaled from Condensate to MMBTU's
MMBTU Data
*
* To convert condensate to MMBTU,
This value should be the value to convert 1 pulse to MMBTU.
For example, if 1 pulse = 1 kgallon of steam, and 1 gallon of steam equals 8.2345 MMBTU, then the
scalar should be 0.0082345.
Figure 4.2: Scalar Example for Commodities Other Than Energy
c. Click OK to save your entries and close the screen (click Cancel if you want
to close the screen without saving your entries).
Electro Industries/GaugeTech
Electro Industries/GaugeTech
The Leader In Power Monitoring and Smart Grid Solutions
The Leader In Power Monitoring and Smart Grid Solutions
Doc#
E167701
4 - 11
4: Step 4 - Configure the E-Billing EXTTM Application Settings
• The other settings for rate structure are as follows:
Seasons Setting
Some utility companies bill their customers higher rates at different times of the
year. The reason for this is that it may be more costly for utilities to generate or
buy electricity during peak seasons.
The Seasons setting lets you set up different rates for up to four different times
of the year that you may need in your rate jurisdiction. Select the number of
seasons from the pull-down menu. If you select more than one season, you will
see a Seasons tab that you will use to set the seasons’ dates. You use the Rates
tab to set different On-Peak and Off-Peak rates for each season, and you use the
Rate Times tab to assign On-Peak and Off-Peak to different days and times of
the day, for each season.
Electro Industries/GaugeTech
Electro Industries/GaugeTech
The Leader In Power Monitoring and Smart Grid Solutions
The Leader In Power Monitoring and Smart Grid Solutions
Doc#
E167701
4 - 12
4: Step 4 - Configure the E-Billing EXTTM Application Settings
Weekdays/Weekends
A weekday is usually billed at a higher time of use rate than a weekend. For this
reason, you can select what days are designated as a weekend in your
jurisdiction.
Click the Weekdays tab to designate days as weekday or weekend (this is the
tab view you see when the screen first opens). You use the Rates tab to set different rates for weekends and weekdays.
Holidays
A holiday is a day that is billed at a different rate than a weekday or a weekend.
Typically, it is considered an off-peak time, which will be billed at a lower rate.
The EnergyReporter EXT application configures holidays based on a perpetual
calendar. A perpetual calendar allows you to set up the holidays once and from
then on have the software determine all the future holidays based on the rules
you set up.
Electro Industries/GaugeTech
Electro Industries/GaugeTech
The Leader In Power Monitoring and Smart Grid Solutions
The Leader In Power Monitoring and Smart Grid Solutions
Doc#
E167701
4 - 13
4: Step 4 - Configure the E-Billing EXTTM Application Settings
You can set up different Holiday rates for different seasons.
Click the Holidays tab.
Use this screen to designate days that will use the Holiday rate. Once you set
up the holidays you use the Rates tab to enter the Holiday rate.
a. Click the Add New Holiday icon.
b. Enter a name for the holiday.
Electro Industries/GaugeTech
Electro Industries/GaugeTech
The Leader In Power Monitoring and Smart Grid Solutions
The Leader In Power Monitoring and Smart Grid Solutions
Doc#
E167701
4 - 14
4: Step 4 - Configure the E-Billing EXTTM Application Settings
c. You have these options for setting up the holiday:
• Click the radio button next to Every and select the month and day from
the pull-down menus, e.g., January 1. The nearest Monday and Nearest
Weekday checkboxes are used for holidays that are changed to another
day of observance if they fall on a Saturday or Sunday. If the holiday will
be celebrated on the following Monday if it falls on a weekend, click the
Nearest Monday checkbox. If the holiday will be celebrated on the nearest
weekday if it falls on the weekend (i.e., Friday if the holiday falls on Saturday, or Monday if it falls on Sunday), click the Nearest Weekday checkbox.
• Click the second radio button and select First, Second, Third, Fourth,
Fifth, or Last from the first pull-down menu; select the day of the week
from the second pull-down menu; and select the month from the third
pull-down menu, e.g., The Third Thursday in November for U.S. Thanksgiving Day.
• Click the radio button next to Specific Day and click the pull-down menu
to open a calendar that lets you choose the day of the holiday that only
occurs once.
• Click the radio button next to Special Days to select a holiday that doesn’t
follow any of the above rules, such as Easter.
d. Click OK to save the holiday and return to the Holidays tab screen.
NOTES:
• To edit a holiday, click on the holiday in the list and click the Edit Selected
Holiday icon. You will see the same screen as when you are adding a holiday, but it will show the holiday’s settings. Change what you want and
click OK to save the changes.
• To delete a holiday, click on the holiday in the list and click the Remove
Selected Holiday icon. You will see a Confirmation window asking if you
are sure you want to remove the holiday - click Yes to remove; click No to
keep the holiday.
Electro Industries/GaugeTech
Electro Industries/GaugeTech
The Leader In Power Monitoring and Smart Grid Solutions
The Leader In Power Monitoring and Smart Grid Solutions
Doc#
E167701
4 - 15
4: Step 4 - Configure the E-Billing EXTTM Application Settings
Fixed Charges
A fixed charge is a charge that is added onto the bill.
Click the Fixed Charges tab to configure single charges you want to be applied
to the commodity when the bill is generated.
You can add a fixed charge, edit an existing fixed charge, or remove an existing fixed
charge. You can also assign the fixed charges to any of the seasons you have set up.
Electro Industries/GaugeTech
Electro Industries/GaugeTech
The Leader In Power Monitoring and Smart Grid Solutions
The Leader In Power Monitoring and Smart Grid Solutions
Doc#
E167701
4 - 16
4: Step 4 - Configure the E-Billing EXTTM Application Settings
a. Click the Add Fixed Charge icon. You will see the screen shown below.
b. Select the Charge Type from the pull-down menu. You can select Fixed,
Peak Demand, Flat Rate, Tax, Coincidental Peak Demand, or Tiered Rate:
• Fixed: select this to add a single charge that is added to the bill when it is
generated, regardless of the usage amount, e.g., processing fee.
• Peak Demand: select this to enter a Peak Demand surcharge, which
is an additional charge applied to Peak (highest amount) demand during
the billing period (see step d).
• Flat Rate: select this to add a charge that applies to the total usage, e.g.,
a Generation charge or Fuel surcharge. This rate is multiplied by the total
usage when the bill is generated.
• Tax: select this to enter a tax percentage that will be applied to the total
when the bill is generated, i.e., multiplied by the total dollar amount on
the bill for the commodity, and added to the bill.
• Coincidental Peak Demand: select this to compute the Peak Demand time
from a meter at another location, e.g., a Utility meter. The time of the
charge comes from the Utility meter, but the charge is applied to the sum
of the location’s meter(s)’ usage. See the example on page 5-18.
Electro Industries/GaugeTech
Electro Industries/GaugeTech
The Leader In Power Monitoring and Smart Grid Solutions
The Leader In Power Monitoring and Smart Grid Solutions
Doc#
E167701
4 - 17
4: Step 4 - Configure the E-Billing EXTTM Application Settings
• Tiered Rate: select Tiered rates to indicate charges that are dependent on
the amount of usage during the Bill period. For example, a multiple tiered
rate may be defined to encourage energy conservation by charging higher
rates for customers that exceed what is considered typical consumption.
c. For charge types Fixed, Flat Rate, and Taxed, you must enter the Charge
Name, select what season(s) to apply it to from the pull-down menu, and
enter the Rate (or Percentage for Tax).
Click to select fixed charge
Click to select season(s)
Enter name
Enter rate
Click OK
Electro Industries/GaugeTech
Electro Industries/GaugeTech
The Leader In Power Monitoring and Smart Grid Solutions
The Leader In Power Monitoring and Smart Grid Solutions
Doc#
E167701
4 - 18
4: Step 4 - Configure the E-Billing EXTTM Application Settings
d. If you select Peak Demand, the screen changes as shown below.
The charge’s name defaults to Peak Demand, though you can change it if
you want. The name appears on the bill next to the Peak Demand
charge.
e. Select the season(s) to apply the Peak Demand charge to, enter the
Peak Demand rate, and click the checkbox(es) (rate periods) you want
the Peak Demand rate applied to. You can apply it to Holiday, Peak and/or
Seasonal Off Peak usage. The Peak Demand rate you enter will be applied
to peak demand in the selected rate periods when the bill is generated, i.e.
the Peak Demand usage is multiplied by the Peak Demand rate to get the
Peak Demand charge.
Electro Industries/GaugeTech
Electro Industries/GaugeTech
The Leader In Power Monitoring and Smart Grid Solutions
The Leader In Power Monitoring and Smart Grid Solutions
Doc#
E167701
4 - 19
4: Step 4 - Configure the E-Billing EXTTM Application Settings
f. Coincidental Peak Demand is a charge applied against the Peak Demand
over the period of the bill, where the Peak Demand is computed based on
the configured Utility meter, rather then the meters at the location.
For example: 2 locations, with 4 meters, total.
Location 1 has 1 meter, which is the Utility meter that the Peak Demand is
based on. The demand values for this meter are shown in the table below.
Time
kWh
Reading
12:00
15kWh
12:15
17kWh
12:30
16kWh
12:45
14kWh
Location 2 has 3 meters. The meters’ demand values are shown in the
table below.
kWh
Reading
Time
Meter 1
This is the time
of the Utility
meter’s Peak
Demand
Meter 2
Meter 3
12:00
7kWh
8kWh
3kWh
12:15
4kWh
3kWh
1kWh
12:30
5kWh
1kWh
8kWh
12:45
15kWh
20kWh
9kWh
The values
in this row
are added
together
and then
will have
the fixed
rate charge
applied to
them
When the Coincidental Peak Demand fixed charge is set up using the Utility
meter, and this rate structure is applied to Location 2, a bill generated for
Location 2 will have a Coincidental Peak Demand value of (4+3+1) 8kWh x
the fixed charge rate, since the Peak Demand at meter 1 (Location 1) is at
12:15.
NOTE: The Utility meter can be at any location.
Electro Industries/GaugeTech
Electro Industries/GaugeTech
The Leader In Power Monitoring and Smart Grid Solutions
The Leader In Power Monitoring and Smart Grid Solutions
Doc#
E167701
4 - 20
4: Step 4 - Configure the E-Billing EXTTM Application Settings
After selecting Coincidental Peak Demand, select the season(s) to apply it
to, enter a Name and Rate for the Coincidental Peak Demand, and then
choose the coincidental Utility meter from the pull-down menu.
g. Tiered Rate: a tiered rate gets higher (more expensive) as the amount of
energy consumed increases. This rate type is typically used to encourage
customers to conserve usage. You would use the Tiered Rate option to set
up charges that vary depending on the amount of usage during the Bill
period, charging higher rates when their usage exceeds a certain amount.
Electro Industries/GaugeTech
Electro Industries/GaugeTech
The Leader In Power Monitoring and Smart Grid Solutions
The Leader In Power Monitoring and Smart Grid Solutions
Doc#
E167701
4 - 21
4: Step 4 - Configure the E-Billing EXTTM Application Settings
Select which season(s) to apply the Tiered Rate to, give the Tiered Rate a
name, and enter the Tiers information: the highest amount of usage in the
Tier (entered in the Tier field) and the rate for the Tier (entered in the Rate
field).
NOTE: The Tiered Rate screen’s default is Tiers 1 and 2 and an overage
Tier (unnumbered.) Click the + button to add a Tier and then enter the
upper usage amount and rate for the Tier. You can click the - button to
remove a tier.
For example, in the screen above, Tier 1’s rate of $0.01 is applied to usage
up to 1000, Tier 2’s rate of $0.02 is applied to usage from 1001 - 2000,
and the overage Tier’s rate of $0.05 is applied to usage from 2001 up.
Let’s say the commodity is kWh. Since the rate is multiplied by the amount
of usage to get the final charge, you can see the effect of the tiered rate
charges in the following table:
Customer
kWh
Usage
Tiered Rate
Surcharges
Added to
Monthly
Bill
#1
900
$0.01 x 900
$9.00
#2
1500
$0.01 x 1000
$0.02 x 500
$20.00
#3
2500
$0.01 x 1000
$0.02 x 1000
$0.05 x 500
$45.00
h. Click OK to save your settings and return to the Fixed Charges tab screen.
Your new charge is listed on the screen.
NOTES:
• To edit a charge, click on the charge in the list and click the Edit Selected
Fixed Charge icon. You will see the same screen as when you are adding a
fixed charge, but it will show the charge’s settings. Change what you
want and click OK to save the changes.
• To delete a charge, click on the charge in the list and click the Remove
Selected Fixed Charge icon. You will see a Confirmation window asking if
you are sure you want to remove the charge - click Yes to remove; click
No to keep the charge.
Electro Industries/GaugeTech
Electro Industries/GaugeTech
The Leader In Power Monitoring and Smart Grid Solutions
The Leader In Power Monitoring and Smart Grid Solutions
Doc#
E167701
4 - 22
4: Step 4 - Configure the E-Billing EXTTM Application Settings
Rates
Rates are the amount of money charged per usage commodity. For instance,
with electricity, the rate is usually an amount of cents per kWh. On Peak rates
often cost more than Off Peak rates. If you are not using Time of Use based
rates, then set only one rate and amount. The charge per unit is in dollars and
cents, so for 5 cents, enter 0.05.
Click the Rates tab to configure specific rates: by Default, On Peak, Off Peak, and
Holiday rates. If you have set up seasons, you can configure rates for each
season; you can also configure Holiday rates for each season. The rates will be
applied to the usage when the bill is generated, e.g., if you set a rate for Season
1 Off Peak, that rate is applied to all usage that occurs during Off Peak times,
during the period designated as Season 1.
Electro Industries/GaugeTech
Electro Industries/GaugeTech
The Leader In Power Monitoring and Smart Grid Solutions
The Leader In Power Monitoring and Smart Grid Solutions
Doc#
E167701
4 - 23
4: Step 4 - Configure the E-Billing EXTTM Application Settings
a. If you want to use more rates than Off Peak and On Peak, click the Add
Rate icon.
b. Enter a name for the rate; select the Season the rate will be applied to (if
you selected only one season, you will only be able to choose Season One);
enter the charge per unit. For Energy usage, this is the charge per kWh.
c. Click OK to save the rate and return to the Rates tab screen. The rate you
added is now listed in the screen. Make sure you assign Rate Times for this
new rate (see below).
NOTES:
• To edit a rate, click on the rate in the list and click the Edit Selected Rate
icon. You will see the same screen as when you are adding a rate, but it
will show the rate’s settings. Change what you want and click OK to save
the changes.
• To delete a rate, click on the rate in the list and click the Remove Selected
Rate icon. You will see a Confirmation window asking if you are sure you
want to remove the rate - click Yes to remove; click No to keep the rate.
If you delete a rate, the rate times assigned to it (see the following section) are reassigned to the next available rate.
Electro Industries/GaugeTech
Electro Industries/GaugeTech
The Leader In Power Monitoring and Smart Grid Solutions
The Leader In Power Monitoring and Smart Grid Solutions
Doc#
E167701
4 - 24
4: Step 4 - Configure the E-Billing EXTTM Application Settings
Rate Times
Click the Rate Times tab to assign periods to your rates. You can assign rates to
15 minute time intervals within a day. You set rates for both weekday and weekend time intervals, as well as for both Season 1 and Season 2 if you set up two
seasons for this rate structure. These settings are used to generate the bill by
identifying which rate is applied to the usage for the specific time period, e.g., if
you set Season 1 Weekend time intervals as all Off Peak, then any usage for
Season 1 weekends is charged the Off Peak rate.
Electro Industries/GaugeTech
Electro Industries/GaugeTech
The Leader In Power Monitoring and Smart Grid Solutions
The Leader In Power Monitoring and Smart Grid Solutions
Doc#
E167701
4 - 25
4: Step 4 - Configure the E-Billing EXTTM Application Settings
a. Click on one of the groups to display its settings on the right side of the
screen.
Right-click in this box to
display a menu allowing
multiple selections
b. Click in the Off Peak or On Peak box next to a time range to change its setting. You also have the following multiple selection options:
• You can right-click in the box on the right and select “Set all rate times to
either” Off Peak or On Peak.
• You can select multiple time ranges by clicking on the first rate time you
want to change, then holding down the Shift key and clicking on the last
rate time you want to change: the rate times you selected are now highlighted in blue. Then right-click in the box on the right and select “Set
selected rate times to” either Off Peak or On Peak.
Electro Industries/GaugeTech
Electro Industries/GaugeTech
The Leader In Power Monitoring and Smart Grid Solutions
The Leader In Power Monitoring and Smart Grid Solutions
Doc#
E167701
4 - 26
4: Step 4 - Configure the E-Billing EXTTM Application Settings
Seasons Tab
Click the Seasons tab to set up the dates for between two and four seasons. The
dates for the seasons determine what rate is charged for usage in that time
period. The rates are set up in the Rate Times tab, which was just explained. So,
for example, if you set up two seasons, and you set a Weekday On Peak rate for
Season 1 and a different Weekday On Peak rate for Season 2, the program
checks the date of usage to see which rate should be applied.
NOTE: You will only see the Seasons tab if you selected more than one season.
Enter Name
for the
Seasons
Select End
Date for the
Seasons
a. Click in the pull-down menus to display a calendar you use to select the end
date for each season. This is the last day the rates for that season are
applied to usage.
b. In each entry field to the right of the season, specify the name to show on
the bill for that season.
Electro Industries/GaugeTech
Electro Industries/GaugeTech
The Leader In Power Monitoring and Smart Grid Solutions
The Leader In Power Monitoring and Smart Grid Solutions
Doc#
E167701
4 - 27
4: Step 4 - Configure the E-Billing EXTTM Application Settings
Rate Calendar
Review your rates on the rate calendar to make sure you have everything set up
correctly.
5. Click Store to save your rate structure. Instructions for setting up a Flat Rate
schedule follow. If you do not need this information, continue to step 8 on page
4-31.
Electro Industries/GaugeTech
Electro Industries/GaugeTech
The Leader In Power Monitoring and Smart Grid Solutions
The Leader In Power Monitoring and Smart Grid Solutions
Doc#
E167701
4 - 28
4: Step 4 - Configure the E-Billing EXTTM Application Settings
6. To set up a rate structure with Fixed Charges only (no Time of Use, such as On
Peak/Off Peak, Seasons, Weekend/Weekday or Holiday rates), select Flat Rate from
the Add Rate Structure pull-down menu.
You will see a screen similar to the Fixed Charges tab of the Seasonal Schedule.
Electro Industries/GaugeTech
Electro Industries/GaugeTech
The Leader In Power Monitoring and Smart Grid Solutions
The Leader In Power Monitoring and Smart Grid Solutions
Doc#
E167701
4 - 29
4: Step 4 - Configure the E-Billing EXTTM Application Settings
a. Enter a Name for the Rate Structure, select the Commodity it will be
applied to from the pull-down menu, and click Edit Selected Fixed Charge.
b. Keep the Charge Type as Flat Rate, and enter a Flat Rate Name and Rate.
c. Click OK to save the fixed charge.
7. Click Store to save your Flat Rate rate structure.
Electro Industries/GaugeTech
Electro Industries/GaugeTech
The Leader In Power Monitoring and Smart Grid Solutions
The Leader In Power Monitoring and Smart Grid Solutions
Doc#
E167701
4 - 30
4: Step 4 - Configure the E-Billing EXTTM Application Settings
8. Click Exit to return to the Configure Rate Structures screen. Your new rate structure is now listed in the Rate Structures box and there is a new box called Locations
That Use This Rate at the bottom left of the screen. Once you assign customer locations to this rate, they are listed in the box.
NOTES:
• To edit an existing rate structure, click on the rate structure and click the Edit the
Selected Rate Structure icon. You will see the same screen as when you are adding a rate structure, but it will show the rate structure’s settings. Change what
you want and click OK to save the changes. Any new bills generated will use the
changed settings.
• If you edit a rate structure that has already been used for the generation
of a bill, you are given the opportunity to archive the rate structure in its
pre-edited condition so that previously generated bills may be reproduced
using the rate structure that was in effect at the time the bill was origi-
Electro Industries/GaugeTech
Electro Industries/GaugeTech
The Leader In Power Monitoring and Smart Grid Solutions
The Leader In Power Monitoring and Smart Grid Solutions
Doc#
E167701
4 - 31
4: Step 4 - Configure the E-Billing EXTTM Application Settings
nally generated. If you choose not to archive the edited rate structure,
regenerating the bill will use the rates as defined in the newly edited rate
structure. Once a rate structure has been archived, the archived copy
may not be edited again.
• If a rate structure has been archived, it will be used to generate cost data
in the Usage Dashboard cost graphs for the billing periods when the
archived rate structure was still in effect.
Archive Rate Structure Screen: Click Yes to Save the Rate Structure
Electro Industries/GaugeTech
Electro Industries/GaugeTech
The Leader In Power Monitoring and Smart Grid Solutions
The Leader In Power Monitoring and Smart Grid Solutions
Doc#
E167701
4 - 32
4: Step 4 - Configure the E-Billing EXTTM Application Settings
• To delete a rate structure, click on the rate structure and click the Remove the
Selected Rate Structure icon. You will see a Confirmation window asking if you
are sure you want to remove the rate structure - click Yes to remove; click No to
keep the rate structure. Removing the rate structure also removes it from any
locations using it.
• You can also add, edit, or delete commodities from the Rate Structures screen.
a. Click the Edit Commodities icon.
Click
this
icon
Electro Industries/GaugeTech
Electro Industries/GaugeTech
The Leader In Power Monitoring and Smart Grid Solutions
The Leader In Power Monitoring and Smart Grid Solutions
Doc#
E167701
4 - 33
4: Step 4 - Configure the E-Billing EXTTM Application Settings
b. You will see the screen shown below. The existing commodities are listed in
the box on the left. To add a commodity, click the Add New Commodity
icon; to edit a commodity, click on the commodity in the list and click the
Edit Selected Commodity icon. In both cases you will see the same Edit
Commodity screen that was explained earlier in this section (beginning on
page 4-8).
c. To delete the commodity, click on the commodity in the list and click the
Remove Selected Commodity icon. You will see a confirmation window click Yes to delete the commodity; click No to keep the commodity. Removing a commodity will remove all of the rate structures that use the
commodity.
Electro Industries/GaugeTech
Electro Industries/GaugeTech
The Leader In Power Monitoring and Smart Grid Solutions
The Leader In Power Monitoring and Smart Grid Solutions
Doc#
E167701
4 - 34
4: Step 4 - Configure the E-Billing EXTTM Application Settings
4.3: Set Up a Customer
Next you set up customer information. The customer is the person who will be
receiving the bill from the provider. The customer can have one location or multiple
locations. The software will generate a bill for each location for this customer.
1. From the EnergyReporter Settings Editor main screen, click the Add Customer icon.
You will see the screen shown below, but there will be an Apply icon in place of the
other icons.
2. Enter the following:
• Customer ID: enter a unique identifier for the customer, which will be used to
identify this customer.
• Customer Name: enter the customer’s name (this does not have to be unique).
• Address: enter the customer’s billing address.
• Telephone number
• Email Address
• Report Email Settings: after you click Apply you will be able to set up this field.
Electro Industries/GaugeTech
Electro Industries/GaugeTech
The Leader In Power Monitoring and Smart Grid Solutions
The Leader In Power Monitoring and Smart Grid Solutions
Doc#
E167701
4 - 35
4: Step 4 - Configure the E-Billing EXTTM Application Settings
3. Click the Apply icon to save your changes. The message “Values Saved” displays in
the bottom left of the screen, and two new icons appear on the screen - Add
Location to This Customer and Remove This Customer (shown on the previous
screen).
NOTE: If you want to delete the customer, click the Remove This Customer icon.
You will see a confirmation window - click Yes to delete the customer; click No to
keep the customer. Removing the customer will delete all locations and meters for
the customer.
4. After clicking Apply, you will also see a Configure button next to Report Email
settings. Click the button to display the Report Email Settings screen.
•
When this screen first opens, the Use default box is checked and the Subject
and Body fields aren’t editable. Keep that setting as is, if you want to use the
report email settings you already set up in the Default Report Email Settings
screen (see page 4-6) for this customer.
•
If you want to change the Subject and Body fields for this customer’s usage
report and/or bill report:
a. Click the Default button to disable the default setting.
b. Select Bill Report or Usage Report from the Report pull-down menu.
Electro Industries/GaugeTech
Electro Industries/GaugeTech
The Leader In Power Monitoring and Smart Grid Solutions
The Leader In Power Monitoring and Smart Grid Solutions
Doc#
E167701
4 - 36
4: Step 4 - Configure the E-Billing EXTTM Application Settings
c. Enter the Subject and Body text you want to use.
d. Click the Enable checkbox.
e. Repeat these steps if desired, for the other Report option.
f. Click OK to close the screen.
5. Click Add Location to This customer and continue to the next section.
4.4: Set Up a Location and Add Meters to It
Once you have set up a customer, you enter the customer’s billing locations. A
location is the physical address - the actual location that is consuming the power or
other commodity.
• Customers can have multiple locations. They can also have a rate structure for each
commodity being billed for at a location, e.g., Energy and gas.
• Each location can have one or more meters attached to it. If there is more than one
meter, the software creates a virtual, “aggregated” meter that stores the composite
usage data of all the location’s meters. Whenever a meter data import is
performed, the Aggregated Meter is updated with new usage data for all the meters
at that location. The Aggregated Meter is displayed on the main screen of the Bill
Settings Editor, in the Location tree.
Aggregated Meter
Physical Meters
Electro Industries/GaugeTech
Electro Industries/GaugeTech
The Leader In Power Monitoring and Smart Grid Solutions
The Leader In Power Monitoring and Smart Grid Solutions
Doc#
E167701
4 - 37
4: Step 4 - Configure the E-Billing EXTTM Application Settings
1. When you click the Add Location to This Customer icon, you see the screen shown
below. Use this screen to set up information for the billing location.
Click to
select Bill
Period
2. Enter a unique name for the location in the Location Name field.
3. Click Edit next to Bill Period to select a billing period. The billing period is the day of
the month on which the bill is computed.
4. From the pull-down menu, select the day of the month you want the billing period
to begin and then click OK. The Bill Period screen closes and the day you chose is
displayed in the Edit Location Information screen.
5. Add the Location address.
6. Click Apply to create the location.
A window opens with weather data information based on the address you entered
for the location, and asking if you want to enable automatic weather data updates.
The EnergyReporter EXT application can get weather data for your locations; that
Electro Industries/GaugeTech
Electro Industries/GaugeTech
The Leader In Power Monitoring and Smart Grid Solutions
The Leader In Power Monitoring and Smart Grid Solutions
Doc#
E167701
4 - 38
4: Step 4 - Configure the E-Billing EXTTM Application Settings
you can then use to compare commodity usage against temperature, humidity, and
barometric pressure.
Weather data is collected from an online weather data service provider. The service
uses the latitude and longitude of your location to find the closest weather station.
The latitude and longitude for this location’s address is displayed in the window.
Verify that the discovered weather location is correct, and then click Yes to enable
automatic weather data updates; click No if you don’t want to automatically
update, or if you want to configure weather data collection manually (instructions
on page 4-41).
NOTES:
• The default for weather display is Fahrenheit. You can change it to Celsius
through the Options screen’s Configuration tab. See Section 7.4.2 for instructions.
• You can disable the automatic configuration of weather data through the Option
screen’s Configuration tab. See Section 7.4.2.
Electro Industries/GaugeTech
Electro Industries/GaugeTech
The Leader In Power Monitoring and Smart Grid Solutions
The Leader In Power Monitoring and Smart Grid Solutions
Doc#
E167701
4 - 39
4: Step 4 - Configure the E-Billing EXTTM Application Settings
• Weather data consists of temperature, humidity and barometric pressure.
Usually, the weather station updates this information not more than once an
hour; but it may choose to limit the number of requests that can be fulfilled per
hour.
7. The screen changes to offer more options.
The new options let you:
• Configure weather data collection manually
• Add a meter to this location
• Add a rate structure to this location
• Edit a rate structure for this location
• Remove a rate structure from this location
• Remove this location
In addition, there are two boxes on the screen - one for Rate Structures assigned to
this location, and one for meters assigned to this location. When you are adding a
Electro Industries/GaugeTech
Electro Industries/GaugeTech
The Leader In Power Monitoring and Smart Grid Solutions
The Leader In Power Monitoring and Smart Grid Solutions
Doc#
E167701
4 - 40
4: Step 4 - Configure the E-Billing EXTTM Application Settings
new location, these boxes will be empty, but if you are editing an existing location,
there will be entries in the boxes.
Enable Weather Data Collection Manually
If you want to manually enter or edit weather data collection settings for a location:
a. Click the Configure button in the Weather Data section of the screen.
Click the Enable
checkbox
Click the
Search button
The city, state, and
zip code of your
location are
displayed here
b. Make sure the Enable Weather Data Collection checkbox is checked. The
city, state, and zip code of your location are displayed in the Address bar. If
more than one location is displayed, choose the one that matches your
customer’s actual location.
Electro Industries/GaugeTech
Electro Industries/GaugeTech
The Leader In Power Monitoring and Smart Grid Solutions
The Leader In Power Monitoring and Smart Grid Solutions
Doc#
E167701
4 - 41
4: Step 4 - Configure the E-Billing EXTTM Application Settings
c. Click Search to find the latitude and longitude of the location.
The location’s
information is
displayed here:
click on this line
to display the
weather station
information here
Click Test to
see weather
and weather
station
d. Click on the line with the location information. The weather station information is displayed in the section under Station. If more than one location is
displayed, choose the one that matches your customer’s actual location.
e. Click Test to confirm that the selection is correct. A screen opens with
weather station information and weather readings.
f. Click OK to close the window and save the settings.
Electro Industries/GaugeTech
Electro Industries/GaugeTech
The Leader In Power Monitoring and Smart Grid Solutions
The Leader In Power Monitoring and Smart Grid Solutions
Doc#
E167701
4 - 42
4: Step 4 - Configure the E-Billing EXTTM Application Settings
Add a Meter
8. Click the Add a Meter to this Location icon.
Click to
display
Meter List
9. Click the Meter List button to display the meters that have been added through the
MeterManager EXT application (explained in Chapter 2).
The Meter List lets you quickly and easily add meters and all of their associated
Electro Industries/GaugeTech
Electro Industries/GaugeTech
The Leader In Power Monitoring and Smart Grid Solutions
The Leader In Power Monitoring and Smart Grid Solutions
Doc#
E167701
4 - 43
4: Step 4 - Configure the E-Billing EXTTM Application Settings
data into the EnergyReporter EXT application.
NOTE: You can add a meter manually if you need to, though the preferred method
is through the meter list, as described here. For instructions on manually adding a
meter, see Section 4.4.1.
10. The meters are listed in their assigned groups. Click on a meter and click the
Select button to add it. The Edit Meter Information screen is re-displayed, with the
selected meter’s Import Location.
Selected
meter’s
location
information
Click to
import
meter
settings
11. Click the Import Settings from Meter Log File icon. You will see a window telling
you that the settings have been imported. Click OK to close the window.
Electro Industries/GaugeTech
Electro Industries/GaugeTech
The Leader In Power Monitoring and Smart Grid Solutions
The Leader In Power Monitoring and Smart Grid Solutions
Doc#
E167701
4 - 44
4: Step 4 - Configure the E-Billing EXTTM Application Settings
12. Click the Apply icon. The screen will re-display showing the selected meter’s
information and additional icons.
Selected
meter’s
information
Selected
meter’s
first energy
channel
data
Channel
icons
Remove
Meter icon
13. After the meter settings are imported from the meter’s log file and you click Apply,
the first energy channel is selected and displayed in the Channel fields. A channel
is a single type of data item from the meter’s log database, e.g., Watt-hours
Received. The channel will be linked to a commodity for use in generating bills;
e.g., the Watt-hours Received channel linked to the kWh commodity. The Channel
icons let you add channels, edit them, or remove them.
To add a channel, Click Add Channel.
14. Select the channel from the pull-down menu. The channels you see are the data
values that you set up for this log using the Communicator EXTTM 4.0 application.
Electro Industries/GaugeTech
Electro Industries/GaugeTech
The Leader In Power Monitoring and Smart Grid Solutions
The Leader In Power Monitoring and Smart Grid Solutions
Doc#
E167701
4 - 45
4: Step 4 - Configure the E-Billing EXTTM Application Settings
They are channels for Energy and/or pulse accumulations. See Section 4.4.3 for
channel setting instructions for external databases, such as an HMI EXTTM
application database.
15. Select the commodity from the pull-down menu. Once the data has been
imported, it will be tracked by the commodity.
• You can select only one channel per commodity, per meter, e.g., Total
Watt-hours for kWh.
• A meter can have multiple commodities. See the diagram below.
Tracking Energy Usage through
Voltage and Current Inputs
Meter
Pulse Input 1 Gas Usage
Pulse Input 2 Condensate
Figure 4.3: Example of Meter Measuring Multiple Commodities
16. Auto-adjust Rollover is the default selection on the screen. The unscaled rollover
field will display the settings from the Communicator EXTTM 4.0 software for this
channel, if you click on the Auto-adjust Rollover box to de-select it. You can edit
the value in the unscaled rollover field.
NOTE: Manually setting the rollover field is only applicable to older Nexus® 1250
models or HMI EXTTM application values.
17. The Percentage of Usage Applied to Bill field lets you add or subtract a portion of
the usage for this channel, for this meter, to the bill when it is generated, allowing
for credits for certain meters. You might want to use this if you want to remove a
meter from being billed for this usage. For example, if you have a main meter at a
location, e.g., a meter attached to the building’s utility feeder, and submeters in
individual tenant units, you may want to bill for main meter usage, comprised of
things like hallway and outside lighting, on a separate bill from the tenant billing.
To do this you would put 100% for the usage field for the submeters and -100%
for the usage field for the meter attached to the utility feeder.
Electro Industries/GaugeTech
Electro Industries/GaugeTech
The Leader In Power Monitoring and Smart Grid Solutions
The Leader In Power Monitoring and Smart Grid Solutions
Doc#
E167701
4 - 46
4: Step 4 - Configure the E-Billing EXTTM Application Settings
18. When you have made your choices, click OK. The channel, commodity, and rollover value are now shown in the Channel/Commodity/Rollover box in the Edit
Meter Information screen.
NOTE: To edit a channel, click on it in the box and click the Edit Channel icon; to
remove a Channel, click on it in the box and click the Remove Channel icon.
19. If you want to add a channel for another commodity, follow the same procedure.
When you are done selecting channels, click Store to save the settings.
NOTE: This screen also gives you the option of removing the meter; to do so, click
the Remove This Meter icon. Removing the meter will delete all of the imported
data for the meter.
20. Click Exit to return to the Edit Location Information screen. Add a rate structure to
the Location by clicking the Add Rate Structure icon. You will see the screen
shown below.
21. Select the rate structure you want from the pull-down menu and click OK to close
the screen.
NOTE: You can also select Create New to add a new rate structure. Follow the
instructions for adding a rate structure in Section 4.2.
4.4.1: Adding a Meter Manually
The usual and preferred method of adding meters to a location is through the meter
list, as shown in the previous section. If you need to enter a meter manually, follow
these instructions:
1. From the Edit Location Information screen, click the Add a Meter to This Location
icon. The Edit Information screen opens. Enter the following:
• Meter Name: enter a unique identifier for the meter. This name must be unique
across all locations. It is used to identify the meter’s billing data.
Electro Industries/GaugeTech
Electro Industries/GaugeTech
The Leader In Power Monitoring and Smart Grid Solutions
The Leader In Power Monitoring and Smart Grid Solutions
Doc#
E167701
4 - 47
4: Step 4 - Configure the E-Billing EXTTM Application Settings
• Meter Serial #: enter the meter’s serial number.
• Meter Type: enter the meter type (Nexus® or Shark®).
2. Import Location is the place where the meter’s billing log data is stored (e.g.,
C:\Users\Public\Documents\Electro Industries\Communicator_EXT\Retrieved
Logs). This log data file contains the raw values the EnergyReporter EXT application
imports in order to generate its billing database, i.e., Energy usage or pulse
accumulations. Refer to Figure 4.1 for a depiction of the data flow between
applications; see Chapter 2 if you need to refresh your understanding of setting up
the meters’ historical logs for EnergyReporter EXT application use.
Click Browse to locate the meter’s log database file.You will see a screen that lets
you locate and select the log file. See the example screen shown below.
NOTES:
• The log database file comes from either the Communicator EXTTM 4.0 application
(*.db or *.dml: the database created when logs are retrieved using the Communicator EXTTM 4.0 application) or the HMI EXTTM application (*.dbf: the billing
data database created by the HMI EXTTM software; see that software’s documentation for details).
Electro Industries/GaugeTech
Electro Industries/GaugeTech
The Leader In Power Monitoring and Smart Grid Solutions
The Leader In Power Monitoring and Smart Grid Solutions
Doc#
E167701
4 - 48
4: Step 4 - Configure the E-Billing EXTTM Application Settings
• See Section 6.1 for file importing suggestions.
WARNINGS!
• Be careful when selecting the location to import from. Importing is done
by the EnergyReporter Settings Editor software, and if you select a location that is not accessible (or invalid), you may not be able to import the
data.
• If you change the import location file, it will wipe out the selected
channels. You will have to select the channels you want to import, again.
3. When you find the file you want to use, click Open. The screen closes and you see
the Edit Meter Information screen. The log file’s path is now displayed on the
screen next to Import Location.
4. Once you’ve selected the file to import from, the application will verify that it
contains log items that can be linked to commodities. This includes Energy, e.g.,
Total Watt-hours, and pulse accumulations, e.g., a Digital Input channel.
5. If you are using a Communicator EXTTM 4.0 log database, click the Import Settings
from Meter Log File icon (this function is not applicable to HMI EXTTM databases).
You will see the message window shown below. It tells you that the meter settings
were imported from the meter with the serial number listed in the screen. Click OK
to close the window.
NOTE: The Import Settings function will only fill in a meter name that has not
already been entered. If you have already filled in the meter name, it will leave that
as is.
TIP: EIG highly recommends importing all the meter configuration data.
This automated tool makes the meter configuration task much simpler.
Electro Industries/GaugeTech
Electro Industries/GaugeTech
The Leader In Power Monitoring and Smart Grid Solutions
The Leader In Power Monitoring and Smart Grid Solutions
Doc#
E167701
4 - 49
4: Step 4 - Configure the E-Billing EXTTM Application Settings
6. Click the Apply icon to create the meter. The Edit Meter information screen re-displays with additional options - now you can choose the channels to import. See the
example screen shown below.
7. Continue from step 13 in Section 4.4.
4.4.2: Meter at Location Example
If you have two meters at a location, for example, each metering a utility feeder, you
would set up both meters for the location, following the instructions in this section.
When you import data, the software will import all of the usage data for both meters
and when the bill is generated the usage for both meters will be totalized to arrive at
the billed dollar amount. See the diagram on the next page.
Electro Industries/GaugeTech
Electro Industries/GaugeTech
The Leader In Power Monitoring and Smart Grid Solutions
The Leader In Power Monitoring and Smart Grid Solutions
Doc#
E167701
4 - 50
4: Step 4 - Configure the E-Billing EXTTM Application Settings
Location
Meter 1
Meter 2
E-Billing EXT™ Application
Imports data from meters
Generates Bill for Location
Bill
Usage for Meter 1 and
Meter 2 are on the Bill
Charges for Meter 1 and
Meter 2 are Totalized to
Arrive at Total Billing
Charge
Figure 4.4: Totalizing Meters
Electro Industries/GaugeTech
Electro Industries/GaugeTech
The Leader In Power Monitoring and Smart Grid Solutions
The Leader In Power Monitoring and Smart Grid Solutions
Doc#
E167701
4 - 51
4: Step 4 - Configure the E-Billing EXTTM Application Settings
4.4.3: Importing External Data
If you are setting up the EnergyReporter EXT application for use with external data
(as opposed to the Communicator EXTTM 4.0 application log data), such as an HMI
EXTTM application database file, there are some unique considerations. Below is an
example of an HMI EXTTM application database file formatted for use with the EnergyReporter EXT application.
• The database file must have four fields:
• DATE: the date of the record formatted as yyyy/mm/dd
• TIME: the time of day of the record formatted as hh:mm:ss
• KWHR: the Energy usage in kilo-watt-hours
• CONDENSATE: this field is a pulse accumulator channel, intended for condensate (steam) pulses. You can assign this channel to other commodities, such as gas or water, in the EnergyReporter EXT application - see
Section 4.4 for instructions. This field is assumed to be in kilo scale.
These are the only fields you can use. If you need to use more fields, split the
data into multiple files and import as multiple meters.
• The optimal interval for the data is 15 minutes, time-stamped on the minute.
• The database file must be a dBase IV format database. It can be opened in Excel,
but should not be saved in Excel as this can cause database corruption which will
prevent the file from working with the EnergyReporter EXT application.
• The file name should be eight characters with an extension of three characters,
e.g., Nx1500_2.dbf.
Electro Industries/GaugeTech
Electro Industries/GaugeTech
The Leader In Power Monitoring and Smart Grid Solutions
The Leader In Power Monitoring and Smart Grid Solutions
Doc#
E167701
4 - 52
4: Step 4 - Configure the E-Billing EXTTM Application Settings
NOTES:
•
HMI EXTTM databases separate the original meter from the data, so there is no
way for the application to determine the rollover value. Consult the HMI EXTTM
configuration and documentation to determine the correct value to enter. Your
system integrator will have to provide you with the Energy or other commodity
rollover value.
•
If no rollover is programmed in the HMITM EXT application, the EnergyReporter
EXT application rollover value should be the same as the rollover value in the
meter’s device profile, set in the Communicator EXTTM 4.0 application (in the
meter’s Device Profile>Revenue and Energy Settings>Energy Scaling).
Rollover Value
Electro Industries/GaugeTech
Electro Industries/GaugeTech
The Leader In Power Monitoring and Smart Grid Solutions
The Leader In Power Monitoring and Smart Grid Solutions
Doc#
E167701
4 - 53
4: Step 4 - Configure the E-Billing EXTTM Application Settings
This page intentionally left blank.
Electro Industries/GaugeTech
Electro Industries/GaugeTech
The Leader In Power Monitoring and Smart Grid Solutions
The Leader In Power Monitoring and Smart Grid Solutions
Doc#
E167701
4 - 54
5: Step 5 - E-Billing Dashboard Viewer
5: Step 5 - EnergyReporter Dashboard Viewer
The EnergyReporter EXT application has two main components. The first is a settings
editor/server that provides all of the calculations and stores the data in the usage
database. The second is a viewer application. The viewer component allows the user
to view and analyze the stored data. Both components can be installed on one
machine; however, the editor/server can only be installed on one machine. The
viewer is a client component and can be installed on multiple machines.
Single Computer Mode (One Computer Only, or Remote Desktop Application)
Settings Editor/Server
Viewer
TM
Communicator EXT 4.0
MeterManager EXT
Multi-Computer Mode
Server
Clients
Settings Editor/Server
Viewer
Viewer
TM
Communicator EXT 4.0
TM
Communicator EXT 4.0
MeterManager EXT
Figure 5.1: Settings Editor/Server and Viewer Installed on One PC
Electro Industries/GaugeTech
Electro Industries/GaugeTech
The Leader In Power Monitoring and Smart Grid Solutions
The Leader In Power Monitoring and Smart Grid Solutions
Doc#
E167701
5-1
5: Step 5 - E-Billing Dashboard Viewer
You used the EnergyReporter Settings Editor/Server to set up customers, locations for
customers, and meters at locations, as well as commodities and rate structures that
will be applied to usage. The MeterManager EXT application automatically downloads
the logs from the selected meters and the EnergyReporter EXT application automatically imports the commodity usage data from the logs. The EnergyReporter EXT
application generates the bills and usage reports based on the billing period and
report criteria you have set up using the EnergyReporter Settings Editor.
The EnergyReporter Dashboard Viewer is the part of the EnergyReporter EXT application that lets you see, print, and export billing and usage information for the customers, locations, and meters.
As mentioned in Chapter 4, locations with multiple meters generate a virtual meter to
store aggregated meter data. The Aggregate Meter’s data can also be accessed from
the EnergyReporter Dashboard Viewer.
Electro Industries/GaugeTech
Electro Industries/GaugeTech
The Leader In Power Monitoring and Smart Grid Solutions
The Leader In Power Monitoring and Smart Grid Solutions
Doc#
E167701
5-2
5: Step 5 - E-Billing Dashboard Viewer
5.1: Accessing the EnergyReporter Dashboard Viewer
1. Click either the Dashboard Viewer icon from the top of the EnergyReporter Settings
Editor screen, or the Launch Bill Viewer icon from the EnergyReporter Settings
Editor main screen.
NOTE: You can click Tools>Refresh to return to the main screen display from
another screen, e.g., the Location screen.
Electro Industries/GaugeTech
Electro Industries/GaugeTech
The Leader In Power Monitoring and Smart Grid Solutions
The Leader In Power Monitoring and Smart Grid Solutions
Doc#
E167701
5-3
5: Step 5 - E-Billing Dashboard Viewer
2. The EnergyReporter Dashboard Viewer application starts and you see the main
EnergyReporter Viewer screen. Choose a location from the tree on the left side of
the screen.
Click on the location you
want to see
Electro Industries/GaugeTech
Electro Industries/GaugeTech
The Leader In Power Monitoring and Smart Grid Solutions
The Leader In Power Monitoring and Smart Grid Solutions
Doc#
E167701
5-4
5: Step 5 - E-Billing Dashboard Viewer
3. Information about the location is shown on the right side of the screen.
Bill and Report
Status
Click to select another
month/date
4. You can select a different month/date to see the Bill and Usage Report status for
that month.
The icons on the right of the screen let you:
•
Monthly Utility Bill - view the bill for the month. If it hasn’t been generated yet,
it will be generated and then displayed. See Section 5.4.
•
Executive Summary - generate the Executive Summary Usage report based on
your selections. See Section 5.3.1.
•
Usage Dashboard - display the Usage Dashboard - see Section 5.2.
The icons at the top of the screen let you:
•
Generate All Bills - generate customer bills. See Section 5.4.
•
View Bills - see already generated bills. See Section 5.4.
•
Usage Dashboard- display the Usage Dashboard - see Section 5.2.
Electro Industries/GaugeTech
Electro Industries/GaugeTech
The Leader In Power Monitoring and Smart Grid Solutions
The Leader In Power Monitoring and Smart Grid Solutions
Doc#
E167701
5-5
5: Step 5 - E-Billing Dashboard Viewer
•
Settings Editor - open the EnergyReporter Settings Editor application. See
Chapter 4.
The menu items at the top of the screen let you:
•
File - select to connect to the database or exit the EnergyReporter Dashboard
Viewer.
•
Reports - view or generate bills and usage reports, per selected criteria. See
sections 5.3 and 5.4.
•
Tools - view bill data, view bill errors for locations, export meter data, perform
advanced tasks (see chapters 6 and 7).
• Help - check for updates, see User Manual, see information about the application
version, read the User License.
Electro Industries/GaugeTech
Electro Industries/GaugeTech
The Leader In Power Monitoring and Smart Grid Solutions
The Leader In Power Monitoring and Smart Grid Solutions
Doc#
E167701
5-6
5: Step 5 - E-Billing Dashboard Viewer
5.2: Usage Dashboard
One of the important features of the EnergyReporter EXT application is the Usage
Dashboard. It supports an Enterprise-wide billing solution by allowing you to easily
view Energy and other commodity usage data in a number of formats:
• View usage by day, week, month, year, or by a customized date range
• Compare usage between meters/locations
• Compare usage against weather data
• View costs
• View top Demand by day, week, month, year, or by a customized date range
• View meter logs (for meters set up using the MeterManager EXT Meter List)
• Connect to the meter through Communicator EXTTM 4.0 software (for meters set up
using the MeterManager EXT Meter List)
• Copy, export, or print graph image
Electro Industries/GaugeTech
Electro Industries/GaugeTech
The Leader In Power Monitoring and Smart Grid Solutions
The Leader In Power Monitoring and Smart Grid Solutions
Doc#
E167701
5-7
5: Step 5 - E-Billing Dashboard Viewer
1. To open the Usage Dashboard, click on the Dashboard Viewer icon either at the top
or the middle right of the EnergyReporter Dashboard Viewer screen.
2. The EnergyReporter Dashboard Viewer opens.
Electro Industries/GaugeTech
Electro Industries/GaugeTech
The Leader In Power Monitoring and Smart Grid Solutions
The Leader In Power Monitoring and Smart Grid Solutions
Doc#
E167701
5-8
5: Step 5 - E-Billing Dashboard Viewer
The monthly usage is shown for the current month. There are controls to the left of
the Usage Dashboard. See the diagram below for an explanation of the controls.
Usage Dashboard
Control Panel
Click to view in the
graph: Usage,
Usage Cost
Top Demand,
or Usage versus
Temperature
If you choose Usage vs Temp, the
bottom of the controls panel
changes as shown above, to let you
select temperature, pressure, or
humidity data to see in the graph
Click to select time range
for usage chart - day/
week/month/year; use
Nav buttons to go forward
and back in time
Click Nav buttons to go back and
forward in selected time range
Click Breakout to open the graph
in a separate window
Click Custom to open the
window above - select date
range you want to view data
for and click OK
Click to Copy/Export/Print the
graph data
To compare meter data, click to
select meter 1 and meter 2
When you click Meter 1 or Meter 2, this window
opens: select the meter, channel, and date from
the pull-down menus and click Apply
Electro Industries/GaugeTech
Electro Industries/GaugeTech
The Leader In Power Monitoring and Smart Grid Solutions
The Leader In Power Monitoring and Smart Grid Solutions
Doc#
E167701
5-9
5: Step 5 - E-Billing Dashboard Viewer
You can also right-click in a graph to open a sub-menu.
Click to make
adjustments to
graph display
Click to export the graph or
graph data
The following pages show examples of different graph selections.
Electro Industries/GaugeTech
Electro Industries/GaugeTech
The Leader In Power Monitoring and Smart Grid Solutions
The Leader In Power Monitoring and Smart Grid Solutions
Doc#
E167701
5 - 10
5: Step 5 - E-Billing Dashboard Viewer
Two Meter Usage Comparison for One Month
Two Meter Usage Cost Comparison for One Week
Electro Industries/GaugeTech
Electro Industries/GaugeTech
The Leader In Power Monitoring and Smart Grid Solutions
The Leader In Power Monitoring and Smart Grid Solutions
Doc#
E167701
5 - 11
5: Step 5 - E-Billing Dashboard Viewer
Breakout of Top Demand Comparison for Two Meters for the Year
Usage Versus Weather - Temperature for the Month
Electro Industries/GaugeTech
Electro Industries/GaugeTech
The Leader In Power Monitoring and Smart Grid Solutions
The Leader In Power Monitoring and Smart Grid Solutions
Doc#
E167701
5 - 12
5: Step 5 - E-Billing Dashboard Viewer
Usage Versus Weather - Pressure - for One Week
Usage Versus Weather - Humidity - for One Day
Electro Industries/GaugeTech
Electro Industries/GaugeTech
The Leader In Power Monitoring and Smart Grid Solutions
The Leader In Power Monitoring and Smart Grid Solutions
Doc#
E167701
5 - 13
5: Step 5 - E-Billing Dashboard Viewer
3. To exit the usage dashboard, click the Location Info icon at the top of the screen.
5.3: Generating and Viewing Usage Reports
The Executive Summary Usage Report is a customized report containing the location
and data you specify, or, for all customer locations, containing extensive, detailed
usage information.
5.3.1: Executive Summary Usage Report
1. From the EnergyReporter Dashboard Viewer’s Location Information screen, click
the Executive Summary icon on the right side of the screen.
2. You will see the window shown on the next page. Use it to select the data you want
to see in your report. This feature lets you generate a customized report with only
Electro Industries/GaugeTech
Electro Industries/GaugeTech
The Leader In Power Monitoring and Smart Grid Solutions
The Leader In Power Monitoring and Smart Grid Solutions
Doc#
E167701
5 - 14
5: Step 5 - E-Billing Dashboard Viewer
the data you want. For example, you can choose to view the highest usage per
meter, or the total usage per meter during the Peak Day.
3. Select the channel from the pull-down menu.
4. Note that the location you are currently viewing is displayed at the top of the
screen. That is the only location whose data will be shown unless you select
Generate for all customer locations by clicking in its checkbox.
5. If you want to see demand in your report, select Display Demand by clicking in its
checkbox.
6. Click the checkboxes of the data you want included in the report. By default, all of
the data is selected. Click on a box to uncheck it if you don’t want that data in your
report.
7. Click Generate. You will see a message while the report is being generated and
then it will display on the screen. A sample Executive Summary Usage Report
follows.
Electro Industries/GaugeTech
Electro Industries/GaugeTech
The Leader In Power Monitoring and Smart Grid Solutions
The Leader In Power Monitoring and Smart Grid Solutions
Doc#
E167701
5 - 15
5: Step 5 - E-Billing Dashboard Viewer
5.3.2: Generate Usage Reports
Click Reports in the EnergyReporter Dashboard Viewer main screen’s Menu bar. You
will see the submenu shown below.
There are two Report options - Generate Usage Reports and View Usage Reports.
1. Click Reports>Generate Usage Reports>Generate Customer Report. You will see
the screen shown below.
2. Select the customer, start date for the month, and channel. The Month box fills with
the available months for the customer (the months which contain usage data).
3. Click each of the month(s) you want to create the usage report for.
Electro Industries/GaugeTech
Electro Industries/GaugeTech
The Leader In Power Monitoring and Smart Grid Solutions
The Leader In Power Monitoring and Smart Grid Solutions
Doc#
E167701
5 - 16
5: Step 5 - E-Billing Dashboard Viewer
4. Click Options. You will see the screen shown below.
5. Configure the following settings:
• The default path is displayed in the Output Path field. Click the Browse button if
you want to choose another output path for the file. This is where the report will
be saved.
• The Use Default Report Name checkbox is already selected. The default report
name is the customer number, commodity, and date of the usage, e.g.,
11567_kWh_2013-03 for a report of kWh usage data for March 2013 for
customer number 11567. If you want to use a different name for the usage
report, un-check the box and enter a name in the blank field next to it.
• File format: your format choices are PDF (Adobe PDF document), RTF (rich text
format), or HTML (for viewing over the web).
• Report Commodity: select the commodity you want to use from the pull-down
menu. Usage reports are only generated for a single commodity at a time.
• Click Single Page Summary if you want to have the month, week, and day
usages on the same page.
Electro Industries/GaugeTech
Electro Industries/GaugeTech
The Leader In Power Monitoring and Smart Grid Solutions
The Leader In Power Monitoring and Smart Grid Solutions
Doc#
E167701
5 - 17
5: Step 5 - E-Billing Dashboard Viewer
•
If you select Single Page Summary, you can also select Overlay Interval Data.
Click this option if you want to have trend data or Demand data (if you select the
display Demand option) on the same graph as the usage bars.
•
You can select to colorize either TOU or periods.
•
Display Demand: labels the Interval usage report as Demand.
6. Click OK. The screen closes and you see the previous screen. Click Generate to process the report. You see a progress message while the report is being generated.
When the process is complete, you see the following message window.
7. Click the OK button to close the message window. Another window opens asking if
you want to view your report. See the next section.
5.3.2.1: View Usage Reports
When you generate a Usage report you have the option to view it right away.
Click Yes to open the report. See the sample report in Appendix A.
Electro Industries/GaugeTech
Electro Industries/GaugeTech
The Leader In Power Monitoring and Smart Grid Solutions
The Leader In Power Monitoring and Smart Grid Solutions
Doc#
E167701
5 - 18
5: Step 5 - E-Billing Dashboard Viewer
1. To view Usage reports at any time, click Reports>View Usage Reports. See the
example screen shown below.
2. This screen lets you view all of the months with usage data for customer locations.
(Click on the + signs next to customer, location, and commodity to see the list of
months.) Double-click on a month to view its usage report (or click on the month
and click the View Report icon). See the sample report in Appendix A.
If the report hasn’t been generated yet for the month, it is generated when you
select it.
3. You can also:
•
Click the Options icon to change output options before you generate another
usage report, e.g., if you want to use a different format for the report. You will
see the Output Options screen shown in Section 5.3.2, step 4.
• Click the Save Report icon to open a window that lets you choose a filename and
a save location for a copy of the report.
Electro Industries/GaugeTech
Electro Industries/GaugeTech
The Leader In Power Monitoring and Smart Grid Solutions
The Leader In Power Monitoring and Smart Grid Solutions
Doc#
E167701
5 - 19
5: Step 5 - E-Billing Dashboard Viewer
5.4: Generating and Viewing Customer Bills
You use the EnergyReporter EXT application’s EnergyReporter Dashboard Viewer to
generate and view bills. See the diagram below.
EOFSHZ3FQPSUFS Database Server
Billing Data From Meters
EOFSHZ3FQPSUFS Bill 4FUUJOHTEditor
Import Billing Data from All Customers/All -PDBUJPOT
All Meters at Each Location or "ll Meters BUB-PDBUJPO
PC
EOFSHZ3FQPSUFS %BTICPBSE
7JFXFS7JFX*mported .eter %BUBPO%BTICPBSEBOE6TF
UPGenerate Bills, Usage Reports,
Trend Data
Bills
Trending Charts
Usage Reports
Figure 5.2: Bill Generation through the EnergyReporter EXT Application
Bills and reports are automatically generated every twelve hours, for any location for
which there is a full months’ worth of data. You can also manually generate bills and
reports if you want.
Electro Industries/GaugeTech
Electro Industries/GaugeTech
The Leader In Power Monitoring and Smart Grid Solutions
The Leader In Power Monitoring and Smart Grid Solutions
Doc#
E167701
5 - 20
5: Step 5 - E-Billing Dashboard Viewer
5.4.1: Individual Bills
Bills can be generated individually for a specific location and bill period.
1. Select the location from the Location Tree on the left of the main screen, then
select the Bill Period to view by selecting it in the list of Available Bill Data. If the bill
has already been generated for the period, the bill generation date will be shown
next to the billing period. See the screen shown below.
NOTE: It may take a while for the data to be displayed if there are multiple meters
at the location, or if there is a lot of data to search. Please be patient.
1. Click on a
customer
2. Click on a
location
Click Monthly
Utility Bill
Select a bill
period
Date the bill
was generated
2. Click the Monthly Utility Bill icon. The software checks to see if the period you
selected contains valid data.
•
If the Period contains errors, the View Errors icon appears (see the partial
screen below). Click this icon to see a list all of the errors that prevent the bill
from being generated.
Electro Industries/GaugeTech
Electro Industries/GaugeTech
The Leader In Power Monitoring and Smart Grid Solutions
The Leader In Power Monitoring and Smart Grid Solutions
Doc#
E167701
5 - 21
5: Step 5 - E-Billing Dashboard Viewer
• Click on a channel to view the errors in the meter data records. Follow the
instructions in Section 6.1.7 to correct errors.
NOTES:
• Errors can only be corrected from the EnergyReporter Settings Editor.
• Typically, the errors in .DEMAND and .INTERPOLATE.INTERVAL are
caused by the problems in the Root Commodity value. Correct that value
before checking the others.
• If the Period contains no data, the Monthly Utility Bill icon is greyed out
and displays the message “Unable to generate monthly bill: too many
records missing from period.” This happens if you have less then 2 days’
worth of data.
3. While the Bill is being generated, the progress is displayed in a screen.
NOTE: You can generate multiple bills for a single bill period, so if you click the
Generate Monthly Bill for Selected Bill Period icon twice, you will generate two bills.
Electro Industries/GaugeTech
Electro Industries/GaugeTech
The Leader In Power Monitoring and Smart Grid Solutions
The Leader In Power Monitoring and Smart Grid Solutions
Doc#
E167701
5 - 22
5: Step 5 - E-Billing Dashboard Viewer
4. Once the bill is generated, it opens in your screen. See the example bill below.
Provider Information
Greater Altoona Realty Corp
10 W. 8th Street
Suite 300
Altoona, PA 16601
555-980-4785
Customer
Information
Account
Total Summary
Electricity Charges
Total Due
Due Date
Total Charges
Due Date
1
College Park Apartments
1 College Park Drive
Altoona, PA 16601
$19,527.44
$19,527.44
11/14/2014
Customer
Statement Date
Bill Period
Total Due
Location
Usage Chart
1
10/31/2014
7/1/2014 - 7/31/2014 (31 Days)
$19,527.44
Building 1
Meter
Usage
Electricity Charges (kWh)
PREV
PRES
N/A
N/A
175
186008
206126
20118
Office DS
203
252
50
Office JK
29
38
9
Office JS
203
252
50
Office RK
1401
1578
177*
Office RM
229
293
64
68
83
16
40039580
53035912
12996332
Meter
1500_NJD
1800ShamesDr
Office RP
Shark200_Unit9
Usage
Total
13016989
Rate Structure:
Electricity
Itemized Charges
433198
Season Two Holiday
Season Two Off Peak
Season Two On Peak
Usage (0.01%)
3414425
9169366
@ $0.0015
@ $0.0015
@ $0.0015
$19,527.44
Total Electricity Charge
Provider Notes
$649.80
$5,121.64
$13,754.05
$1.95
Total Due
$19,527.44
Thank you for your prompt payment.
NOTE: If this bill was generated from Interval Energy data, there will be no
PREV(ious) or PRES(ent) usage values.
Remittance Address
Send Payment To:
Greater Altoona Realty Corp
PO Box 3452
Altoona, PA 16601-3452
Page 1 of 1
Electro Industries/GaugeTech
Electro Industries/GaugeTech
The Leader In Power Monitoring and Smart Grid Solutions
The Leader In Power Monitoring and Smart Grid Solutions
Doc#
E167701
5 - 23
5: Step 5 - E-Billing Dashboard Viewer
5.4.2: Generate Bills Manually
Bills are generated manually from the EnergyReporter Dashboard Viewer. When a bill
is generated, the software analyzes the usage data for the meters at a location, and
applies the configured rate structure to that data.
A bill is always generated for a bill period, which is the date range from the billing
date of the previous month, to the billing date of the current month. A bill period need
not contain a full month’s worth of data: a bill can be manually generated if there is at
least two days’ worth of data.
Generate All Bills
1. From the EnergyReporter Dashboard Viewer main screen, click the Generate All
Bills icon.
2. While the software is scanning for bills to generate, the list of periods found so far
are displayed. You can stop the scan at any time to generate bills from the list of
values scanned so far: to do so, click Cancel.
3. When scanning is done (or after you’ve clicked Cancel), the list of available periods
is displayed. See the screen shown below.
4. Select which periods you want to generate bills for by clicking in the Generate box.
By default, all periods which have no errors, and haven’t been generated before,
Electro Industries/GaugeTech
Electro Industries/GaugeTech
The Leader In Power Monitoring and Smart Grid Solutions
The Leader In Power Monitoring and Smart Grid Solutions
Doc#
E167701
5 - 24
5: Step 5 - E-Billing Dashboard Viewer
are selected for generating bills (their box is checked).
NOTES:
•
Any period which already has a bill generated for it appears in grey with an
unchecked box. You can still select it, if you want to generate another bill for
that period, e.g., if the meter's data was changed after the bill was generated.
This can happen if you generate a bill before the end of the month.
•
Any period which contains errors, or is missing too much data, appears in red.
You cannot generate bills for these periods until you correct the errors (see Section 6.1.7 for instructions).
5. When you’ve selected all the periods you want to generate bills for, click Generate.
While the bill is being generated, the progress is displayed. The Bills to Generate
screen closes once the bills have been generated.
Generate All Bills for Customers/Location
Since the Generate All Bills option can take a long time to complete, the EnergyReporter EXT application gives you two additional options for generating a smaller number of bills. Access these options from the Reports>Generate Bills submenu from the
EnergyReporter Dashboard Viewer main screen’s Menu bar. The submenu is shown
below.
• Click Generate All Bills for Customer to generate all available bills for all locations
for the selected customer (the customer currently displayed on the screen).
• Click Generate All Bills for Location to generate all available bills for the selected
location (the location currently displayed on the screen).
You will see the Bills to Generate screen shown on the previous page. The instructions
are the same as those shown in the Generate All Bills section on the previous page,
steps 4 and 5.
Electro Industries/GaugeTech
Electro Industries/GaugeTech
The Leader In Power Monitoring and Smart Grid Solutions
The Leader In Power Monitoring and Smart Grid Solutions
Doc#
E167701
5 - 25
5: Step 5 - E-Billing Dashboard Viewer
NOTE: The Generate All Bills for All Customers option is the same as the Generate All
Bills option on the previous page.
Electro Industries/GaugeTech
Electro Industries/GaugeTech
The Leader In Power Monitoring and Smart Grid Solutions
The Leader In Power Monitoring and Smart Grid Solutions
Doc#
E167701
5 - 26
5: Step 5 - E-Billing Dashboard Viewer
5.4.3: View Bills
You can view generated bills either by clicking the View Bills icon in the EnergyReporter Dashboard Viewer’s main screen, or by clicking Reports>View Bills from the
screen’s Menu bar.
NOTE: The viewed bill is just a temporary file that has been downloaded from the
EnergyReporter EXT Database server, where the bills are stored. Any changes you
make to it are not saved on the Database server.
1. The list of all generated bills displays. See the example screen below.
2. Click on the + sign next to the customer to display the location; then click on the +
sign next to the location to display the bills for the location.
3. Click on the bill you want to view and click the View Bill icon. A PDF of the bill opens
(see the example bill on the previous page).
4. You have the following options:
• To save a copy of the bill on your computer, click the Save Bill icon. (Bills are
stored on the database server. To get a local copy, you need to save the bill on
Electro Industries/GaugeTech
Electro Industries/GaugeTech
The Leader In Power Monitoring and Smart Grid Solutions
The Leader In Power Monitoring and Smart Grid Solutions
Doc#
E167701
5 - 27
5: Step 5 - E-Billing Dashboard Viewer
your computer.) A screen opens which lets you choose the location of the saved
bill and give it a filename.
• To delete the bill, click the Delete Bill icon. A Confirmation window opens. Click
Yes to delete the bill; click No to keep the bill.
WARNING! Be careful when deleting bills. Once you delete a bill, it is
removed from the server. (You can re-generate the bill later.)
You can delete multiple bills by selecting a range of bills, and clicking Delete.
Make sure that you’ve selected only the bills you want to delete.
WARNING! Be careful when deleting across multiple locations, as it is easy to
select more bills than you intend, or miss some you want to delete.
NOTE: Removing a customer or location from the system doesn’t delete the bills
that have already been generated for them. If you want to get rid of the bills,
you must delete them manually.
Electro Industries/GaugeTech
Electro Industries/GaugeTech
The Leader In Power Monitoring and Smart Grid Solutions
The Leader In Power Monitoring and Smart Grid Solutions
Doc#
E167701
5 - 28
6: Managing Data
6: Managing Data
The EnergyReporter EXT application gives you access to the usage data in a variety of
ways. You can view the data, copy it, export it, and correct any errors in the meter
data.
6.1: View/Copy/Export Meter Data
Follow these steps to view, copy, or export the imported meter data.
1. From the EnergyReporter Settings Editor main screen, use the Tree menu on the
left of the screen to navigate to the meter you want. See the example screen
below.
Click on meter
Click this icon
2. Click the Edit Imported Data icon.
Electro Industries/GaugeTech
Electro Industries/GaugeTech
The Leader In Power Monitoring and Smart Grid Solutions
The Leader In Power Monitoring and Smart Grid Solutions
Doc#
E167701
6-1
6: Managing Data
3. This screen lets you choose which data point (channel), date range, and type of
values you want to view.
• Meter: from the pull-down menu, select the meter whose data you want to view.
Only meters at the currently selected location are shown.
• Data Point: the channel of the data to view. There are typically three values for
each commodity:
a. <commodity>: this is the value from the meter’s logs. These are your base
usage values, and are the only values you can change, as all other values
are computed from this value; e.g., kWh. If you want to view the “raw”
usage data from the meter, select this option.
b. <commodity>.interpolate.interval: this is the computed interval value of
the commodity, typically in 15 minute periods. The values are interpolated
from the root commodity values to correct for odd timestamps and missing
data. These values cannot be changed, as they are computed from the root
commodity; e.g., kWh. If you want to view the computed interval values,
select this option.
c. <commodity>.DEMAND: this is the maximum Demand for an hour period,
computed from the interpolated interval values for the previous hour.
These values cannot be changed, as they are computed from the root commodity; e.g., kWh.DEMAND. If you want to view the max Demand, select
this option.
Electro Industries/GaugeTech
Electro Industries/GaugeTech
The Leader In Power Monitoring and Smart Grid Solutions
The Leader In Power Monitoring and Smart Grid Solutions
Doc#
E167701
6-2
6: Managing Data
• Start Date: the start date of the data to show. You can only change this field
when All Timestamps and Bill Period are unchecked.
• End Date: the end date of the data to show. You can only change this field when
All Timestamps and Bill Period are unchecked.
• All Timestamps: select this checkbox to automatically select the entire range of
stored data to show.
• Bill Period: select this checkbox to see the date range of the billing data in all
available billing periods. Click the pull-down menu to display the date ranges.
When you select a date range, the beginning and ending date are displayed in
the Start Date and End Date fields.
• Values to Show: the checkboxes provide filters, so that only the data you want to
see is shown, e.g., only Errors.
• All Values: show all the values. If this is selected, no other option is valid.
• Rollover: show values flagged as a rollover. This occurs when the previous value is near the configured rollover point, and the current value is
near zero. This is not considered an error.
• Increasing Too Fast: show values flagged as increasing too fast. Values
which are increasing more then 3 times the trend in the previous hour are
considered as increasing too fast, and might indicate a problem. This is
considered an error, and must be cleared before a bill can be generated.
• Decreasing Counter: show values flagged as a decreasing counter. Except
for the Rollover condition, counters (such as Energy and pulse accumulators, used for Commodities) should never decrease. If they do, this indicates a problem, and must be cleared before a bill can be generated.
• Good Values: show values which are not flagged with an error condition.
4. Once you’ve selected the filters you want to use, click View. The data is retrieved
from the database and displayed. Values which are flagged as a warning are shown
in Green. Values which are errors and will prevent a bill from being generated are
Electro Industries/GaugeTech
Electro Industries/GaugeTech
The Leader In Power Monitoring and Smart Grid Solutions
The Leader In Power Monitoring and Smart Grid Solutions
Doc#
E167701
6-3
6: Managing Data
shown in Red. See the example screen below.
This screen lets you view the values, correct any errors in the data, and export the
data for external use.
NOTES:
•This screen is available from both the EnergyReporter Settings Editor and
the EnergyReporter Dashboard Viewer, but you can only modify the values using the screen from the EnergyReporter Settings Editor. To view
this screen from the EnergyReporter Dashboard Viewer, select the meter
whose data you want to view and click Tools > View Bill Data. Only
20,000 points are displayed on the interface at any time. If you are trying
to view more than that number of points, click the Next and Previous buttons to scroll the data.
•The preferred method for correcting data errors is described in Section
6.2.
Electro Industries/GaugeTech
Electro Industries/GaugeTech
The Leader In Power Monitoring and Smart Grid Solutions
The Leader In Power Monitoring and Smart Grid Solutions
Doc#
E167701
6-4
6: Managing Data
• The buttons on the top of the screen and their functions are shown
below.
Refresh: click after Update Data icon to display
changes
Update Data: click after making changes
Click to clear an Invalid Flag from the currently
selected data value
Click to Delete/Undelete the currently selected
data value
Click to export data (see Section 6.1.1)
Click to show data values that have been removed
- then you can click the Undelete icon and the
Update Data icon to restore the value
6.1.1: Export Meters Data
You can export meter data in two ways.
From the Edit Imported Data Screen (shown in Section 6.1: only for EnergyReporter Settings Editor)
1. Click the Export Data icon shown above.
This screen lets you export the data to either the clipboard or a .csv file. Then you can
copy the data into another application, such as the Microsoft Excel® application, or
use it in your own applications.
2. Use the options in the Output box to specify where to export the data:
Electro Industries/GaugeTech
Electro Industries/GaugeTech
The Leader In Power Monitoring and Smart Grid Solutions
The Leader In Power Monitoring and Smart Grid Solutions
Doc#
E167701
6-5
6: Managing Data
• CSV File: exports the data to a CSV (Comma Separated Value) Text file (though
you can select other than commas to separate the exported values). When you
select this option, you must enter a Filename in the bottom of the screen.
• Clipboard: exports the data to the clipboard. Be careful when using this option,
as the amount of data being exported may be very large. When you select this
option, you do not enter a filename.
3. The setting in the Layout box controls the layout of the data being exported. The
only option is Tabular, which means the data is exported in a table format: rows are
data entries and columns are fields.
4. The settings in the Format box control how the output is formatted.
• Column Separator: use this setting to select the character used to separate fields
in a row.
• Comma (‘,’) is the most common separator.
• Tab should be selected if you plan to paste the data into a spreadsheet
program, e.g., the Microsoft Excel® application.
• Space should be selected if needed by your application.
• Line Separator: use this setting to configure the sequence of characters used to
indicate the end of a row. Your options are CRLF and LF. Different operating
systems and software applications expect different line endings, but CRLF is the
most common.
• Include Column Headers: click this box to put the name of the field at the top of
the column, before the start of the data. You may want to leave this box
unchecked when using automated processing, if your application doesn’t know
to discard the first line (the column headings).
• Include Billing Event Information: click this box to export analysis information,
such as error code or modified date, along with the regular data. If you leave
this box unchecked, only the Timestamp and Value are exported.
5. File Options: you will see this field if you choose the .csv file Output option. Click
Browse to locate the directory for your file and enter a filename.
Electro Industries/GaugeTech
Electro Industries/GaugeTech
The Leader In Power Monitoring and Smart Grid Solutions
The Leader In Power Monitoring and Smart Grid Solutions
Doc#
E167701
6-6
6: Managing Data
6. Click Export to export the data. You will see a Confirmation window when the
export is complete. Click OK to close the window and the Data Export Options
screen.
From the Tools>Export Meters Data (for either the EnergyReporter Settings Editor
or the EnergyReporter Dashboard Viewer.)
1. Click Tools>Export Meters Data.
2. The currently selected customer and location are displayed in the screen.
• Select Commodity from the pull-down menu
• Click the Export Cost checkbox if you want cost data exported
• Either click Bill Period and select a period from the pull-down menu, or click
Custom Range and select the Start and End Date from the pull-down menus.
3. Click Export. A window opens letting you select the location of the .csv file. You can
the copy the data into another application, such as the Microsoft Excel® application, or use it in your own applications.
Electro Industries/GaugeTech
Electro Industries/GaugeTech
The Leader In Power Monitoring and Smart Grid Solutions
The Leader In Power Monitoring and Smart Grid Solutions
Doc#
E167701
6-7
6: Managing Data
6.2: Edit Data Errors
Following is the recommended procedure for correcting data errors, for example, zero
values due to problems in communication.
1. From the EnergyReporter Settings Editor Main screen, click Tools>Edit Data Errors.
You will see the screen shown below.
Select the customer/location/
meter/channel
you want to see
errors for
Click Scan
2. You use the fields on the right side of the screen to refine your search for data
errors. You can specify customer, location, meter, and/or channel, or select Any
which will display data errors for all of the entries in that field; for example, to see
data errors for all of the meters at a location, select the Location from the Location
ID pull-down menu, and then select Any from the Meter ID pull-down menu.
Electro Industries/GaugeTech
Electro Industries/GaugeTech
The Leader In Power Monitoring and Smart Grid Solutions
The Leader In Power Monitoring and Smart Grid Solutions
Doc#
E167701
6-8
6: Managing Data
3. Click Scan to cause the software to begin looking for the data errors. When scanning is done, any errors will display on the left side of the screen, along with the
meter and timestamp. The fields on the left display the Error Description field, and
detailed information regarding the error and ways to handle it are displayed on the
right side of the screen. See the example below.
Error
Suggested way to
handle the error
Information
about the error
• The top right of the screen displays the timestamp and value of the erroneous
data and the timestamps and values around it, to help you diagnose the error
and decide what to do about it.
• The bottom right of the screen gives information about the error and the
suggested way to handle it.
Electro Industries/GaugeTech
Electro Industries/GaugeTech
The Leader In Power Monitoring and Smart Grid Solutions
The Leader In Power Monitoring and Smart Grid Solutions
Doc#
E167701
6-9
6: Managing Data
•
The middle right of the screen contains options you can use to handle the error.
4. Use the options shown above to handle the erroneous data:
•
New Value: if you know what the value should be, enter it in this field. If the
value is wrong, but you don’t know what it should be, use Interpolate (see information below).
•
Update: after entering a new value, click this button. The next error, if there is
one, is displayed. Update uses the new value for the error record. It doesn’t
clear the error, though, so if the new value is wrong, it will still be an error.
• Interpolate: if you don’t know what the value should be, click this button to have
the software calculate the new value for you. The software can only do this if
there are enough intervals before and after the error for it to compute the value
from.
• Clear Error: if the error is not something that you can correct by entering a new
value, e.g., missing data, click this button. This flags the value as valid, and tells
the system that you want to use this value to compute reports.
•
Previous: to view the error before this one, click this button.
•
Next: to view the error after this one, click this button.
5. Click the Commit button to save all your changes. The software re-analyzes the
data, and presents the results in the Scan and Edit Errors screen. If all the data is
good, the screen should show no errors.
6. If you have any more errors to correct, click Filter to re-display the selection fields
on the right side of the screen, and then click Scan to view and address the errors.
If you do not have any more errors to correct, click X to close the window.
Electro Industries/GaugeTech
Electro Industries/GaugeTech
The Leader In Power Monitoring and Smart Grid Solutions
The Leader In Power Monitoring and Smart Grid Solutions
Doc#
E167701
6 - 10
6: Managing Data
6.3: Re-Aggregate All Locations
You can force all aggregate meters to reaggregate the data from their locations:
1. From the EnergyReporter Settings Editor, click Tools>Database Maintenance>Reaggregate all Locations.
2. You will see a progress screen as the re-aggregation is taking place.
6.4: Rebuild Period Analysis
All data ranges are based off the Period Analysis, to provide faster access to data.
You can force each location to rebuild this analysis:
1. From the EnergyReporter Settings Editor, click Tools>Database Maintenance>Rebuild Period Analysis.
2. You will see a progress screen as the rebuilding takes place.
Electro Industries/GaugeTech
Electro Industries/GaugeTech
The Leader In Power Monitoring and Smart Grid Solutions
The Leader In Power Monitoring and Smart Grid Solutions
Doc#
E167701
6 - 11
6: Managing Data
This page intentionally left blank.
Electro Industries/GaugeTech
Electro Industries/GaugeTech
The Leader In Power Monitoring and Smart Grid Solutions
The Leader In Power Monitoring and Smart Grid Solutions
Doc#
E167701
6 - 12
7: Additional Features and Advanced Functions
7: Additional Features and Advanced
Functions
7.1: Viewing the Action Log
The EnergyReporter EXT application has a log in which actions such as importing,
generating bills, updating data and sending emails are stored. You can view this log
through the Action Log Viewer, which is available from the EnergyReporter Settings
Editor. In addition, errors can be viewed and corrected from the Action Log Viewer.
1. From the EnergyReporter Settings Editor, click Tools>View Action Log. See the
example screen below.
2. The actions are shown in the left side of the screen. Any errors are shown in red.
3. Click on an action to display information about it in the right side of the screen.
4. To display options, right-click on the action or error:
• If you right-click on an action, you can select to:
• Repeat the action, e.g., re-import data if the action is “Importing”
Electro Industries/GaugeTech
Electro Industries/GaugeTech
The Leader In Power Monitoring and Smart Grid Solutions
The Leader In Power Monitoring and Smart Grid Solutions
Doc#
E167701
7-1
7: Additional Features and Advanced Functions
• Acknowledge All Errors: they won’t show in red anymore.
• Delete Selected Actions: remove the action from the action log
• Hide Details/Show Details: this option toggles between hiding or displaying the detailed information on the right side of the screen.
• If you right-click on an Error, you have an additional option:
• Mark as Acknowledged Error/Mark as Unacknowledged Error: this option
toggles between acknowledging the error and removing acknowledgement of the error.
5. The options at the top of the screen let you:
Refresh Details Viewing Sort Order
Acknowledge Export Re-Import Choose Actions
All Errors
to XML
to Display
Clear All
Actions
Clear Selected
Actions
• Refresh the action display by clicking the Refresh icon.
• Select the order of action display by clicking in the View By pull-down menu. The
choices are Date/Time (the default setting), Customers, and Action Type.
• Acknowledge all Errors by clicking the checkmark icon.
• Export to XML by checking the document icon: this copies the action log in XML
format - you can then paste it into an XML file.
• Re-import meter data by selecting the two arrows icon.
Electro Industries/GaugeTech
Electro Industries/GaugeTech
The Leader In Power Monitoring and Smart Grid Solutions
The Leader In Power Monitoring and Smart Grid Solutions
Doc#
E167701
7-2
7: Additional Features and Advanced Functions
• Select between Show All Actions and Select Unacknowledged Action Errors from
the pull-down menu.
•
Clear all actions by clicking the red X. You will see a Confirmation message window.
•
Clear any selected action (highlighted action) by clicking the red exclamation
point.You will see a Confirmation message window.
6. If there is an error associated with an action, you can correct the error and then
perform the action again from the Action Log Viewer screen. For example, if there
is an error in importing, you can correct it, and then click on the original action and
select Re-import Data.
7.2: Database Maintenance
The EnergyReporter Settings Editor gives you options for maintaining the EnergyReporter EXT database. To access these options:
1. From the EnergyReporter Settings Editor, click Tools>Database Maintenance>Maintenance Utilities from the main screen’s Menu bar. You will see the screen shown
below, displaying a warning message.
2. Click Continue to access the database options, explained in the next sections.
Electro Industries/GaugeTech
Electro Industries/GaugeTech
The Leader In Power Monitoring and Smart Grid Solutions
The Leader In Power Monitoring and Smart Grid Solutions
Doc#
E167701
7-3
7: Additional Features and Advanced Functions
7.2.1: Database List
To view existing databases:
1. From the Database Maintenance List, click the Database List tab (this is the first
tab displayed when the Database Maintenance screen opens, so you may not need
to click the tab to see it).
2. This screen displays the status (Open or Closed) of the databases and information
about them.
Electro Industries/GaugeTech
Electro Industries/GaugeTech
The Leader In Power Monitoring and Smart Grid Solutions
The Leader In Power Monitoring and Smart Grid Solutions
Doc#
E167701
7-4
7: Additional Features and Advanced Functions
7.2.2: Archive Database Clusters
To ensure that your data is backed up, or if you want to migrate the database server
from one computer to another, you can archive your database cluster. This creates a
local copy of the data, which can later be uploaded to a server to restore the database
to the saved condition.
NOTE: This function copies all of the data on the database server. Using this to
restore to a server will overwrite all data.
WARNINGS!
• A database archive can be extremely large. For example, a database with hundreds
of meters, with data accrued for a few years, can be at least 20GB in size. Make
sure you have the room to store the archive.
• Only the data stored on the server is saved. The server’s settings and configuration
must be manually re-configured when the data is restored.
1. From the Database Maintenance screen, click the Archive Databases tab.
2. Click the Browse button to choose the location you want to save the archive to.
3. To save the database to a single file, leave the checkbox selected. This option
makes it easier to store and transfer the archive, but may cause problems for older
operating systems.
Electro Industries/GaugeTech
Electro Industries/GaugeTech
The Leader In Power Monitoring and Smart Grid Solutions
The Leader In Power Monitoring and Smart Grid Solutions
Doc#
E167701
7-5
7: Additional Features and Advanced Functions
WARNING! You should disconnect the database so that no one else can modify it
while you are performing the archive. Otherwise the archive may be corrupted.
4. Click the Begin Archive button. You will
see the message window shown on the
right. Click OK to continue.
Once you begin archiving the database,
the process won’t stop until the entire
database has been archived. As the
message says, this can take a very long time, so be patient.
5. You will see a progress screen while the database is being archived, and a message
window once the archiving is successfully completed. See the screen below.
Click OK to close the message window.
7.2.3: Restore Database Clusters
If you ever need to recover from a corrupted database, or if you want to move your
database server to another location, you can restore a database cluster from an
archive created with the Archive Database tool.
WARNING! Restoring a database archive overwrites all the data in the database
cluster. Any data already there will be lost.
NOTE: Only the data stored in the database is restored. Any server configurations or
back-end changes must be re-configured manually.
Electro Industries/GaugeTech
Electro Industries/GaugeTech
The Leader In Power Monitoring and Smart Grid Solutions
The Leader In Power Monitoring and Smart Grid Solutions
Doc#
E167701
7-6
7: Additional Features and Advanced Functions
1. From the Database Maintenance screen, click the Restore Databases tab.
2. Click Browse to locate the database archive you want to restore.
3. If the archive was stored in a single file, leave the checkbox selected. If it was
stored in multiple files, uncheck the box.
4. Click Begin Restore to restore the
database. You will see the message
window shown on the right.
5. Click Yes to continue. You will see
the message window shown on the
right.
Electro Industries/GaugeTech
Electro Industries/GaugeTech
The Leader In Power Monitoring and Smart Grid Solutions
The Leader In Power Monitoring and Smart Grid Solutions
Doc#
E167701
7-7
7: Additional Features and Advanced Functions
6. Click Yes to continue. You will see the
message window shown on the right.
Key RESTORE in the blank field and
click OK.
7. While the database is being restored you will see a screen showing the progress.
If there is a large amount of data, this process may take a long time to complete,
e.g., it will take hours to restore a 20 Gigabyte database archive. When the restore
is done, the window closes. You can now re-open the EnergyReporter EXT application.
7.2.4: Clear Database
You can clear a database with this procedure.
WARNING! Make very sure that you want to delete all of the data in the database
before you click Delete Databases. This command deletes all imported data and all
configured settings, including all bills and any changes you have made to data.
1. From the Database Maintenance screen, click the Clear Databases tab.
2. Click the Delete Databases button.
Electro Industries/GaugeTech
Electro Industries/GaugeTech
The Leader In Power Monitoring and Smart Grid Solutions
The Leader In Power Monitoring and Smart Grid Solutions
Doc#
E167701
7-8
7: Additional Features and Advanced Functions
7.2.5: Server Status
1. From the Database Maintenance screen, click the Server Status tab.
2. You have three options:
• Restart: click this button to start the local database server after it has
been shut down.
• Shutdown: click this button to close the local database server. You see a
window that shows the progress of stopping the server, and then a window telling you that the software must be shutdown to finish stopping the
server. Click OK to proceed with the shutdown.
NOTE: The local database server does not close when you exit the EnergyReporter EXT application. You must use this command if you want to
close it.
• Start: click this button to start the main Database server (not the local
database server) if it is not opening correctly (it should open when the
software starts).
Electro Industries/GaugeTech
Electro Industries/GaugeTech
The Leader In Power Monitoring and Smart Grid Solutions
The Leader In Power Monitoring and Smart Grid Solutions
Doc#
E167701
7-9
7: Additional Features and Advanced Functions
7.2.6: DB Actions
1. From the Database Maintenance screen, click the DB Actions tab.
2. You have two options:
• Clear Data: click this button to clear all meter data.
• Clear Reports: click this option to clear all report data.
Electro Industries/GaugeTech
Electro Industries/GaugeTech
The Leader In Power Monitoring and Smart Grid Solutions
The Leader In Power Monitoring and Smart Grid Solutions
Doc#
E167701
7 - 10
7: Additional Features and Advanced Functions
7.3: Clear Meter Data
The EnergyReporter Settings Editor gives you the option to clear meter data. You may
want to do this if you imported the incorrect data or corrupted data and want to
remove it.
1. From the EnergyReporter Settings Editor Location screen, highlight the meter
whose data you want to clear. See the example screen below.
2. From the Menu bar, click Tools>Database Maintenance>Clear Meter Data.
3. You will see a window that prompts
you to enter DELETE. See the example screen on the right.
Type DELETE in the entry field and
click OK to delete the meter data.
4. You will see the message window on the right.
Click OK to close the message window.
Electro Industries/GaugeTech
Electro Industries/GaugeTech
The Leader In Power Monitoring and Smart Grid Solutions
The Leader In Power Monitoring and Smart Grid Solutions
Doc#
E167701
7 - 11
7: Additional Features and Advanced Functions
7.4: Option Screens
Both the EnergyReporter Settings Editor and EnergyReporter Dashboard Viewer have
an Options screen. You access this screen by clicking Tools>Options from the main
screen’s Menu bar. The screen has four tabs for settings: Paths, Configuration, UI, and
Language. The settings are the same on both screens, except for the Paths settings.
See the screens below.
EnergyReporter Settings Editor Options Screen
EnergyReporter Dashboard Viewer Options Screen
7.4.1: Path Setting
EnergyReporter Dashboard Viewer setting:
• Default Bill Definition: this is the template for the bills. Click Browse to set up
another location.
EnergyReporter Settings Editor settings:
• Pg Tools Path: this is the path to the pg_tools exe, which is a utility used to archive,
restore, and perform other maintenance operations on the database cluster. Click
Browse to set up another location.
• Default Archive Path: this is the default location where the archive is stored when
the database cluster is archived. Click Browse to select the location.
Electro Industries/GaugeTech
Electro Industries/GaugeTech
The Leader In Power Monitoring and Smart Grid Solutions
The Leader In Power Monitoring and Smart Grid Solutions
Doc#
E167701
7 - 12
7: Additional Features and Advanced Functions
7.4.2: Configuration Setting
The settings are similar for the EnergyReporter Dashboard Viewer and the EnergyReporter Settings Editor. This setting controls what options are available to the user.
1. Click the Configuration tab. You will see the screen shown below from the EnergyReporter Settings Editor. The Options screen from the EnergyReporter Dashboard
Viewer does not have the Autoconfigure Weather Data checkbox.
2. Click the radio button of the option you want to set:
•
Basic restricts access to functional billing tasks and provides a user friendly
interface to configure settings.
•
Advanced provides access to all options, and should only be chosen for
advanced users.
3. The Weather Data section lets you select Celsius or Fahrenheit from the pull-down
menu.
4. The default Weather Data configuration is Auto-Configure. If you do not wish to
automatically configure settings for weather data acquisition for new locations at
the time they are first created, click on the Autoconfigure Weather Data button to
disable this feature.
Electro Industries/GaugeTech
Electro Industries/GaugeTech
The Leader In Power Monitoring and Smart Grid Solutions
The Leader In Power Monitoring and Smart Grid Solutions
Doc#
E167701
7 - 13
7: Additional Features and Advanced Functions
5. If you’ve made a change, when you click OK you will see this window.
6. Click Yes to restart the EnergyReporter EXT software now; click No if you don’t
want to restart the software.
NOTE: Changes you make won’t take effect until you restart the software.
Electro Industries/GaugeTech
Electro Industries/GaugeTech
The Leader In Power Monitoring and Smart Grid Solutions
The Leader In Power Monitoring and Smart Grid Solutions
Doc#
E167701
7 - 14
7: Additional Features and Advanced Functions
7.4.3: UI (User Interface) Setting
Except for one setting, the EnergyReporter Dashboard Viewer and EnergyReporter
Settings Editor Option screens have the same UI settings.
1. Click the UI tab. The screen shown below is from the EnergyReporter Dashboard
Viewer. The Options screen from the EnergyReporter Settings Editor does not have
Display option.
2. These are the setting options:
• Warn on software close: this setting asks the user to confirm closing the software. The default of the setting is checked - selected. To un-select the setting
click on the checkbox to remove the checkmark.
• Warn on startup if the root path is invalid: this setting verifies that the database
server has been configured correctly and is accessible. The default of the setting
is checked - selected. To un-select the setting click on the checkbox to remove
the checkmark (this is not recommended).
• Show debug window: click the checkbox to show the debug trace window while
the software is running.
• Display units in Dashboard - select either Usage or Demand.
3. Click OK to close the screen and apply your settings.
Electro Industries/GaugeTech
Electro Industries/GaugeTech
The Leader In Power Monitoring and Smart Grid Solutions
The Leader In Power Monitoring and Smart Grid Solutions
Doc#
E167701
7 - 15
7: Additional Features and Advanced Functions
7.4.4: Language
This feature allows you to select a translation of the software to use, as well as providing a tool that can be used to translate the software.
1. Click the Language tab from the EnergyReporter Settings Editor or Dashboard
Viewer Options screen.
2. Select from the available languages from the pull-down menu. You can click
Language File Information for details of the selected Language file.
3. To add a new translation, click the Create New Language button.
Electro Industries/GaugeTech
Electro Industries/GaugeTech
The Leader In Power Monitoring and Smart Grid Solutions
The Leader In Power Monitoring and Smart Grid Solutions
Doc#
E167701
7 - 16
7: Additional Features and Advanced Functions
4. Enter the language name and click OK.
5. Use the screen shown above to enter the translations. You enter the translation in
the Translation column for each term in the Phrase column. See the example screen
on the next page.
Electro Industries/GaugeTech
Electro Industries/GaugeTech
The Leader In Power Monitoring and Smart Grid Solutions
The Leader In Power Monitoring and Smart Grid Solutions
Doc#
E167701
7 - 17
7: Additional Features and Advanced Functions
6. When you have finished entering the translations, click Save Changes to save the
language file.
Electro Industries/GaugeTech
Electro Industries/GaugeTech
The Leader In Power Monitoring and Smart Grid Solutions
The Leader In Power Monitoring and Smart Grid Solutions
Doc#
E167701
7 - 18
7: Additional Features and Advanced Functions
7. The Language screen is redisplayed. Select the language you want to use from the
pull-down menu and click OK. You will see the following confirmation window.
8. Click Yes. The software will shut down. Open it again to display the translated application.
Electro Industries/GaugeTech
Electro Industries/GaugeTech
The Leader In Power Monitoring and Smart Grid Solutions
The Leader In Power Monitoring and Smart Grid Solutions
Doc#
E167701
7 - 19
7: Additional Features and Advanced Functions
7.5: Performing Tasks Using Command Line
You can trigger an import of all meters or generate all bills from command line. This
feature is used if you wish to launch the EnergyReporter EXT application from a third
party application and have it run tasks. Using the command line, the EnergyReporter
EXT application can be embedded, as a launch command, into any third party application.
7.5.1: Import Data Using Command Line
This can be useful for automating the importing of data. The command you use is as
follows:
“[Path]\BillSettingsEditor.Master.exe” --script --import meter=all
IMPORTANT!
• [Path] is the path to the application on your PC.
• You must include the quotation marks.
For example:
“C:\Program Files (x86)\Electro Industries\EnergyReporter EXT\BillSettingsEditor\BillSettings Editor.Master.exe” --script --import meter=all
7.5.2: Generate All Bills Using Command Line
This can be useful for automating the generation of bills. Make sure this runs after all
the data for the month has been imported. The command you use is as follows:
"[Path]\BillViewer\BillViewer.exe" --script --generate_bill
IMPORTANT!
• [Path] is the path to the application on your PC.
• You must include the quotation marks.
For example:
“C:\Program Files (x86)\Electro Industries\EnergyReporter EXT\BillViewer\BillViewer.exe” --script --generate_bill
Electro Industries/GaugeTech
Electro Industries/GaugeTech
The Leader In Power Monitoring and Smart Grid Solutions
The Leader In Power Monitoring and Smart Grid Solutions
Doc#
E167701
7 - 20
A: Sample Usage Summary Report
A: Sample Usage Summary Report
EIG- Engineering
August, 2014 - Usage Summary Report
Usage Summary Report for EIG- Engineering – August 2014
This report provides a summary of the kWh usage for EIG- Engineering from Friday, August 01, 2014 to Sunday, August 31, 2014.
This report was generated on Tuesday, October 07, 2014.
Meter Report
Each meter report contains 6 sub-reports:
1. Month Usage
Summarizes the usage of the meter over the course of August 2014, from 08/01/2014 00:00:00 to 08/31/2014
23:59:00. All values presented are the computed 15 minute interval values of the recorded commodity (kWh),
summed over the specified interval. 4 values are presented:
a. Total Usage – The sum of all the 15 minute interval values over the period of the report.
b. Peak Usage – The peak 15 minute interval value over the period of the report.
c. Month Usage – A graph of the summed usage of each day during the period of the report.
d. Month Trend – A trend graph of the 15 minute interval values during the period of the report.
2. Peak Week Usage
Summarizes the usage of the meter over the course of the peak week during August 2014. The peak week is defined
as the week containing the peak day. All values presented are the computed 15 minute interval values of the
recorded commodity (kWh), summed over the specified interval. 4 values are presented:
a. Total Usage – The sum of all the 15 minute interval values over the period of the peak week.
b. Peak Usage – The peak 15 minute interval value over the period of the peak week.
c. Usage over the Week – A graph of the summed usage of each day during the peak week.
d. Trend over the Week – A trend graph of the 15 minute interval values during the peak week.
3. Peak Day Usage
Summarizes the usage of the meter over the course of the peak day during August 2014. The peak day is defined as
the day which has the highest total usage. All values presented are the computed 15 minute interval values of the
recorded commodity (kWh), summed over the specified interval. 3 values are presented:
a. Total Usage – The sum of all the 15 minute interval values during the peak day.
b. Peak Usage – The peak 15 minute interval value during the peak day.
c. Usage over the Day – A graph of the 15 minute interval values during the peak day.
4. Average Hourly and Daily Usage
Displays the average usage over the course of the month, averaged by hour, and by weekday. The highest and lowest
usage for each hour and weekday over the course of the month are determined, and displayed as the bounding lines
in Red and Green.
5. Comparison to previous Month and Year
Displays a comparison of daily usage between this month and last month, and this month this year and this month last
year. The daily usage is lined up by week day for each month. The numbers at the bottom indicate what day in the
month each bar represents: The top value is the current month, the bottom value the month being compared against.
6. Monthly Usage and Temperature
Displays a comparison of monthly usage and temperature. The highest and lowest temperature for each day over the
course of the month are determined, and displayed as the bounding lines in Red and Green.
Description of Report Data
Electro Industries/GaugeTech
Electro Industries/GaugeTech
The Leader In Power Monitoring and Smart Grid Solutions
The Leader In Power Monitoring and Smart Grid Solutions
Doc#
E167701
A-1
A: Sample Usage Summary Report
EIG- Engineering
August, 2014 - Usage Summary Report
Monthly Usage Summary
Customer
Month Date
Commodity
EIG- Engineering
08/01/2014 to 08/31/2014
kWh
Figure
1
Meter Location
Main Building
Meter Name
Meter Type
Aggregated Meter Aggregated Meter
Meter Serial
Total Usage
17731
Peak Usage
14
Peak Demand
57
2
Main Building
1800ShamesDr
3
Main Building
Cubicle 1
Shark 200
0123995130
17345
14
56
Shark 200
0145324120
71
0
4
Main Building
0
Cubicle 2
Shark 200
0126370221
50
0
5
0
Main Building
Cubicle 3
Shark 200
0145324019
55
0
0
6
Main Building
Cubicle 4
Shark 200
0145324423
69
0
0
7
Main Building
Cubicle 5
Shark 200
0145324524
9
0
0
8
Main Building
Cubicle 6
Shark 200
0145282931
98
0
1
9
Main Building
Cubicle 7
Shark 200
0145324221
35
0
0
Summary of monthly usage for the aggregated meter, the building, and all individual meters
Electro Industries/GaugeTech
Electro Industries/GaugeTech
The Leader In Power Monitoring and Smart Grid Solutions
The Leader In Power Monitoring and Smart Grid Solutions
Doc#
E167701
A-2
A: Sample Usage Summary Report
EIG- Engineering
August, 2014 - Usage Summary Report
Highest Usage Meter Comparison
Customer
EIG- Engineering
Commodity
kWh
Highest Usage Meter
Main Building:1800ShamesDr @ 17345
Lowest Usage Meter
Main Building:Cubicle 5 @ 9
Top Usage Meters
Highest usage comparison for the building and each meter
Electro Industries/GaugeTech
Electro Industries/GaugeTech
The Leader In Power Monitoring and Smart Grid Solutions
The Leader In Power Monitoring and Smart Grid Solutions
Doc#
E167701
A-3
A: Sample Usage Summary Report
EIG- Engineering
August, 2014 - Usage Summary Report
Monthly Usage at a Glance
Customer
Month Date
Commodity
EIG- Engineering
08/01/2014 to 08/31/2014
kWh
Main Building : Aggregated Meter
1
Main Building : 1800ShamesDr
2
Main Building : Cubicle 1
3
Main Building : Cubicle 2
4
Main Building : Cubicle 3
5
Main Building : Cubicle 4
6
Main Building : Cubicle 5
7
Main Building : Cubicle 6
8
Monthly usage for the aggregated meter and all individual meters
Electro Industries/GaugeTech
Electro Industries/GaugeTech
The Leader In Power Monitoring and Smart Grid Solutions
The Leader In Power Monitoring and Smart Grid Solutions
Doc#
E167701
A-4
EIG- Engineering
August, 2014 - Usage Summary Report
Main Building : Aggregated Meter
Total Usage during Month
08/01/2014 to 08/31/2014
Total Usage
Peak Usage
Peak Demand
17731
14
57
Aggregated Meter Total usage during month
Figure 1.1
EIG- Engineering
August, 2014 - Usage Summary Report
Main Building : Aggregated Meter
Total Usage during Peak Week
08/10/2014 to 08/16/2014
Total Usage
Peak Usage
3929
14
Aggregated Meter Total usage during Peak week
Figure 1.2
EIG- Engineering
August, 2014 - Usage Summary Report
Main Building : Aggregated Meter
Total Usage during Peak Day
Monday, August 11, 2014
Total Usage
Peak Usage
756
14
Aggregated Meter Total usage during Peak day
Figure 1.3
EIG- Engineering
August, 2014 - Usage Summary Report
Main Building : Aggregated Meter
Average Hourly and Daily Usage
Displays the average usage over the course of the month, averaged by hour, and by weekday. The
highest and lowest usage for each hour and weekday over the course of the month are determined,
and displayed as the bounding lines in Red and Green.
Figure 1.4
EIG- Engineering
August, 2014 - Usage Summary Report
Main Building : Aggregated Meter
Comparison to previous Month and Year
Displays a comparison of daily usage between this month and last month, and this month this year
and this month last year. The daily usage is lined up by week day for each month. The numbers
at the bottom indicate what day in the month each bar represents: The top value is the current
month, the bottom value the month being compared against.
Figure 1.5
Aggregated Meter Average hourly and daily usage
Aggregated Meter Usage comparison to previous month and year
EIG- Engineering
August, 2014 - Usage Summary Report
Main Building : Aggregated Meter
Monthly Usage and Temperature
Displays a comparison of monthly usage and temperature. The highest and lowest temperature for
each day over the course of the month are determined, and displayed as the bounding lines in Red
and Green.
Figure 1.6
Aggregated Meter Monthly usage compared to temperature
EIG- Engineering
August, 2014 - Usage Summary Report
Main Building : 1800ShamesDr
Total Usage during Month
08/01/2014 to 08/31/2014
Total Usage
Peak Usage
Peak Demand
17345
14
56
Main Building Total usage during month
Figure 2.1
EIG- Engineering
August, 2014 - Usage Summary Report
Main Building : 1800ShamesDr
Total Usage during Peak Week
08/10/2014 to 08/16/2014
Total Usage
Peak Usage
3838
14
Main Building Total usage during Peak week
Figure 2.2
EIG- Engineering
August, 2014 - Usage Summary Report
Main Building : 1800ShamesDr
Total Usage during Peak Day
Monday, August 11, 2014
Total Usage
Peak Usage
741
14
Main Building Total usage during Peak day
Figure 2.3
EIG- Engineering
August, 2014 - Usage Summary Report
Main Building : 1800ShamesDr
Average Hourly and Daily Usage
Displays the average usage over the course of the month, averaged by hour, and by weekday. The
highest and lowest usage for each hour and weekday over the course of the month are determined,
and displayed as the bounding lines in Red and Green.
Figure 2.4
Main Building Average hourly and daily usage
EIG- Engineering
August, 2014 - Usage Summary Report
Main Building : 1800ShamesDr
Comparison to previous Month and Year
Displays a comparison of daily usage between this month and last month, and this month this year
and this month last year. The daily usage is lined up by week day for each month. The numbers
at the bottom indicate what day in the month each bar represents: The top value is the current
month, the bottom value the month being compared against.
Figure 2.5
Main Building Comparison the previous month and year
EIG- Engineering
August, 2014 - Usage Summary Report
Main Building : 1800ShamesDr
Monthly Usage and Temperature
Displays a comparison of monthly usage and temperature. The highest and lowest temperature for
each day over the course of the month are determined, and displayed as the bounding lines in Red
and Green.
Figure 2.6
Main Building Monthly usage compared to temperature
EIG- Engineering
August, 2014 - Usage Summary Report
Main Building : Cubicle 1
Total Usage during Month
08/01/2014 to 08/31/2014
Total Usage
Peak Usage
Peak Demand
71
0
0
Meter 1 Total usage during month
Figure 3.1
EIG- Engineering
August, 2014 - Usage Summary Report
Main Building : Cubicle 1
Total Usage during Peak Week
08/03/2014 to 08/09/2014
Total Usage
Peak Usage
31
0
Meter 1 Total usage during Peak week
Figure 3.2
EIG- Engineering
August, 2014 - Usage Summary Report
Main Building : Cubicle 1
Total Usage during Peak Day
Friday, August 08, 2014
Total Usage
Peak Usage
5
0
Meter 1 Total usage during Peak day
Figure 3.3
EIG- Engineering
August, 2014 - Usage Summary Report
Main Building : Cubicle 1
Average Hourly and Daily Usage
Displays the average usage over the course of the month, averaged by hour, and by weekday. The
highest and lowest usage for each hour and weekday over the course of the month are determined,
and displayed as the bounding lines in Red and Green.
Figure 3.4
Meter 1 Average hourly and daily usage
EIG- Engineering
August, 2014 - Usage Summary Report
Main Building : Cubicle 1
Comparison to previous Month and Year
Displays a comparison of daily usage between this month and last month, and this month this year
and this month last year. The daily usage is lined up by week day for each month. The numbers
at the bottom indicate what day in the month each bar represents: The top value is the current
month, the bottom value the month being compared against.
Figure 3.5
Meter 1 Usage comparison to previous month and year
EIG- Engineering
August, 2014 - Usage Summary Report
Main Building : Cubicle 1
Monthly Usage and Temperature
Displays a comparison of monthly usage and temperature. The highest and lowest temperature for
each day over the course of the month are determined, and displayed as the bounding lines in Red
and Green.
Figure 3.6
Meter 1 Monthly Usage compared to temperature
After this, the same graphs are shown for the remaining meters.
Glossary
Glossary
<pg_data>
The data directory for the PostGreSql database
cluster for the EnergyReporter EXT application.
This is the “<Common Application Data>\Electro
Industries\Server\PostGreSql\8.4\Data” directory.
For Windows® XP:
This is typically “C:\Documents and Settings\All
Users\ApplicationData\ElectroIndustries\
Server\PostGreSql\8.4\Data”.
For Windows® 7:
This is typically “C:\ProgramData\ElectroIndustries\Server\PostGreSql\8.4\Data”.
<pg_exe>
The directory which contains the PostGreSql Database Server executable. This is typically
“<Program Files>\Electro Industries\Server\Post
GreSQL\8.4”.
EnergyReporter Settings Editor
The EnergyReporter Ext software for administering the Billing Package, including location configuration, data import, rate configuration, and modifying data values.
Bill Structure
Another name for Rate Structure.
EnergyReporter Dashboard Viewer The EnergyReporter Ext software for generating
bills, viewing bills, and trending the data values.
Billing Database
The internal storage on the database cluster
which holds all the data imported from the
meters.
Channel
A single type of data item, such as kWh or
pulses.
Charge
A monetary value applied to the bill, outside of
the normal usage. This includes things such as a
peak demand charge, credits, and taxes.
Electro Industries/GaugeTech
Electro Industries/GaugeTech
The Leader In Power Monitoring and Smart Grid Solutions
The Leader In Power Monitoring and Smart Grid Solutions
Doc#
E167701
GL - 1
Glossary
Commodity
A type of channel (typically from Energy or
accumulations) which is a usage value the
software uses when computing the rates for a bill.
Customer
The person or organization which is receiving the
bill. A customer may have multiple locations,
each of which gets its own bill.
Database Cluster
The collection of databases which the Database
Server provides access to. A database server
may provide access to multiple database clusters.
Database Server
The combination of computer and process that
provides the interface to the database cluster
(currently PostGreSql 8.4).
EnergyReporter Ext
The package of software which includes
EnergyReporter Settings Editor, EnergyReporter
Dashboard Viewer, and the Database Server.
Import Location
The actual source of the data imported for the
meter. This is typically a log file, such as an HMI
ExtTM .dbf file, or a Communicator ExtTM .db log
file. This file is scanned when imported, and
new data is placed into the billing database.
Location
A single unit for which a bill is generated. Each
location may have its own set of meters and rate
structures.
Meter
A data monitoring unit, which acts as an import
point for collecting usage data. Each meter may
have multiple channels, but only one channel can
be assigned to a commodity at a time. When
multiple meters are at a single location, the
matching usage values are aggregated when
generating the bill.
Electro Industries/GaugeTech
Electro Industries/GaugeTech
The Leader In Power Monitoring and Smart Grid Solutions
The Leader In Power Monitoring and Smart Grid Solutions
Doc#
E167701
GL - 2
Glossary
Provider
The person or organization which is providing the
energy, sending the bill, and receiving payments.
Rate
The monetary value applied to the usage which
occurs during specific periods.
Rate Structure
The collection of settings which determine what
rates to apply to the usage values for a commodity. Includes calendar rates (such as on peak and
off peak), holidays, and other charges.
Electro Industries/GaugeTech
Electro Industries/GaugeTech
The Leader In Power Monitoring and Smart Grid Solutions
The Leader In Power Monitoring and Smart Grid Solutions
Doc#
E167701
GL - 3
Glossary
This page intentionally left blank.
Electro Industries/GaugeTech
Electro Industries/GaugeTech
The Leader In Power Monitoring and Smart Grid Solutions
The Leader In Power Monitoring and Smart Grid Solutions
Doc#
E167701
GL - 4