1
SESES Tutorial September 2012
190
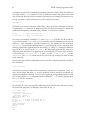
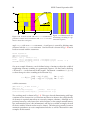
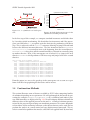
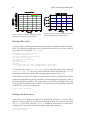
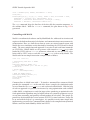
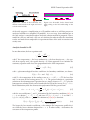
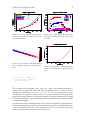
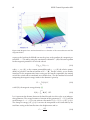
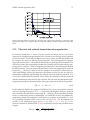
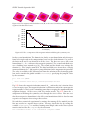
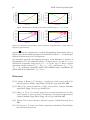
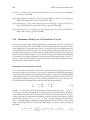
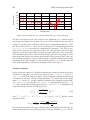
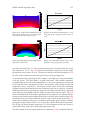
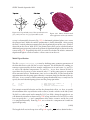
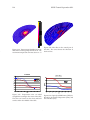
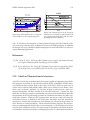
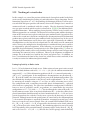
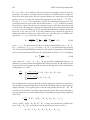
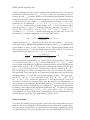
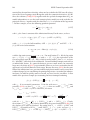
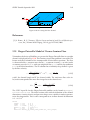
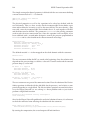
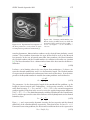
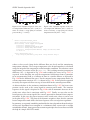
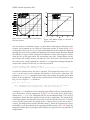
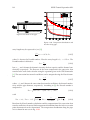
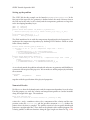
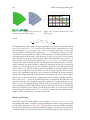
Figure 2.137: Drag coefficient as a function of
Reynolds number.
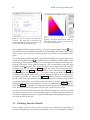
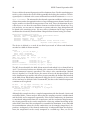
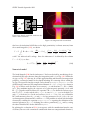
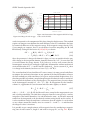
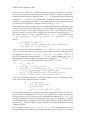
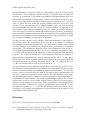
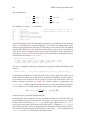
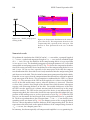
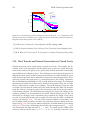
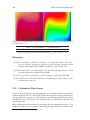
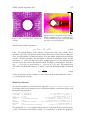
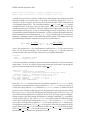
Figure 2.136: Pressure distribution on the
surface of the cylinder.
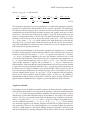
As next, we compare the pressure distribution on the surface of the cylinder. As before, we first define a lattice of sampling points around the cylinder. The data points
are located on a circle with the distance dr away from the cylinder surface. The first
point is placed at the forward stagnation point of the cylinder and the last at the rear
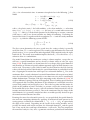
stagnation point of the cylinder. Plotted is the dimensionless pressure coefficient cp
defined as
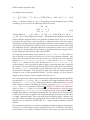
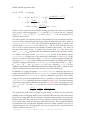
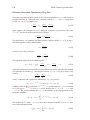
2p
.
(2.161)
cp =
ρ u2
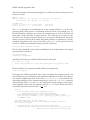
The computed pressure distributions based on SESES and CFX TASCflow are shown
in Fig. 2.136. They are nearly identical and in fair agreement with the experimental
data. The discrepancy is due the size of our computational domain in the lateral direction. In the experiment, the cylinder diameter is very small compared the channel
width, whereas in the simulation the cylinder blocks a considerable part of the channel cross section. This leads to increased velocities around the cylinder and in turn to a
higher stagnation pressure at 0◦ and to a lower pressure at 90◦ away from the forward
stagnation point.
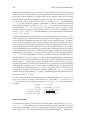
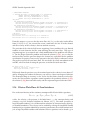
The force exerted on the cylinder is given by evaluating on the cylinder’s surface, the
integral
Z
(2.162)
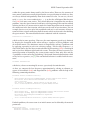
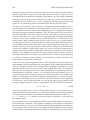
Fx = (τwall · n − pn) · ex dA ,
S
with p the pressure, τwall = µ(∇v + (∇v)T ) the wall shear stress, n the unit vector
normal to the cylinder and ex the unit vector in x-direction which coincides with the
main stream direction. In order to compare the results from the computations and the
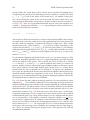
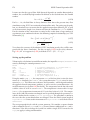
experiments, the drag coefficient per unit length of the cylinder
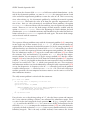
cd =
2Fx
,
ρ u2 d
(2.163)