1
Universidad Nacional de Educación a Distancia
Departamento de Informática y Automática
Doctoral Dissertation
An Integral Web-based Environment
for Control Engineering Education
Héctor Vargas Oyarzún
Electronic Engineer
from Universidad de La Frontera - Chile
Submitted at
E.T.S. de Ingenierı́a Informática
Universidad Nacional de Educación a Distancia
MADRID, 2010
Universidad Nacional de Educación a Distancia
Departamento de Informática y Automática
Doctoral Dissertation
An Integral Web-based Environment
for Control Engineering Education
Héctor Vargas Oyarzún
Electronic Engineer
from Universidad de La Frontera - Chile
Submitted at
E.T.S. de Ingenierı́a Informática
Universidad Nacional de Educación a Distancia
MADRID, 2010
Department
Informática y Automática
Faculty
E.T.S. de Ingeniería Informática
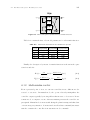
Dissertation Title
An Integral Web-based environment
for Control Engineering Education
Author
Héctor Vargas Oyarzún
Academic Degree Electronic Engineer
Universidad de La Frontera - Chile
Advisors
Dr. Sebastián Dormido Bencomo
Dr. José Sánchez Moreno
In memory of my dear
grandmother Doraliza Alvarez
Acknowledgements
First of all, I want to express my deep gratitude to the Spanish Ministry of Education and Science for granting me the scholarship that allowed me to develop
this thesis.
Secondly, I would like to thank all those who have contributed to the development of this research, especially my co-director of thesis, Professor José Sánchez
Moreno for his constant support, help and guidance. He has taught me his excellent work method which has enabled me to be where I am at present. At the same
time, I would like to thank the whole of the research team of the Department of
Computer Science and Automatic Control of the UNED for its great and valuable
support in particular to Professors Natividad Duro, Raquel Dormido-Canto, Sebastián Dormido-Canto, Marı́a Antonia Canto, Joaquı́n Aranda, Alfonso Urquı́a,
Carla Martı́n, Rocı́o Muñoz and, José Manuel Dı́az. I would also like to thank
Professor Fernando Morilla Garcı́a for his useful pieces of advice and ideas stemming from his experience and his constant support in the development of remote
practical experiments carried out with students. Thanks once again to all of
them.
My thanks also to other fellow students who, like me, tried to advance in
their respective fields of investigation: Miguel Angel Rubio, Dictino Chaos, Victorino Sanz, David Moreno, Oscar Cambra, Marı́a Guinaldo, Ernesto Fabregas,
Luis Cubillos, Alejandro Moreno and, Jesús Chacón. At this point, I would like
to thank my dear friend Gonzalo Farı́as. Thank you Gonzalo for the help you
gave me at the beginning of my work and for our exciting talks on the topic of
research.
Thanks also to Pilar Riego, the secretary of the department. During this
time, she became my friend and confident. Thanks again Pilar for the nice conversations and moments that you have given me.
Thanks also to Professor Francisco Esquembre, the Easy Java Simulations
developer, for his support in the use of Ejs, his guidance at the beginning of the
research and for his valuable help in reviewing my work.
Thanks also to Professor Matilde Santos Peñas from the Complutense University of Madrid for the trust she placed in me before coming to Spain and her
kindness and goodwill during my first days here.
Thanks to Professor Denis Gillet (leader of the developing team of the eMersion project) for accepting me in his group to enhance my research work and
for his support during my stay at the Ecole Polytechnique Federale de Lausanne
(EPFL). Similarly, I would like to express my special gratitude to Dr. Christophe
Salzmann whose help, support and work in remote experimentation topics have
hugely contributed to the development of this dissertation.
I would like to thank my family, my parents (Héctor and Mirta) who have
taught me everything I should know to face life. I also would like to thank my
brother and sister (Jaime and Patricia) for being there always.
Especially, I would like to thank my dear wife Claudia. She has encouraged
me and pushed to start this adventure far away from our families. Claudia, thank
you so much for the present you have given me.
Finally, I feel deeply thankful to my director of thesis, Professor Sebastián
Dormido Bencomo. It would be very difficult to enumerate the knowledge, teaching and experience he has taught me. He always provided me with sound advice,
support, encouragement, guidance and many other things, which have changed
my way of seeing and dealing with my personal and professional life. Thanks
Sebastián for giving me the opportunity to be one more in your research team. I
have felt a really lucky man during all this time.
Contents
I
PRELIMINARIES
1 Introduction, Objectives and Structure
3
1.1
Introduction . . . . . . . . . . . . . . . . . . . . . . . . . . . . . . . . .
4
1.2
Objectives . . . . . . . . . . . . . . . . . . . . . . . . . . . . . . . . . .
8
1.3
Outlines . . . . . . . . . . . . . . . . . . . . . . . . . . . . . . . . . . .
9
1.4
Publications, Awards and Projects . . . . . . . . . . . . . . . . . . .
10
2 Environment Global Architecture
17
2.1
Planning the structure of the system . . . . . . . . . . . . . . . . . .
18
2.2
A systematic two-layer approach . . . . . . . . . . . . . . . . . . . .
19
2.2.1
Layer 1: The experimentation layer . . . . . . . . . . . . . .
19
2.2.1.1
The client: Requirements and specifications . . . .
20
2.2.1.2
The server: Requeriments and specifications . . .
21
Layer 2: The e-learning layer . . . . . . . . . . . . . . . . . .
23
Conclusions . . . . . . . . . . . . . . . . . . . . . . . . . . . . . . . . .
25
2.2.2
2.3
II
1
IMPLEMENTATION
27
3 The Experimentation Layer
29
3.1
Development of virtual laboratories . . . . . . . . . . . . . . . . . . .
30
ii
Contents
3.2
3.3
3.4
3.1.1
Easy Java Simulations as a development tool . . . . . . . .
31
3.1.2
Structure of a generic virtual control lab in Ejs . . . . . . .
33
Adapting virtual-labs for remote experimentation . . . . . . . . . .
39
3.2.1
Background . . . . . . . . . . . . . . . . . . . . . . . . . . . . .
39
3.2.1.1
Communication protocols . . . . . . . . . . . . . . .
41
3.2.1.2
TCP or UDP as data transportation mechanism .
43
3.2.2
Building the server-side . . . . . . . . . . . . . . . . . . . . .
44
3.2.3
Using LabVIEW for remote experimentation . . . . . . . . .
45
3.2.4
Linking a virtual-lab to the server-side . . . . . . . . . . . .
49
3.2.5
Visual feedback from the remote plant . . . . . . . . . . . .
55
3.2.5.1
Development of the Java library webcam.jar . . .
57
3.2.5.2
The WebCamImage view element in Ejs . . . . . .
58
3.2.5.3
The Augmented Reality concept . . . . . . . . . . .
60
A new approach to connect Java and LabVIEW . . . . . . . . . . .
61
3.3.1
Motivations . . . . . . . . . . . . . . . . . . . . . . . . . . . . .
61
3.3.2
Technical issues of the JiL Server middleware layer . . . . .
62
3.3.3
Details of the JiL Server implementation . . . . . . . . . . .
65
3.3.4
API Java to control LabVIEW applications . . . . . . . . .
66
3.3.5
A very simple example of use . . . . . . . . . . . . . . . . . .
68
3.3.6
Integrating the API Java in Ejs . . . . . . . . . . . . . . . .
70
Conclusions . . . . . . . . . . . . . . . . . . . . . . . . . . . . . . . . .
76
4 Prototypes Developed
77
4.1
Case studies: A short introduction . . . . . . . . . . . . . . . . . . .
78
4.2
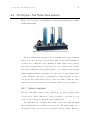
Prototype I: The Three-tank system . . . . . . . . . . . . . . . . . .
79
4.2.1
System overview . . . . . . . . . . . . . . . . . . . . . . . . . .
79
4.2.2
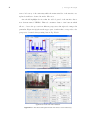
The three-tank system’s virtual-lab in Ejs . . . . . . . . . .
81
4.2.3
Local control of the three-tank system in LabVIEW . . . .
85
4.2.4
The virtual and remote version of the laboratory . . . . . .
90
Prototype II: The Heatflow system . . . . . . . . . . . . . . . . . . .
97
4.3.1
98
4.3
System overview . . . . . . . . . . . . . . . . . . . . . . . . . .
iii
Contents
4.4
4.5
4.3.2
Local control of the heatflow system . . . . . . . . . . . . . .
99
4.3.3
The virtual and remote laboratory . . . . . . . . . . . . . . .
99
Prototype III: The DC Motor . . . . . . . . . . . . . . . . . . . . . . 103
4.4.1
System overview . . . . . . . . . . . . . . . . . . . . . . . . . . 103
4.4.2
Local control of the DC Motor . . . . . . . . . . . . . . . . . 104
4.4.3
The virtual and remote laboratory . . . . . . . . . . . . . . . 108
Conclusions . . . . . . . . . . . . . . . . . . . . . . . . . . . . . . . . . 111
5 The e-Learning Layer
113
5.1
On-line learning: Pedagogical aspects . . . . . . . . . . . . . . . . . 114
5.2
eMersion: A novel approach from EPFL . . . . . . . . . . . . . . . . 117
5.3
5.2.1
Introduction . . . . . . . . . . . . . . . . . . . . . . . . . . . . 117
5.2.2
Web technology behind eMersion . . . . . . . . . . . . . . . . 119
5.2.3
eMersion abstractions and concepts . . . . . . . . . . . . . . 120
5.2.4
Functional architecture of the eMersion GUI . . . . . . . . . 123
Conclusions . . . . . . . . . . . . . . . . . . . . . . . . . . . . . . . . . 130
6 Access Control to Experimentation Resources
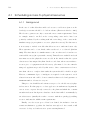
6.1
Scheduling access to physical resources . . . . . . . . . . . . . . . . . 132
6.1.1
6.2
Background . . . . . . . . . . . . . . . . . . . . . . . . . . . . . 132
A simple point-to-point authentication protocol . . . . . . . . . . . 133
6.2.1
User authentication . . . . . . . . . . . . . . . . . . . . . . . . 133
6.2.2
A database for the booking of physical resources . . . . . . 134
6.2.3
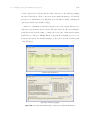
LabVIEW implementation for authentication . . . . . . . . 136
6.2.3.1
6.2.4
6.3
6.4
131
Integration into the JiL server . . . . . . . . . . . . 138
User authentication issues in Ejs . . . . . . . . . . . . . . . . 140
A flexible scheme for booking and authentication . . . . . . . . . . 141
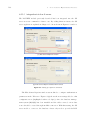
6.3.1
The automatic bookings system client interface . . . . . . . 144
6.3.2
The automatic bookings system server . . . . . . . . . . . . 146
Conclusions . . . . . . . . . . . . . . . . . . . . . . . . . . . . . . . . . 147
iv
Contents
7 Integration of Layers
III
149
7.1
Linking layers . . . . . . . . . . . . . . . . . . . . . . . . . . . . . . . . 150
7.2
Integration of Ejs applications in eMersion . . . . . . . . . . . . . . 151
7.2.1
Ejs built-in methods to save data in eJournal . . . . . . . . 151
7.2.2
Defining types of data fragments . . . . . . . . . . . . . . . . 152
7.3
Linking all: Work modules in eMersion . . . . . . . . . . . . . . . . 153
7.4
A remote laboratory integrated into eMersion . . . . . . . . . . . . . 156
7.5
Conclusions . . . . . . . . . . . . . . . . . . . . . . . . . . . . . . . . . 158
ASSESSMENT
159
8 System Assessment
161
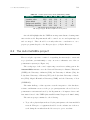
8.1
A first experience from the UNED . . . . . . . . . . . . . . . . . . . 162
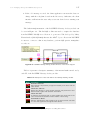
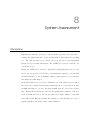
8.2
The AutomatL@bs project . . . . . . . . . . . . . . . . . . . . . . . . 163
8.3
8.2.1
Access to AutomatL@bs . . . . . . . . . . . . . . . . . . . . . 165
8.2.2
Remote systems available . . . . . . . . . . . . . . . . . . . . 166
8.2.3
Analysis of results . . . . . . . . . . . . . . . . . . . . . . . . . 170
Conclusions . . . . . . . . . . . . . . . . . . . . . . . . . . . . . . . . . 173
9 Conclusions and Future Research
175
9.1
Conclusions . . . . . . . . . . . . . . . . . . . . . . . . . . . . . . . . . 175
9.2
Future work . . . . . . . . . . . . . . . . . . . . . . . . . . . . . . . . . 177
Bibliography
APPENDICES
A Modelling and Control
181
195
197
A.1 The Three-tank system: Modelling and control . . . . . . . . . . . . 198
A.1.1 Modelling . . . . . . . . . . . . . . . . . . . . . . . . . . . . . . 198
A.1.2 Multivariable control . . . . . . . . . . . . . . . . . . . . . . . 201
A.2 The DC Motor: Modelling and control . . . . . . . . . . . . . . . . . 207
A.2.1 Modelling . . . . . . . . . . . . . . . . . . . . . . . . . . . . . . 207
v
Contents
A.2.2 Design of the PID controllers . . . . . . . . . . . . . . . . . . 209
A.3 The Heatflow system: Modelling and control . . . . . . . . . . . . . 213
A.3.1 Modelling . . . . . . . . . . . . . . . . . . . . . . . . . . . . . . 214
A.3.2 Controller design . . . . . . . . . . . . . . . . . . . . . . . . . 215
B Hardware Description
219
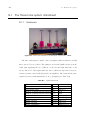
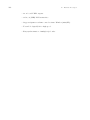
B.1 The Three-tank system datasheet . . . . . . . . . . . . . . . . . . . . 220
B.1.1 Hardware . . . . . . . . . . . . . . . . . . . . . . . . . . . . . . 220
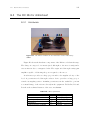
B.1.2 DAQ MF614 Humusoft Multifunction I/O . . . . . . . . . . 222
B.2 The Heatflow system datasheet . . . . . . . . . . . . . . . . . . . . . 226
B.2.1 Hardware . . . . . . . . . . . . . . . . . . . . . . . . . . . . . . 226
B.2.2 DAQ Q8 Hardware in the Loop H.I.L. Board . . . . . . . . 228
B.3 The DC Motor datasheet . . . . . . . . . . . . . . . . . . . . . . . . . 231
B.3.1 Hardware . . . . . . . . . . . . . . . . . . . . . . . . . . . . . . 231
B.3.2 The NI PCI-6221 Multifunction DAQ . . . . . . . . . . . . . 232
C eMersion Management
235
C.1 How to work with eMersion . . . . . . . . . . . . . . . . . . . . . . . 236
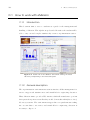
C.1.1 Introduction . . . . . . . . . . . . . . . . . . . . . . . . . . . . 236
C.1.2 General description . . . . . . . . . . . . . . . . . . . . . . . . 236
C.1.3 Interface and eMersion functionalities . . . . . . . . . . . . . 237
C.1.3.1
Navegation bar . . . . . . . . . . . . . . . . . . . . . 237
C.1.3.2
Experimentation console . . . . . . . . . . . . . . . 239
C.1.3.3
Working with eJournal . . . . . . . . . . . . . . . . 239
List of Tables
3.1
Casting data types LabVIEW v/s Java. . . . . . . . . . . . . . . . .
50
3.2
API Java of the Jil class (methods to control the connection). . . .
67
3.3
API Java of the Jil class (setter and getter methods). . . . . . . . .
67
3.4
Methods in Ejs to link with a Jil published VI. . . . . . . . . . . . .
75
6.1
Description of the main VIs for the Identity checking module. . . . 137
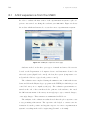
8.1
Student questionnary results (2006-2007), UNED. . . . . . . . . . . 163
A.1 Parameters obtained from the identification process. . . . . . . . . 201
A.2 SSGM for the threetank system. . . . . . . . . . . . . . . . . . . . . . 202
A.3 RGA for the threetank system. . . . . . . . . . . . . . . . . . . . . . 202
B.1 System parameters. . . . . . . . . . . . . . . . . . . . . . . . . . . . . 220
B.2 System parameters. . . . . . . . . . . . . . . . . . . . . . . . . . . . . 226
B.3 Dimensions and power requirements. . . . . . . . . . . . . . . . . . . 227
B.4 Data acquisition requirements. . . . . . . . . . . . . . . . . . . . . . . 227
B.5 Calibration of the equipment. . . . . . . . . . . . . . . . . . . . . . . 227
B.6 Motor parameters. . . . . . . . . . . . . . . . . . . . . . . . . . . . . . 231
B.7 Steel disk parameters. . . . . . . . . . . . . . . . . . . . . . . . . . . . 232
B.8 Other parameters. . . . . . . . . . . . . . . . . . . . . . . . . . . . . . 232
List of Figures
1.1
Scheme of the flexible education paradigm. . . . . . . . . . . . . . .
6
2.1
On-line experimentation system: Global architecture. . . . . . . . .
18
2.2
Experimentation layer: General scheme. . . . . . . . . . . . . . . . .
19
2.3
Server side implementation requirements. . . . . . . . . . . . . . . .
21
2.4
e-learning platform architecture. . . . . . . . . . . . . . . . . . . . . .
24
3.1
Simplified model-view-control paradigm in Ejs. . . . . . . . . . . . .
33
3.2
Simulation algorithm of any Ejs application. . . . . . . . . . . . . .
35
3.3
Control of a first order system: The single-tank process. . . . . . .
35
3.4
Closed-loop control in the single-tank process. . . . . . . . . . . . .
36
3.5
Defining the MODEL of the single-tank process. . . . . . . . . . . .
37
3.6
Defining the VIEW of the single-tank process. . . . . . . . . . . . .
38
3.7
Publishing the virtual-lab of the single-tank process as an applet. .
38
3.8
Stream of information between client and server. . . . . . . . . . . .
40
3.9
Structure of exchanged data packets between client and server. . .
41
3.10 Stack connections of the Internet Protocol Suite. . . . . . . . . . . .
42
3.11 Encapsulation of data descending through the protocol stack. . . .
43
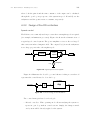
3.12 Feedback control scheme. . . . . . . . . . . . . . . . . . . . . . . . . .
45
3.13 Distributed control architecture using LabVIEW and Ejs. . . . . .
46
3.14 Concurrent tasks in the server-side. . . . . . . . . . . . . . . . . . . .
47
x
List of Figures
3.15 Three loops running concurrently in the LabVIEW server. . . . . .
48
3.16 Concurrent tasks in the client-side. . . . . . . . . . . . . . . . . . . .
51
3.17 Structure of exchanged data packets between client and server. . .
51
3.18 Communication methods for remote experimentation. . . . . . . . .
52
3.19 Visual feedback of the remote plant through video images. . . . . .
55
3.20 Camera SONY EVI-D31 with external video server AXIS 2400. . .
56
3.21 WebCamImage view element on Ejs. . . . . . . . . . . . . . . . . . .
59
3.22 Simple illustration of the augmented reality concept. . . . . . . . .
60
3.23 Command based architecture. . . . . . . . . . . . . . . . . . . . . . .
63
3.24 The JiL Server front panel. . . . . . . . . . . . . . . . . . . . . . . . .
64
3.25 Use of two Invoke Node blocks to modify a property and invoke a
method on a virtual instrument. . . . . . . . . . . . . . . . . . . . . .
65
3.26 Part of the JiL Server wiring diagram that obtains the list of a VI
controls and indicators using two Invoke Node blocks. . . . . . . . .
65
3.27 Modular view of the JiL Server approach. . . . . . . . . . . . . . . .
68
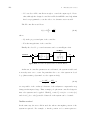
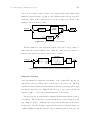
3.28 Scheme of a generic VI for feedback control purposes. . . . . . . . .
69
3.29 Wiring diagram of the example. . . . . . . . . . . . . . . . . . . . . .
69
3.30 Metadata information in LabVIEW for VI controls in Figure 3.29.
72
3.31 Messages exchange between Ejs and JiL server. . . . . . . . . . . .
73
3.32 Table of Ejs variables linked to VI controls and indicators. . . . . .
74
3.33 List of controls and indicators of a remote VI as offered by Ejs. . .
74
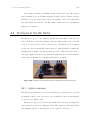
4.1
The DTS200 three-tank system by Amira. . . . . . . . . . . . . . . .
79
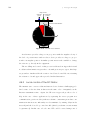
4.2
The three-tank system. From left to right, tanks T1 , T2 , and T3
are serially connected to each other by pipes. . . . . . . . . . . . . .
80
4.3
Ejs Model of the three-tank virtual-lab: Variables. . . . . . . . . .
81
4.4
Ejs Model of the three-tank virtual-lab: Evolution. . . . . . . . .
82
4.5
Ejs Model of the three-tank virtual-lab: Custom methods. . . .
83
4.6
Ejs View of the three-tank system virtual-lab. . . . . . . . . . . . .
83
4.7
GUI of the three-tank system virtual-lab. . . . . . . . . . . . . . . .
84
4.8
Local control of the three-tank real system - Block diagram. . . . .
86
xi
List of Figures
4.9
Local control of the three-tank real system - Front panel. . . . . . .
87
4.10 Continuous PID controller (Simulink model). . . . . . . . . . . . . .
88
4.11 Discrete PID controller with antiwindup protection programmed
in LabVIEW. . . . . . . . . . . . . . . . . . . . . . . . . . . . . . . . .
89
4.12 Linkage of the Ejs and LabVIEW variables. . . . . . . . . . . . . . .
91
4.13 Method to be launched when connect button is pushed. . . . . . .
91
4.14 The _external.step() method is called in every iteration of the
Evolution during the connection. . . . . . . . . . . . . . . . . . . . .
92
4.15 The _external.synchronize() method is called when user modifies the value in pump1 manually. . . . . . . . . . . . . . . . . . . .
92
4.16 The WebCamImage appears at the top of the hierarchy of the
DrawingPanel container to enrich the view with augmented reality. 93
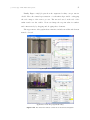
4.17 The three-tank system virtual and remote control laboratory. . . .
94
4.18 The virtual and remote control lab of the three-tank system. . . .
95
4.19 Connection scheme via web browser between Ejs and LabVIEW.
The Ejs application controls the threetankReal.vi through the JiL
server. . . . . . . . . . . . . . . . . . . . . . . . . . . . . . . . . . . . .
96
4.20 The heatflow apparatus. . . . . . . . . . . . . . . . . . . . . . . . . .
97
4.21 Variables of the apparatus. . . . . . . . . . . . . . . . . . . . . . . . .
98
4.22 Local control of the heatflow real system - Front panel. . . . . . . .
99
4.23 Local control of the heatflow real system - Block diagram. . . . . . 100
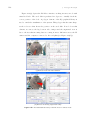
4.24 The web-based laboratory of the heatflow system in virtual mode. 101
4.25 The web-based laboratory of the heatflow system in remote mode. 102
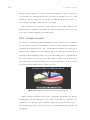
4.26 The Direct Current Motor didactical equipment used in the laboratory. . . . . . . . . . . . . . . . . . . . . . . . . . . . . . . . . . . . . 103
4.27 The DC motor scheme. . . . . . . . . . . . . . . . . . . . . . . . . . . 104
4.28 Local control of the DC motor real system - Front panel. . . . . . . 105
4.29 Local control of the DC motor real system - Block diagram. . . . . 106
4.30 Operations of the JiL server when sending data to a client. . . . . 107
4.31 The web-based laboratory of the DC motor in virtual mode. . . . . 109
4.32 The web-based laboratory of the DC motor in remote mode. . . . 110
xii
List of Figures
5.1
Interaction model illustrating the two main modes of on-line learning.116
5.2
Struts framework. Flow of information (request/answer). . . . . . . 120
5.3
General abstractions representing the eMersion organization. . . . 121
5.4
First level of abstraction in eMersion. . . . . . . . . . . . . . . . . . 121
5.5
Second level of abstraction in eMersion. . . . . . . . . . . . . . . . . 122
5.6
Third level of abstraction in eMersion. . . . . . . . . . . . . . . . . . 123
5.7
Functional structure of eMersion. . . . . . . . . . . . . . . . . . . . . 124
5.8
The Navigation bar allows access to the web modules of eMersion. 124
5.9
The experimentation console of the DC Motor experiment. . . . . . 125
5.10 HTML Documentation of the DC Motor experiment. . . . . . . . . 126
5.11 Examples of external web applications integrated into eMersion. . 127
5.12 The eJournal module of the eMersion environment. . . . . . . . . . 128
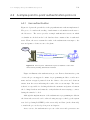
6.1
Point-to-point authentication protocol between a user and a remote server providing authentication services. . . . . . . . . . . . . 133
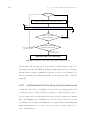
6.2
Algorithm of the point-to-point authentication protocol. . . . . . . 134
6.3
Database to host bookings. . . . . . . . . . . . . . . . . . . . . . . . . 135
6.4
Bookings registers in the accesslist table of the database. . . . . . . 135
6.5
Global vision of the first stage of the booking process. . . . . . . . 136
6.6
LabVIEW Identity cheking module. Extract of the block diagram. 137
6.7
Setting up options in JiL server. . . . . . . . . . . . . . . . . . . . . . 138
6.8
JiL server with authentication. Setting up and status visualization. 139
6.9
A flexible scheme for bookings and authentication process. . . . . . 141
6.10 State diagram of the booking process. . . . . . . . . . . . . . . . . . 142
6.11 State diagram of the authentication process. . . . . . . . . . . . . . 143
6.12 Interfaces involved in the reservation process. . . . . . . . . . . . . . 145
6.13 Server site of the automatic bookings system. . . . . . . . . . . . . . 146
7.1
Ejs built-in methods to link the applet to the eJournal workspace. 151
7.2
Saving data from the Ejs console to the eJournal space. . . . . . . 152
7.3
Types of data fragments in the eJournal space. . . . . . . . . . . . . 153
7.4
Creating a new module (included into a course) in eMersion. . . . 154
xiii
List of Figures
7.5
eMersion’s facade. Remote session using the three-tank system. . . 157
8.1
UNED pilot experience home page. . . . . . . . . . . . . . . . . . . . 162
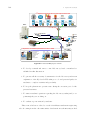
8.2
AutomatL@bs project network. . . . . . . . . . . . . . . . . . . . . . 164
8.3
AutomatL@bs home page. . . . . . . . . . . . . . . . . . . . . . . . . 166
8.4
DC motor: Miguel Hernández University. . . . . . . . . . . . . . . . 167
8.5
One tank system: University of Almerı́a. . . . . . . . . . . . . . . . . 167
8.6
The Rotoiman system: Polytechnic University of Catalunia. . . . . 168
8.7
Four variable system: University of León. . . . . . . . . . . . . . . . 168
8.8
Robot arm: University of Alicante. . . . . . . . . . . . . . . . . . . . 169
8.9
Ball and beam system: Polytechnic University of Valencia. . . . . . 169
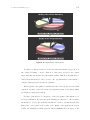
8.10 Satisfaction enquiry about the practical activities. . . . . . . . . . . 170
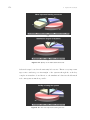
8.11 Regarding the overall system. . . . . . . . . . . . . . . . . . . . . . . 171
8.12 Quality of the web-based laboratories. . . . . . . . . . . . . . . . . . 172
8.13 The most important learning resource. . . . . . . . . . . . . . . . . . 172
A.1 Open loop experiences for identification. . . . . . . . . . . . . . . . . 199
A.2 Temporal window to calculate of the model parameters. . . . . . . 200
A.3 Three-tank system representation by transfer functions. . . . . . . 201
A.4 Descentralized control strategy. G(s) is the three-tank system to
be controlled, C(s) is the controller to be designed, and is composed
of two elements C1 and C2. Ci controls the level in tank i. The
variables hi setpoint, ei, ui, and hi are the setpoint to be reached,
the error signal, the control signal and the liquid level in tank i,
respectively. . . . . . . . . . . . . . . . . . . . . . . . . . . . . . . . . . 204
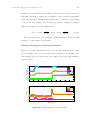
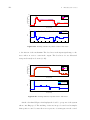
A.5 Tracking references - Three-tank system. . . . . . . . . . . . . . . . 205
A.6 Disturbance rejection - Three-tank system. . . . . . . . . . . . . . . 206
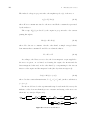
A.7 Model of the DC Motor. . . . . . . . . . . . . . . . . . . . . . . . . . 208
A.8 Typical speed control system. . . . . . . . . . . . . . . . . . . . . . . 209
A.9 Control strategy for the DC Motor. . . . . . . . . . . . . . . . . . . . 209
A.10 PI control for speed control on the DC Motor. . . . . . . . . . . . . 210
A.11 Typical position control system. . . . . . . . . . . . . . . . . . . . . . 211
xiv
List of Figures
A.12 PI controller for position control on the DC Motor. . . . . . . . . . 211
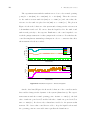
A.13 Tracking reference in position control - DC motor. . . . . . . . . . . 212
A.14 Tracking reference in speed control - DC motor. . . . . . . . . . . . 212
A.15 Step responses at the three sensors when Vh goes from 3 to 4 [volts]
and a fan fixed flow rate voltage of 3 [volts]. . . . . . . . . . . . . . 214
A.16 Tracking reference closing the loop around sensor 1 (constant voltage applied to the blower of 3 [volts]). . . . . . . . . . . . . . . . . . 216
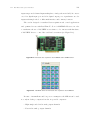
B.1 Three-tank hardware in the Automatic Control Lab - UNED. . . . 220
B.2 Humusoft data acquisition board MF614 and LabVIEW driver. . . 223
B.3 LabVIEW driver for Humusoft data acquisition board MF614. . . 223
B.4 Heatflow hardware in the Automatic Control Lab - UNED. . . . . 226
B.5 Q8 acquisition card used to control the Heatflow System. . . . . . . 228
B.6 LabVIEW driver for the Q8 acquisition card. . . . . . . . . . . . . . 228
B.7 DC Motor hardware in the Automatic Control Laboratory - UNED.231
B.8 The NI PCI-6221 Multifunction DAQ. . . . . . . . . . . . . . . . . . 232
B.9 LabVIEW driver DAQmx for NI PCI-6221. . . . . . . . . . . . . . . 233
C.1 Global view of the eMersion environment running the virtual laboratory corresponding to the three-tank system. . . . . . . . . . . . 236
C.2 Accessing to the documentation of the practice. . . . . . . . . . . . 238
C.3 Reduced (left) and extended (right) views of eJournal. . . . . . . . 240
C.4 The trash in the eJournal. . . . . . . . . . . . . . . . . . . . . . . . . 242
C.5 Export fragment “registroRealQ1.m” to the local hard disk. . . . . 243
C.6 Sending fragments by the dialog window Send. . . . . . . . . . . . . 243
C.7 Fields description of the fragments table. . . . . . . . . . . . . . . . 244
C.8 Adding annotations to a fragment. . . . . . . . . . . . . . . . . . . . 245
Part I
PRELIMINARIES
1
Introduction, Objectives
and Structure
Overview
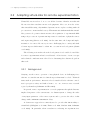
This chapter introduces the main objectives of this thesis work. Firstly, it provides a review of the use of Internet-based technologies in new teaching/learning
paradigms. The main challenges faced when trying to apply these new paradigms
in engineering subjects are addressed. In particular, the paradigm of flexible education in a remote experimentation context is first introduced and then, the
applicability of these ideas in the development of a complete remote experimentation environment through Internet is presented.
The objectives and structure of the thesis will then be described. These sections
provide insights on the main goals of the dissertation and a brief description of
each chapter. The final section indicates the list of sources and research projects
used to support the work presented.
4
1.1
1
Introduction, Objectives and Structure
Introduction
Nowadays, Internet is the first tool that comes to mind whenever a student,
teacher or person in general, wishes to find out more about a specific subject.
The use of computers in the traditional classroom provides numerous benefits.
Sharing resources and knowledge is also another advantage in a society each time
more globalized in need of more flexible mechanisms to interact and collaborate.
In this sense, the evolution of Internet has changed the education landscape drastically (Riva 2001, Bourne et al. 2005, Rosen 2007, Anderson 2007, Hu & Bao
2008). What was once considered “Distance Education” is now called “On-line
Education” whereby the method of teaching and learning is based on the use of
the Internet (at any given time or place) to complete educational activities.
A specific example of application of this new teaching model is the “National
University for Distance Education” (UNED). Compared to other Spanish universities, this institution has the largest number of students due mainly to the fact
that distance education allows to enrol students who can not use the traditional
educational system but wish to obtain a degree or improve their professional skills
without having to change their lifestyle. It is currently possible to find a wide
set of universities with on-line presence around the world (OUA 2009, LondonExternal 2009, UDIMA 2009, OU 2009, UNED 2009, Open-UA 2009, UNAD
2009, UOC 2009). This confirms the viability and the importance of computerassisted teaching and learning through Internet.
The implementation of the distance learning model is not an easy task in the
case of engineering and physical sciences studies (Williams 2007). In addition to
the textual/multimedia information and the other resources that are required to
provide the theoretical aspects in an on-line course, hands-on laboratories should
also be included. This is particularly true in control engineering education, a
field inherently interdisciplinary, where mathematics play a fundamental role,
and where progress is achieved through a mix of maths, modelling, computation
and experimentation (Fleming 1989, Dormido 2004, Åström 2006). In this given
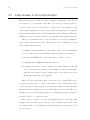
context, students should be able to achieve the following:
5
1.1 Introduction
− Understand the underlying scientific model of the phenomenon studied.
− Get acquainted with the limits of this model (i.e. how does the model
accurately reflect the real behaviour and to what extent it remains a basic
approximation).
− Learn how to manipulate the parameters of the model to fine-tune the
behaviour of the real system.
The implementation of an effective web-based educational environment for
any engineering topic should cover these three aspects of the technical education:
conceptual, interpretative, and operational. These should provide the student
with an opportunity to become an active player in the learning process (Dormido
et al. 2005a).
Flexible education in engineering
The potential of web-based experimental applications as pedagogical support
tools in the learning/teaching of control engineering has been presented in many
works (Hahn & Spong 2000, Cefalo et al. 2003, Casini et al. 2004, Valera et al.
2005, Eikaas et al. 2006, Gómez & Garcı́a 2007, Costas et al. 2009, Brito et al.
2009). In fact, in the last decade, several academic institutions have explored the
WWW to transfer their courses and experimental activities towards distributed
contexts. However, most of these developments focus on technical issues related
to the design and building of web-enabled applications that allow to perform practical activities through the Internet (virtual and remote laboratories). In general,
these do not take into account the social context of interaction and collaboration
generated in traditional hands-on laboratories (Nguyen 2007).
Indeed, direct contact with teachers and interaction with classmates are valuable resources that may lessen or even disappear when conducting hands-on experimental sessions via web-based laboratories. This suggests the necessity to
include this requirement when designing, developing, and deploying a web-based
experimental environment as that described in this dissertation.
6
1
Introduction, Objectives and Structure
Remote experimentation and flexible learning
The flexible learning paradigm is presented as an appropriate on-line learning
solution for engineering students (Kazmer & Haythornthwaite 2005). In (Gillet
et al. 2005), such paradigm is analyzed by the authors from three different perspectives: pedagogical, technical, and organizational. From a pedagogical point of
view, flexible education means to provide extended access to learning resources
for all the students. As a consequence, students have more liberty as to how
to organize their learning activities and thus, the participation, autonomy and
collaboration between the actors involved in the laboratory (teachers, tutors, and
students) are enhanced.
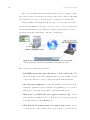
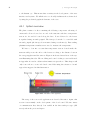
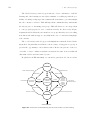
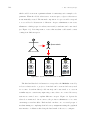
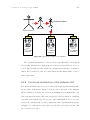
Figure 1.1: Scheme of the flexible education paradigm.
Figure 1.1 illustrates the idea of the extended accessibility. A student could
follow out his/her laboratory tasks anytime-anywhere, for instance, from the campus, from home, or from any site connected to the Internet.
From a technical point of view, flexible learning means an adequate exploitation of information, communication devices, and infrastructures available, especially the Internet, and the services derived from its usage. Finally, from an
organizational perspective, the flexible learning paradigm trusts in renewed cur-
7
1.1 Introduction
ricula and the relationships and results generated through research, work and
collaboration. Increased contact between researchers from different academia institutions will be achieved thanks to network infrastructures.
The flexible learning paradigm undoubtedly defines and clarifies a set of key
aspects to be considered. However, an analysis of the pedagogical aspects involved
should be carried out so as to clarify teaching methodology, learning resources
and objectives. This, in turn, will determine both technical and organizational
aspects.
Over the last years, the Department of Computer Science and Automatic Control of the UNED has been placing a great deal of effort into the analysis, design,
development, and exploitation of virtual and remote laboratories for automatic
control teaching and learning (Aranda et al. 1998, Sánchez 2000, Sánchez et al.
2002, Dormido 2004, Sánchez et al. 2004, Pastor et al. 2005, Dormido et al. 2005a,
Sánchez et al. 2005, Duro et al. 2008). However, despite all this work, there is no
appropriate environment as of yet that provides remote experimentation services
through Internet to students within a holistic and structured framework. This
dissertation tries to go one step further in this direction by implementing a complete web-based integral environment to perform remote practical experiences for
automatic control courses.
On the other hand, a mix of web-based technologies and software agents (Salzmann & Gillet 2008, 2007) is commonly used to develop remote experimentation
systems designed for pedagogical purposes. Incidentally, most recorded developments aimed at creating remote experimentation systems are custom-made
solutions. This means, their conception, selection of software tools, and global
system architecture are not simple tasks because of the wide variety of software
tools available nowadays. With regards to this aspect, the present thesis provides a
structured framework to develop remote experimentation systems using three software tools: Easy Java Simulations (Ejs 2009a), LabVIEW (LabVIEW 2009a),
and eMersion (eMersion 2009).
Since the UNED is a distance learning university, the introduction of this kind
of educational methodology is highly beneficial for students who must conjugate
8
1
Introduction, Objectives and Structure
work and academic life. In this context, capturing students’ perception of the system developed is paramount so as to improve it and include new functions. This
dissertation also analyses the remote experimentation environment developed and
provides a series of guidelines and suggestions on how to use the system and for
future works.
1.2
Objectives
The first objective of this paper is to describe the background needed to implement web-based environments to carry out hands-on laboratories through the
Internet in the field of engineering education. The overall aim is to suggest a
two-layered framework to create remote and virtual control laboratories and the
web-based tools required to publish them on the Internet.
The second objective is to provide a new approach to create virtual and remote
laboratories for control education. The approach suggested is based on the use
of two software tools specifically chosen for this purpose: Easy Java Simulations
and LabVIEW, the idea being that it will facilitate the creation of web-based
labs to new developers and/or educators who wish to include this new learning
paradigm in their curricula.
The third objective of this dissertation is to create a set of virtual and remote
control laboratories by following the framework developed step by step. Three
didactical setups located in the Automatic Control Laboratory of the UNED will
be used to develop the three web-based labs: a threetank system, a temperature
control system, and a DC motor. The developed prototypes will demonstrate the
validity of the approach described in this work.
The fourth objective is to provide and implement the features that a flexible
learning environment should offer to sustain an on-line community of web-based
labs. The aim is to describe the additional web-based resources needed to support
9
1.3 Outlines
the learning process effectively. The collaborative web-based application eMersion, specifically designed to organize and enable engineering practical activities
on the Internet will be used for this purpose.
The fifth objective is to develop a web-based automatic bookings system to arrange user access of physical resources available in remote laboratories. As is the
case in most academic institutions, the number of didactical setups available in
laboratories is insufficient and does not match the demand of students. For cost
reasons, it is possible in some cases to have one or two pilot plants available only.
The reason behind the designing of an automatic bookings system is to manage
user access in order to better use the physical resources.
The sixth and final objective is to evaluate the developed remote experimentation environment from the student’s point of view. Two pilot experiments were
carried out in order to analyze the positive and negative impact of this new way
of completing the practical activities on the students.
1.3
Outlines
This thesis has been structured as follows:
Chapter 2. The typical application scenario of a remote experimentation system
for pedagogical purposes is presented and discussed. This chapter also
introduces the approach to follow (giving some work guidelines) in order to
develop hands-on web-based laboratories.
Chapter 3. The methodology used for the implementation of virtual and remote
control laboratories is presented in this dissertation. The chapter describes
the JiL Server approach, a structured framework that enables to create the
virtual and remote labs mentioned in this thesis by using both Easy Java
Simulations and NI LabVIEW.
Chapter 4. This chapter shows how to build virtual and remote control labo-
10
1
Introduction, Objectives and Structure
ratories using the approach proposed in Chapter 3.
Additional information on hardware, modelling, and control of the laboratory setups used in this work is provided in Appendices A and B.
Chapter 5. Various teaching models will be analyzed that sustain and support
the learning process of students in a remote experimentation context. The
software tool used to publish web-based labs through Internet “eMersion”
is also presented and described in detail. More information on the use of
eMersion can be found in Appendix C.
Chapter 6. The analysis, design and implementation of an Automatic Booking
System to organize and optimize the use of the physical resources available
in laboratories is also presented.
The integration of this application in the remote experimentation environment eMersion is addressed in Chapter 7.
Chapter 7. The integration of the experimentation layer and learning layer is
presented. All the web components described in previous chapters are coupled in order to obtain the final remote experimentation environment for
engineering educational programs.
Chapter 8. An assessment system is presented in this chapter. The UNED pilot
experience and the AutomatL@bs project are two experiments carried out
with real students aimed at evaluating how useful the system is as a teaching
tool. Results are analyzed and discussed at the end of this chapter.
Chapter 9. Conclusions and future research are presented.
1.4
Publications, Awards and Projects
Journal papers
1. H. Vargas, J. Sánchez, S. Dormido, C.A. Jara, F. Candelas, F. Torres. “Docencia en Automática: Aplicación de las TIC a la realización de actividades
1.4 Publications, Awards and Projects
11
prácticas a través de Internet”. Revista Iberoamericana de Automática e
Informática Industrial (RIAI). ISSN: 1697-7912, Vol. 7, Nr. 1, pp. 35-45.
Enero 2010.
2. H. Vargas, J. Sánchez, Ch. Salzmann, F. Esquembre, D. Gillet, S. Dormido
(2009). “Web-enabled Remote Scientific Environments”. Computing in Science and Engineering. vol. 11, no. 3, pp. 34-46.
3. H. Vargas, J. Sánchez, N. Duro, R. Dormido, S. Dormido-Canto, G. Farias,
S. Dormido, F. Esquembre, Ch. Salzmann, D. Gillet (2008). “A systematic
two-layer approach to develop Web-based experimentation environments for
control engineering education”. Intelligent Automation and Soft Computing. vol. 14, no. 4, pp. 505-524.
4. R. Dormido, H. Vargas, N. Duro, J. Sánchez, S. Dormido-Canto, G. Farı́as,
F. Esquembre, S. Dormido (2008). “Development of a Collaborative WebBased Control Laboratory for Automation Technicians: The Three-Tank
System”. IEEE Trans on Education. vol. 51, pp. 35-44.
5. N. Duro, R. Dormido, H. Vargas, S. Dormido-Canto, J. Sánchez, G. Farias,
S. Dormido (2008). “An Integrated virtual and remote control lab: the
three-tank system as a case study”. Computing in Science and Engineering.
vol. 10, pp. 50-59.
6. J. L. Guzmán, H. Vargas, J. Sánchez, M. Berenguel, S. Dormido, F. Rodrı́guez (2007). “Education Research in Engineering Studies: Interactivity,
Virtual and Remote Labs”. ISBN: 1-60021-829-6. Book Chapter “Distance
Education Research Trends”, Nova Science Publisher. pp. 131-167.
7. S. Dormido, H. Vargas, J. Sánchez, R. Dormido, N. Duro, S. DormidoCanto, F. Morilla, M. A. Canto, G. Farias (2009). ”Compartiendo recursos de experimentación a través de Internet: la experiencia Automatl@bs”.
Book Chapter “La UNED ante el EEES: Redes de investigación en innovación docente 2006/2007”, Editorial UNED.
12
1
Introduction, Objectives and Structure
Conference papers
1. H. Vargas, Ch. Salzmann, D. Gillet, S. Dormido. “Remote Experimentation Mashup”. 8th IFAC Symposium on Advances in Control Education.
Kumamoto (Japón), Octubre 2009.
2. M. Guinaldo, H. Vargas, J. Sánchez, E. Sanz, S. Dormido. “Web-based
Control Laboratory: The Ball and Beam System”. 8th IFAC Symposium
on Advances in Control Education. Kumamoto (Japón), Octubre 2009.
3. L. Dı́az, G. Ramos, H. Vargas, R. Costa. “A Virtual/Remote Laboratory
to illustrate the Internal Model Principle for periodical signals”. 8th IFAC
Symposium on Advances in Control Education. Kumamoto (Japón), Octubre 2009.
4. H. Vargas, J. Sánchez y S. Dormido. “Experimentación Remota en Automática: Nuevos Entornos Basados en la Web 2.0”. XXX Jornadas de
Automática. Valladolid (España), Septiembre 2009.
5. H. Vargas, J. Sánchez y S. Dormido. “The Spanish university network of
web-based laboratories for control engineering education: The AutomatL@bs
project”. European Control Conference ECC 2009. Budapest (Hungrı́a),
Agosto 2009.
6. H. Vargas, J. Sánchez y S. Dormido (2008). “Proyecto AutomatLabs: Red
Interuniversitaria de Laboratorios de Control Automático a través de Internet”. XIII Latin American Congress on Automatic Control (CLCA).
Mérida (Venezuela), November 2008.
7. H. Vargas, J. Sánchez, S. Dormido. “Acceso Extendido a Recursos de Experimentación a través de Internet: La Experiencia AutomatL@bs”. XXIX
Jornadas de Automática. Tarragona (España), Septiembre 2008.
8. G. Farias, S. Dormido, F. Esquembre, H. Vargas, S. Dormido-Canto (2008).
“Laboratorio Virtual para la Enseñanza de Técnicas de Reconocimiento de
1.4 Publications, Awards and Projects
13
Patrones”. XIII Latin American Congress on Automatic Control (CLCA).
Mérida (Venezuela), November 2008.
9. S. Dormido, J. Sánchez, H. Vargas, S. Dormido-Canto, R. Dormido, N.
Duro, G. Farias, M. A. Canto y F. Esquembre (2007). “Análisis, desarrollo y publicación de laboratorios virtuales y remotos para la enseñanza
de la automática”. II Congreso Español de Informática (CEDI), Zaragoza
(Spain).
10. J. L. Guzmán, M. Berenguel, F. Rodrı́guez, H. Vargas, J. Sánchez, S.
Dormido (2007). “Desarrollo de un entorno de experimentación basado
en web para estudios de ingenierı́a: un caso práctico”. II Congreso Español
de Informática (CEDI), Zaragoza (Spain).
11. J. Sánchez, H. Vargas, S. Dormido (2007). “Web-based learning resources
for vocational training on Control and measurements systems: The AutoTECH Project”. European Control Conference (ECC), Kos (Greece).
12. S. Dormido, J. Sánchez, F. Esquembre, H. Vargas, S. Dormido-Canto, R.
Dormido, N. Duro, G. Farı́as, Ma. A. Canto (2007). “The development of
web-based virtual laboratories using Easy Java Simulations (Ejs)”. International Conference on Remote Engineering and Virtual Instrumentation
Rev07, Oporto (Portugal).
13. H. Vargas, R. Dormido, N. Duro, J. Sánchez, G. Farı́as, S. Dormido, M.
Canto, and F. Esquembre (2006). “Heatflow: Un laboratorio basado en
Web usando Easy Java Simulations y LabVIEW para el entrenamiento en
técnicas de automatización”. XII Latin American Congress on Automatic
Control (CLCA). Salvador de Bahı́a (Brasil).
14. G. Farı́as, F. Esquembre, J. Sánchez, S. Dormido, H. Vargas, S. DormidoCanto, R. Dormido, N. Duro, and M. Canto (2006). “Desarrollo de laboratorios virtuales, interactivos y remotos utilizando Easy Java Simulations
y Modelos Simulink”. XII Latin American Congress on Automatic Control
(CLCA). Salvador de Bahı́a (Brasil).
14
1
Introduction, Objectives and Structure
15. H. Vargas, J. Sánchez, R. Dormido, G. Farı́as, and S. Dormido (2006). “Desarrollo de laboratorios virtuales y remotos usando Easy Java Simulations
and LabVIEW. El sistema Heatflow como un caso de estudio”. XXVII
Jornadas de Automática. Almerı́a (Spain).
16. J. Sánchez, H. Vargas, S. Dormido (2006). “Recursos de Aprendizaje basados en el Web para la formación ocupacional en sistemas de Regulación y
Control”. XXVII Jornadas de Automática. Almerı́a (Spain).
17. H. Vargas, G. Farı́as, S. Dormido, and J. Sánchez (2006). “Web-based
learning resources for automation technicians vocational training: illustred
with a Heatflow and liquid level laboratory”. 7th IFAC Symposium on
Advances in Control Education (ACE). Madrid (Spain).
18. N. Duro, R. Dormido, H. Vargas, S. Dormido, J. Sánchez, and R. Pastor
(2005). “The Three Tank System: A Remote and Virtual Control Laboratory using Easy Java Simulations”. 44th IEEE Conference on Decision and
Control and European Control Conference (CDC-ECC). Sevilla (Spain).
19. N. Duro, R. Dormido, H. Vargas, S. Dormido, J. Sánchez (2005). “El sistema de tres tanques. Un laboratorio virtual y remoto usando Easy Java
Simulations”. I Spanish Congreso on Computer Sciences (CEDI/EIWISA).
Granada (Spain).
Awards
− PRODEL prize to the best paper about “Control Education” presented in
the XXIX Jornadas de Automática. Tarragona, Spain. September 2008.
Title of paper: Acceso Extendido a Recursos de Experimentación a Través
de Internet: La Experiencia AutomatL@bs.
− Prize from “Consejo Social y Fundación UNED” to the best project on
teaching innovation 2008. Madrid, Spain. December 2008. Title of project:
AutomatL@bs - Red de investigación para la innovación docente en Automática mediante laboratorios virtuales y remotos.
1.4 Publications, Awards and Projects
15
− Honorable mention in the final competition “Science in Action” in the
modality “Science and Technology”. Title of the contribution: AutomatL@bs:
Una red de laboratorios virtuales y remotos para la enseñanza en control automático. Granada, Spain. September 2009.
Research projects
The results obtained in the framework of this dissertation have been supported
by different research projects:
− Interactive tools to the modelled, visualization, simulation and control of
hybrid systems (2004–2006). Spanish Ministry of Education and Science,
CICYT (Ref. DPI2004-01804). National University for Distance Education
of Madrid, Spain. Directed by Prof. Sebastián Dormido Bencomo.
− Control of complex systems for logistic and production of goods and services. COSICOLOGI-CM (2005–2008), IV PRICIT. Autonomous Region
of Madrid-Spain (Ref. S-0505/DPI/0391). Directed by Prof. Sebastián
Dormido Bencomo.
− Event-based modelling, simulation, and control (2007–2012). Spanish Ministry of Education and Science, CICYT (Ref. DPI2007-61068). National
University for Distance Education of Madrid, Spain. Directed by Prof.
Sebastián Dormido Bencomo.
2
Environment Global Architecture
Overview
The first step before starting to develop a remote experimentation system is to
define its global architecture. In this sense, from a software engineering point
of view, there are three mandatory stages to follow in every software development process: Requirements Analysis, Specifications, and Design and Architecture. This chapter describes these stages and tries to give a systematic approach
to use for the appropriate implementation of a web-based experimentation environment with pedagogical perspectives.
Once the global structure of the system is specified (requirements analysis and
specifications), the design and architecture process is then addressed. Here, the
global architecture of the system is divided into several sub-problems or components that form the entire system. In this given context, this chapter introduces
the systematic two-layer approach to follow in the development process of the
system: the experimentation and the e-learning layers.
18
2.1
2
Environment Global Architecture
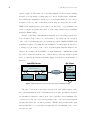
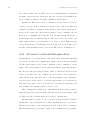
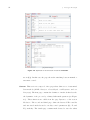
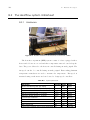
Planning the structure of the system
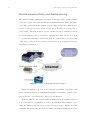
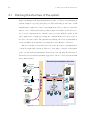
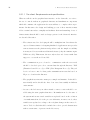
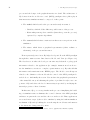
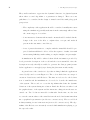
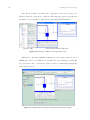
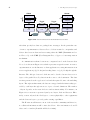
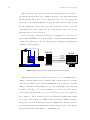
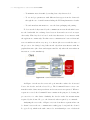
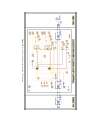
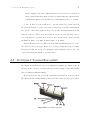
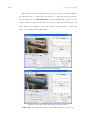
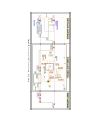
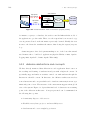
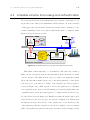
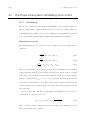
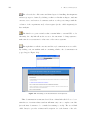
Figure 2.1 illustrates the typical application scenario of a remote experimentation
system designed for pedagogical purposes. The university provides the overall
infrastructure required for remote experimentation services offered to students,
that is, a set of didactical-setups specially designed for hands-on laboratories, a
set of server computers used to interface these processes with the outside world
and a main server computer providing the complementary web-based resources
needed to use remote-labs. The system users (clients) can access experimentation
services available from anywhere providing there is an Internet connection.
The above mentioned describes, in a few words, the remote experimentation
context in engineering education. However, developing a complete environment
able to provide such experimentation services is not an easy task. For this reason,
the next section presents a systematic approach to follow to develop a system with
these characteristics.
Remote Experimentation Services
Remote Lab
wired clients
Common IP Core
Network
wireless clients
WLAN
AP
clients from home
Industry
I
N
T
E
R
N
E
T
University
Main Server
didactical-setup
Lab-Server
didactical-setup
Intranet
Lab-Server
didactical-setup
Lab-Server
Figure 2.1: On-line experimentation system: Global architecture.
19
2.2 A systematic two-layer approach
2.2
A systematic two-layer approach
Although the development responsibilities can be clasified in multiple ways, in
this dissertation we have divided the problem into two levels or “layers”. The
first layer is the so-called experimentation layer that includes all the software
and hardware components needed to develop the experimental applications, that
is, the web-based virtual and remote laboratories. As web-based labs alone do
not give us all the elements needed to provide remote experimentation services in
a pedagogical context, complementary web-based resources are needed to manage
the learning process of students. Thus, the so-called e-learning layer implies the
development of the functionalities required to support the teaching and learning
of students through the Internet (Vargas et al. 2008).
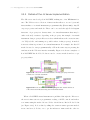
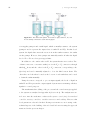
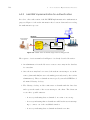
2.2.1
Layer 1: The experimentation layer
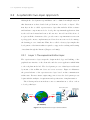
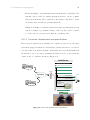
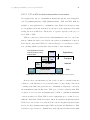
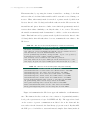
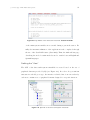
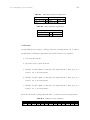
The experimentation layer wraps the design methodology and building of the
graphical user interface of the client side and the server application which links
to the real plant in the lab. The development process of this layer is addressed
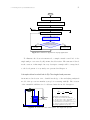
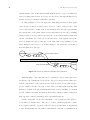
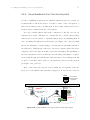
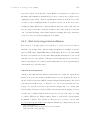
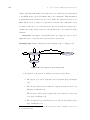
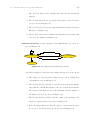
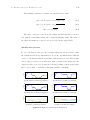
by means of the well-known client and server structure. Figure 2.2 illustrates
the general scheme of the experimentation layer based on this communication
architecture. From a software engineering point of view, the development process
begins with the analysis of requirement and specifications of implementation.
The following subsections indicate some recommendations to follow on how
to develop this layer.
camera points to plant
Public IP
Private IP
eth/usb
interface
DAQ
Client
Internet
(IP network)
Lab-Server
Figure 2.2: Experimentation layer: General scheme.
didactical-setup
in the laboratory
20
2
Environment Global Architecture
2.2.1.1 The client: Requirements and specifications
When we talk about the graphical user interface on the client side, we refer to
the set of controls, indicators, graphical elements, and visualization components
which all constitute the application the users will use to complete their experiments. In this sense, the design and building process of these interfaces must
follow certain basic rules to simplify and facilitate their understanding. A set of
characteristics that should be used as design options for the client side interface
are described hereafter:
− The software used for developing should be multiplatform. Java shows the
expected characteristics for designing this kind of applications as it provides
various features as the platform independence and the simple accesibility
from any web browser without additional software (only, the runtime engine
JVM is needed). This means, the user only needs a web browser with Java
support to access the web-based lab.
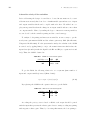
− The communication protocol used to communicate with the server-side
should be low-level protocols to stream data through the Internet: TCP
(Transfer Control Protocol) or UDP (User Datagram Protocol). They allow for a better control of data packet transmisions in networks based on
IP protocol, such as the Internet.
− The graphical user interface must prove simple and intuitive. It should be
user-friendly and it should also have been tested successfully in different
environments.
− Access to the laboratory in either virtual or remote version should be enabled using the same graphical interface. In simulation mode, the state of
the system and its associated variables are updated based on the evolution
of a mathematical model of the process. Otherwise, in remote mode, these
variables are updated according to the real plant changes in the remote location. Video feedback should be included in order to provide distant users
with a certain sense of presence in the laboratory.
21
2.2 A systematic two-layer approach
− Events sheduling to program faults in the system should be scheduled. The
systems could be enabled to analyze systems in presence of noise or disturbances measurements. The robustness of the system could then be evaluated under these anomalous operating situations.
− Finally, it is highly recommended that users define experiments in an easy
way. For example, a programmed change of the setpoint could be required
to observe the process response in different operating points.
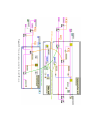
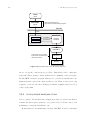
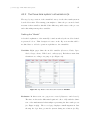
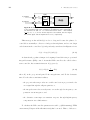
2.2.1.2 The server: Requeriments and specifications
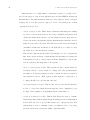
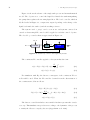
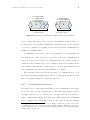
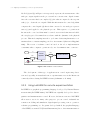
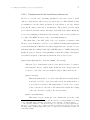
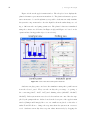
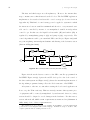
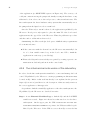
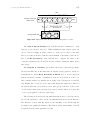
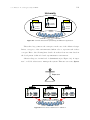
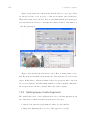
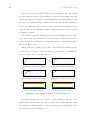
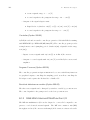
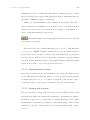
The server side applications are running on a computer located close to the physical system equipped with the needed hardware/software interfaces to access sensors and actuators from the real plant. Additionaly, the server should implement
the interfaces, protocols, and programming modules needed to connect with the
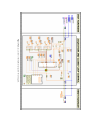
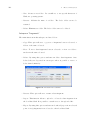
outside world, i.e., with the clients (see Figure 2.3).
Lab-Server
**Exchange data module
client 1
Access management module
Modules
Remote visualization module
Firewall
Internet
Remote audio module
Audio streaming
Video streaming
client 2
Modules
- Users’ data
- Resources booking
- Experiments
Bookings
data base
Instrumentation
Didactical set-up
Figure 2.3: Server side implementation requirements.
22
2
Environment Global Architecture
Although there are a high number of hardware-software tools that can be
used, for the purpose of the present dissertation we used LabVIEW from National
Instruments for the implementation phase (see next chapter). From a software
design point of view, the server is composed of a set of modules (some of them
optional) described below:
− A data exchange module: This software remains in a listening state waiting
for remote connections from users. It receives commands and queries from
clients and makes them effective over the physical system. Responses are
retrieved from the real plant through the instrumentation hardware and, finally, are sent back to the client. The link between the server and clients is
established via Internet and therefore, the TCP/IP protocol suite becomes
the backbone for the information exchange.
This module, which is labelled with (**) in Figure 2.3, is of a paramount
importance as it is in charge of implementing the listening server that is always waiting for remote connections from clients. Furthermore, the module
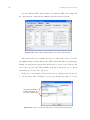
acts as a gateway and input filter to the system.
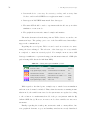
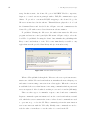
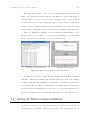
− An access management module: This software module contains all the information related to users, timeslot bookings, and other parametrizable
information. A database manager is used to handle the users’ reservations
and physical resources. Each register in this database corresponds to a
booking scheduled for a specific time and date.
− An instrumentation module: This module incorporates all the hardware
needed to connect the physical system with the server: amplifiers, power
modules, data acquisition cards (DAQ), signal conditioning, etc.
− A remote visualization module: This module allows the users to examine
what is happening with the physical system during its remote manipulation
from a client. In order to provide this feature video cameras are used. The
system must be able to transmit a sense of realism in order to encourage
its usage and increase motivation whilst completing tasks.
2.2 A systematic two-layer approach
23
− An audio feedback module: This module is optional. It would allow to
further increase the sense of realism. For example, in a level control remotelab we could transmit the ambient sound that is produced by manipulating
pumps or just by listening to the water filling the tank.
Each module in the server has its counterpart in the client side. For example,
to read the video streaming captured by the server, the client application must
implement a new module that allows to communicate and decode the data retrieved from the remote site and then render it in the interface.
Although it is not possible to detail all of the design options available, these
cover a big part of the characteristics that an experimentation environment should
fulfill to satisfy pedagogical and learning requirements in practical engineering activities. More details can be found in (Sánchez 2000).
2.2.2
Layer 2: The e-learning layer
The previous section presented the main features to take into account when
analysing, designing, and building of the experimentation layer. Also, a second
key aspect that should be addressed is the development and/or use of a web-based
learning management system (LMS)1 to support the student’s learning process.
This platform should organize user access to the experimentation modules available and, to allow for students/teachers to interact and collaborate with each
other. The implementation phase would require the following:
− Simplifying the organization of user groups.
− Offering notification services by email, instant messaging, news, etc.
− Providing all the necessary theoretical documentation such as practical
guides, task protocol, instruction’s manuals and any other information
needed to perform a remote experimentation session.
1
A learning management system (LMS) is a software application designed for the administration, documentation, tracking, and reporting of training programs, classroom and online events,
e-learning programs, and training content.
24
2
Environment Global Architecture
− Guaranteeing a sequence of activities that students must carry out during
an experimental session. Tasks can be of two types: 1) tasks in simulation
mode and 2) tasks in remote mode. The former are the tasks that students
must carry out prior to performing the experiments in the real plant. This
should be done with a graphical user interface allowing students to work
in a simulation mode environment, the objective being to get an adequate
previous insight about the process involved. Students would then reduce
time spent on activities if using the real plant. Remote access should not
be allowed if the student has not satisfactorily completed previous tasks set
in simulation mode. Should the student’s work be evaluated positively by
the teaching staff, access in remote mode would then be granted.
− Managing students and the assessment of their work as well as the uploading
of reports and their tracking.
− Including an automatic booking system to schedule access to the laboratory’s physical resources.
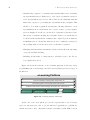
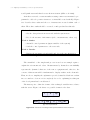
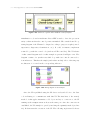
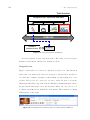
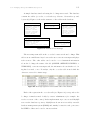
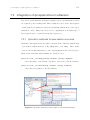
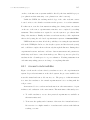
Figure 2.4 shows the structure of an e-learning platform (e-Learning layer )
for publishing remote and virtual control laboratories (Experimentation layer ) on
the Internet.
e-Learning Platform
On-line documentation: practical guides, tasks protocol, etc.
Time booking system to use the physical resources in the lab.
Colaborative web services: instant messaging, discussing forums, shared data, etc.
Applet Java: lab 1
Applet Java: lab 2
Applet Java: lab 3
Applet Java: lab N
Figure 2.4: e-learning platform architecture.
At the end of the development process, the experimentation and e-learning
layers are integrated in order to get the final web application to publish the
virtual and remote labs. Integration means performing certain links between
25
2.3 Conclusions
web modules coming from both layers, for example, to save the data collected
from an experimentation Applet (experimentation layer ) into a shared web space
belonging to the e-learning layer. The data stored in this space could be retrieved
later for analysis, or even be read again from the experimental Applet.
2.3
Conclusions
Remote and virtual control labs alone do not provide all the benefits expected.
Students need to organize their work and be in contact with other users (students, teachers, tutors). This is the reason why this chapter has presented a
set of requirements and specifications to apply in order to develop a remote experimentation environment for engineering education. The approach used was
divided into two layers to provide a certain structure to the development process.
The planning of the global architecture of the system is a mandatory step
prior to starting developing a web-based experimentation environment for educational purposes. The following chapters describe how each layer is implemented
as well as the complete process used to reach the final product which is the remote experimentation environment from the Automatic Control Laboratory of the
Department of Computer Science and Automatic Control of UNED.
Part II
IMPLEMENTATION
3
The Experimentation Layer
Overview
This chapter presents an in-depth analysis of the so-called “Experimentation
Layer ” that covers the methodology used in the design and creation of web-based
control laboratories for remote experimentation.
The approach considered to create web-enabled virtual laboratories will be explained. A particular emphasis is placed on the creation of virtual-labs apply in
the teaching/learning of automatic control.
Technical considerations to take into account when adding tele-operation functions to virtual-labs are also indicated. Thus, the final approach presented hereafter considers the possibility of working both in virtual and remote mode using
the same graphical user interface in the client side.
Finally, a new approach to develop novel virtual and remote control laboratories
using Easy Java Simulations and LabVIEW is presented. This framework should
help developers in the creation of web-enabled environments oriented to remote
diagnostics, maintenance, and experimentation.
30
3.1
3
The Experimentation Layer
Development of virtual laboratories
It is well known that to create a dynamic simulation of any physical system,
developers must model (for instance, through a set of differencial equations) the
system and then solve the equations by numerical integration methods. Software
tools such as Matlab/Simulink (Matlab 2009), SysQuake (SysQuake 2009), Modelica (Modelica 2009) and others, help build virtual laboratories as they provide
predefined built-in numerical methods which can be used to solve the models.
By means of them, experts in different subjects can generate simulations with a
certain degree of complexity to be used by teachers in classrooms with the goal
of making the class more attractive and useful for their students (Kumpaty &
Haeg 2007, Guzmán et al. 2008, Urquı́a et al. 2005, Martı́n 2007). However, most
applications conceived with these software tools can only be used in local mode,
i.e., the core of the simulation resides in the same machine where it is executed
and therefore, these tools are not prepared to be distributed on-line through a
communication network such as the Internet.
The natural and intuitive way to face this problem is to look for a technology
that covers all aspects related to the use of simulations in local mode that could be
distributed on-line and take advantage of the web-based simulation technologies
available. In relation to this point, Java technology (a programming language
created by Sun Microsystems) has gained enormous popularity since its launch.
Some of the advantages of using Java are:
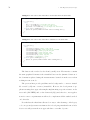
− Java is simple. Programming languages are not simple, but Java is considered a much simpler object-oriented programming language when compared to the programming language C++. Partially modeled after C++,
Java has replaced the multiple inheritance in C++ with a simple structure
called interface. The use of pointers were also eliminated.
− Java is distributed. Java is designed to simplify the distributed computing thanks to its integrated networking capabilities. Writing network
programs in Java is like sending and receiving data to/from a file.
3.1 Development of virtual laboratories
31
− Java is portable (platform independence). One of the most compelling reasons to use Java is its platform independence. Java runs on most
major hardware and software platforms, including Windows, Macintosh,
UNIX, and Linux operating systems. Java applets are supported by Javacompatible browsers. An applet is a program written in Java that can be
embedded in an HTML page. When a Java technology-enabled browser is
used to view a page that contains an applet, the applet’s code is transferred
to the system and executed by the browser’s Java Virtual Machine (JVM).
− Java is multimedia (images, sounds and animation). The sizzle of
Java is multimedia - Sounds, Images, Graphics and Video. In this growing
age of multimedia, new computers are known as “multimedia ready” with
CD-ROM drives, sound cards, 3D accelerator cards and other new special
sound or graphic technology capabilities. Multimedia demands incredible
computing power and only recently - in the past 5 years at least, affordable
computers of this kind are becoming widespread.
Although one of the most relevant features is the simplicity of the language,
creating a graphical simulation in Java is not a straightforward task. Conceiving relatively complex web-based applications requires advanced knowledge in
object-oriented programming and other features of Java (Esquembre 2005). For
this reason, the following subsection presents “Easy Java Simulations” (Ejs in
short), the software tool used to create the virtual and remote control laboratories developed in this dissertation, and the main reasons why this tool was chosen
as the development tool.
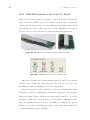
3.1.1
Easy Java Simulations as a development tool
Easy Java Simulations is a freeware, open-source tool developed in Java, specially
designed to create interactive dynamic simulations (Esquembre 2005, Christian &
Esquembre 2007, Ejs 2009a,b). Ejs was originally designed to be used by students
for interactive learning purposes under the supervision of educators with a low
programming level. However, the user needs to know the analytical model of the
32
3
The Experimentation Layer
process and the design of the graphical interface in detail. The architecture of
Ejs derives from the model-view-control (MVC) paradigm, whose philosophy is
that interactive simulations must be composed of three parts:
1. The model, which describes the process under study in terms of,
− Variables, which hold the different possible states of the process.
− Relationships among these variables (laws that govern the process),
expressed by computer algorithms.
2. The control, which defines certain actions that a user can perform on the
simulation.
3. The view 1 , which shows a graphical representation (either realistic or
schematic) of the process and its states.
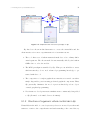
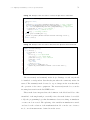
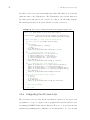
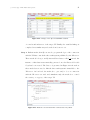
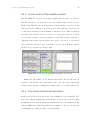
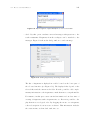
From a practical point of view, Ejs helps developers follow the MVC paradigm
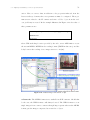
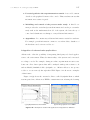
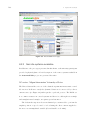
through three main sections: Introduction, Model, and View (see Figure 3.1).
The Introduction is where the developer can write any didactical or pedagogical
information related to the application (for example, instructions about how to
use the simulation, exercises to complete, questionnaires, etc). Ejs takes all this
information and transforms it into HTML pages. The Model covers all aspects
related to the definition of the model and the control of the MVC paradigm described above. And finally, the section View is where the graphical representation
of the virtual laboratory is built using the palette of predefined ready-to-use components of Ejs and where the level of interactivity is specified by modifying the
internal properties of these elements.
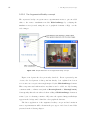
In this sense, Ejs goes one step further in the process of simplifying the building of a simulation since it eliminates the “control” element of the MVC paradigm
and fuses one part in the view and the other one in the model. Thus, applications
are created in two steps: 1) the model to simulate by using the built-in simulation
mechanism of Ejs and 2) building the view showing the model state and answers
to the interactive changes made by users.
1
From here on, the term view will be used to refer to graphical user interfaces (GUI).
33
3.1 Development of virtual laboratories
Model + Control
View + Control
+
Simulation
Figure 3.1: Simplified model-view-control paradigm in Ejs.
Ejs has been chosen in this dissertation to create the virtual-labs and the
client interfaces for remote experimentation for four main reasons:
1. The tool offers a set of built-in numerical methods to solve ordinary differential equations. The chosen method is automatically called by the built-in
ODEs editor to solve the models.
2. The MVC paradigm is assembled by Ejs. This process is hidden to users,
which means they do not need advanced programming knowledge to get
started with the tool.
3. The composition of complex graphical user interfaces is carried out with a
simple drag-and-drop actions using predefined graphical components. Thus,
Ejs practically eliminates the need of previous knowledge about objectoriented graphical programming.
4. New features to develop interactive simulations are continuously being added
to Ejs (Dormido et al. 2005b, Jara et al. 2009a).
3.1.2
Structure of a generic virtual control lab in Ejs
Virtual-labs in the field of control engineering education are used by teachers and
trainers to reinforce the comprehension and understanding of the control theory.
34
3
The Experimentation Layer
They enable students to appreciate the dynamic behaviour of a physical system
when either a control algorithm or a parameter is changed. There are some
guidelines to be considered in the design of virtual control labs with pedagogical
perspectives:
− The complexity of the application should be considered carefully since users
using the simulation (generally students from the university) will not have
the on-site support of a teacher.
− Some interactive elements rich in visual contents should be included in the
design of the view of the labs, to explain ideas, concepts, and methods
present in the automatic control theory.
− A set of practical activities to complete with the virtual-lab should be prepared. Students will then be able to follow the sequence of tasks, often with
an increasing difficulty, until reaching a complete insight concepts taught.
A simulation in Ejs will be achieved when all the information provided by
developers in the description of the model and the view is assembled. Once the
description is ready, then Ejs is enabled to generate the Java program (a standalone application or an applet) reproducing the phenomenon under study.
A general view of the simulation’s algorithm working behind the applications
created by Ejs can be seen in Figure 3.2. The code is divided into two stages of
execution: Initialization and Evolution. The first one is devoted to the declaration of variables and the initialization code needed to describe the initial state
of the system. The second one covers the algorithms that define the dynamic
behaviour of the system during its evolution. Inside the Evolution is where both
the graphical state of the system and the interactive changes from the user are
carried out. Two blocks are intended for this task. In the first one, the view
recovers the current values of the variables from the model and transforms them
into a graphical representation (model-view communication). The second block
is always waiting for user’s interactions (view-model communication). The algorithms of the Evolution are iteratively executed while simulation is playing to get
the expected result.
35
3.1 Development of virtual laboratories
Init
Declaration of variables (Variables panel)
Initialization of variables (Value column in the Variables panel)
Execution of the algorithms in the Initialization panel
Initialization
Evolution
Execution of the algorithms in the Constrains panel
Graphical representations of the results
(model-view communication)
Interaction of the user?
(view-model communication)
Yes
Execution of the
user’s action
No
Execution of the actions
in the Evolution panel
Figure 3.2: Simulation algorithm of any Ejs application.
To illustrate the ideas aforementioned, a simple virtual control lab of the
single-tank process created by Ejs is introduced hereafter. The structure followed
in the creation of this simple but very descriptive example will be extrapolated
to the development of every study case presented in Chapter 4.
A simple virtual-control-lab in Ejs: The single-tank process
As mentioned in Section 3.1.1, detailed knowledge of the underlying analytical
model of the process is a mandatory step before starting with Ejs. The creation
of the virtual-lab will therefore be addressed after the model description.
Model of the Process
a√
K
dh
=−
2gh + u
dt
A
A
Pump
h
Tank
Container
LC
Ref
Level Controller
Variables and Parameters
h: Liquid level inside the tank (m)
a: Cross-section of the outlet-hole (m2 )
A: Cross-section of the tank (m2 )
g : Gravitational acceleration (9.8 m/s2 )
u: Voltage applied to the pump (volt)
K : Pump parameter (m3 /volt)
Figure 3.3: Control of a first order system: The single-tank process.
36
3
The Experimentation Layer
Figure 3.3 shows the scheme of the single-tank process and its mathematical
model. The objective is to control the liquid level inside the tank manipulating
the pump that regulates the incoming liquid flow. The level controller, which is
labelled as LC in Figure 3.3, computes its output depending on the change of the
liquid level inside the tank or/and the tracking reference.
The system “tank + pump” can be seen as two sub-systems connected in
cascade so that a simple PI control could be applied to reach the control objective.
The closed-loop control scheme is appreciated in Figure 3.4.
h ref
Controller
A,a,g
K
K p, T i
u
Pump
q in
Tank
q
out
h
Figure 3.4: Closed-loop control in the single-tank process.
The continuous PI controller applied to the system has the form:
u(t) = P (t) + I(t) = Kp e(t) +
t
Kp
∫ e(τ ) dτ
Ti 0
e(t) = h(t) − href (t)
(3.1)
(3.2)
For simulation with Ejs, the discrete counterpart of the continuous PI controller will be used. Thus, the PI controller obtained from the discretization of
the continuous model is as follows:
P (t) = Kp (href (t) − h(t))
I(t) = I(t − ∆t) +
Kp h
(href (t − ∆t) − h(t − ∆t))
Ti
u(t) = P (t) + I(t)
(3.3)
(3.4)
(3.5)
The discrete controller includes a new variable ∆t that represents the simulation step. This simulation step is chosen according to the dynamics of the process
to satisfy the Shannon sampling theorem (Oppenheim et al. 1996).
37
3.1 Development of virtual laboratories
The building of the virtual-lab in Ejs implies the definition of both the Model
and the View. Figure 3.5 provides some snapshots of the Ejs windows to describe
the model of the single-tank process virtual-lab.
(a) Introduction.
(b) Variables of the tank.
(c) Variables of the PI control.
(d) Dynamics of the process (ODE).
(e) Controller.
(f) The ODE as a custom method.
Figure 3.5: Defining the MODEL of the single-tank process.
In Figure 3.5(a) a brief description of the simulation and complementary information about the system can be included. Ejs takes this information and
uses it to create HTML pages with the description on the Java applet generated.
Figures 3.5(b) and 3.5(c) show, respectively, the declaration of the physical variables associated to the tank and the variables related to the PI controller. The
evolution of the system is defined in Figures 3.5(d) and 3.5(e) in two pages. The
first one is used to specify the mathematical model (Figure 3.3) and the second
one is used to write the Java code needed to get the PI control action and the
switching between manual and automatic control modes. The right side of the
ODE is defined by a custom method as shown in Figure 3.5(f).
38
3
The Experimentation Layer
Once the model has been defined, the composition of the view is carried out.
Figures 3.6(a) and 3.6(b) show both the tree-like structure of the view in Ejs and
the final look as a standalone application of the single-tank virtual-lab.
(a) View in Ejs.
(b) The final standalone application.
Figure 3.6: Defining the VIEW of the single-tank process.
Furthermore, the same simulation running as a Java applet embedded in a
HTML page can be seen in Figure 3.7. In this sense, the advantages of using Ejs
are obvious since the tool allows the on-line execution of virtual-labs through any
Java-enabled browser.
Figure 3.7: Publishing the virtual-lab of the single-tank process as an applet.
3.2 Adapting virtual-labs for remote experimentation
3.2
39
Adapting virtual-labs for remote experimentation
Virtual laboratories alone do not cover all the benefits of hands-on traditional
laboratories where students can use real equipment. Moreover, it is also a fact
that virtual-labs using only simulated systems can not replace working with real
processes in a conventional laboratory. This means it is fundamental that virtuallabs possess tele-operation functions since the acquisition of experimental skills
using real processes is of paramount importance for students of physical sciences
and engineering (Garcia et al. 2008). At the same time, the design and implementation of a remote laboratory are more challenging due to safety and fault
tolerant aspects which must be taken into account in its development (Casini
et al. 2004).
The following sections show how the development of web-enabled control labs
for remote experimentation has been addressed. A brief review of some concepts
and technical considerations is offered before discussing the solutions adopted in
this work.
3.2.1
Background
Carrying out the remote operation of any physical device is challenging if we
take into account the amount of technical aspects that must be solved. Technical
issues such as performance, interaction level, visual feedback, real-time control,
user’s perception, safety and fault tolerance, etc. are, in most cases, research
topics by themselves (Salzmann & Gillet 2002).
In general, remote experimentation over real equipment through the Internet
implies being aware of the current state of a distant system, to change the value
of any input parameter of the remote system, and to perceive the effect of this
change with a minimum transmission delay.
A client-server approach is commonly used to provide this functionality to
virtual-labs (Callaghan et al. 2006, Zutin et al. 2008, Sánchez 2000, Salzmann
et al. 2000). In particular, when a student is conducting an experiment in a
40
3
The Experimentation Layer
virtual manner, s/he works with an mathematical model of a process while in a
remote working session relies on access to a real resource through the Internet by
means of a server computer acting like a gateway.
Looking at Figure 3.8 we can appreciate what happens when a client application keeps a connection with a remote server to control a target device. The
server-side sends in a continuous flow, the information blocks s(k) representating
the current state of the plant, and it receives information blocks c(k) containing
changes carried out by a remote user in some of the system input parameters.
On the other hand, the client-side receives the state of the system sent by the
server (contained in s(k) blocks) and, at the same time, keeps waiting for some
user’s interaction in order to report this change to the server-side by means of
new information blocks c(k).
ck
SERVER
sk
s3
s2
user’s interaction (actions)
s1
Data flow across the Internet
ck
user’s perception (states)
sk
s3
s2
s1
CLIENT
Figure 3.8: Stream of information between client and server.
Different kinds of data streams can be exchanged between client and server
(see Figure 3.9). Usually, the block s(k) is composed of measurements that represent the current state of the system (a few bytes) and video images (kilobytes) to
provide visual feedback to the remote user. Here, it is important underline that
inclusion of visual feedback is fundamental in the remote handling of a system
because enhances students’ motivation, their safety and the positive feeling they
may experience when conducting remote experimetal sessions.
On the other hand, block c(k) contains the control parameters susceptible to
be modified by distant users. The choice of these parameters should be made
in accordance with the objectives of the laboratory and the kind of experiments
to run. Additionally, any other kind of information could also be transmitted in
41
3.2 Adapting virtual-labs for remote experimentation
X = custom header
Y = measurements
Z = video images
Z
Y
X = custom header
Y = control parameters
X
s(k) block
(a) State block.
X
Y
c(k) block
(b) Control block.
Figure 3.9: Structure of exchanged data packets between client and server.
order to achieve any other specific objectives. An exhaustive study about how to
modify the size of s(k) packets (changing the compression factor of video images)
to provide a certain level of quality of service2 in the network communication is
available in (Salzmann 2005).
To summarize, in the field of remote experimentation over the Internet the
true challenge is to ensure optimal user’s perception of the remote equipment when
any user’s interaction is carried out. Communication between client and server
commonly relies on Internet protocols to transport data blocks. In this context,
custom-made solutions must be addressed due to the fact that the Internet is a
non-deterministic best effort network (Salzmann et al. 2000).
The following section provides some “key issues” on communication protocols
used in the experimental applications developed along this work and how they
have been applied seeking the best Internet practices.
3.2.1.1 Communication protocols
As described above, data packets travelling across a communication network allow a source host to reach a destination host. The data transportation is carried
out using network protocols. Network protocols define rules and conventions to
enable communication among network devices. That includes the mechanisms
used to identify devices and connect them to each other, as well as formatting
2
Quality of service (QoS in short) refers to the ability of a network to provide better service
to a traffic network selected over various technologies and techniques. Elements of network performance within the scope of QoS often include availability (uptime), bandwidth (throughput),
latency (delay), and error rate.
42
3
The Experimentation Layer
Client
Server
Application
Application
c(k)
s(k)
s(k)
c(k)
Transport
Transport
Router
Router
Internet
Internet
Internet
Internet
Link
Link
Link
Link
ethernet
WAN
ethernet
Figure 3.10: Stack connections of the Internet Protocol Suite.
rules that specify how data are packaged into messages. In the particular case
of remote experimentation, Internet Protocol Suite is suited to encapsulate and
deliver data between client and server using either the TCP (Transmission Control Protocol) or the UDP (User Datagram Protocol) protocol as transportation
mechanism.
A communication scheme between two computers based on the Internet Suite
Protocols is shown in Figure 3.10, which represents a typical scenario in remote
experimentation over the Internet: a client application receiving information from
a server application (s(k) blocks) and sending data to it (c(k) blocks) through the
Internet. The dialogue between both hosts can be described as an abstraction in
layers of the path followed by data from the source to the destination. The data
are first generated at the application level and then passed down to the underling
layers. Throughout this transit, the data are wrapped with the functionality provided by each layer through a new set of protocols and definitions. The number
of layers depends on the network device and its functionality. For instance, in
Figure 3.10, routers are represented just by two layers, Link and Internet. Effectively, routers only need the Link layer to connect physically to other equipments
and the Internet layer to provide packet routing capabilities.
The IP suite is well-known to most of the researcher community and therefore,
no additional information will be introduced here. More information about IP
Suite can be found in (Dostálek & Kabelová 2006).
43
3.2 Adapting virtual-labs for remote experimentation
3.2.1.2 TCP or UDP as data transportation mechanism
User applications only see a transmission channel through the network Application Programming Interface APIs (Salzmann 2005). TCP and UDP APIs are
available to user applications to communicate data. Figure 3.11 shows how data
are encapsulated from the moment it is generated at the application level until
leaving the host at link level. The header of a packet depends on the protocol
used: TCP or UDP.
TCP is a connection-oriented service with transmission control, i.e., the destination confirms the data received and it can request a retransmission of any lost
data. On the other hand, UDP is a connectionless protocol and therefore, there
is no checking whether packets have arrived safely to their destination.
User applications access
network protocols using
network APIs
IP
header
Frame
header
Data
Application
TCP/UDP TCP/UDP
data
header
Transport
IP data
Internet
Frame data
Frame
footer
Link
Figure 3.11: Encapsulation of data descending through the protocol stack.
From a remote experimentation point of view, we have to remember that the
behaviour of the Internet is not predictable (since we have many connections
occurring at the same time) and, therefore, transmission delays may occur along
the transmission path. In this sense, UDP protocol is more suitable than TCP
because it does not need the mechanisms used by TCP to establish and maintain
connection with peers. Thus, UDP is a more lightweight protocol that does not
suffer the drawbacks of TCP networks so much. Nevertheless, in this dissertation
TCP-based solutions have been addressed, the reason being that didactical-setups
used do not have dynamics that require UDP-based solutions. Furthermore, TCP
is widely accepted in most communication networks and less filters in firewalls
44
3
The Experimentation Layer
are found for this protocol. The following sections describe in detail the structure
of the terminals in a remote experimentation scheme, i.e., client and the server
applications and how they use network protocols to exchange data.
3.2.2
Building the server-side
Figure 3.9 shows the content of data blocks exchanged during a peer to peer
connection between client and server. Packets outgoing from the server contain
data representing a semantic content different according to their origin. The
generation of such information and its sending implies completing a series of
tasks in the server machine concurrently. In the particular case of remote-labs,
the three fundamental tasks to complete are:
1. The control task: It performs the real-time closed loop control of the real
plant. It produces the states of the plant represented by the measurements
in s(k) blocks (see Figure 3.9(a)). At the same time, control parameters in
c(k) blocks (see Figure 3.9(b)) are used by the control task to modify the
behaviour of the system.
2. The video task: It retrieves the video streaming captured by a camera
focusing on the real process. Video images in s(k) blocks are generated by
this task.
3. The communication task: It implements the necessary means to communicate in order to send and receive data to/from a client application. It
constitutes the s(k) blocks and sends them to the client. At the same time,
it receives the c(k) blocks to apply them to the system.
The more interesting task in the server-side corresponds to the Control task
since the acquisition of signals (reading from sensors and writing to actuators)
and the closed-loop control are carried out. Moreover, knowledge of systems theory, control and real-time must be put into practice here.
Figure 3.12 shows the standard structure of a feedback control loop. Operations performed in a feedback loop follow a standard sequence. Operations
45
3.2 Adapting virtual-labs for remote experimentation
labelled (a) and (b) in Figure 3.12 respectively represent, the measurement of the
analogue output signal from the process and its conversion into digital format.
Once the conversion has been completed (b), the value is compared to the setpoint
value (c) to obtain the error signal. With this information the control algorithm
computes the control signal (d) that is then converted to its analogue representation (e) and applied to the physical process. This sequence of operations is
known as the control task that must be carried out at a fixed time-interval called
the sampling period determined in accordance with the dynamics of the physical
process. This fixed sampling interval or cycle time defines implementation constraints when a constant sampling period is often assumed (Åström & Hägglund
2006). The notion of real-time control is based on the above implementation
constraints where computer operations rely on a deterministic time occurrence.
(c)
setpoint
sp
Control
u
algorithm
A/D
(a)
converter
(b)
D/A
(d)
converter
(e)
Physical Process
y
y
time triggered
Figure 3.12: Feedback control scheme.
The development of this type of applications in control engineering education and, especially, in virtual and remote experimentation across the Internet is
commonly achieved using LabVIEW software (Salzmann et al. 2000).
3.2.3
Using LabVIEW for remote experimentation
LabVIEW is a graphical programming language developed by National Instruments in 1986 (LabVIEW 2009a). LabVIEW was originally developed for data acquisition and instrumentation control. However, the lastest versions of LabVIEW
allow users to use it for many other purposes: process control, industrial automation, modelling and simulation, digital signal processing, remote operation,
real-time programming, etc. Programs developed with G, the graphical language
of LabVIEW, are named VI (Virtual Instruments) due to their instrumentation-
46
3
The Experimentation Layer
related origins. A VI is made up connecting multiple blocks, from the existing
libraries of blocks meant for many purposes: vision, I/O hardware, mathematical calculations, simulation, Internet protocols (Travis 2000), process control,
database access, etc. One on the main reasons that encourages the use of LabVIEW is its simplicity since users with a low knowledge of programming can
develop complex programs, impossible to write using traditional programming
languages (Blume 2007).
Because of the hard constraints in its sampling period (reading from the sensors, execution of the control code, and writing to the actuators), the execution
of the control task must take place as regularly as possible. With LabVIEW, such
regularity is achieved by using threads and DAQ board interruptions. However,
to manage a local version of the control task through the Internet implies some
changes. For example, the LabVIEW code that handles the communication with
the remote client and with the video camera that provides the visual feedback
has to be included (Leva & Donida 2008). Figure 3.13 shows a general scheme of
this idea.
LabVIEW Server
Ejs Client
Communication Task
Graphical
User
Interface
Normal Priority Loop
Video
data
Video Task
Normal Priority
Loop
Control
data
State
data
Control Task
Time-Critical
Priority Loop
Internet
Communication
methods
Decode video
data and render
Local Simulation
Figure 3.13: Distributed control architecture using LabVIEW and Ejs.
The three boxes in the server-side represent each of the tasks required. Since
the control task must keep the constraints in the cycle time, the highest execution
priority must be assigned to this block in order to guarantee its determinism. The
communication and video tasks run in parallel to the control task but in different
threads and with lower execution priorities. Finally, methods that share data
among tasks have to be performed but must take the determinism of the control
task into account.
3.2 Adapting virtual-labs for remote experimentation
47
LabVIEW is especially suitable here, since it provides simple multi-thread
programming using Timed Loop blocks. These blocks allow to the programmers
to include multiple threads in a single virtual instrument (VI), and running these
threads at different sampling periods and with different priorities.
Figure 3.15 shows a LabVIEW block diagram that corresponds to the architecture of the server-side in Figure 3.13. The three loops in the diagram run
concurrently to perform the main tasks: control, communication, and video grabbing. Figure 3.14 indicates instructions executed for each of the task.
Task 1: Control (critical time priority)
− Recover control parameters from the communication task
− Data acquisition and closed-loop control
− Transmit the system state to the communication task
Task 2: Video (normal priority)
− Get images from the camera and give them to the communication task
Task 3: Communication (normal priority)
− Receive control data from clients and write them to the control task
− Read the system state from control task and the images from video task
− Concatenate state + images and send them to the client
Figure 3.14: Concurrent tasks in the server-side.
The control task is a time-critical activity running at a sampling period of 20
[ms] with a priority greater than the other two threads. The AI One PT block
reads the analogue input signal from the sensor, its output is compared to the
setpoint input of the PID block and the result is fed into the AO One PT block
that sends the resulting value to the actuator, thus completing the control task.
The data structure composed of the setpoint value, the PID control parameters,
the command to the actuator, and other variables is known as the control vector,
and is sent from the communication task to the control task through RT FIFO 3
queues blocks (RT FIFO queues act as a fixed size queue, in other words the
writing of data to an RT FIFO does not overwrite previous elements). These
3
Real-Time FIFO queues are often used to share data among threads without breaking the
determinism of their execution.
Figure 3.15: Three loops running concurrently in the LabVIEW server.
3.2 Adapting virtual-labs for remote experimentation
49
variables are produced when users interact with the client interface. The data
array formed by the values sent to the actuator, the measurement from the sensor, the current time, and other variables are known as the state vector and is
transferred from the control task to the communication task through RT FIFO
queues blocks.
The video task is a non-time-critical activity since the loss of some video
frames is generally acceptable for the user (Vargas et al. 2008). For most applications, sending five images per second is enough to obtain an adequate visual
feedback of the remote system (Salzmann et al. 2000). Section 3.2.5 presents in
detail how the video task has been implemented.
Finally, the communication task concatenates the current measurements (state
vector) and the video frame (video vector) in a new vector. This resulting vector
is sent to the client using a Comm WRITE block. In parallel, the control vector
is received through the Comm READ block from the clients and passed to the
control task by means of RT FIFO queues. The TCP protocol is used in both implementations because it guarantees packet delivery and bandwidth adaptation,
albeit at the cost of extra transmission delays (Lim 2006, Salzmann et al. 2005).
As it was mentioned in Section 3.2.1.1, a possible alternative would be the UDP
protocol which provides a better control of the transmission delay. However, UDP
neither has a guaranteed packet delivery mechanism nor a bandwidth adaptation
mechanism, thus the designer is responsible to implement these features.
So far, the generic structure of the server-side application using LabVIEW has
been presented. The client must be able to receive the information sent by the
server and report changes in the control parameters. Steps linking a virtual-lab
with the server-side are shown hereafter.
3.2.4
Linking a virtual-lab to the server-side
Based on experience acquired throughout of this project, the following considerations are important when Ejs is used to create experimentation interfaces of
web-based laboratories and LabVIEW is chosen as the application running at the
server side:
50
3
The Experimentation Layer
1. Java methods for connecting, disconnecting, sending, and receiving data
blocks to and from LabVIEW server application must be created.
2. Data types in LabVIEW must match Java data types.
3. The same GUI should be used to experiment with the laboratory in either
simulation or remote mode.
4. The graphical user interface must be simple and intuitive.
The methods mentioned in the first point use TCP sockets to access the communication layer. The package java.io.net of the Java API is used internally to
support the communication.
Regarding the second point, Table 3.1 can be used as a reference for structuring the data exchanged. The selection of the data type for every variable
is completed to ensure its minimal payload. For example, in most cases, SGL
data type is sufficient to represent floating-point information instead of DBL (the
payload using SGL data is the half than DBL).
Table 3.1: Casting data types LabVIEW v/s Java.
LabVIEW
Data type and payload
Value
Java
Boolean (1 byte)
true or false
boolean
Long signed integer (4 bytes)
-2.147.483.648 to 2.147.483.647
int
Single-precision (4 bytes)
1.40e-45 to 3.40e+38 (+ or -)
float
Double-precision (8 bytes)
4.94e-324d to 1.79e+308d (+ or -)
double
String (1 byte per character)
simple text message
string
Byte signed integer (1 byte)
-128 to 127
byte
With regards to the third point, a simple way to switch between simulation
and remote mode must be included. Thus, when the interface is running in simulation mode, the variables associated to the system state are updated according
to the evolution of a mathematical model of the process (written with the Ejs
built-in ODE editor). However, in remote mode, these variables are true measurements.
Finally, regarding the fourth point, an interface with too many sliders, buttons, graphical elements, scopes, and auxiliary windows incorrectly distributed
51
3.2 Adapting virtual-labs for remote experimentation
would puzzle users and thus decrease their motivation (Gillet et al. 2003).
As in the server-side, concurrent tasks executing common actions must be programmed to add tele-operation features to a virtual-lab created with Ejs. Figure
3.16 describes these tasks and the set of instructions executed within each of
them. These three tasks should be executed on independent Java threads.
Task 1: Receiver
− Get the data packets from server-side with the system state
− Decode the streams of information (video, measurements, others, etc.)
Task 2: Sender
− Assemble control parameters (input variables of the system)
− Send the control parameters to the server-side
Task 3: Render
− Display the information (renderized) and detect the user interaction
Figure 3.16: Concurrent tasks in the client-side.
The virtual-lab of the single-tank process is used as an example again to
explain the aforementioned ideas. Measurements by themselves can faithfully
represent the dynamic behaviour of the remote equipment and, therefore, the
content of this stream will be fundamental to display results on the client-side.
Thus, in order to simplify the explanation provided, visual feedback is not taken
into account here. Section 3.2.5 is completely devoted to explaining how this part
of the development has been addressed.
The first step is to define the format of the exchanged variables in accordance
with the server. Figure 3.17 shows one possible format for the data.
t
qa
h
(a) system state.
m/a
qm
Kp
Ti
Td
ref
(b) control parameters.
Figure 3.17: Structure of exchanged data packets between client and server.
52
3
The Experimentation Layer
The current time (t), liquid level inside the tank (h), and the input flow to
the tank in automatic mode (qa ) constitute the states of the single-tank system
(measurements). The control vector is divided into the control mode (m/a), the
input flow to the tank in manual mode (qm ), the PID parameters (Kp , Ti and
Td ), and, finally, the setpoint value (ref ). If float data type is used to represent
every variable except the control mode (boolean), the state and control vectors
will respectively be 12 and 21 bytes.
In a second stage, Java methods should be programmed to control the connection with LabVIEW server. Such as Figure 3.18 shows, this implementation
requieres the application of the following methods: connect(), disconnect(),
sender(), and receiver().
Pump
SERVER
connect()
h
CLIENT
sender()
Tank
Signal Conditioning
receiver()
disconnect()
Container
Figure 3.18: Communication methods for remote experimentation.
Listings 3.1 and 3.2 show excerpts of the Java code for establishing and releasing a connection with a server computer. TCP sockets are used to access the
network layer. In Java, the sockets programming is done creating an object and
calling to its methods. In the Listing 3.1 code, the establishing of the connection
is carried out in line 5. To create an instance of a Socket object, the domain
name (or IP address) and the service port in the remote server are required by
the constructor. Then, in lines 6 and 7, the input and output stream buffers
are created. These buffers act as FIFO storing queues whose filling and emptying depend on possible delays in the network communication. The disconnection
from server-side is made by invoking the close() method in the socket and the
input/output stream buffers (lines 6, 7, 8 in Listing 3.2).
3.2 Adapting virtual-labs for remote experimentation
53
Listing 3.1: Excerpt of the Java code to connect the Ejs client to server side.
1
public boolean connect (){
2
3
connected = f a l s e ;
try {
javaSocket = new Socket ("onetank.dia.uned.es",2055) ; // create connection
in = new DataInputStream (javaSocket . getInputStream() ) ; // input buffer
out = new DataOutputStream(javaSocket .getOutputStream () ) ; // output buffer
i f (javaSocket != null ) { // I f connected ?
connected = true ; // connection i s ok . . .
play () ; // executing evolution
}
}catch (java . net . IOException io ) {
System. out . println ("Method startTCP: Problems connecting to host.") ;
}
return connected ;
4
5
6
7
8
9
10
11
12
13
14
15
16
17
}
Listing 3.2: Excerpt of the Java code to disconnect the Ejs client from server side.
1
public void disconnect (){
2
i f (connected ) {
i f (javaSocket != null ){
try {
in . close () ; // close input stream
out . close () ; // close output stream
javaSocket . close () ; // close connection
javaSocket = null ;
in = null ;
out = null ;
connected = f a l s e ;
}catch (java . io . IOException e){
System. out . println ("Method closeTCP: Close socket error.") ;
}
}
}
3
4
5
6
7
8
9
10
11
12
13
14
15
16
17
18
19
}
The receiver() and sender() methods (see Listings 3.3 and 3.4) should
be launched on independent Java threads just when the connect() method is
started. The sender() method is used to report changes in the view that affect
the operation of the remote equipment. The receiver() method recovers the
incoming data sent from the LabVIEW server.
These methods are integrated into the definition of the Model and View of the
virtual-lab of the single-tank process in Ejs. Once the methods have been added
to Ejs, the programming logic that discriminates between working on simulation
or remote mode is created. The updating of the variables in simulation is carried
out based on the evolution of the mathematical model or in the case of remote
mode, on real measurements obtained from the server.
54
3
The Experimentation Layer
Listing 3.3: Java code at the client side to receive data from the server side.
1
public void receiver (){
2
i f (connected ) {
try {
time = in . readFloat () ; //read time from server
level = in . readFloat () ; // read level from server
qautomatic = in . readFloat () ; // read input flow from server
}catch (java . io . IOException e) {
System. out . println ("Method receiver: Error receiving data.") ;
}
}
3
4
5
6
7
8
9
10
11
12
13
}
Listing 3.4: Java code at the client side to send data to the server side.
1
public void sender (){
2
i f (connected ) {
try {
out . writeBoolean(m/a) ; //write control mode
out . writeFloat(qmanual) ; //write input flow in manual
out . writeFloat(Kp) ; //write proportional gain
out . writeFloat(Ti) ; //write integral gain
out . writeFloat(Td) ; //write derivative gain
out . writeFloat( ref ) ; //write setpoint
out . flush () ; // flush data to client
}catch (java . io . IOException e) {
System. out . println ("Method sender: Error sending data.") ;
}
}
3
4
5
6
7
8
9
10
11
12
13
14
15
16
17
}
The data are also rendered to the client by an Ejs view. The interface contains
the same graphical elements of the virtual-lab but now the dynamic behaviour of
the elements is updated using the measurements obtained from the server when
working in remote mode.
The previous lines provide guidelines and a background to convert a virtuallab created by Ejs into a remote/virtual lab. However, the development of applications using these approaches implies implementing a specific software on the
server-side (LabVIEW) and on the client-side (Ejs) and, therefore, new applications for remote experimentation will need to implement all the tasks described
on both sides.
Nevertheless, the thesis has addressed one way to take advantage of the legacy
code concept and present a new framework for developing virtual and remote labs.
Section 3.3 will present the new approach that covers this objective.
55
3.2 Adapting virtual-labs for remote experimentation
3.2.5
Visual feedback from the remote plant
A remote visualization system is an essential element in any tele-operated environment since it allows the users to feel and be aware of the consequences of
their actions during a remote working session. As a result of this, users are more
motivated and confident in the use of the system.
In order to include this module in the construction of the Ejs view, two alternatives were tested. The first one considers the use of an IP camera with a
built-in video server dedicated to capturing images and post-publishing them as
video streaming through its network interface (see Figure 3.19, option 1) while
the second alternative considers using a conventional webcam with serial interface (RS-232 or USB) directly connected to the server computer (where the server
computer could be the same host that controls the real plant). The publishing of
the video stream is not direct in this case since the image data must be acquired
via webcam through its serial interface first and then socket techniques should
be used to send these data together to the plant state data across the network
(see Figure 3.19, option 2).
Most of the remote laboratories created during the development of the thesis project work with the first alternative suggested. It was chosen for its low
CLIENT
Remote viewer
via internet browser
Applet Java
INTERNET
network
interface
network
interface
Option 1
IP camera with built-in
video server
serial interface
LabVIEW
application
Option 2
SERVER
Didactical-setup in the lab
Figure 3.19: Visual feedback of the remote plant through video images.
56
3
The Experimentation Layer
maintenance, the fact that it is easy to use and, mainly because it is possible to
control the zoom and vision angle of the mechanism by means of HTTP requests
programmed at the client side. Figure 3.20 shows the camera SONY EVI-D31
used to display video images in the virtual and remote control laboratory of the
three-tank system presented in the following sections of this chapter. Although
most existing IP cameras in the market are all-in-one solutions, that is, camera
and video server, in this case, the hardware to capture video images (the camera
itself) is connected to an external video server able to deploy the frames through
its network interface to the users. Video server and camera are connected using
their serial ports.
Figure 3.20: Camera SONY EVI-D31 with external video server AXIS 2400.
The external video server AXIS 2400 allows to connect up to four cameras
which can be used independently. Furthermore, the AXIS video server is prepared
so as to receive incoming command from clients to make specific functions on the
camera. It allows, for example, to change the zoom view, to move the camera, to
switch between cameras connected to the server, etc. All these functions can be
performed from a remote graphical user interface by means of HTTP requests.
The second alternative to obtain visual feedback from the remote process is a
low cost option. The main drawback of this approach is that it requires a higher
programming effort since it is necessary to create a software to acquire the images
and publish them on the Internet. However, it allows for a better control of the
video streaming. For example, in (Salzmann 2005), the author works using this
option to implement algorithms capable of adapting the quality of the images
received (by modifying a compression factor) by the client according to changes
in the quality of service in the network communication.
3.2 Adapting virtual-labs for remote experimentation
57
3.2.5.1 Development of the Java library webcam.jar
In order to read the video streaming published by the video server of an IP
camera, a Java library, called webcam.jar, was developed. This API allows Java
programmers to use the classes and methods of the library to get video images
from any IP camera connected to the Internet. The software provides a first
level of interface with the camera, allowing to write high level software hiding the
low level programming details such as the structure of the received packets, the
decoding of the HTTP headers, or the sockets implementation.
The main class of the API, called Video.class, includes a constructor that
allows to create an instance of a Video object with the following input arguments:
a string indicating the URL where the camera supplies the video stream, a boolean
indicating what the reading format either (MPEG4 (true) or JPEG5 (false)) and,
finally, an integer to include a delay (in milliseconds) in the reading of the images.
A detailed description of this class and its methods is provided below:
public Video(String url, boolean isMPEG, int delay): :
When an object of this class is created, a Java thread is ready to be started.
Once launched, the set of public methods that the Video class provides can
be used to control the connection with the camera. These methods are:
public start(); :
This is the main method of a Video class. When the start() method
is invoked on a Video object previously created, the run() method of
a Java thread is executed. The run() method of Video.class opens a
socket connection to the remote IP camera and it starts the reading
of the video stream according to the chosen format.
public closeStream(); :
This method stops reading the video stream and closes the socket
4
The Moving Picture Experts Group, commonly referred to as simply MPEG, is a working
group of ISO/IEC charged with the development of video and audio encoding standards.
5
In computing, JPEG is a commonly used method of compression for photographic images.
The degree of compression can be adjusted, allowing a selectable tradeoff between storage size
and image quality. JPEG typically achieves 10 to 1 compression ratio with little perceivable loss
in the image quality.
58
3
The Experimentation Layer
objects created at low level. The run() method of the thread is over
when this method is executed.
public boolean isConnectedVideo(); :
Enquires if the link to the camera is up or down. Commonly, this
boolean indicator is used when the getImage() is invoked to get the
images.
public Image getImage(); :
The images captured from the IP camera can be obtained from the
input buffer by using this method. The method returns an object of
the java.awt.Image class. Image objects are easily displayed on Java
swing 6 components.
Summarizing, Java programmers can import this library to capture the streaming video of any IP camera connected to the network. With regards to the present
essay, the library was developed in such away that its inclusion in the development process of a new virtual and remote laboratory can be achieved with a
minimum programming effort. Following this philosophy, the library webcam.jar
was integrated into Ejs as a new view element. Then section presents this new
component and how it can be used by Ejs users.
3.2.5.2 The WebCamImage view element in Ejs
In order to simplify the use of the webcam.jar library, a new view element of
Ejs called WebCamImage was developed. The novelty of this approach lies
in that the element was implemented based on the characteristics of an existing
graphical component of Ejs, the InteractiveImage. Thus, the WebCamImage
element inherits all methods and properties of this last object and, can therefore,
be placed on an Ejs container with coordinate axis such as the DrawingPanels
or the PlottingPanels in order to render the images from the camera.
Figure 3.21 shows how to use the WebCamImage element in an Ejs appli6
Swing is a widget toolkit for Java. It is part of Sun Microsystems’ Java Foundation Classes
(JFC) - an API able to provide a graphical user interface (GUI) for Java programs. Swing was
developed to provide a more sophisticated set of GUI components than the earlier Abstract
Window Toolkit.
3.2 Adapting virtual-labs for remote experimentation
59
cation. Here, we can see that, in addition to the properties inhereted from the
InteractiveImage element, three new parameters must be configured. These parameters are related to the IP camera used since a Video object from the webcam.jar library is created. In the example illustrated in Figure 3.21, the value of
these parameters are:
URL=http://IP_ADDRESS/axis-cgi/mjpg/video.cgi
MJPEG=true
delay=20
where URL is the http location provided by the video server AXIS 2400 to access
the stream MPEG, MJPEG is the reading format (TRUE in this case), and the
delay between the reading of two images was set to 20 [ms].
Figure 3.21: WebCamImage view element on Ejs.
¯ Remarks: The MPEG format is not available in all IP cameras. Should this
be the case, the JPEG format could always be used. The JPEG format recovers
single images from a remote camera through http requests whereas the MPEG
format gets the images compressed as a raw flow of bytes.
60
3
The Experimentation Layer
3.2.5.3 The Augmented Reality concept
The augmented reality concept in remote experimentation tries to give an added
value to the remote visualization module WebCamImage by overlaying the
simulation view (created using the set of graphical elements of Ejs) over the
video images.
Figure 3.22: Simple illustration of the augmented reality concept.
Figure 3.22 depicts the idea previously described. From a practical point
of view, the development of this point has already been explained in Section
3.2.5.2, since its conception is strongly inspired by the WebCamImage element.
This component was built in such a way that it can be added onto Ejs drawing
containers with coordinate axes (such as DrawingPanels or PlottingPanels).
Consequently, this effect is achieved when adding a WebCamImage element as
a first object of a drawing container of Ejs, since the captured images will always
appear in the background, behind the other graphical elements.
The direct application of the augmented reality concept and its benefits in
remote experimentation will be shown in the prototypes of web-based control labs
presented in the following chapter.
3.3 A new approach to connect Java and LabVIEW
3.3
61
A new approach to connect Java and LabVIEW
3.3.1
Motivations
The deployment of web-based control environments is beneficial both for final
users and developers (process control engineers and teaching staff). However,
developers face the extra work required to transform an existing local system
into a web-based environment. Developers know how to manage the hardware
and the software in a local control system well, but new problems arise when
making the system accessible through the Internet. Specifically, an interactive
graphical user interface for the system must be set up such that can be deployed
through the Internet in the form of a Java applet. Java applets are the simplest
way to integrate interactive user interfaces for remote supervision into web-based
learning management systems. Examples of this use of Java are eMersion (Gillet
et al. 2003), PIDstop (Eikaas et al. 2006), and Java-based SCADA systems (Fan
et al. 2005). Let’s consider the case of a virtual instrument (VI) program created
with LabVIEW. Publishing a LabVIEW VI on the Internet is a long-familiar,
click-and-share feature of this software (Shirer 2001, Nitu et al. 2005, Adamo
et al. 2007). However, there is no simple mechanism to make the VI variables
(controls and indicators) accessible for Java applets. Making the VI and Java
communicate across the Internet requires modifying the VI’s wiring diagram to
include additional LabVIEW TCP/IP blocks. This requirement poses an important setback for developers who want to transform existing LabVIEW-based local
control systems into web-based ones.
The following sections present an alternative approach, and a very promising
one, for the quick and simple creation of web-enabled control environments which
use LabVIEW on the local side, Java applets on the remote client, and TCP/IP
as the communication channel between both elements. The solution is based on:
− A stand-alone application, called JiL (Java-internet-LabVIEW) server, which
acts as middleware to publish an existing LabVIEW VI on the Internet, and
62
3
The Experimentation Layer
− A Java library file which Java clients can use to control and access the
variables of the JiL-published VI.
The novelty of this approach is that the controls and indicators of the VI
can be accessed from the Java program by the LabVIEW developer in a fully
transparent way, that is, without introducing any modification to the original VI.
Outcomes of this research have been disseminated in (Vargas et al. 2009a).
3.3.2
Technical issues of the JiL Server middleware layer
The built-in local communication facilities of LabVIEW allow to include communication facilities at design time with almost any existing software and hardware
(via DLLs, Active X, .NET, TCP/IP, Ethernet, Bluetooth, CAN, OPC, IEEE
1394, RS232/485, GPIB, etc.) as well as with other scientific packages such as
Matlab/Simulink or Mathematica. However, once a LabVIEW VI has been developed, implementing a bidirectional data exchange with a Java applet requires
editing the existing VI wiring diagram to include new TCP/IP communication
blocks into the diagram. It also requires implementing the TCP/IP-based communication library calls in the Java client. This procedure is time-consuming
and requires both knowledge of Java and an understanding of how TCP/IP communication works. But also, maintainability and scalability of legacy code is
compromised since the author of the original code is not always available to carry
out these modifications.
Web-enabled environments for remote diagnostic, control, or experimentation
are commonly based on client-server architectures where TCP/IP links are used
to exchange data and commands between both sides. Figure 3.23 depicts the
design pattern known as command-based architecture (LabVIEW 2009b) that is
the base of the JiL approach. Command based architecture is focused on highperformance applications where both the minimization of the network traffic and
the ability to manipulate different data types using a naming convention to the
variables represent the fundamental objective. The communication protocol covers the following characteristics:
3.3 A new approach to connect Java and LabVIEW
63
− To minimize network traffic by sending data only when needed.
− To set and get parameters with different data types from the client side
through the use of variable names hiding the TCP implementation details.
− To send metadata information to ease the data packaging and parsing.
To decrease the delays caused by the communication network and make better
use the bandwidth, the exchange data between client and server is done asynchronously. This “key idea” is based on the fact that users do not interact with
the application continuously. For this reason, communication between client and
server is unidirectional in every step of evolution (the server sends the state of
the process to the client), being bidirectional only when users interact with the
graphical interface (the client sends input variables only when the user makes an
interaction over the simulation).
Figure 3.23: Command based architecture.
As Figure 3.23 shows, the server side performs three tasks: the Command
Parser, the Sender, and the Control Loop. The Command Parser receives commands from the client, interprets them, and executes actions requested. When no
request is received, the Command Parser remains in sleeping mode, leaving the
processor free for other duties. Similarly, the Sender “sends” the measurements
acquired by the Control Loop to the client side when required by a command.
Analyzing the server side of Figure 3.23, it is clear that a separation line can
be drawn between the two communication tasks (gray boxes) and the Control
Loop (red box), which is the task connected to an industrial process or didactical
64
3
The Experimentation Layer
setup. In this scenario, the Control Loop is a LabVIEW VI able to supervise,
diagnose or control actions, in principle with no TCP/IP communication capabilities. To provide a convenient TCP/IP wrapping to the Control Loop, the
JiL server is introduced in the scheme. This middleware plays the role of both
the Command Parser and Sender blocks of Figure 3.23 and communicates the
Control Loop VI with a remote Java client in an effective manner.
To publish a VI using the JiL server, the author first starts the JiL server
program and uses its control panel (the File menu of Figure 3.24) to select the
local VI to be published. Pressing the “Start” button finishes the publishing task.
Every control and indicator of the VI becomes immediately accessible to any
applet that uses the provided Java library file (see next subsection).
Figure 3.24: The JiL Server front panel.
When a VI is published through the JiL server, the server performs an automatic scan of all the VI controls and indicators, initializes the network input port,
and waits for an incoming connection from a Java applet. When the connection
is established, the server then listens for incoming commands which it parses and
serves as requested. More details about this process can be found in (JiL 2009).
There are three types of commands: request, control, and state commands.
Request commands require information about the controls and indicators available, which the server returns in the form of a list. Control commands are used
to open, run, stop, or close the VI. These commands perform the same function
as if a user interacts with the VI locally. Finally, state commands are used to
read the value of an indicator or set the value of a control in the VI.
3.3 A new approach to connect Java and LabVIEW
3.3.3
65
Details of the JiL Server implementation
The JiL server was developed in LabVIEW, making use of its VI Server feature. The VI Server is a collection of functions that allows to access objects and
functionalities of a virtual instrument programmatically (Travis 2000). Any VI
exposes properties and methods. These can be accessed through block diagram
functions. A property is a characteristic of a virtual instrument that may be
either read and/or written, depending on the property. An example of a virtual
instrument class property is Execution:State which indicates the execution state
of a VI (bad, idle, and running are possible values of this property). A method
is an action that is performed on a virtual instrument. For example, the Run VI
method is used to run programmatically a VI in the same way as pressing the
run button in the VI’s user interface manually. Figure 3.25 shows a template of
how LabVIEW Invoke Node blocks are used to execute methods and set or get
property values.
Figure 3.25: Use of two Invoke Node blocks to modify a property and invoke
a method on a virtual instrument.
Figure 3.26: Part of the JiL Server wiring diagram that obtains the list of
a VI controls and indicators using two Invoke Node blocks.
When a LabVIEW virtual instrument is published through the JiL server,
the server’s first action is a programmatic reading of all VI controls’ and indicators’ names using the method Control Value: Get All in two Invoke Nodes blocks
(see Figure 3.26). It does this by calling the control-value-get-all method
in two invoke-node blocks, one to get the indicators’ names and the other for
66
3
The Experimentation Layer
the controls’ names. Once the JIL server receives this information, it awaits an
incoming connection from a Java applet. Once the connection is established, the
server continues to listen for incoming commands from the applet.
Anytime the JIL server receives a command, it is parsed and processed according to its type. If the command is a request for the controls and indicators
available, the JIL server returns the name list (as it was extracted when the two
invoke blocks obtained it). When the user issues a control command, s/he can
start, stop, or reinitialize the VI via invoke nodes with run-VI, abort-VI, or
reinitialize-all-to-default methods. The server can receive a state command, which is either to read an indicator or to write a control. Either way, the
corresponding method performs this action in an invoke-node block. The rest of
the time, when information is not received, the JIL server is on waiting mode.
3.3.4
API Java to control LabVIEW applications
Applying Figure 3.23 to this scheme, a JiL-enabled Java client must implement
two (Sender and Receiver ) communication tasks to interact with the published
VI. The Sender task is to send control commands or state commands to set the
values of VI controls whenever the user interacts with the client’s user interface.
The Receiver task periodically reads the values of VI indicators sent from the
Sender of the JiL server. For example, in a web-enabled control application,
values sent from the Java client can be controller parameters and commands to
start/stop the feedback control loop, and the data stream received back will contain data on the state of the process (the level of a tank, the temperature in a
heat-exchanger, the angular position of a motor, etc.).
These communication tasks can be easily implemented in a Java program by
using the methods provided in a utility class called Jil.class in the package called
jil. Tables 3.2 and 3.3 list the methods provided by Jil main class.
The first method to invoke on a Jil object is the connect() method, which establishes the connection with the server. Then, openVI() is used to open a remote
VI and report the list of control and indicators of the remote VI to be exchanged.
This internal list acts as a buffer to improve the communication performance.
3.3 A new approach to connect Java and LabVIEW
67
This means that, by reporting the format of variables to exchange, both client
and server know beforehand what variables will be sent and received during connection. Thus, when run() method is invoked, a private method (called from
Receiver thread of the Jil class) reads all the values from the JiL server into the
internal list and places them in a buffer, from which the getValue() method
retrieves their values. Similarly, to modify the value of one or more VI controls,
the suitable setValue() methods must first be called to set the new values in a
buffer. This buffer is read by a private method (called from Sender thread of the
Jil class) which, when all values have been set, transmits the new values to the
JiL Server.
Table 3.2: API Java of the Jil class (methods to control the connection).
VI Control Methods of the API
Jil(String serverAddress): Constructor used to create a JiL object.
void connect(): Creates and initializes the TCP/IP connection with the JiL server.
void disconnect(): Closes the TCP link with the JiL server.
boolean openVI(String modelPath, String initCmd): Opens a VI specified by
modelPath and reports the exchange variables by initCmd.
void closeVI(): Closes a refnum associated with an openned VI.
void run(): Starts the VI. A java.io.IOException is thrown if an I/O error occurs.
void stop(): Stops the VI. A java.io.IOException is thrown if an I/O error occurs.
Table 3.3: API Java of the Jil class (setter and getter methods).
Setter and Getter Methods of the API
setValue(String name, boolean value): Sets a BOOL variable to LabVIEW.
setValue(String name, int value): Sets a I32 variable to LabVIEW.
setValue(String name, float value): Sets a SGL variable to LabVIEW.
setValue(String name, double value): Sets a DBL variable to LabVIEW.
setValue(String name, String value): Sets a STR variable to LabVIEW.
boolean getBoolean(String name): Gets the boolean value from LabVIEW.
int getInt(String name): Gets the integer value from LabVIEW.
float getFloat(String name): Gets the float value from LabVIEW.
double getDouble(String name): Gets the double value from LabVIEW.
String getString(String name): Gets the string value from LabVIEW.
Figure 3.27 summarizes the JiL Server approach within the overall infrastructure. The framework relies on the use of two software tools particularly useful to
develop the experimentation layer : LabVIEW and Ejs. The approach is based
on the creation of generic communication modules both on the client and the
server sides. On the client-side, the Java library jil.jar was created. By this API,
the TCP protocol is hidden to users and instead, simpler Java classes/methods
68
3
The Experimentation Layer
USER
(client)
BROWSER
(applet)
applet Java created by Ejs
(jil.jar must be imported into Ejs program)
TCP/IP
Internet
TCP/IP
JiL Server
Communication layer
Cmd Parser
Sender
Middleware layer
set methods
get methods
VI Server
functions
VI Server
Real Time
LabVIEW VI
Local control VI to be created
by developers (acquisition and
closed-loop control)
DAQ board
Process
Figure 3.27: Modular view of the JiL Server approach.
used to set up the connections are provided. This library can be easily integrated into Ejs programs to dialog with the server. Similarly, on the server-side,
the LabVIEW executable program JiLServer.exe operates as a middleware communication layer between the client and the process. Thus, developers are only
required to create a local control VI that performs the acquisition and closed-loop
control of the plant.
3.3.5
A very simple example of use
Now, a complete, albeit rather naive example is presented to describe the library.
Consider the flat sequence structure of a generic VI for feedback control of an
industrial process as shown in Figure 3.28.
In this structure, an initial frame, labelled “Init HW” is used for hardware
3.3 A new approach to connect Java and LabVIEW
69
Figure 3.28: Scheme of a generic VI for feedback control purposes.
initialization code and a final frame “Reset HW” is used to leave the process in
safety conditions when the control operation is finished. The central Control Loop
wiring diagram of the VI must be designed according to purposes sought (control,
supervision, diagnostics, identification, etc.). It could, for instance, implement
a timed loop with the control code (such as a PID controller). The VI scheme
of this central diagram used for this example is presented in Figure 3.29. The
diagram consists of a synchronous while loop with four controls connected to
four indicators. This has the simple (and rather useless) effect of showing any
modification of a control in the corresponding indicator.
Figure 3.29: Wiring diagram of the example.
Once the VI is published using the JiL Server as described before, the Java
code in Listing 3.5 communicates with this VI. The first lines of the init()
method of this applet instantiate a Jil object and try to connect it to the VI
running at the example.uned.es host at the 8080 port. Once the connection is
established, the VI example is opened by invoking the openVI() method (see line
11). It then starts the execution of the VI. The following try/catch block sets
70
3
The Experimentation Layer
the values of the four controls and flushes the buffer. The third block reads and
prints the value of the VI indicators. The VI must have placed in the indicators
the values previously sent for the controls, according to the VI wiring diagram.
The final try/catch block stops the VI and closes the connection.
Listing 3.5: Java code to communicate with the VI example of Figure 3.29.
1
public c l a s s SimpleJiLTest extends javax . swing . JApplet {
2
3
String initCmd = "intin(con),boolin(con),stringin(con),doublein(con),
intout(ind),boolout(ind),stringout(ind),doubleout(ind)" ;
4
5
public void i n i t () { // start connection and run the VI
6
7
8
j i l . J i l vi = new j i l . J i l ("example.uned.es" ,8080) ;
try {
vi . connect () ;
vi .open(apps/example . vi , initCmd) ;
vi . run() ;
} catch (Exception e) {
System. out . println ("Error when connecting to the VI") ;
}
try { // setting the value of the VI controls
vi . setValue("boolin(con)" , new Boolean( true) ) ;
vi . setValue("intin(con)" , new Integer (1) ) ;
vi . setValue("doublein(con)" , new Double(0.5) ) ;
vi . setValue("stringin(con)" , "Hello world") ;
} catch (Exception e) {
System. out . println ("Error when setting VI controls") ;
}
try { // reading the value of the VI indicators
System. out . println ("bool = "+ vi . getBoolean ("boolout(ind)") ) ;
System. out . println ("int = "+ vi . getInt ("intout(ind)") ) ;
System. out . println ("double = "+ vi . getDouble ("doubleout(ind)") ) ;
System. out . println ("String = "+ vi . getString("stringout(ind)") ) ;
} catch (Exception e) {
System. out . println ("Error when readingVI controls") ;
}
try { // stop the VI and close the connection
vi . stop () ;
vi . close () ;
vi . disconnect () ;
} catch (Exception e) {
System. out . println ("Error when closing the connection") ;
}
9
10
11
12
13
14
15
16
17
18
19
20
21
22
23
24
25
26
27
28
29
30
31
32
33
34
35
36
37
38
39
} // end of the i n i t method
40
41
42
} // end of class
3.3.6
Integrating the API Java in Ejs
The previous section provides all the information required by an expert Java
programmer to create a complete remote graphical user interface that accesses
an existing LabVIEW VI through the Internet. However, to non-experts in Java
graphical programming may be difficult to create this interface. To overcome this
3.3 A new approach to connect Java and LabVIEW
71
limitation, Easy Java Simulations was granted the ability to create JiL-enabled
applets using the Jil library in a transparent way.
As seen in previous sections, Ejs allows users to define the model and the
view of a simulation in a simple and efficient way. The model must provide
an algorithmic description of the industrial process, didactical setup, or physical
phenomenon under study. This includes:
a. A list indicating its state, parameters, input, and output variables together
with their initial values, and
b. Equations that describe how these variables relate to each other, evolve
with time, or change depending user interaction.
The view must provide a graphical representation of the program output and
an interface for user interaction. Ejs provides a simplified program structure,
custom model tools (such as an ODEs editor), and drag-and-drop view elements
that allow authors to work at a high-level of abstraction, thus speeding up the
creation process. Authors input the qualified information on the simulation that
only a human can provide, and the program takes care of all computer-related
aspects of creating a finished, independent Java applet or application.
When using Ejs to create the remote interface for an existing virtual instrument, there is really no need to specify a model. The behaviour of the process
is determined by the real equipment. Variables of the model are meant to help
communicate with the VI controls and indicators. The panel indicating variables
in Ejs was edited to enable authors to enter the URL of a VI published by the
JiL Server. Ejs then automatically connects with the VI and retrieves the list of
controls and indicators and then offers it to the author so that s/he can choose
which of them s/he wants to read and write by linking them to the variables
declared in the Ejs table of variables.
This process was automatized using an interesting feature of the command
based architecture. Metadata information is shared between client and server
as a previous step to the data exchange. By doing this, client and server are
informed of the exchange format beforehand, i.e., which variables will be written
72
3
The Experimentation Layer
Figure 3.30: Metadata information in LabVIEW for VI controls in Figure 3.29.
and read, and know what their data types and order are. This means, the task of
packaging and decoding one variable is simple and known by both ends (server
and client) in the first step of the communication. Figure 3.30 shows the metadata
information generated in LabVIEW as an array of clusters. Each element of the
array contains all the necessary information to describe a variable in LabVIEW.
For instance, one variable could be described by its name and its data type.
Listing 3.6: XML variables descriptor.
1
2
3
4
5
6
7
8
9
10
11
12
13
14
15
16
17
18
19
20
21
22
23
24
25
26
27
28
29
<?xml version="1.0" encoding="iso-8859-1"?>
<MetadataControls>
<Variable>
<Name>intin</Name>
<Datatype>int</Datatype>
</Variable>
<Variable>
<Name>boolin</Name>
<Datatype>boolean</Datatype>
</Variable>
<Variable>
<Name>stringin</Name>
<Datatype>string</Datatype>
</Variable>
<Variable>
<Name>doublein</Name>
<Datatype>double</Datatype>
</Variable>
<Variable>
<Name>stop</Name>
<Datatype>boolean</Datatype>
</Variable>
</MetadataControls>
The JiL server uses an XML document (see Listing 3.6) to describe and to send
the metadata information extracted from a VI to Ejs. The tags of the document
define the properties of each element of the array of clusters (variables) allowing
the possibility of adding more properties according to the requirements. To access
73
3.3 A new approach to connect Java and LabVIEW
the variables and their properties in Ejs, the JDOM7 library for Java is used to
parse the XML document and to extract the information.
Metadata information is not only useful to edit and connect variables in Ejs
but also because it enables to JiL server to send just the bytes of the chosen
variables by the developer during the definition of the model. In this way, there
is no overhead in the data sent from server to client since the JiL server already
knows what has to be sent to Ejs and how. Otherwise, getValues methods would
need to send the name of the variable required in every iteration that increases
data traffic during communication. Figure 3.31 shows the exchange of messages
between Ejs and the JiL server when setting up a connection with a VI target.
JiL Server
Ejs Client
Developer opens an External Page
in Ejs and provides the URL and
the relative path of target VI
Ejs reports the path of the target VI to JiL
JiL extracts a list of the controls
and indicators of target VI and
sends the list to Ejs into an XML file
XML
Developer connects VI variables
with Ejs variables and executes
the application
Ejs reports the variables connected to JiL
JiL recovers the connected variables,
runs VI target, sends indicators, and
waits for any change in the controls
JiL sends indicators to Ejs
JiL sends indicators to Ejs
Ejs receives indicators from JiL
Ejs receives indicators from JiL
Ejs receives indicators from JiL
and sends new controls to JiL
Ejs reports a user interaction to JiL
JiL sets controls and
sends indicators to Ejs
JiL sends indicators to Ejs
Ejs receives indicators from JiL
Ejs receives indicators from JiL
and requests to stop the VI
Ejs closes the connection
Ejs requests to stop the VI target to JiL
Ejs requests to close the VI target and the connection to JiL
JiL stops the VI target
JiL closes the VI target in a safety
way and closes the connection
Edition of simulation and execution
Continuous exchange of data
Stop target VI and close connection
Figure 3.31: Messages exchange between Ejs and JiL server.
All this flow of information between client and server is hidden to the developer
and s/he is only limited a few and simple steps. Figures 3.32 and 3.33 illustrate
how it applies to Ejs for sample VI in Figure 3.29.
7
JDOM is an open source Java-based document object model for XML that was designed
specifically for the Java platform so that it can take advantage of its language features.
74
3
The Experimentation Layer
Note the “External File” field in Figure 3.32 with the URL of the sample VI
file. The syntax is: <labview:IP_address:port>VI_relative_path.
Figure 3.32: Table of Ejs variables linked to VI controls and indicators.
The labview keyword identifies the file as a JiL-enabled remote VI. The
IP_address and port values indicate the URL at which the JiL server is listening.
Finally, the VI_relative_path value indicates the location of the VI in the JiL
server. Once provided the “External File” field, Ejs requests the set of controls
and indicators of target VI to JiL server.
In the case of each variable declared in the table, by clicking on the “Connected
to” cell, the dialog window in Figure 3.33 pops up, allowing the author to browse
Connecting the LabVIEW
indicator "int indicator" to
the "intcon" variable on Ejs
Figure 3.33: List of controls and indicators of a remote VI as offered by Ejs.
3.3 A new approach to connect Java and LabVIEW
75
the list of VI controls and indicators and select the one desired. Checking the
“block diagram” check box in this dialog enables Ejs to display the VI wiring
diagram for additional information.
Establishing this simple connection between model variables and VI controls
and indicators instructs Ejs to include the necessary Java calls to the library
jil.Jil.class (integrated in Ejs) in the generated simulation, in order to pass the
values of the variables back and forth as required by the program. Connection
to (and disconnection from) the VI is however left explicitly to be coded by the
author so as to adapt to this program’s logic. In this context, the methods from
jil.Jil.class have been encapsulated in a new reduced set of built-in methods of
Ejs that the author can use to program the logical sequence of connection with
the Jil-published VI. Table 3.4 describes these methods and their functionality.
Table 3.4: Methods in Ejs to link with a Jil published VI.
Ejs built-in methods to control the connection with JiL server
_external.connect(): Initializes the TCP/IP connection with the JiL server.
_external.disconnect(): Closes the TCP link with the JiL server.
_external.runVI(): Starts the VI.
_external.stopVI(): Stops the VI.
_external.step(): Performs the data exchange between Ejs and JiL Server.
_external.synchronize(): Updates controls when user interacts with the view.
_external.isConnected(): Returns the current status of the TCP/IP connection.
This reduced set of methods makes facilitates the connection and the exchange
of data with JiL server. For example, the _external.connect() method calls
the openVI(String modelPath, String initCmd) method from jil.Jil.class internally using the information provided by the developer when s/he introduces
the URL of the remote target VI and associates variables as shown in Figures 3.32
and 3.33. Similarly, the _external.disconnect() method calls the closeVI()
method from jil.Jil.class internally to close the VI and disconnect from the server
side. On the other hand, once the connection has been established and the VI has
been executed calling the _external.runVI() method, the _external.step()
method must be used in the “Ejs evolution” to start the data exchange. This last
method contains the sequence of get methods necessary to know about the state
of the remote VI, i.e., the value of indicators. The _external.synchronize()
76
3
The Experimentation Layer
is used to update the current value of every control in the remote VI that have
been connected to the external variables page (on an internal level it calls the
set methods). This means, the exchange data between Ejs and LabVIEW is
performed in an asynchronous way given that Ejs is receiving the state of the
process continously while a sending is produced just when user interacts with any
element of the view.
Authors can now use the Ejs model variables in the construction of their view,
either for visualization or interaction purposes, just as in any other Ejs generated
view, obtaining direct access to the VI controls and indicators. Authors need
to take into account, however, that variables connected to VI controls should be
considered as write-only, and variables connected to VI indicators as read-only
variables.
3.4
Conclusions
The methodology proposed in this chapter provides a structured framework for
new developments of on-line experimentation systems. The move from former
applications mentioned (whereby all components in the server and client were
mixed within a single program) towards a module-based architecture has allowed
to reduce the amount of effort to create new virtual and remote laboratories.
The command-based architecture is a particularly appropriate solution to organize low-level programming details to communicate embedded applications to a
remote host via networking protocols such as TCP or UDP. Furthermore, this
architecture presents a well-defined and expandable structure allowing the addition of new commands to enhance the system’s intelligence.
On the other hand, Ejs and LabVIEW, evidently have all the features needed
to enable the development of on-line experiments following a client-server approach. The following chapter presents some examples of web-based remote and
virtual control laboratories created applying the approaches described here.
4
Prototypes Developed
Overview
The various prototypes presented in this chapter summarize the concepts, implementation details, and aproximations exposed in Chapter 3.
Following the guidelines indicated for the experimentation layer, three virtual
and remote control laboratories were created. Each one was specially chosen to
satisfy certain security and stability requirements when real equipments are remotely handled.
The model-view-control paradigm is first used to design the virtual version (modelbased) of every laboratory. In this particular case, Ejs allows the creation of
powerful simulations in Java language applying this framework. Once the virtual
version of the laboratory has been obtained, the sequence of steps needed to include remote experimentation into the virtual-lab is as follows.
The main goal of this chapter is to show how to apply this methodology mentioned in previous chapter and serve as a reference guide in the development of
new on-line experimentation laboratories.
78
4.1
4
Prototypes Developed
Case studies: A short introduction
The following sections describe how three examples of virtual and remote laboratories in the scope of automatic control have been developed: the three-tank system, the heatflow system, and the DC motor. These three environments are part
of the current infrastructure of laboratories that the Department of Computer
Science and Automatic Control of the Spanish University for Distance Education
(UNED) provides to students for remote experimentation through the Internet.
This set of virtual and remote control labs have been developed using the
approach introduced in Section 3.3.6. The steps followed to build the prototypes
can be summarized as follows:
a. Designing and implementing, a Java applet based on an mathematical
model of the real process and an appropiated user interface using Ejs.
b. Creating a LabVIEW VI to control the real process in local mode.
c. Publishing the LabVIEW VI using the JiL server.
d. Modifying the applet to connect with the local VI published by the JiL
server. The applet’s user interface is also adapted so that it can visualize
either the data generated by the computer model or the data received from
the VI that controls the real equipment.
These web-based applications have been developed to explain PID control
concepts in an introductory course on automatic control. Nevertheless, these
could be modified at a later stage in order to introduce advanced control strategies
and adapt the labs to higher level courses. The framework based on the JiL server
and Ejs presents certain advantages when the communication layer is separated
from the control loop on the server-side.
First of all, a complete overview of the implementation of the three-tank
system control laboratory is provided in order to illustrate the details of the
development methodology. This approach is then replicated to describe the other
two case studies.
4.2 Prototype I: The Three-tank system
4.2
79
Prototype I: The Three-tank system
Figure 4.1 corresponds to the DTS200 three-tank system manufactured by Amira
GmbH (Amira 2009).
Figure 4.1: The DTS200 three-tank system by Amira.
The three-tank system is suggested as a benchmark system used for different
purposes. It can be used as a test system for fault detection and identification,
as well as for reconfigurable control (Heiming & Lunze 1999). It was positively
welcomed for its interesting properties in both control education and research.
The system exhibits the typical characteristics of a constrained hybrid system
(Mignone 2002) and has proven useful to serve as a test-bed for algorithms related
to state estimation, and control or identification of hybrid systems. For these
reasons, the three-tank system is used to show the results of different control
strategies and as an educational tool in teaching advanced control techniques.
4.2.1
System overview
The three-tank plant consists of three cylinders T1 , T2 , and T3 with the same
cross-section A. These cylinders are connected serially to each other by crosssection Sn pipes. Figure 4.2 shows the plant’s full structure.
The right-hand side of tank T2 has a single outflow valve (through which
Q20 flows) that has also a circular cross-section Sn . The liquid flowing out of
the system is collected in a reservoir located under the three tanks. This reser-
80
4
Prototypes Developed
Figure 4.2: The three-tank system. From left to right, tanks T1 , T2 , and
T3 are serially connected to each other by pipes.
voir supplies pumps 1 and 2 with liquid, which eventually returns to the system
(pumps 1 and 2 represent the input flows of tanks T1 and T2 ). In this closed
system, the liquid that enters the reservoir from the tanks returns to the tanks
via the pumps. However, these pumps automatically switch off when the liquid
level of T1 or T2 exceeds a given upper limit.
In addition to the outflow valve at T2 , the system has five more valves. Two
of them connect two consecutive tanks (one for the T1 to T3 connection, through
which Q13 flows, and the other for the T3 to T2 connection, corresponding to the
Q32 flow) and can be manually adjusted to close the link between them. The
other three are leak valves located at the bottom of each tank that can be used
to drain the tanks manually.
Pump flow rates correspond to process input signals; the levels of liquid in
tanks T1 and T2 represent the output signals. System users can manage all these
signals for control purposes.
The mathematical modelling of the process and the control strategies applied
to the system are analyzed in Appendix A (Section A.1). The analysis was carried out to introduce students to multivariable systems control (2x2), decentralized
controller, tunning controllers, variables interaction and stability. However, this
development is not described in the following sections since we are focusing on the
technical aspects of the building of the web-based laboratories using the approach
mentioned in the previous chapter.
4.2 Prototype I: The Three-tank system
4.2.2
81
The three-tank system’s virtual-lab in Ejs
The step by step creation of the virtual laboratory for the three-tank system is
described hereafter. The starting point implies to define the process model used
in terms of their variables, which hold the different possible states of the process,
and relationships among these variables.
Defining the “Model”
A detailed explanation of the main Ejs’s windows whereby the model is defined
is presented below. This description focuses on the Ejs sections that will be
modified later to add tele-operation capabilities to the virtual-lab.
Variables. Eight pages define the model’s variables (Common, Tanks, Pipes,
Leaks, Pumps, Status, PID Control, setLanguage). Each has a name that
identifies it according to its purpose (see Figure 4.3).
Figure 4.3: Ejs Model of the three-tank virtual-lab: Variables.
Evolution. In this section, two pages were created (Dynamics and Control).
The first one shows the differential equations’ editor of Ejs with the definition of the mathematical relationships representing the three-tank process
(see Figure 4.4(a)). The second page displays a small fragment in Java
showing the logic that governs the system during its evolution (see Fig-
82
4
Prototypes Developed
(a) ODEs.
(b) Control logic.
Figure 4.4: Ejs Model of the three-tank virtual-lab: Evolution.
ure 4.4(b)). In this case, the page shows the switching between manual or
automatic control.
Custom. This section is composed of five pages that define a set of customized
Java methods (ODEs, Interface, ControlSignal, saveFragments, and setLanguage). The first page contains the definition of methods that describe
the dynamics of the process by ordinary differential equations (see Figure
4.5). These functions are called from the page Dynamics of the section
Evolution. The second and third page define the discrete PID controller
and associated methods used to modify control parameters (Kp , Ti , and
Td ) on-the-fly. The fourth page contains methods used to save the values
4.2 Prototype I: The Three-tank system
83
Figure 4.5: Ejs Model of the three-tank virtual-lab: Custom methods.
of the main system variables in a text file during a practical session. Finally, the internationalization of the application is also completed through
the use of the Java I18N feature (Java 2009). Thus, the fifth and last page
describing the model contain methods used to switch between English and
Spanish languages.
Defining the “View”
The GUI of the three-tank system virtual-lab is created based on the set of
graphical elements provided by Ejs (see Figure 4.6). In order to keep a uniform
structure in each lab prototype, the interface is divided into four zones whereby
each area contains a set of graphical elements designed for a specific function.
Figure 4.6: Ejs View of the three-tank system virtual-lab.
84
4
Prototypes Developed
Figure 4.7 shows the applet’s main window. The Graphical view displays the
plant’s schematic representation in virtual mode. The plant’s schematic representation is meant to be as self-explanatory as possible. Students can easily visualize
the system’s components and see how the liquid levels in the tanks change according to different valve and pump parameters. The plant’s behaviour is simulated
using the software model defined in Figure 4.4(a) and Figure 4.5 based on the
equations listed in Appendix A (see Section A.1.1).
Figure 4.7: GUI of the three-tank system virtual-lab.
Students can play, pause, and reset the simulation using three push buttons
from the Control panel. They can also modify the percentage of opening of
the connecting (A13%, A32%, A2%) and draining valves (Aleak1%, Aleak2%,
Aleak3%). If the system is in manual mode, the student can control the flow supplied by the pumps with two sliders located in the lower part of the applet’s main
window (Pump1 and Pump2). Moreover, two small arrows placed on the sides of
tanks T1 and T2 allow to change the setpoints when the system is in automatic
mode. Students can modify these setpoint values interactively by dragging the
4.2 Prototype I: The Three-tank system
85
arrows up and down. Furthermore, they can also tune the control parameters for
optimal performance by checking the “PID” tab whereby a second window lets
users adjust the values of the controller parameters.
The Plotting view area displays signal scopes of the controlled and manipulated variables. It is located at the top right-hand part of the interface. The
upper scope plots the levels of the two tanks T1 and T2 (the controlled variables)
and their setpoints. The lower scope displays changes occuring in control variables, that is, the voltages applied to the pumps.
Finally, the Indicators panel located on the right lower part contains a set of
numerical indicators displaying the instantaneous value of the main variables of
the system such as the simulation time, the tanks level in millimeters, and the
setting of the pumps and setpoints.
Through a menu bar located at the top of the main window, users can switch
between manual/automatic control mode by clicking in the Control menu and
also by changing the language of the interface with the Language menu.
Steps to take in order to include remote experimentation options to the
virtual-lab are described hereafter. Section 4.2.4 specifically describes modifications made to this template (the virtual-lab) in order to add these features to
the application.
4.2.3
Local control of the three-tank system in LabVIEW
The first step in the development of the server-side components is to generate a VI
to control the real system locally. Figures 4.8 and 4.9 show the block diagram and
the front panel of the LabVIEW application created according to the structure
described in Section 3.3. In particular, the block diagram in Figure 4.8 shows
the flat sequence structure of LabVIEW that divides the execution flow of the
application into three stages:
1. Initialization of the hardware.
2. Acquisition and closed-loop control (HIL - Hardware in the Loop).
3. Reset of the hardware.
Figure 4.8: Local control of the three-tank real system - Block diagram.
Figure 4.9: Local control of the three-tank real system - Front panel.
88
4
Prototypes Developed
The first and third stages are self-explanatory. However, the intermediate
stage contains some technical issues described below. The LabVIEW application
implements a descentralized multivariable control strategy (see Section A.1.2 in
Appendix A). This kind of control strategy can be applied to systems for which
the interaction between variables is minimal and therefore, every measured variable can be controlled by means of one manipulated variable in independent
control loops. In this case, the liquid level in tank 1 (H1 ) and tank 2 (H2 ) is
regulated by manipulating pump 1 (Q1 ) and pump 2 (Q2 ), respectively. The
control algorithm in each loop is a standard PID controller (see Figure 4.10) with
set-point weighting, anti-windup mechanism, and filtering of the derivative action
(Åström & Hägglund 2006).
b
kp
beta
1
ysp
2
y
up
Proportional
e
kp
ui
Ti.s
Saturation
Integral
kp*Td.s
1
usat
ud
Td/N.s+1
Derivative
Antiwindup
kp/tt
Figure 4.10: Continuous PID controller (Simulink model).
Figure 4.11 shows the discrete version of the PID controller programmed in
LabVIEW. Figure 4.11(a) depicts the subVI developed for the local control of
the three-tank system and Figure 4.11(b) shows the internal implementation of
the algorithm programmed using a Formula Node 1 structure of LabVIEW.
A key issue to take into account when creating the local control application is
how to stop the VI in a safe way. This is a critical point since this expensive piece
of equipment will be remotely manipulated by students and, therefore, safety
actions should be designed to avoid damages in the hardware. For this reason,
actions taken should fulfill certain requirements as mentioned in (Salzmann &
Gillet 2008). Some of these requirements are:
1
The Formula Node is a text-based node available in LabVIEW to perform mathematical
operations in a block diagram with a C-like language. Formula Nodes prove useful to write
complex equations and use existing text-based code.
89
4.2 Prototype I: The Three-tank system
1. The physical equipment should be identifiable so as to define what kind of
equipment is connected.
2. The equipment should be fully controllable and diagnosticable by the local
computer.
3. For safety reasons, the full controllability of the physical equipment may
not be exposed to the outside world. Controllability also implies that it is
always possible to place the equipment in a known state.
4. Other requirements such as reliability and maintainability should also be
considered.
(a) VI for PID control algorithm.
(b) LabVIEW Formula node.
Figure 4.11: Discrete PID controller with antiwindup protection programmed in LabVIEW.
In this particular context, all the prototypes described in this chapter follow
a common structure so as to comply with these requirements. The three-tank
system disposes of a boolean variable called stop to finish the application so that
when this variable is pushed in the LabVIEW application the execution gets out
from the main while loop and the reseting code is then executed before the end
90
4
Prototypes Developed
of the application (see RESET HW sequence in Figure 4.9). The reseting code
could just consist in zeroing the pumps and, finally, reseting the hardware or any
additional code in order to move the real process to a known and safe state. The
three-tank system also has a hardware safety system that automatically zeroes
the pumps when the liquid exceeds a certain level.
Once the VI is ready to run in local mode, the application is published by the
JiL server. Developer is only required to place the main VI of the local control
application into the apps folder of the JiL server. Thus, the publication procedure
ends here and no additional work is needed.
Summarizing, the JiL server helps developers to fulfill the safety requirements
above mentioned since:
If the connection with the client is lost, the JiL server automatically looks
for a boolean variable named stop in the local control VI to finish the
application in a safe way (controllability).
Extra reliability and maintainability were gained by creating a generic communication module independent from the control task.
4.2.4
The virtual and remote version of the laboratory
In order to let the three-tank system’s virtual-lab to connect and manage the local
control VI published by the JiL server, certain programming modifications must
be made in Ejs. Much of this work has already been explained in the previous
chapter (Section 3.3.6) and therefore, the description of this case study reinforces
the correct application of this approach.
Steps taken to link the virtual Ejs application of the three-tank system to the
VI published by the JiL server are described hereafter:
Step 1. A new External Variables Page to link the Ejs and the LabVIEW
variables is created. Figure 4.12 shows how this was done for the threetank system. On the upper part, the URL <labview:62.204.199.106:
2055>threetank/threetankReal.vi points to the VI threetankReal.vi published by the JiL server. If the URL is correct then Ejs receives the list
4.2 Prototype I: The Three-tank system
91
Figure 4.12: Linkage of the Ejs and LabVIEW variables.
of controls and indicators of the target VI. Finally, the variables linkage is
completed in a similar way as described in Section 3.3.6.
Step 2. Built-in methods in Ejs are used to program the logic of the connection
with the VI that controls the three-tank system published by the JiL server.
These methods belong to an Ejs internal Java class so-called external. An
instance of this class is automatically generated once the External Variable
Page has been created. The Java code presented in Figure 4.13 shows how
these methods were used to link the three-tank system’s virtual-lab to the
JiL server. At low-level, the methods to open and/or close a connection
with the JiL server are used and, simultaneously, the methods to control
the starting or stopping of the target VI.
Figure 4.13: Method to be launched when connect button is pushed.
92
4
Prototypes Developed
In Figure 4.13, the custom method connectButton() initializes the connection with the server. When connection is established, the remote VI is
then started by calling the _external.runVI() method.
Figure 4.14 depicts the modifications to make in the Evolution pages of the
virtual-lab. In this case, an if-else instruction has been added to differentiate between simulation or remote mode. When working in remote mode
the _external.step() method is invoked to obtain the values of all indicators from the JiL server. Otherwise, the state of the process is updated
by solving the ODEs modelling the process.
Figure 4.14: The _external.step() method is called in every iteration of
the Evolution during the connection.
As described, the _external.synchronize() method is used to report any
user interaction with the GUI to the JiL server.
Figure 4.15: The _external.synchronize() method is called when user
modifies the value in pump1 manually.
4.2 Prototype I: The Three-tank system
93
Figure 4.15 shows the properties window of the slider in the control panel
associated with pump 1. The _external.synchronize() method is called
in the On Release property of the slider so that when the mouse is released
from this element, the method is triggered.
Step 3. Finally, visual feedback is included by using the WebCamImage element of Ejs. Figure 4.16 shows the tree of elements used to compose the
view of the application. The WebCamImage is placed in first position in
the hierarchy for a view with augmented reality.
Figure 4.16: The WebCamImage appears at the top of the hierarchy of
the DrawingPanel container to enrich the view with augmented reality.
The final graphical user interface of the three-tank system’s web-based laboratory can be seen in Figures 4.17 and 4.18. Figure 4.17(a) shows the GUI working
in simulation mode. We can see that it is similar to the virtual-lab developed in
Section 4.2.2, however, a few changes were made. A new button named Connect
was placed at the bottom-right corner of the control panel. By pushing this button, the user connects with the server side since the connectButton() method
(see Figure 4.13) is invoked. Figure 4.17(b) shows the GUI working in remote
mode when clicking on the Connect button. The graphical representation of the
process is replaced by video images captured from the IP camera located in the
94
4
Prototypes Developed
remote laboratory of the university while the main variables of the interface are
updated with data obtained from the JiL server.
One should highlight the fact that the tabbed panel of the interface has a
new element named “VIDEO”. This tab contains a cluster of six buttons which
allow to observe the process from different perspectives through video images. In
particular, Figure 4.18(a) shows the upper part of tank 1 that corresponds to the
perspective obtained when pressing button Top Tank1.
(a) Final GUI in simulation mode.
(b) Remote mode with video feedback.
Figure 4.17: The three-tank system virtual and remote control laboratory.
95
4.2 Prototype I: The Three-tank system
Finally, Figure 4.18(b) depicts how the augmented reality concept was included. Here, the virtual representation of each tank is kept visible overlapping
the video images of the remote process. The arrows located on the side of the
tanks 1 and 2 are also visible. Users can change the setpoint value for tanks 1
and 2 interactively by dragging and dropping these elements.
The upper menu of the graphical user interface includes an additional element
named eJournal.
(a) Example of the video options.
(b) Remote mode using augmented reality.
Figure 4.18: The virtual and remote control lab of the three-tank system.
96
4
Prototypes Developed
These options available in the menu allow users to save, for example, a snapshot of the Plotting view area as an image file (*.gif) or the evolution of the main
state variables as a binary or text file (*.dat or *.txt) in the local hard disk.
We have finished describing the first prototype of a web-based control laboratory. A brief summary of the steps to follow in order to develop it and deploy
it later in the Internet is provided hereafter. Figure 4.19 is used as a reference to
specify the most important issues to take into consideration.
Figure 4.19: Connection scheme via web browser between Ejs and LabVIEW.
The Ejs application controls the threetankReal.vi through the JiL server.
These steps can be enumerated as follows:
1. LabVIEW server-side apps (JiL server + local control VI). The
JiL server and the local VI are running in the server and waiting for client
connections. The server can be reached from any host in the Internet.
2. Ejs client-side application. A Java applet must be generated from the
standalone application created with Ejs and published by a web server.
This applet controls the threetankReal.vi through the JiL server.
3. Web server to publish the Java applet created by Ejs. A web
server should be installed in order to host the web site that provides the
Java applet embedded in an HTML page.
4. Web browser to download the Java applet from server. A web
browser is used to enable clients to have access to the web-based laboratory.
97
4.3 Prototype II: The Heatflow system
In the example of the three tank system, the web site can be accessed from
http://threetank.dia.uned.es, whereby threetank.dia.uned.es is the
domain name assigned by the DNS server that manages the root domain.
So far, we have seen in detail how to put the methodology introduced in
the previous chapter to create a web-based control lab of the three-tank system
into practice. Since these application are very specific, their implementation will
differ in each case. The four points mentioned in Section 4.1 should provide a
set of guidelines for potential developers to follow. ¯ Outcomes of this work was
published in (Duro et al. 2008, Dormido-Canto et al. 2008).
In the following section, we will see how the same mechanism is used to create
the other two lab prototypes. However, to avoid repeating the steps previously
mentioned in this case study, the explanation will exclusively describe the local
control VI and the final GUI of each laboratory.
4.3
Prototype II: The Heatflow system
The Heatflow system was developed by Quanser Consulting (see Figure 4.20). It
allows to study concepts of temperature flow control, transport lags and identification techniques (Quanser 2009).
From a practical point of view, the graphical representation of the process in
Ejs offers some interesting challenges since the temperature flow is not perceptible
Figure 4.20: The heatflow apparatus.
98
4
Prototypes Developed
to the human eye. This means that creativity in the development of the user
interface is a key issue. We will therefore see how Ejs facilitates the work involved
by using the predefined graphical elements of the view.
4.3.1
System overview
The plant consists of a duct containing the following components: a heating element and a blower located at one end of the structure and three temperature
sensors S1 , S2 , and S3 located along the duct. Power delivered to the heater
is regulated using an analog signal. The fan speed can also be controlled with
an analog signal (the fan speed is measured using a tachometer). Fast settling
platinum temperature transducers are used to measure the temperature.
We have to bear into account that temperature sensors located inside the
structure will perceive the effect of the heater according to the distance between
the energy suppliers and the sensors. Figure 4.21 shows a lateral view of the system illustrating this idea. The modelling and control of this process is addressed
in Appendix A.3 and no additional information is given here. This chapter will
only focus on how to create web-based control labs using the software tools and
approaches suggested in this dissertation.
Figure 4.21: Variables of the apparatus.
The setup of the server side applications is described hereafter. Again, this
section focuses mainly on the development of the local control VI, since issues
of communication have already been tackled in the three-tank prototype (JiL
server) and in the previous chapter.
4.3 Prototype II: The Heatflow system
4.3.2
99
Local control of the heatflow system
The LabVIEW VI developed is shown in Figures 4.22 and 4.23. A sequence
structure was used to program the local control with hardware in the loop (see
Figure 4.23). This VI controls the hardware of the thermal process based on the
structure described in Figure 3.28 (Section 3.3.5). The application was developed
so that users can switch between manual or automatic mode. When working in
automatic mode the user can choose between one of the three sensors to close the
loop. It is also possible to tune the parameters of the PID controller on-the-fly or
change the temperature setpoint in the sensor used to close the loop. As was the
case for the three-tank prototype, a resetting code is executed when the variable
labelled as stop is pushed (see Figure 4.22).
Figure 4.22: Local control of the heatflow real system - Front panel.
Making the VI available on the Internet means that only the JiL server is
required to run and move the heatflowReal.vi file to the apps folder. One should
mention that no specific communication facilities have to be included in the VI.
4.3.3
The virtual and remote laboratory
Figures 4.24 and 4.25 show the views of the simulation created with Ejs. The
first one (see Figure 4.24(a)) depicts the interface of the laboratory when working
in simulation mode, that is, using the mathematical model programmed in Ejs
with its ODEs editor. The 3D graphical representation of the process was built
by faithfully reproducing the shape of the apparatus.
Figure 4.23: Local control of the heatflow real system - Block diagram.
101
4.3 Prototype II: The Heatflow system
The tridimentional representation of the apparatus provides more realism
when working in simulation mode thus allowing students to gain a better insight
of the process. Users can interact directly with this view, for instance, by moving
the apparatus around its centroide and obtaining different perspectives of the
structure (see Figure 4.24(b)). Heater and blower have also been represented at
the end of the apparatus. The color of the heater changes and the blower turns
around its axis according to voltage applied.
(a) Final GUI in simulation mode.
(b) Another 3D perspective of the view.
Figure 4.24: The web-based laboratory of the heatflow system in virtual mode.
102
4
Prototypes Developed
Three small vertical rectangles placed along the 3D representation simulate
the sensors and the color inside the duct (3D cube covering the sensors) represents
the air temperature. A WebCamImage element displaying the output of a webcam (see Figure 4.25(a)) was also added to the view. Since the air heating process
is not visible to the human eye, the video image is enhanced with a coloured 3D
image representing the air temperature.
(a) Remote mode with video feedback.
(b) Remote mode with video and the augmented reality option.
Figure 4.25: The web-based laboratory of the heatflow system in remote mode.
4.4 Prototype III: The DC Motor
103
Video images can then be visualized in the background of the 3D representation resulting in a very pleasant augmented reality effect (see Figure 4.25(b)).
Students’ perception is increased as they can actually observe the temperature
flow effect inside the structure. ¯ The results of this study were published in
(Vargas et al. 2006a,b).
4.4
Prototype III: The DC Motor
The DC motor is one of the classical experiments in automatic control laboratories. It allows to study the dynamic behaviour with regards to the speed and
position of a motor fed by a direct current source. The DC motor is a common
actuator in control systems and requires therefore, although this is a simple and
straightforward example, special attention given its contribution in the field of
education. Figure 4.26 shows the didactical equipment used and its hardware
components. ¯ Results were published in (Vargas et al. 2008).
Figure 4.26: The Direct Current Motor didactical equipment used in the laboratory.
4.4.1
System overview
The didactical equipment is an electromechanical process intended to perform
the angular position or velocity control of a load using the direct current supplied
to the motor (see Figure 4.27).
The load is composed of an inertia (steel disk fixed to the motor’s axis) and a
viscous friction provided by a magnetic brake. The engine is fed through a unity
gain amplifier capable of delivering the power required to the motor.
104
4
Prototypes Developed
voltage to motor
potentiometer
(position)
tachometer
(speed)
reference point
positive movement direction
0º
315º
45º
270º
90º
225º
135º
180º
Figure 4.27: The DC motor scheme.
A tachometer provides voltage uw in proportion with the angular velocity of
the load. A potentiometer with a reducer device provides a voltage uθ proportional to its angular position. A similar potentiometer is also available to change
the reference yc directly in the equipment.
The modelling and control of this process is addressed in Appendix A.2 and
no additional information is given here. As with previous prototypes, this chapter pretends to further tackle the creation of web-based control laboratories using
the software tools and approaches provided in this dissertation.
4.4.2
Local control of the DC Motor
The intrinsic time constant of this mechatronic device defines a challenging problem because of the fact that is almost in the same order of magnitude as the
Internet transmission time. Again, the JiL server approach provides a lot of
help in the case of these applications by separating the server program in a
communication generic module (without real-time constraints given that communication functions are inherently non deterministic by existing delays in the
network) and the closed-loop control module (whereby real-time execution must
be guaranteed). In this case, a local control VI could be created using some of
4.4 Prototype III: The DC Motor
105
the technological alternatives that National Instruments provides to LabVIEW
users to develop applications with real-time restrictions (for example, NI-DAQ
with dedicated processor to real-time tasks whereby the local control VI can be
embedded into card itself, or any other more robust solutions).
Figures 4.28 and 4.29 show the application motorReal.vi that locally controls
the DC motor. The sampling period used in the control loop is 20 [ms] (Input
Rate of 50 [Hz] in Timing & Triggering Parameters of the Front Panel).
Figure 4.28: Local control of the DC motor real system - Front panel.
To avoid overflow in the communication channel due to the delivering of data
packets to the client, the JiL server is configured to send data every 100 [ms],
that is, the control task runs at a rate of 20 [ms] but the JiL server retrieves and
sends the client details of the state of the motor every 5 steps of evolution in
the real-time control task. Although some data are lost, this sending rate is high
enough to fluently observe the dynamic behaviour of the process in the client
interface (see Figure 4.30).
Figure 4.29: Local control of the DC motor real system - Block diagram.
107
4.4 Prototype III: The DC Motor
time
0 ms
data from control task
(states vector)
Data 1
20ms
40 ms
Data 2
Data 3
60 ms
Data 4
80ms
Data 5
100 ms
Data 6
lost data
shared memory space
JiL server
flushing data to client
Data 1
Data 6
Data n
Figure 4.30: Operations of the JiL server when sending data to a client.
The A/M & Speed/Position area of the Front Panel contains two boolean
buttons, positionControl and m/a. When pushing the first button, users can
choose between working on either position or on the speed control of the disk.
The second button allows to switch between manual or automatic control mode.
The box PID Parameters of the GUI allows to configure the value of the
controller parameters Kp , Ti and Td and the actuator saturation limits (umax
and umin).
The Setpoint & umanual options allow the users to interactively change
the setpoint value and, at the same time, modify the voltage applied to the motor
in manual mode. In the Keep Real Time & STOP area, a circular-shaped led
indicates whether real-time constraints are kept in every iteration of the loop,
and a variable named stop handles the stopping of the VI target in a controlled
way. Finally, three waveform chart components display the temporal evolution of
the system. The first one plots the position (in degrees) of the motor, the second
one shows its behaviour in speed (in degrees/sec), and the third one depicts the
control signal applied to the motor (in volts).
The following sections describe the final virtual and remote control laboratory
used by the students to carry out the experimental sessions across the Internet.
The interface created with Ejs allows for the handling of the VI through the
predefined view graphical elements of Ejs, that is, all the functionality of the VI
is replicated in the client application by Ejs.
108
4
4.4.3
Prototypes Developed
The virtual and remote laboratory
Figures 4.31 and 4.32 show the four main views of the web-based laboratory of
the DC motor created with Ejs. One can see that the position in the interface
of the graphical element is again quite similar to the previous prototypes mentioned. This means, the usability of the applications is enhanced. Students can
observe a similar structure in every laboratory thus learning time to understand
and assimilate interface options available when they move from one laboratory
prototype to another is therefore reduced.
Visualization and control options of the interface are described below:
Menu options :
Through this menu (upper part of the interface), users can choose the language of the interface (Spanish or English), the control mode (manual or
automatic), and, finally, are able to save data registers obtained during a
working session by using the eJournal options available.
Graphical representation of the DC motor :
The rotational movement of the steel disk is reproduced by a copy of this
component (a photo of the disk). This image provides the same visualization
effect when working in either simulation or remote mode.
Control panel of the laboratory :
A set of graphical components to control the dynamic behaviour of the motor is located under the process scheme. Users can choose between position
or speed control (see Figures 4.31(a) and 4.31(b)). They can also set both
the setpoint value in closed-loop control and the manual voltage applied
to the motor when working in open-loop. Three numerical fields allow to
change the parameters of the PID controller on-the-fly. Four buttons allow
the users to play, pause or reset the simulation of the process when working
in virtual mode. The latter allows connection to the real plant to work in
remote mode. Some text fields are also added in the upper and lower part
of the control panel to display connection state messages.
109
4.4 Prototype III: The DC Motor
Plotting panels :
On the right side, two signal scopes show the temporal evolution of the
main signals (speed, position, reference and manipulated variables).
Indicators panel of instantaneous values :
At the bottom-right corner of the interface a set of numerical fields display
the current value of the system variables.
(a) Simulation mode in position control.
(b) Simulation mode in speed control.
Figure 4.31: The web-based laboratory of the DC motor in virtual mode.
110
4
Prototypes Developed
Figure 4.32(a) depicts the DC Motor interface working in remote mode with
visual feedback. The steel disk is graduated in degrees to visually check the
correct position of the load. A polygon element of the Ejs graphical library is
used to enrich the visualization of the system. This polygon has the same shape
as the red sector that shows the position on the steel disk. If we look at this
element, we can see the lag between video images and the augmented view is
due to the fact that incoming data are coming from two different sources, the IP
camera and the computer connected to the real plant (see Figure 4.32(b)).
(a) Remote mode with video feedback.
(b) Remote mode using augmented reality.
Figure 4.32: The web-based laboratory of the DC motor in remote mode.
111
4.5 Conclusions
So far, we have described three real examples for which we applied the suggested methodology, step by step, in order to develop web-based laboratories
designed for pedagogical purposes. As mentioned at the beginning of the chapter, these prototypes are part of the current infrastructure of laboratories that the
Department of Computer Science and Automatic Control of the UNED provides
students for remote experimentation. For this reason, the three prototypes were
fully tested using performance and usability criteria.
4.5
Conclusions
The analysis, design, and building of three real prototypes of virtual and remote control labs to perform practical experiments through the Internet have
been described in detail. The benefits of using the JiL server approach to create web-based control labs using Java (for the client-side) and LabVIEW (for the
server-side) have been shown successfully. The developing time needed in the case
of a new remote experimentation environment using both software technologies
has been reduced. The creation of a generic communication module independent
from the control task makes the system more reliable and easy to maintain.
From a client perspective, each example is a novelty in terms of its development. The three-tank MIMO system presents several interface configuration
options in virtual mode. The heatflow system has a very pleasing visualization
effect that shows the graphic design possibilities that Ejs provides. Finally, the
DC motor system describes how to deal with the remote control of didactical
plants with fast dynamics and real-time constraints. One should highligth the
high degree of interactivity that these applications developed with Ejs provide
compared to previously recorded applications. Students can understand all the
intuitive and strategical aspects of the models suggested via simple interactions
with the interface (sliders, buttons, checkboxes, etc...) or even directly over the
view of the process itself (virtual representation of the process).
5
The e-Learning Layer
Overview
So far, the various aspects related to the building of virtual and remote experimentation labs have been analized and described through three practical examples. However, these experimental applications do not fully cover all the current
requirements of the conventional face-to-face experimental sessions.
In a conventional laboratory, students can interact with others, ask questions to
the teacher, take notes about the work carried out, save data registers of their experiments, compare and contrast results with other class mates, etc. This chapter
provides a detailed analysis of how this problem was addressed in this thesis.
The pedagogical aspects to take into account in remote experimentation are mentioned first. In this sense, a global vision of the features that a flexible learning
environment should provide to effectively support a community of practices in
a distributed scenario is presented. Finally, the approach chosen to address the
on-line learning of students in control engineering education will be described.
114
5.1
5
The e-Learning Layer
On-line learning: Pedagogical aspects
The potential of web-based experimental applications used as pedagogical support tools in control engineering education has already been described in previous
chapters. By using these tools, engineering students can be required to complete
different tasks and/or activities during experimentation sessions. However, these
activities must be carefully designed so that they avoid inherent drawbacks that
exist when carrying out distant experiments. In this particular case, students
must conduct their practical assignments without the help of an “on-site” instructor. Therefore, additional tools are required for virtual and remote control
laboratories so as to:
− Provide all the neccesary documentation to carry out a complete remote
practical session.
− Provide a common workspace where instructors and students (or students
only) can interact, synchronously or asynchronously, in a similar way than
in traditional labs.
− To give the possibility to create workgroups where users can collaborate
and interact among them such as they would do it in a face to face class.
To address this problem, complementary web-based resources should be explored for a convenient use of web-based labs.
As mentioned in the introduction of this dissertation, the flexible learning
paradigm is presented as an appropriate solution for the on-line teaching of engineering students. This paradigm can be applied taking into account the three
following perspectives:
− Pedagogical: From this perspective, flexible education means that students
are given extended access to learning resources, increased freedom to organize their learning activities, and enhanced participation, autonomy, and
collaboration.
5.1 On-line learning: Pedagogical aspects
115
− Technological: From this perspective, flexible education enables adequate
exploitation of information and communication devices as well as infraestructures, especially the Internet.
− Organizational: From this point of view, flexible education relies on renewed
study programs, regulations, as well as partnerships and collaborations with
other institutions.
These three points of view on the flexible education paradigm have already
been addressed throughout the analysis, design and development of the present
thesis. In fact, the UNED being a distance learning university, the application of
such teaching alternative modalities is the main goal for this academic institution
and therefore, big efforts are always made to pursue such objective.
Pedagogical aspects should be addressed first since the quality of teaching
must be maintained when providing remote experimentation services in an open
academic environment. As there are different learning models available (Maharg
2004), there is more than one possible approach to e-learning and e-teaching:
Student-centred learning
Blended learning
Social learning
The student-centred learning methodology aims at designing learning tasks
from the standpoint of students with a clearly defined sequence of actions instead
of a learning process that places full responsibility on the students themselves
(Kurhila et al. 2004). This learning style relies on the effective arrangements of
three different elements: show -tell-do. The results obtained of an “X” task set
to students (SHOW) could be used as an example of this learning method. The
experiment conducted will then be explained using some keywords (TELL). And
finally, a research task for students to complete by themselves (DO) will be set.
This is a common learning rule for face to face laboratory sessions. However, if
this learning method is applied in the case of virtual and remote labs, students
can benefit from flexible time and space and could even get instant feedback.
116
5
The e-Learning Layer
The blended learning methodology is understood as a combination of self-led
learning and other learning resources (live seminars or workshops), with the possibility of forming workgroups. Live seminars allow students to get a first insight
into the contents of a lesson. This will help them confirm that they understand
the subject prior to discussing it in group. This will, therefore, encourage them
to come properly prepared so as to contribute actively. In other words, all participants should feel that they are members of a group, that they are not working
in isolation and without support, especially in the case of courses involving hightech contents.
The social learning methodology provides slightly more than the blended learning method. In particular, in addition to the necessity of being part of a group, it
provides the opportunity to meet with a teacher. In fact, the presence of the role
of teacher or “tutor” enhances students’ motivation the same as in a traditional
class with a leader and an formal objective.
In (Anderson & Elloumi 2004) one can find a general model of how teacher
STUDENT
Independent study
Paced, collaborative learning
student-content
student-student
Communication
Asynchronous/
synchronous
Studentcontent
KNOWLEDGE/
CONTENT
INTERFACE
student-teacher
Contentcontent
Search
& retrieval
Tutorials
Simulations
& games
Virtual labs
e-Books
Peer, family &
professional support
teacher-content
Community of inquiry
Structured learning resources
TEACHER
OTHER TEACHERS
Figure 5.1: Interaction model illustrating the two main modes of on-line learning.
5.2 eMersion: A novel approach from EPFL
117
and student interact with one another and with the contents of a course. Figure
5.1 shows such interaction model illustrated with communication links between
the different model components.
As a summary, and in order to introduce UNED control engineering students an appropriate learning model, the concepts mentioned in the case of third
methodology were adopted. The solution relies on the use of eMersion (Gillet
& Fakas 2001, Gillet et al. 2005, Nguyen 2006), a web-based application which,
somehow, implements a social learning model focusing on the on-line teaching of
students in subjects with a high technical content. The following section presents
the advantages of this software tool in the context of remote experimentation.
5.2
eMersion: A novel approach from EPFL
5.2.1
Introduction
The implementation of the e-Learning Layer is based on eMersion, a web-based
experimentation environment created by the research group ReAct (Real-Time
Coordination and Sustainable Interaction System Group (React 2009)) from the
Automatic Control Laboratory of EPFL, Switzerland. Remembering the words
of the developers in (Gillet et al. 2003), to explain how the eMersion environment
was conceived, the authors state the following:
“Carrying out web-based experimentation is a matter of observing and
acting on a virtual model or on a real equipment using convenient
visualization and control devices. Hence, a student enrolled in such
activities can be seen as a pilot siting in the cockpit of an exploration
vehicle to complete a mission. In a web-based experimentation framework, the given mission is tipically a laboratory assignment and the
cockpit is a computer. To take advantage of this similarity, a general
cockpit metaphor has been chosen at the EPFL to design the graphical user interface (GUI) of the environment dedicated to web-based
experimentation”.
118
5
The e-Learning Layer
From a design point of view, eMersion meets the majority of requirements
for web-based experimentation environments. A complete review of the main
characteristics of collaborative hands-on activities in such learning environments
is presented in (Nguyen 2007). A summary of these essential features is provided
below:
Hands-On activities Support. Virtual and remote labs should support handson activities. Such resources are paramount in engineering curricula since
students need to have contact with mechanisms taught and materials used.
Component Integration. Additional web-based resources should be integrated
into the same experimentation environment so as to support hands-on activities. Experimentation by itself, interaction and collaboration support as
well as, complementary information for experimentation process are some
examples of these additional web-based resources.
Multi-session Experiment. The system should allow to experiment in a flexible way, i.e., students could complete tasks set at anytime and from any
location. In addition, the system should also allow several trial and error
experiments to reinforce students’ understanding.
Types of Collaboration. The system should place a greater learning responsability onto the students. Different collaboration mechanisms could help
reinforce this idea as these interaction resources would encourage collaboration between peers and tutors and allow them to become active agents.
Discretionary of Collaboration. Collaboration and interaction should not be
mandatory. The system should allow students to switch between a single
and a collaborative working mode in a transparent way.
From a handling point of view, the previous quotation describes this environment as a space in which the students can find all the means necessary to carry out
on-line laboratory assignments in a flexible learning context. The graphical user
interface of eMersion allows to surf across the experimentation environment such
5.2 eMersion: A novel approach from EPFL
119
as a pilot would do in an aircraft cockpit. Hands-on activities are conducted online using either simulators (virtual-labs) or remote connections to real laboratory
equipment (remote-labs). Typical experimental sessions are mediated by teachers and/or tutors emulating hands-on activities carried out in the face-to-face
learning modality. Furthermore, student/student interaction and collaboration is
also encouraged by means of a shared workspace where they actively create their
own contextual meaning, rather than passively acquiring knowledge structures
created by other actors in play (Nguyen et al. 2006).
5.2.2
Web technology behind eMersion
The selection of an appropriate web technology to develop web-based environments is of great importance. In fact, many alternatives are available for such a
purpose (PHP 2009, Visual.NET 2008, AJAX 2009). However, choosing which
the most convenient is not an easy task. Although this dissertation does not deal
with the low-level development of eMersion but actually just uses it, some information regarding the web technology underlying this web-based experimentation
environment is provided hereafter.
Jakarta struts framework
eMersion was built using the framework Struts used to build web applications.
Struts1 is an open source framework that helps develop web applications based on
the Model-View-Controller (MVC) design paradigm (Cavaness 2005). The Model
represents the business logic or database code, the View represents the page
design code, and the Controller represents the navigational code. Struts puts
Java servlets2 , Java Server Pages3 (JSP), custom tags, and messaging resources
together into a unified framework and saves the developer the time of coding
a complete MVC model (Nguyen 2006). Figure 5.2 shows the request/answer
mechanism of Struts. User actions are intercepted by a servlet controller that
processes the requests. If the request implies dynamic processing in the server, as
1
http://struts.apache.org
http://java.sun.com/products/servlet/reference/index.html
3
http://java.sun.com/products/jsp/
2
120
5
The e-Learning Layer
Web Container
Web browser
(Remote users)
http request
(user’s actions)
http answer
(views)
Servlet
(Controller)
Redirect
Model
DATABASE
JSP
(Views)
Figure 5.2: Struts framework. Flow of information (request/answer).
for instance, a query to a database, the servlet controller links with the model of
the application to get the result. Then, once the request has been executed, a jsp
view is generated based on the information previously obtained. Finally, the view
is sent to the client who visualizes the answer, thus closing the request/response
loop.
Struts integrates other developments making it one of the better known and
used frameworks to build web applications (Apache-Validator 2009, ApacheLogging 2009, Apache-Pool 2009, Apache-Tiles 2009).
5.2.3
eMersion abstractions and concepts
We have already mentioned that eMersion is a web application that focuses on
the teaching and learning of students in subjects with a high-tech content. It
specifically supports hands-on activities carried out with students through the
Internet in a flexible context. In this sense, the eMersion architecture involves
some abstractions and concepts which can be found in a university from an organizational point of view. The structure of the environment suggests a first global
view of the system. Figure 5.3 depicts this first level of abstraction as a starting
point of the eMersion architecture. Concepts presented can be summarized in
the following three points:
A university disposes of laboratories
Each laboratory has a professor and most likely tutors
Students attend courses taught by professors
121
5.2 eMersion: A novel approach from EPFL
University
Laboratory
Professor
Laboratory
Professor
Teacher
Assistant
Teacher
Assistant
Laboratory
Professor
Teacher
Assistant
Students
Figure 5.3: General abstractions representing the eMersion organization.
These three key points are the centerpiece in the case of the eMersion design.
In fact, every piece of the environment is built in order to represent each of these
concepts. Hence, the following lines describe how these ideas were introduced in
the development of this web-based experimentation environment.
eMersion disposes of a first level of administration (see Figure 5.4). A “super
user” or Global administrator manages the system. This user can create Spaces
Super user
Global Administrator
Space (lab)
Space (lab)
Space (lab)
Space admin
Space admin
Space admin
Professor Tutor
Students
Professors Tutors
Students
Professor Tutors
Students attending several courses
Figure 5.4: First level of abstraction in eMersion.
Students
122
5
The e-Learning Layer
which could be seen as an organizational unit of a university, as for example, a department. When the Global administrator creates a space, a Space administrator
is automatically created. The internal composition of a space would correspond
to a second level of abstraction of eMersion. A space administrator can create
Courses to which groups of teachers, tutors and/or students can be associated
(see Figure 5.5). It is important to notice that students could attend courses
coming from different spaces.
Space admin
Global Administrator
Course
Course
Course
Group of Professors
Group of Professors
Group of Professors
Group of Tutors
Group of Tutors
Group of Tutors
Group of Students
Groups of Students
Groups of Students
Figure 5.5: Second level of abstraction in eMersion.
The third and last level of abstraction corresponds to the Modules created by
a Course administrador or professor. A module can be seen as a laboratory used
for a course. Several modules (or laboratories) can be associated to a course in
a similar way as occurs in any engineering course, where one or more laboratory
sessions are carried out to explain different concepts. Figure 5.6 depicts the
ideas above mentioned. As we can see, the professor administrator of a course
can manage several modules. Each module can have one or several groups of
students aiming at completing their laboratory assignments using the graphical
user interface of eMersion, this being the last branch of the tree to configure.
123
5.2 eMersion: A novel approach from EPFL
Professor admin
Space admin
Global Administrator
Module
Module
Module
Selected group
of students
Selected group
of students
Selected group
of students
Protocol
Protocol
Protocol
Figure 5.6: Third level of abstraction in eMersion.
The organizational structure of the web-based experimentation environment
used in this dissertation to implement the e-Learning Layer has now been exposed. The following sections describe the graphical user interface of eMersion,
that is, the look and feel of the web environment and the functionality of each of
their components.
5.2.4
Functional architecture of the eMersion GUI
The eMersion GUI is composed of a set of independent web applications that make
up the entire environment. Figure 5.7 shows each component of the eMersion
GUI. Of all these modules, the eJournal is highlighted as it implements a big
part of the interaction and collaboration services provided by eMersion. A student
enters the environment via a web browser. Once authenticated, a set of pop-up
windows are automatically opened to display the entire experimentation system.
In Figure 5.7, each window represents a web-module developing a specific task
into a client web browser.
124
5
The e-Learning Layer
Web browser
Navigation bar, objectives and state
Experimentation
Console
Complementary
Information
Additional External
Applications
eJournal
Collaboration and
Interaction space
Internet
LabVIEW VI
(DAQ and Control)
JiL Server
Figure 5.7: Functional structure of eMersion.
A brief description of each component of the collaborative web-based experimentation environment “eMersion” is detailed as follows:
Navigation bar
Figure 5.8 shows the look of the web-component navigation bar. The window is
divided into four main areas: Objective, Navigation, Current Task, and Awareness. The first contains a description of the learning objectives pursued by course
modules. The second one covers a set of icons to enable the user to access the
different modules that compose the system. The third contains an indicator showing the current task carried out by the user and a link to the Access Protocol, a
document describing how to handle the environment. The fourth area contains
additional web-components.
Figure 5.8: The Navigation bar allows access to the web modules of eMersion.
5.2 eMersion: A novel approach from EPFL
125
Experimentation console
The so-called experimentation console web-component contains the applet Java
generated by Ejs following the development scheme suggested in the Experimentation Layer (Chapters 3 and 4). Students can conduct laboratory assignments as
well as in a traditional lab, that is, running control experiments using a simulation
of the target process (virtual-lab) and/or directly accessing the real laboratory
through a local network or across the Internet (remote-lab).
Figure 5.9: The experimentation console of the DC Motor experiment.
Figure 5.9 shows an example of an experimentation console. When working
in remote mode the Ejs applet connects to the real equipment located in the
laboratory through JiL server such as depicted in Figure 5.7.
Complementary information
Through this module, students have direct access to the theory and practical
contents needed to carry out an experimentation session satisfactorily. This information is available in text files in any electronic format (*.pdf or *.doc) or as
HTML web pages located anywhere on the Internet. The documentation provided
to students must be designed so that it can be followed in an easy and intuitive
126
5
The e-Learning Layer
(a) Tasks protocol.
(b) Interface manual.
(c) Practice guide.
(d) Appendix information.
Figure 5.10: HTML Documentation of the DC Motor experiment.
way. This information should be classified according to its role in the completation of these experimental activities. Figure 5.10 shows the documentation in
eMersion of the DC Motor prototype.
The prototypes developed in the previous chapter have been fully documented.
The documents have a homogeneous structure and the content has been written
bearing certain practical considerations in mind from a pedagogical point of view.
The most relevant aspects to take into account when completing tasks can be
summarized as follows:
Activities Protocol: A first document defines a set of tasks or activities
that a student should carry out in order to be evaluated effectively by the
teaching staff. This protocol is divided into two parts: PRE-Labs activities
and Labs activities. PRE-labs are based on the use of the experimentation
console in simulation mode. Thus, the teaching team is ensured that the
student has a previous knowledge of the system before working with the
real process. On the other hand, Labs tasks are based on the use of the
experimentation console in remote mode. Remote access to the system is
enabled by the teaching staff once the work in simulation mode has been
evaluated satisfactorily.
127
5.2 eMersion: A novel approach from EPFL
Practical guide for the experimentation console: A second document
describes each graphical element of the console. Thus, students can use this
information as a starter’s guide.
Modelling and control of the process under study: A third document provides theoretical and practical information about the process under
study such as the mathematical model of the system, the basic theory of
control and identification techniques or any additional information.
Appendices: It contains any additional information useful for students.
For example, general information common to several modules, datasheet of
the hardware used, reference tables, etc.
Integration of external web applications
eMersion also offers the possibility of integrating third-party web-based applications to the environment. Thus, the functionality of the system can be increased
according to needs. For example, during an on-line experimentation session, students can collect data registers that will be analyzed with specific software tools
such as Matlab/Simulink, Scilab, SysQuake, etc. eMersion allows to incorporate
toolkits to access remotely through their URL. Figure 5.11 shows two examples
of this feature.
Figure 5.11(a) shows the external toolkit so-called SysQuake-Remote which
was integrated into eMersion at EPFL to sustain interaction during the learning
(a) SysQuake-Remote from EPFL.
(b) Bookings System from UNED.
Figure 5.11: Examples of external web applications integrated into eMersion.
128
5
The e-Learning Layer
process (Gillet et al. 2005). Figure 5.11(b) depicts the automatic bookings system
developed in this dissertation to manage students’ access to the laboratory’s real
resources. The following chapter describes this external web-based component
integrated in the eMersion environment with more details.
Collaboration and interaction module: “The eJournal”
This component plays a key role in the development and deployment of eMersion
as a web-based experimentation environment. The eJournal is the module that
enhances interaction and collaborative work in eMersion. In this workspace,
students can save, retrieve, share and even, exchange documents between each
other or among workgroups. Figure 5.12 shows the eJournal GUI. The objects
susceptible to be importable, exportable, or exchangeable in the eJournal are
called Fragments. Fragments can be files of any semantic content and students
can use them to prepare their session reports.
eJournal
sub-space
Folders
sub-space
Fragments
sub-space
Figure 5.12: The eJournal module of the eMersion environment.
The eJournal GUI is composed of three sub-spaces. This division corresponds
to the functionality provided by each sub-space. A simplified description of them
is provided below:
eJournal Sub-space. It allows students to have access to the eJournal space
from other groups as long as these groups have granted them access. This
5.2 eMersion: A novel approach from EPFL
129
feature fulfills the essential characteristic of web-experimentation environments of Discretionary Collaboration seen in Section 5.2.1. Furthermore,
a trash icon serves to receive Fragments deleted by users. The Fragments
deleted can be reloaded or definitively deleted. Finally, the internationalization (using the I18N feature of Struts framework) of the application is also
included. Languages currently available are English, French, and Spanish.
Folders Sub-space. The Folders sub-space helps organize and deploy Fragments inside the eJournal. Users can create folders where they put and
classify their Fragments as they do in the hard disk of a computer. A
folder with special features named Inbox is automatically created to receive data Fragments from other web-components of the experimentation
environment. The Fragments deployed in the Fragments sub-space can be
filtered by type and creation date from two combo-box elements located in
this sub-space. A set of icons allows users to create folders, rename and/or
delete them and finally, compress the folder selected in the active folder
selector into a ZIP file.
Fragments Sub-space. The third and last sub-space of the eJournal contains a
set of useful functions to handle data Fragments. Students use the functions
Copy, Move, Delete, Rename, Import, Export, Share, Send, Assign, Finalize,
Submit and Note to manage fragments and, at the same time, interact and
collaborate with other participants of the community of practices (professors, tutors, other students). A list of Fragments is deployed as a table in
the lower part of this sub-space. Files are deployed in accordance with the
filter and the active folder used at every moment. The columns in the table
provide meta information or attributes associated to each Fragment as, for
example, Name, Author, Task, Status, Creation, and Annotation.
The eJournal web-component fulfills a key role in the introduction of the
social learning model used in this dissertation. Part of the ideas described here
can be mapped into actions and situations that occur in a presential laboratory.
130
5.3
5
The e-Learning Layer
Conclusions
This chapter has provided essential information about how to appropriately face
the education of students in a distributed learning context through the Internet.
For this purpose, the following topics have been discussed:
− The pedagogical aspects to consider when moving from a traditional laboratory context to a flexible learning model across the Internet.
− The major characteristics that a web experimentation environment should
fulfill based on the pedagogical aspects previously mentioned.
Additionaly, the solution adopted to implement a social learning model for
UNED control engineering students has been described. Some of the main conclusions of this implementation can be summarized as follows:
− A complete description of the web-based experimentation environment“eMersion” has been presented.
− Each web-component that composes the environment has been described
separately. The reason for that is that, in fact, an eMersion environment
is a set of independent web applications which covers all the most relevant
aspects of remote experimentation.
Chapter 7 will show the integration of the e-Learning Layer and the Experimentation Layer. The linking between them will be illustrated by means of a
complete remote and virtual control laboratory deployed by eMersion.
6
Access Control to
Experimentation Resources
Overview
Sometimes physical resources available in university laboratories do not meet
students’ demands. In fact, in most cases these have to form workgroups to share
the pieces of equipment available in the laboratory. However, in a flexible learning
context through the Internet, we need to organize the access to these resources
somehow. To overcome this problem, an automatic booking and authentication
system was developed.
A simple point to point authentication protocol to use laboratory resources is first
introduced. This current project was thought in such a way that its use can be
extended to a network of remote and virtual laboratories. Although this scheme
can be applied to remote-labs created using any technology, in this dissertation
we have integrated the point to point authentication protocol into the JiL server
approach explained in Chapter 3.
Finally, a description of the transition towards a booking and authentification
flexible scheme inspired in this simple authentication protocol will be provided.
The following chapter will describe how the final product (the automatic bookings
system) has been completely integrated into the eMersion environment.
132
6.1
6
Access Control to Experimentation Resources
Scheduling access to physical resources
6.1.1
Background
In the case of on-line labs that enable web access to real devices (remote workbenches), access time should be booked in advance (Ferreira & Cardoso 2005).
The idea is to grant access only to users who meet certain requirements. Users,
for example, must be enrolled on the corresponding course and to have been
positively evaluated by the teaching staff who is in charge of the course in the
simulation stage (a prerequisite to access to physical resources). For this reason,
it is necessary to include a module that allows access to authorized users only.
These systems can be of two kinds, either traditional or on demand (Sánchez
2000). The first class is of a similar nature to the one that can be found in conventional laboratory (in a presential context). Timetables are available and each
user must access the physical resource needed in the timeslot that the system
administrator has assigned her/him. In the second class, when a user wishes to
access a piece of equipment in the laboratory, s/he must book a free timeslot
using web applications provided by this service. Since certain users need more
time than others to complete their tasks, the system should be flexible enough.
However, a minimum degree of inteligence is required for the system to avoid
abuses from users who will book more timeslots than needed and guarantee a
minimum number of hours for everyone.
This piece of work will describe a first access protocol to the laboratory’s physical resources. For this purpose, a client application is authenticated against the
remote server computer directly connected to the plant and which also contains
an authorized users’ list kept in a database. Such a list is filled out manually by
an administrator (usually the teacher or a tutor with these privileges) enabling
access to students who fullfil certain requirements.
Finally, once the access protocol has been defined, the inclusion of an automatic mechanism to populate the database was explored. As a result, a full
automatic booking and authentication system was implemented.
133
6.2 A simple point-to-point authentication protocol
6.2
A simple point-to-point authentication protocol
6.2.1
User authentication
Figure 6.1 depicts the general idea of the p2p authentication scheme implemented.
The protocol considers the sending of authorization credentials from the user to
the lab-server. The server provides a simple authentication service in which
credentials are checked in the local database that contains a list of authorized
users. Then, the server returns the result of the authentication attempt to the
user and grants or denies access to the plant.
plant
user credentials
p2p authentication
authentication result
DB
Lab-Server
User
Figure 6.1: Point-to-point authentication protocol between a user and a
remote server providing authentication services.
Figure 6.2 illustrates the authentication process. From a client interface point
of view, the process suggested consists of a programming module to send a username and an encrypted password from the client to the server and obtain an
answer from the server indicating the result of the access attempt. The server
is therefore responsible for checking whether the username and password exist in
the bookings’ database and, must also verify whether the user is trying to connect
during the timeslot booked.
Although the implementation of the authentication programming modules in
the client and server side can be achieved using any type technology, the system
was developed using LabVIEW (on the server side) and Java (on the client side)
to match the process developed in previous chapters.
As we can see, the authentication process on the server-side generates some
134
6
Access Control to Experimentation Resources
Applet client
Client sends username and encrypted password to the server
Client
INTERNET
Server
Does user exist in DB?
(verification in database)
no
User does not appear
on database access list
yes
no
The user exists, but needs
to check timeslot booked
Has the timeslot been booked?
(current time is within time slot)
yes
Successful access to
the real equipment in the lab
Didactical-setup in the laboratory
Figure 6.2: Algorithm of the point-to-point authentication protocol.
various issues. The following two sections describe both the structure of the booking database and the LabVIEW program that implements the logic of checking.
The integration of this programming module into the JiL server will then be described and, finally, the authentication issues on the client side will be addressed
using Ejs.
6.2.2
A database for the booking of physical resources
A database connected to a real plant located in each server manages user access
to physical resources. These databases contain the booking registers for the respective plants. As previously mentioned in Section 6.1.1, databases are initially
filled out manually by the administrators of the laboratories. However, Section
6.3 will show an automatic mechanism used to populate them, transforming this
simple authentication protocol into a custom automatic bookings system for remote experimentation.
135
6.2 A simple point-to-point authentication protocol
A simple database aimed at hosting the bookings was created. The database
contains five tables (accesslist, accesslisthistory, labstatus, labstatushistory and,
loginresult). Figure 6.3 shows the structure of the tables in the database.
accesslist
labstatus
accesslisthistory
+id: int
+timestamp: timestamp
+username: varchar
+email: varchar
+password: varchar
+startime: datetime
+endtime: datetime
+valid: varchar
+timestamp: timestamp
+status: varchar
+id: int
+timestamp: timestamp
+username: varchar
+email: varchar
+password: varchar
+starttime: datetime
+endtime: datetime
+used: varchar
loginresult
+id: int
+timestamp: timestamp
+sessionID: varchar
+result: varchar
+loginresult: enum(’true’,’false’)
labstatushistory
+id: int
+timestamp: timestamp
+status: varchar
Figure 6.3: Database to host bookings.
The most important table is the accesslist because as it hosts bookings. This
table acts as a middleware layer between the user connection attempts and physical resources. The other tables can be used to record statistical information
about the bookings, the status of the lab (ONLINE, OFFLINE, RUNNING, or
UNKNOWN), connection attempts, and, the information about whether a booking has been used or not. Nowadays, only the accesslist table is used while the
others are reserved for future usage.
Figure 6.4: Bookings registers in the accesslist table of the database.
Each of the registers in the accesslist table (see Figure 6.4) corresponds to the
bookings of timeslots made locally by a users’ administrator (for example, the
teacher assistant of the course). In the implementation process, we used MySQL
server as the database repository. MySQL was chosen as it is a widely extended
database management system (DBMS) and, mainly, because free and open-source
LabVIEW toolkits can be used to interact with it.
136
6
6.2.3
Access Control to Experimentation Resources
LabVIEW implementation for authentication
In order to offer a wider vision of the LabVIEW implementation for authentication
purposes, Figure 6.5 shows the information flow between client and server along
the authentication process.
User
2
NETWORK
Local management
of the bookings
1
- accesslist
- accesslisthistory
- labstatus
- labstatushistory
- loginresult
3
enquiries
DB
Teacher administrator
Middleware interface
4
LabVIEW
Identity checking module
Physical resource
Lab-Server
Figure 6.5: Global vision of the first stage of the booking process.
The sequence of actions numbered in Figure 6.5 is briefly described hereafter:
1. An administrator from the lab-server creates a new entry in the database
for a student.
2. Once the new entry has been created, the student can attempt to access the
remote plant with his/her user credentials (previously sent by the teacher
administrator). These credentials are intercepted by a new LabVIEW module named Identity checking.
3. The Identity checking module verifies user credentials with the data base
and reports the result of the access attempt to the client. The client can
receive three possible answers:
− A message indicating that credentials do not exist or are wrong.
− A message indicating that credentials are valid but the user is attempting to connect out of the established timeslot.
− A message indicating that credentials and timeslot are fine.
6.2 A simple point-to-point authentication protocol
137
4. If the “ok” message received, the client application can start the data exchange with the real plant located in the laboratory. Otherwise, the client
interface will inform the user why access was denied via a warning text
message.
The built-in implementation of the LabVIEW Indentity checking module can
be seen in Figure 6.6. The LabSQL toolkit was used to enquire the database
from LabVIEW. LabSQL is a collection of open source VIs developed by Jeffrey
Travis Studios (LabSQL 2009) that use the ADO1 object collection in LabVIEW
for users to connect to almost any database, perform SQL queries, manipulate
records, etc.
Figure 6.6: LabVIEW Identity cheking module. Extract of the block diagram.
Table 6.1 presents a descriptive summary of the internal tasks carried out by
each VI of the LabVIEW Identity checking module.
Table 6.1: Description of the main VIs for the Identity checking module.
Block
1
Description
Read User and Pass
Gets username and password (encrypted in Base64) of the client from the
TCP channel.
Check User and Pass
Queries the database to verify whether username and password are valid.
Returns result together with starttime and endtime.
Check Time Slot
If username and password exist, it verifies whether the current time of the
server is between the starttime and the endtime of the booking.
Send Result to Client
Gets the authentication result message from the previous block and sends
it to the client application through the TCP channel.
Microsoft’s ActiveX Data Objects (ADO) for accessing data sources.
138
6
Access Control to Experimentation Resources
6.2.3.1 Integration into the JiL server
The LabVIEW module previously described has been integrated into the JiL
server as a new command for client to use. By adding this new feature, the JiL
server application explained in Chapter 3 looks as shown in Figures 6.7 and 6.8.
(a) Edit General Options window.
(b) Edit General Options disabled when started.
Figure 6.7: Setting up options in JiL server.
The Edit General Options window was modified to configure authentication
parameters in the JiL server. Figure 6.7(a) shows the new settings added to this
configuration zone (highligthed with a red elipse). Once the database management system (MySQL) has been installed and the tables created, a new data
source should be created through an ADO connection. With this setting, the JiL
server is able to connect to the database. A user only needs to provide the DSN
139
6.2 A simple point-to-point authentication protocol
reference (Data Source Name) and check the connection to the database pushing
the Check DB button. If the connection is successful, an indicator led labelled
Connection to DB is turned on. When the server is started, all the configuration
options are disabled (see Figure 6.7(b)).
Other two visualization windows (Authentication and Output Messages areas) can pop up from the Options menu. The table Time Slot Bookings in Figure
6.8(a) shows the new incoming bookings; the lower part of this window shows
which user is connected. Finally, Figure 6.8(b) shows a tracking report of connections, disconnections, internal messages of the server and, the absolute path
of the VI target.
(a) Bookings visualization.
(b) Status tracking (logging).
Figure 6.8: JiL server with authentication. Setting up and status visualization.
140
6
6.2.4
Access Control to Experimentation Resources
User authentication issues in Ejs
On the client side, the introduction of the authentication module in the Easy
Java Simulations interfaces meant following two steps:
1. To define a custom method that uses any encriptation mechanism in order
to provide a first security level when the password is sent across the Internet.
In this case, we used the encriptation algorithm known as base64 2 to match
the eMersion platform. Listing 6.1 shows how this algorithm is coded. The
non-encrypted password is given so as to get the encrypted version.
Listing 6.1: Java method to encrypt a string in Base64.
1
public s t a t i c String encBase64 ( String passNoEncrypted ) {
2
3
Base64Encoder encoder = new Base64Encoder (passNoEncrypted ) ;
String passEncripted = encoder . processString() ;
4
5
6
7
}
return passEncrypted;
2. To use the new Java method public int authenticate(username, passEncrypted) of the class Jil.class in the jil.jar library introduced in Section
3.3.4. When this method is invoked from a client, the Java application reports the user’s credentials to the server side, that is, the username and the
password previously encrypted as seen in Listing 6.1. The method returns
an integer value indicating the connection attempting result. If the value is
1, this means the username and password do not match with any register
in the database. If the result is 2, then this implies the username and password are recorded in the database but the user is attempting to connect
outside the timeslot. And finally, if the result is 3, user’s credentials and
timeslot are valid and the user is granted access to the remote plant.
The above logic should be programmed in the client side Java application in
order to provide this authentication service to the graphical user interface.
2
The term Base64 refers to a specific MIME content transfer encoding. It is also used as a
generic term for any similar encoding scheme that encodes binary data by treating it numerically
and translating it into a base 64 representation.
141
6.3 A flexible scheme for booking and authentication
6.3
A flexible scheme for booking and authentication
Previous sections described the authentication process that occurs when a booking is carried out locally by the administrator in the database. Now, the extension
of this approach toward a flexible scheme is presented. Based on Figure 6.5, the
teacher administrator has been replaced with an automatic bookings modality.
Figure 6.9 depicts the new scenario.
Main Server - UNED
2
Bookings
Main Server
Client applet
for bookings
User
Centralized
Bookings
DB
1
NETWORK
4
3
6
5
Java Interface
- accesslist
- accesslisthistory
- labstatus
- labstatushistory
- loginresult
7
8
LabVIEW
Identity checking module
Physical resource
DB
Middleware interface
Lab-Server : any location
Figure 6.9: A flexible scheme for bookings and authentication process.
This scheme enables students to book themselves. The basic idea consists of
filling out the reservations database automatically from the client side by means
of a web interface. The full system is composed of three new applications which
all provide this functionality. In the case of the first application, a Java applet
was developed to perform new bookings on the client-side (see Client applet for
booking in Figure 6.9). With regards to the second application, a centralized
server application also developed in Java manages reservations, synchronism, and
communications between the client applet for bookings and the Lab-Server (see
Bookings Main Server in Figure 6.9). Finally, an additional Java module located
in the Lab-Server was developed (see Java Interface in Figure 6.9). This module
informs the Bookings Main Server of the current state of the Lab-Server and
other parameters that the central server needs. For example, a new reservation
will be effectivelly made when the Lab-Server is turned-on and working perfectly.
142
6
Access Control to Experimentation Resources
On the other hand, information about the time zone of the Lab-Server in relation
to the GMT3 is also reported by this module to the central-side. This information
is paramount when a Lab-Server is located outside the Main Server time zone.
Thus, when a new booking for a Lab-Server is made, the central side server
accounts for the time zone of the Lab-Server (reported by the Java Interface) to
calculate the temporal lag between both and insert the correct timeslot in the
database.
Summarizing, the full process is divided into two stages in order to use a
physical resource of the laboratory and is described as follows:
Booking Stage: Figure 6.10 shows a state diagram of the booking process.
b
a
e
Bookings Main Server
f
c
h
Applet for bookings
d
Java Interface
g
Figure 6.10: State diagram of the booking process.
A description of the state flow during a reservation is as follows:
a. The Applet for bookings requests a new reservation (step 1 in Figure
6.9).
b. The Bookings Main Server takes the request and saves it in a local
DB (step 2 in Figure 6.9).
c. The Bookings Main Server requests the Java Interface for its time
zone (step 3 in Figure 6.9).
d. The Java Interface provides its time zone to the Bookings Main Server
(step 3 in Figure 6.9).
3
Greenwich Mean Time (GMT) is the world wide reference time to calculate countries’ time
zone around the world.
143
6.3 A flexible scheme for booking and authentication
e. The Bookings Main Server calculates the time lag and amends the
timeslot.
f. The Bookings Main Server reports the new register to the Java Interface (see step 4 in Figure 6.9).
g. The Java Interface receives the register and inserts it in the Lab-Server
DB (step 5 in Figure 6.9).
h. The Bookings Main Server tells the client that the new reservation has
been done (see number 1 in Figure 6.9).
Authentication Stage: A state diagram of the authentication process is depicted in Figure 6.11.
b
a
Identity checking module
d
c
Applet for experimentation
d
Target Plant
Figure 6.11: State diagram of the authentication process.
A detailed description of the state flow during authentication is as follows:
a. The Applet for experimentation starts the process by sending user
credentials (see step 6 in Figure 6.9).
b. The Identity Checking Module receives the keys and checks whether
user exists in local DB. Should this be the case, it then checks whether
the connection attempt is between the starttime and the endtime of
the timeslot reserved (see step 7 in Figure 6.9).
c. The Identity Checking Module sends the result of the checking to the
Applet for experimentation (see step 6 in Figure 6.9).
d. If the checking result is ok, then the Applet for experimentation gets
free access to the Target Plant (see step 6 and 8 in Figure 6.9).
144
6
Access Control to Experimentation Resources
¯ Note: The bookings and authentication system architecture presents three
interesting advantages from a maintenance point of view. It provides a backup
of all bookings hosted in a centralized database. Thus, in the case that a LabServer with valid bookings is damaged, these could be retrieved later by the
Lab-Server from the Central Server. The authentication process being carried
out directly with the Lab-Server represents a second advantage. And thirdly,
the administrators of a Lab-Server can manage the bookings locally. In case of
problems with the central-side, bookings can be made manually.
6.3.1
The automatic bookings system client interface
So far, the global architecture of the automatic bookings and authentication system
has been described. The detailed steps to follow in order to make a reservation
are now presented. Figure 6.12 shows the user interface of the Applet for bookings
whereby students perform their reservations in any experimentation laboratory.
First of all, the process to make a booking implies the student requests a
reservation, and secondly that, the response of the bookings system indicates
date and time assigned to use for the remote plant. Steps to follow to book are
described in detail below:
1. Student should be identified by a login and password registered in the
database (Figure 6.12(a)). User name and password to access the remote
system are sent to the student by e-mail once the simulation stage has been
accepted by the tutor.
2. When user has accessed the bookings system, s/he must choose a time and
date as well as the remote laboratory (Figure 6.12(b)).
3. Afterwards, the student must check if the remote plant selected is available
on the chosen day (Figure 6.12(c)).
4. The student must select the timetable established to use the remote-lab
(Figure 6.12(d)). At present, students are allowed up to 6 hours per experiment with the constraints of 2 hours within the same day, with a maximum
145
6.3 A flexible scheme for booking and authentication
of 4 hours per week.
5. The booking system confirms the reservation. The user also receives a
confirmation email (Figure 6.12(e)).
6. Finally, the system shows a bookings list with the registered user (Figure
6.12(f)). Reservations can be removed from the list up to 24 hours before.
(a) Stage 1.
(b) Stage 2.
(c) Stage 3.
(d) Stage 4.
(e) Stage 5.
(f) Stage 6.
Figure 6.12: Interfaces involved in the reservation process.
146
6
6.3.2
Access Control to Experimentation Resources
The automatic bookings system server
An administrator for the booking system is in charge of the server configuration. Figure 6.13 shows the graphical user interface of the Bookings Main Server
whereby the administrator can configure the system’s main parameters. This
server, located at the Department of Computer Science and Automatic Control
of the UNED, is responsible for storing all the reservations made in the system.
This way, this computer must be connected, via the Internet, to every Lab-Server
available. So, any Lab-Server connected to the Internet could benefit from this
bookings service.
Figure 6.13: Server site of the automatic bookings system.
The most important configuration parameters of the server are the following:
1. Configuration of the supervisor’s e-mail account of each laboratory. The
system confirms reservations made by users sending an e-mail to the supervisor. Also, if the Lab-Server is switched off when a new reservation is
made, an e-mail is sent to the Lab-Server administrator reporting operation
went badly.
2. IP address of the server computers connected to the laboratory plants (LabServers) which are suscribed to the bookings system.
147
6.4 Conclusions
3. IP address and port of the MySQL database from eMersion. This information is necessary since the Bookings Main Server allows access to the
system to users on the eMersion list only.
4. General parameters of the server as, for example, the communication port
with the Java Interface of every Lab-Server, updating frequency of the
plants (database in Lab-Servers), destination of the log files, etc.
5. Schedule constraints for each one of the practical experiments.
6.4
Conclusions
This chapter has described the implementation of the Automatic Bookings and
Authentication System that manages access to and use of the physical resources
of the remote laboratory. This development allows for a rational use of resources,
an essential issue to address in most universities where the number of didacticalsetups to attend the students demand is insufficient.
The global architecture of the system has been thought in such a way that any
Lab-Server (from different locations) can use this service. Chapter 8 will present
two pilot experiences carried out with the on-line experimentation system developed in this dissertation. Both use the automatic bookings system. The first one
uses it with the physical systems located in the Department of Computer Science
and Automatic Control of the UNED and the second one, uses the resources of
different universities around Spain.
This dissertation considers the automatic booking and authentication system
as part of the e-Learning Layer. This is because the following chapter will show
how the bookings system was completely integrated into eMersion as an External
Toolkit that belongs to the own experimentation environment.
7
Integration of Layers
Overview
In this chapter the integration of the Experimentation and e-Learning Layers is
addressed. Low-level linkages among different pieces are required to ensure the
appropriate functioning of the full environment.
The eMersion environment plays a key role in this part of the dissertation, since,
this application could be considered as a wrapper of the other components. The
integration of Ejs applications into eMersion is first introduced. Then, the inclusion of the automatic bookings and authentication system as a new external
application in the environment is shown.
Finally, the last section shows the integration of the virtual and remote control laboratory of the three-tank system (described in Chapter 4) into eMersion.
A summary of the most important steps to follow to obtain the final result is
provided.
150
7.1
7
Integration of Layers
Linking layers
So far, the experimentation and e-learning layers have been presented separately
to maintain a certain order before reaching the final result. Thus, this chapter
is intended to describe the final linkage between both layers in order to get the
system working as a whole.
As mentioned in previous chapters, web-based experimentation for educational purposes should provide the opportunity for students to generate on-the-fly
data registers of their experiments in both simulation and remote mode for post
analysis. In the particular case of this work, these data fragments are stored in
the eJournal workspace. Since the output of a component of the experimentation layer, as the Ejs console, is going to be the input for a component of the
e-learning layer, such as the eJournal, the linkage between both should be solved.
About this subject, two things have been addressed in this disseration:
1. The definition of the type of data fragments generated from the experimentation console (Ejs applications).
2. The integration of Ejs applications into eMersion to save data fragments to
the eJournal space.
On the other hand, the web experimentation environment requires to integrate
some supplementary components to give access to other pieces of information
requested during the learning process.
eMersion automatically makes the linkage between the web-components above
mentioned. This task is carried out during the creation of a working-module in
eMersion. A module is, in a few words, the final web interface (eMersion’s facade
or cockpit) where students work and therefore, from where they should have
access to any further web-component. From an eMersion management point of
view, the creation of a module is just a part of the configuration process, however,
it is precisely there that the integration of every web-component is carried out.
A complete summary of both the eMersion management and the cockpit usage
can be found in (Esquembre et al. 2007) and Appendix C, respectively.
7.2 Integration of Ejs applications in eMersion
7.2
151
Integration of Ejs applications in eMersion
Reports about the students’ work made during a remote experimentation session
are required by the teaching staff. These results are based on the data registers
obtained when performing the practical experiments with the help of the experimentation console. This section is devoted to explaining how and what type of
data registers can be obtained from the Ejs applications.
7.2.1
Ejs built-in methods to save data in eJournal
Client-side Java applications can easily be integrated into eMersion with the help
of predefined built-in methods of Ejs (Esquembre et al. 2007). These methods were used in this dissertation to save data fragments in the eJournal space.
Methods used and their functionalities are described below:
public boolean _saveImage(String fileName, String compName); :
Saves the image of an element compName of the view to the file fileName.
public boolean _saveText(String fileName, String textData); :
Saves the text textData to the file fileName.
Figure 7.1: Ejs built-in methods to link the applet to the eJournal workspace.
152
7
Integration of Layers
Figure 7.1 shows the use of these methods in the DC motor prototype. They
are invoked via the action property of buttons SaveGraph and SaveRegister.
When these methods are invoked, they are internally launched in an independent Java thread in order not to interrupt the normal execution of the main loop
of the Ejs application.
Figure 7.2: Saving data from the Ejs console to the eJournal space.
Figure 7.2 shows where the buttons are located. Here, it is important to notice
that Ejs methods internally check whether the Java application is loaded as an
applet. If this latter condition is satisfied, then data fragments will be saved in
the eJournal database and will remain available for a later analysis. Otherwise,
the fragment is saved in the local hard disk of the client computer.
7.2.2
Defining types of data fragments
The virtual and remote control applications developed in this dissertation can
save data in two formats as mentioned in the previous section:
1. Generic text data files (*.txt) with the values of some variables.
2. Image files displaying the scope area of Ejs applications (*.gif).
153
7.3 Linking all: Work modules in eMersion
The temporal piecewise of data to save is what exists in the internal data
buffer of the application at the moment of invoking the corresponding method.
Circular buffers were used to keep the most recent data ready to be saved. When
data are saved in text format, arrays from these circular buffers are turned into
strings to use the _saveText method. Once the data has been converted to string,
the Java API to manipulate strings is used in order to structure its presentation.
Figure 7.3 displays two examples of data fragments saved from an Ejs console.
Figure 7.3(a) shows an example of a generic text file and Figure 7.3(b) shows the
image of a signal scope of an Ejs view saved as an image file.
(a) Generic text data file (*.m).
(b) Image data file (*.gif).
Figure 7.3: Types of data fragments in the eJournal space.
Special care was given to ensure the text data file has a Matlab-compatible
structure. This means students can load and analyze the data in the Matlab
workspace without extra manipulation. Furthermore, a header as comment has
been added at the top of the file. This header provides information about whether
the data was saved in simulation or remote mode, the date when this was done,
the remote equipment used, and what the name and order of the variables are.
7.3
Linking all: Work modules in eMersion
As mentioned in Section 7.1, the management of work-modules in eMersion is
closely related to the linkage of all web-components of the environment. A mod-
154
7
Integration of Layers
ule is part of a course in eMersion and a course can contain several work-modules
which somehow represent the different types of practices or “laboratories” available in the system. When managing a course, the administrator can create as
many modules as s/he needs. To create a new module, the teacher administrator
of the course must fill out a web-form (see Figure 7.4).
Figure 7.4: Creating a new module (included into a course) in eMersion.
As seen in Figure 7.4, most of the setting parameters needed to create a new
module are related to the URL of each web-component that integrate the module.
A brief description of the contents of the web-form in Figure 7.4 is given below:
− Protocol name: The name of the tasks protocol created previously to the
current module setting.
− Protocol objective: A short description about the objectives of the module. This description will appear on the navigation bar of eMersion.
− Protocol description file: An HTML or PDF file containing an eMersion’s guide. This is the first document to be consulted by users.
− Toolkit: Integration of external web-applications. A course’s administrator
7.3 Linking all: Work modules in eMersion
155
can provide as many URLs as external toolkits s/he wishes. For example,
to integrate the Automatic Bookings System, the URL of the client interface
of the bookings application must be included (see Figure 7.4).
− Choosing the module’s logo: A custom logo can be used for the module.
The image file could be located in the local hard disk or any URL on the
Internet. If no logo is provided, the eMersion logo is used by default.
− A language module: The course Administrator can choose between three
different languages: English, French, or Spanish.
− Experimentation window size (pixels): The size in pixels of the pop-up
window containing the experimentation console (Ejs applet).
− Experimentation URL: The URL where the experimentation console is
reachable on the Internet. Servers hosting the applets are not restricted to
a specific location.
− Documentation: The link to the theory and any other document should
be indicated here. The field Title provides a representative name of the
subject of the documents. The content of the document is indicated by
means of its URL.
eMersion uses all this metadata information to create a module. A module is
composed of a set of JSP, HTML pages (based on the metadata information) automatically created for the eMersion’s course management system. When a final
user has access to the experimentation environment to carry out an experimental
session, s/he is really accessing the web application that constitutes a working
module. Hence, it is possible to say that a module represents the final facade of
the web-based experimentation environment.
An administrator course can create as many working modules as virtual and
remote control laboratories s/he has to develop. For the purpose of this dissertation three modules were created, which correspond to the three remote laboratory
prototypes presented in Chapter 4. For each of them, all the neccesary documentation was developed following recommendations described in Chapter 5.
156
7
Integration of Layers
The automatic bookings system client interface is easily integrated into a
working module just by providing its URL.
The following section will show the module of the three-tank prototype fully
integrated into eMersion. The interoperability of all web-components described
along this dissertation is shown hereafter.
7.4
A remote laboratory integrated into eMersion
Figure 7.5 shows a complete view of the experimentation environment eMersion during a practical session with the three-tank system in remote mode. As
mentioned in Section 5.2.4 the environment is composed of five independent webapplications: navigation bar, eJournal, experimentation console, on-line information, and external applications.
The navigation bar gives access to the other environment’s web resources.
From the link “Access Protocol”, users can obtain a complete user’s guide of the
environment.
The eJournal resource provides a shared workspace for users to communicate
and collaborate during the learning process. The eJournal allows students to
save, retrieve, and interchange their experimental results and documents. Furthermore, the presentation of results and discussing with teaching staff can be
done using the options provided for these purposes. They can also organize the
information collected during experimental sessions as well as an on-line repository works. Work tracking and awareness could be implemented based on this
information.
A collection of HTML pages accessible from the same environment permits
students to visualize all the documentation about the practical exercise. Moreover, each web page includes a PDF document which contains the same information than the web page. This option can be used by students to download the
experiments as electronic files.
The applications developed with Ejs can be easily integrated into the eMersion environment since they are prepared to interchange data with the eJournal
Figure 7.5: eMersion’s facade. Remote session using the three-tank system.
158
7
Integration of Layers
space (Figure 7.5, eJournal option). Thus, students can use the results obtained
(images of the system’s evolution or data registers) in the experimentation sessions to ellaborate their reports for the final assessment.
The user interface of the booking system has been completely integrated into
eMersion. This means, the students can make their reservations from the experimentation environment in order to complete remote experiments.
7.5
Conclusions
The linkage and interoperability of all the pieces of the remote experimentation
system of this dissertation has been shown. This mixture of web-components
working at the same time both synchronously and asynchronously was the big
challenge to reach during the development of this thesis.
The software tools (Ejs, LabVIEW, and eMersion) used provide considerable
benefits compared to other alternatives. Also, and thanks to this work, the connection between these three software tools have correctly been implemented and
tested. Ejs applications can be integrated into eMersion in a simple and straightforward way through specific built-in methods. The eMersion management system is what allows the linkage between the web-components that constitute a
remote laboratory.
Finally, the next chapter presents some results obtained from testing the system. Two pilot experiences were carried out to test the system and check the
students’ perception regarding the use of the environment.
Part III
ASSESSMENT
8
System Assessment
Overview
Capturing the students’ perception of their learning experiences is a key issue to
evaluate the quality and value of the experimentation environment as a teaching
tool. Two real experiences were carried out to test the remote experimentation
system developed in this dissertation: The UNED pilot experience and the AutomatL@bs project.
During the UNED pilot experience, students from this institution were encouraged to use the new web-based remote experimentation system to perform their
practical activities. Some preliminary results of this experience were extracted
and analyzed in this chapter.
In the AutomatL@bs project a more exhaustive test of the system was performed.
The experience consisted in integrating virtual and remote control labs from other
Spanish universities to produce the first Spanish network of web-based control
labs. This study was designed to increase the quality and robustness of the network of virtual and remote laboratories aimed at a higher number of students
and teachers with different teaching and learning concerns. In this sense, a set of
graphics will show the main results of this evaluation.
162
8.1
8
System Assessment
A first experience from the UNED
In order to evaluate the first version of the experimentation system, a pilot experience was carried out during the academic year 2006-2007. Figure 8.1 shows
the website which students used to access the remote experimentation system.
Figure 8.1: UNED pilot experience home page.
Students worked on the three prototypes of virtual and remote laboratories
located at the Department of Computer Science and Automatic Control: the
three-tank system (liquid level control), the heat-flow system (temperature control), and the DC motor (speed and position control).
The evaluation was completed during the summer term of 2007 with 50 students enrolled in the Physics degree program at the UNED (for which the process
control laboratory is a compulsory subject). The evaluation questionnaires returned at the end of the term showed the opinions of the audience, who rated
the different statements of the survey as strongly agree, agree, neutral, disagree,
or strongly disagree. These answers are summarized in Table 8.1.
The analysis of the evaluation results showed that the pilot experience was
a very promising achievement. The experience also helped to extract some information about the positive and negative aspects of a remote experimentation
system for teaching in the field of engineering (Dormido et al. 2008).
163
8.2 The AutomatL@bs project
Table 8.1: Student questionnary results (2006-2007), UNED.
Sub-scale
%SA
Learning value
55.5
Value added
2.5
Design and usability 38.8
Technology function 53.3
%A %N
33.3 11.2
2.5
1.5
55.5 5.7
13.3 13.3
%D
0
0
0
0
%SD
0
0
0
0
%NA
0
0
0
20.1
SA: Strongly Agree. D: Disagree. A: Agree.
SD: Strongly Disagree. N: Neutral. N/A: None of the previous.
One should highlight that the UNED is an important distance learning institution in the world. Experiments should be carried out once and again improved
and encouraged. These should be seriously taken into consideration so as to
prepare programs adapted to the European Space of Higher Education.
8.2
The AutomatL@bs project
The second pilot experience consisted of expanding the first study to a national
scope (academic year 2007-2008) to carry out a more exhaustive test of the experimentation system (see Figure 8.2).
The workgroups of the control engineering research area taking part in the
AutomatL@bs initiative were the National University for Distance Education
(UNED), the University of Almerı́a (UAL), the University of Alicante (UA), the
Polytechnic University of Valencia (UPV), the Polytechnic University of Catalonia (UPC), Miguel Hernández University (UMH), and the University of León
(UNILEON).
The main challenge of this experience was the integration of the hardware,
software, and human resources of the project participants into the web-based experimentation environment hosted by the Department of Computer Science and
Automatic Control of the UNED (AutomatL@bs 2009, Vargas et al. 2009b, 2010).
The various groups committed to the following:
1. To provide a physical system hosted by the participants to the AutomatL@bs
network. This piece of equipment should be for the exclusive use of the network during the months when the laboratory is open to students.
164
8
System Assessment
2 nd Experience: Integrating labs from other Spanish universities
UPV Server
UPC Server
Wait
Connection
C++
UMH Server
UNILEON Server
Wait
Connection
Wait
Connection
UA Server
Wait
Connection
UAL Server
Wait
Connection
Wait
Connection
PHP
Office
WAN
Simulation
On the run
Remote
Simulation
Simulation
Internet
Remote
Wi-fi
Simulation
Home
Simulation
Simulation
Remote
1st Experience: Centralized experimentation services - UNED
Admin
DB
Wait
Connection
- Users’ management
- Documentation
- Collaborative services
- Client applets files
- Web Server
- Database
- Bookings System
Lab-Server
Main Server
LAN - UNED
Wait
Connection
Lab-Server
Wait
Connection
Lab-Server
Figure 8.2: AutomatL@bs project network.
2. To develop a virtual and remote control laboratory based on standard established in this dissertation.
3. To generate all the necessary documentation for the laboratory such as an
explanation of the Ejs-based GUI, tasks protocol, and practical guides for
students to complete activities independently.
4. To keep the plants in an operative state during the execution period of the
practical activities.
5. To answer students’ questions regarding the laboratory tasks (and/or experiments) they are working on.
6. To evaluate reports written by students.
These remote-labs were offered to a total of 112 Master students in engineering
schools coming from the other universities. Students from each university worked
8.2 The AutomatL@bs project
165
on three of the nine remote systems available offered by the AutomatL@bs project
(one plant from their university + two plants from other locations).
Unlike the UNED, the teaching methodology of the other academic centres
focused on face-to-face hands-on activities in the presence of a teacher assistant.
For this reason, some live demonstrations taking place during classroom sessions
on the use of the remote experimentation interface were completed by teaching
assistants. Then, students were required to use the system to get a fluent handling of the interfaces. Finally, and after several sessions, they could complement
their work by using the web-based experimentation system of AutomatL@bs.
UNED students were first offered the possibility of accessing the systems available at the UNED (the DC motor, the heatflow system, and the threetank system)
and, could then complete their work remotely through the Internet. During these
experimental sessions, students could save data measurements and parameters,
which they used later to write their final reports. These reports were placed by
students in the eJournal space for a post evaluation. Teaching assistants from
each university taking part were in charge of completing this task.
8.2.1
Access to AutomatL@bs
Figure 8.3 shows the website whereby students access to the experimentation
system. It provides information on the whole system, the processes available, the
network’s virtual and remote laboratories, etc. The purpose of this information
is to introduce students to the virtual experimentation before working with the
real processes.
As mentioned before, teachers and students from other universities took part
in this second evaluation of the environment. The main aims of this study were:
a. To enable students to access other practical experiments not available at
their universities and,
b. To increase the quality and robustness of the network of virtual and remote
laboratories for a higher number of students and teachers with different
teaching concerns.
166
8
System Assessment
Figure 8.3: AutomatL@bs home page.
8.2.2
Remote systems available
In addition to the prototypes presented in this thesis, each university participant
provided a physical plant. A brief description of the remote systems available in
the AutomatL@bs project are presented hereafter.
DC motor: “Miguel Hernández” University of Elche
The Direct Current Motor is one of the classical experiments in automatic control
laboratories. It allows to study the dynamic behaviour of a motor fed by a direct
current source (see Figure 8.4) with regards to speed and position. The DC Motor
is a common actuator in control systems and therefore, although it is a simple
and straightforward example, it requires special attention.
The didactical setup is an electromechanical process intended to perform the
angular position or speed control of a load using the direct current supplied to
the motor as a manipulated variable (Costa-Castelló et al. 2010).
167
8.2 The AutomatL@bs project
(a) Hardware.
(b) Ejs view in remote mode.
Figure 8.4: DC motor: Miguel Hernández University.
One tank system: University of Almería
The four-tank system represents one of the most complete processes to teach
automatic control concepts (Johansson 2000, Dormido & Esquembre 2003). It can
be configurated to enable the study of monovariable and multivariable systems.
In this case, the plant is configured as a two-tank system (see Figure 8.5(a)) which
objective is to control the liquid level in the lower tank, using the upper tank to
induce disturbances (Guzmán et al. 2007a,b, 2010).
(a) Hardware.
(b) Ejs view in remote mode.
Figure 8.5: One tank system: University of Almerı́a.
Roto-magnet system: Polytechnic University of Catalonia
This plant was conceived and designed to analyze control problems linked to the
frequential response of linear systems (see Figure 8.6). The process allows to
168
8
(a) Hardware.
System Assessment
(b) Ejs view in remote mode.
Figure 8.6: The Rotoiman system: Polytechnic University of Catalunia.
observe the effect of disturbances caused by certain frequencies on the system’s
output and validate different control techniques as resonant or repetitive control
strategies (Diaz et al. 2009, Costa-Castelló et al. 2010).
Four variable system: University of León
The four-variable system is a multifunctional industrial equipment designed and
developed by the Automatic Control Group of the University of León (Figure
8.7). The plant allows to operate basic and advanced control experiments on the
following variables: flow, pressure, temperature (cooling and warming circuits),
and level. It also incorporates industrial instrumentation, neumatic, and electrical
actuators for valves with variable frequency in the pumps (Guzmán et al. 2010).
(a) Hardware.
(b) Ejs view in remote mode.
Figure 8.7: Four variable system: University of León.
169
8.2 The AutomatL@bs project
Robot arm: University of Alicante
Using this laboratory enables to control a robot arm to plan and track trayectories (see Figure 8.8). The virtual lab allows to work on a 3D representation of
the Scorbot ER-IX robot arm located in the University of Alicante. The simulation represents the real movement of the robot arm as realistically as possible.
Students can design simple and complex trayectories and analyze the dynamic
behaviour of the response (Jara et al. 2008, 2009b).
(a) Hardware.
(b) Ejs view in remote mode.
Figure 8.8: Robot arm: University of Alicante.
Ball and beam system: Polytechnic University of Valencia
This system enables to obtain the position control of a ball rolling on a beam with
horizontal movement (see Figure 8.9). The beam inclination angle is controlled
(a) Hardware.
(b) Ejs view in remote mode.
Figure 8.9: Ball and beam system: Polytechnic University of Valencia.
170
8
System Assessment
with the voltage applied to the motor that is mechanically coupled to its mobile
end. In this case, this system had the server side programmed in C++. This
means, the remote connection between Ejs programs (Java) and C++ had to be
solved (Diez et al. 2009, Costa-Castelló et al. 2010).
The following section presents a brief analysis of the results obtained from
this last system evaluation experiment involving the integration of remote labs
from other academic institutions around Spain.
8.2.3
Analysis of results
A collection of statistical graphs summarizes results obtained in the evaluation
process. Figure 8.10 shows a general view of the level of the students’ satisfaction
during the practical experiences. 19% of them answered that they strongly agreed
and 69% agreed with the use of the system. Moreover, other questions about the
advantages that students/teachers expected when using remote experiments in
the educational process were reported. The results obtained were that the use of
new technologies, specially the Internet, encourages students to do most of their
practical exercises with the help of these resources.
Figure 8.10: Satisfaction enquiry about the practical activities.
Figure 8.11(a) and Figure 8.11(b) give comparative information about how
learning improved when using these new technological methods compared to the
traditional ones. In most cases, students’ disagreement (around 9%) is due to
the fact that they did not have the chance to experiment directly with the real
equipment.
171
8.2 The AutomatL@bs project
(a)
(b)
Figure 8.11: Regarding the overall system.
A solution to this problem is to follow an educational methodology based on
the “blended learning” concept. That is, to first carry out face-to-face classes
where students can interact and experiment “in-situ” with the real plant and, to
enable them afterwards to have access to the experimentation environment to
complete their practical exercises at a distance.
With regards to the quality of virtual and remote laboratories, most students
expressed a positive opinion about its development in terms of user functionality
(see Figures 8.12(a) and 8.12(b)).
Negative opinions were a consequence of the bad quality of the Internet connections established. Ejs presents great advantages compared to other software
alternatives to develop the client side interfaces for remote experimentation. The
high degree of acceptance was because of the quality of the applications, in particular, the simulations which represent almost faithfully the real aspect of the
172
8
System Assessment
(a)
(b)
Figure 8.12: Quality of the web-based laboratories.
didactical setups located in the university laboratories. This is a very important
aspect since students get a first insight of the systems through the work they
complete in virtual mode and therefore, the simulations behaviour should match
real counterparts as much as possible.
Figure 8.13: The most important learning resource.
173
8.3 Conclusions
Finally, Figure 8.13 shows how questions and the documentation needed for
practical exercises are essential for the student’s performance. In fact, students
felt more comfortable when they were accompanied by a teacher, in this case, in
a virtual way, by using the web resources provided by eMersion.
8.3
Conclusions
In this chapter, two pilot experiences carried out with the remote experimentation system developed in this dissertation have been presented and analyzed: the
UNED pilot experience and the AutomatL@bs project. The set of remote labs
integrated into the remote experimentation system of the AutomatL@bs project
has been also described.
Student’s perception was analyzed during the academic years 2006-2007 (UNED
pilot experience) and 2007-2008 (AutomatL@bs project). In both tests, the results show a high degree of satisfaction which demonstrates that the approach
presented was correctly developed.
The information extracted from these studies will be used to improve the
quality of the web-based experimentation system. New functionalities or the improvement of existing ones must be achieved according to the results obtained in
these evaluation processes.
9
Conclusions and Future Research
9.1
Conclusions
General conclusion
Virtual and remote experimentation for engineering education can be considered
as a mature technology. However, the process of transforming a classical control
experiment into an interactive web-based laboratory is not an easy task. This
dissertation provides a systematic approach (experimentation and e-learning layers) for the fast development of remote laboratories using three tools: Easy Java
Simulations, LabVIEW, and eMersion. The approach suggested eases the development of online experimentation environments and, it also provides an effective
scheme to switch between simulation and tele-operation of real systems, a key
feature for hands-on learning activities in engineering education.
Specific conclusions
The “JiL Server” methodology proposed in Chapter 3 to create web-based laboratories (experimentation layer) and the developed software tools were successfully
applied to develop the following web-based remote and virtual laboratories for
control education:
176
9
Conclusions and Future Research
− Virtual and remote lab of a DC motor, a temperature control system, and
a coupled threetank system in the Automatic Control Laboratory of the
Department of Computer Science and Automatic Control of the UNED.
− Virtual and remote lab of a one-tank system located in the Department of
Computer Science and Languages of the University of Almerı́a (UAL).
− Virtual and remote lab of a “roto-magnet” system controlled by magnetic
fields located in the Department of Systems Engineering and Automatic
Control of the Technical University of Cataluña (UPC).
− Virtual and remote lab of a four variable system, a multifunctional industrial equipment designed and developed by the Automatic Control group of
the University of León (UNILEON).
eMersion as software tool for publishing remote and virtual-labs covers all the
design requirements of the e-learning layer. Specifically:
− eMersion allows to maintain the pedagogical aspects of interaction and collaboration of traditional hands-on laboratories when moving towards a flexible learning model based on the Internet.
− eMersion organizes and puts all the complementary learning resources to use
virtual and remote labs at the disposal of students. User’s manual, theory,
assignments, task protocols, and a complete instruction manual of the global
system are available at the experimentation environment. Furthermore, the
eJournal provides a shared space where students can save and organize the
results of their practical activities, and collaborate amongst them and with
their teachers.
The automatic bookings system was successfully integrated into eMersion and
used by students when they perform their practical activities. The application
design suggested helps to optimize the use of physical resources available by
including:
177
9.2 Future work
− A simple mechanism to book resources to work on the real systems located
in the laboratory.
− A straightforward module of encriptation and user authentication.
− A centralized backup for bookings.
− E-mail notifications of new reservations and/or cancelations.
Finding out about students’ perception during the learning process is a very
important matter to assess an experimentation environment as a valuable learning/teaching tool. For this reason, during the two pilot experiences carried out
with students (UNED pilot experience and AutomatL@bs project) students were
asked to fill out an evaluation questionnaire to determine the pros and cons of
the experimentation environment. Such results encouraged us to repeat the experience involving more students and university groups.
The AutomatL@bs project presented in Chapter 8 is the most recent research
result and it demonstrates its benefits over the last three academic years in the
universities that took part in the project. Results from the previous evaluation
will let us debug and improve the framework in different directions. First, the
number and variety of physical processes will be increased by enrolling new universities to the AutomatL@bs project. Also, we will try to let students carry on
with their practical experiences using other devices (mobile phones, PDAs) and
user interfaces (e-mail, web forms, HTML/Javascript thin interfaces, etc.).
9.2
Future work
Finally, some ideas about possible extensions of this work are the following:
1. The notion of smart objects discussed in (Thompson 2005, Salzmann &
Gillet 2008, Johnson et al. 2009) is pursued in the following two points.
This idea can be applied in remote experimentation topics by increasing the
intelligence of the server-side applications, i.e., by extending the capabilities
of JiL Server.
178
9
Conclusions and Future Research
− To include new functionalities to the JiL Server application in order
to improve the maintenance of laboratory equipments. In this sense,
administrators could benefit from implementing automatic fault notification mechanisms via email or mobile messages, statistic tracking of
connections, state notification, etc.
− To add new communication protocols to the JiL Server approach in
such a way that it allows web-clients developed with other technologies control the devices remotely. This would allow to make a simple
mashup of these applications with other web enviroments (Ngolo et al.
2009, Vargas et al. 2009c).
2. It would be very interesting to modify the current remote-labs prototypes,
in which the structure of the controller is already predefined, towards a
more flexible structure where students can define the controller form. This
idea is pursued in the next point. Some examples supporting this working
line can be found in (Farias et al. 2009).
− To extend the virtual and remote control laboratory prototypes developed throughout this dissertation by including new control algorithms
and even, by offering students the opportunity to test their own implementations. Thus, these hands-on laboratories through the Internet
could be applied to courses in higher degrees (Master or PhD programs).
3. eMersion capabilities can be enhanced by means of integrating external web
applications. Two new modules could be developed and included in order to
improve students’ motivation in the completation of their remote working
experience. These ideas were taken from (Gillet et al. 2005, Salzmann et al.
2008).
− To include a new web module into eMersion that would allow students
to carry out the analysis and design of controllers on-line. They can
use tools such as Matlab/Simulink or Scilab to perform these activities
179
9.2 Future work
currently. This means, we can close the instruction cycle, the experimentation phase, the analysis process, and the design by using just
the web browser, avoiding the use of standalone applications or the
purchasing of licenses.
− To develop a web module to eMersion that includes awareness tools.
Students could then track their own progress and, they could compare
the progress they have made with other classmates. This development would also allow to balance the workload of the system, that is,
students could start their work earlier (compared to other students),
avoiding the high demand of students at the end of the course.
Bibliography
Adamo, F., Attivissimo, F., Cavone, G. & Giaquinto, N. (2007), ‘SCADA/HMI
Systems in Advanced Educational Courses’, IEEE Trans. Instrumentation and
Measurement 56(1), 4–10.
AJAX (2009), Ajax Website. http://www.php.org/.
Amira (2009), Amira GmbH Website. http://www.amira.de.
Anderson, P. (2007), What is Web 2.0?
Ideas, technologies and impli-
cations for education, Technical report, JISC Technology and Standards
Watch.
http://citeseerx.ist.psu.edu/viewdoc/download?doi=10.1.1.
108.9995&rep=rep1&type=pdf.
Anderson, T. & Elloumi, F. (2004), Theory and practice of online learning,
Athabasca University (Copyright Creative Commons). Online-book.
Apache-Logging (2009), Apache Foundation Website.
http://commons.apache.org/logging/.
Apache-Pool (2009), Apache Foundation Website.
http://commons.apache.org/pool/.
Apache-Tiles (2009), Apache Foundation Website.
http://struts.apache.org/1.x/struts-tiles/.
182
9
Bibliography
Apache-Validator (2009), Apache Foundation Website.
http://commons.apache.org/validator/.
Aranda, J., Dormido, S., Morilla, F., Ruipérez, P. & Sánchez, J. (1998), Virtual
Control Laboratory for Distance Learning, in ‘Proceedings of the 2nd II/ITAP
Workshop on Distance Learning Conception and Exploitation of the Virtual
Laboratory in the Framework of the Virtual Campus, Academical and Industrial Vision (WESIC’98 World Congress)’, Girona, Spain.
Åström, K. J. (2006), Challenges in Control Education, in ‘Proceedings of the 7th
IFAC Symposium on Advances in Control Education (ACE)’, Madrid, Spain.
Åström, K. J. & Hägglund, T. (2006), Advanced PID Control, ISA.
AutomatL@bs (2009), AutomatL@bs Website.
http://lab.dia.uned.es/automatlab/.
Blume, P. A. (2007), The LabVIEW Style Book, Pearson Education, Prentice
Hall.
Bourne, J., Harris, D. & Mayadas, F. (2005), ‘On-line Engineering Education:
Learning Anywhere, Anytime’, International Journal of Engineering Education
94(1), 131–146.
Bristol, E. H. (1966), ‘On a new measure of interactions for multivariable process
control’, IEEE Trans. on Automatic Control 11, 133–134.
Brito, N., Ribeiro, P., Soares, F., Monteiro, C., Carvalho, V. & Vasconcelos,
R. (2009), A Remote System for Water Tank Level Monitoring and Control
- a Collaborative Case-study, in ‘Proceedings of the 3rd IEEE International
Conference on e-Learning in Industrial Electronic (ICELIE)’, Porto, Portugal.
Callaghan, M. J., Harkin, J., McGinnity, T. M. & Maguire, L. P. (2006), ‘ClientServer Architecture for Remote Experimentation for Embedded Systems’, International Journal of Online Engineering 2(4).
183
9 Bibliography
Casini, M., Prattichizzo, D. & Vicino, A. (2004), ‘The Automatic Control Telelab. A Web-based technology for Distance Learning’, IEEE Control Systems
Magazine 24(3), 36–44.
Cavaness, C. (2005), Jakarta Struts: Desarrollo de aplicaciones web con Servlets
y JSP, Anaya Multimedia S.A.
Cefalo, M., Lanari, L., Oriolo, G. & Venditelli, M. (2003), The REAL Lab: Remote Experiments for Active Learning, in ‘Proceedings XLI AICA Annual
Congress’, Trento, Italia.
Christian, W. & Esquembre, F. (2007), ‘Modeling Physics with Easy Java Simulations’, The Physics Teacher 45, 475–480.
Costa-Castelló, R., Vallés, M., Jiménez, L., Dı́az-Guerra, L., Valera, A. & Puerto,
R. (2010), ‘Integración de dispositivos fı́sicos en un laboratorio remoto de control mediante diferentes plataformas: Labview, Matlab y C/C++’, Revista
Iberoamericana de Automática e Informática Industrial (RIAI) 7(1), 23–34.
Costas, L., Fariña, J. & Rodrı́guez, J. (2009), A Configurable Framework for
the Education of Digital Electronic Control Systems, in ‘Proceedings of the
3rd IEEE International Conference on e-Learning in Industrial Electronic
(ICELIE)’, Porto, Portugal.
DAQ-PCI6221 (2009), NI PCI-6221 Multifunction DAQ Website.
http://sine.ni.com/nips/cds/view/p/lang/en/nid/14132.
Diaz, L., Ramos, G., Vargas, H. & Costa, R. (2009), A Virtual/Remote Laboratory to illustrate the Internal Model Principle for periodical signals, in
‘Proceedings of the 8th IFAC Symposium on Advances in Control Education
(ACE)’, Kumamoto, Japan.
Diez, J. L., Vallés, M. & Valera, A. (2009), A ball and beam system virtual and
remote laboratory based in Ejs and C++, in ‘Proceedings of the 8th IFAC
Symposium on Advances in Control Education (ACE)’, Kumamoto, Japan.
184
9
Bibliography
Dormido-Canto, R., Vargas, H., Duro, N., Sánchez, J., Dormido-Canto, S., Farias,
G., Esquembre, F. & Dormido, S. (2008), ‘Development of a Web-Based Control Laboratory for Automation Technicians: The Three-Tank System’, IEEE
Transactions on Education 51, 35–44.
Dormido, S. (2004), ‘Control learning: present and future’, Annual Reviews in
Control 28, 115–136.
Dormido, S., Canto, S. D., Canto, R. D. & Sánchez, J. (2005a), ‘The Role of
Interactivity in Control Learning’, The International Journal of Engineering
Education: Special Issue on Control Engineering Education 21, 1122–1133.
Dormido, S. & Esquembre, F. (2003), The quadruple-tank process: an interactive tool for control education, in ‘Proceedings of the 7th European Control
Conference’, Cambridge, UK.
Dormido, S., Esquembre, F., Farias, G. & Sánchez, J. (2005b), Adding interactivity to existing Simulink models using Easy Java Simulations, in ‘Proceedings of
the 44th IEEE Conference on Decision and Control and the European Control
Conference’, Sevilla, Spain.
Dormido, S., Vargas, H., Sánchez, J., Dormido, R., Duro, N., Dormido-Canto,
S. & Morilla, F. (2008), Developing and Implementing Virtual and Remote
Labs for Control Education: The UNED pilot experience, in ‘Proceedings of
the 17th World Congress The International Federation of Automatic Control’,
Seoul, Korea.
Dostálek, L. & Kabelová, A. (2006), Understanding TCP/IP. A clear and comprehensive guide to TCP/IP protocols, Packt Publishing Ltda.
Duro, N., Dormido, R., Vargas, H., Dormido-Canto, S., Sánchez, J., Farias, G.
& Dormido, S. (2008), ‘An Integrated Virtual and Remote Control Lab The
Three-Tank System as a Case Study’, Computing in Science and Engineering
10, 50–59.
185
9 Bibliography
Eikaas, T. I., Foss, B. A., Solbjorg, O. K. & Bjolseth, T. (2006), ‘Game-based dynamic simulations supporting technical education and training’, International
Journal of Online Engineering 2(2).
Ejs (2009a), Ejs wiki Website. http://www.um.es/fem/EjsWiki/.
Ejs (2009b), Free online course about Ejs Website.
http://www.euclides.dia.uned.es/simulab-pfp/index_en.htm.
eMersion (2009), EPFL Website. http://emersion.epfl.ch/.
Esquembre, F. (2005), Creación de Simulaciones Interactivas en Java, Pearson,
Prentice Hall.
Esquembre, F., Gillet, D., Salzmann, C., Rekik, Y. & Dormido, S. (2007),
Comprehensive Collaborative Web-based Experimentation: Integration of Distributed Teleoperation and Simulation Services for Supporting Active Learning
in Higher Education.
http://e-spacio.uned.es/fez/view.php?pid=bibliuned:715.
Fan, R., Cheded, L. & Toker, O. (2005), ‘Internet-based SCADA: a new approach
using Java and XML’, Computing & Control Engineering Journal 16(5), 22–26.
Farias, G., Keyser, R. D., Dormido, S. & Esquembre, F. (2009), Building Remote
Labs Using Easy Java Simulations and Matlab, in ‘Proceedings of the 10th
European Control Conference’, Budapest, Hungary.
Ferreira, J. & Cardoso, A. (2005), ‘A Moodle extension to book online labs’,
International Journal of Online Engineering 1(2), 1–4.
Fleming, W. H. (1989), ‘Future directions in control theory: A mathematical
perspective’, Society for Industrial and Applied Mathematics .
Garcia, J., Lopez, D. & Orduña, P. (2008), ‘Mobile Devices and Remote Labs in
Engineering Education’, Eighth IEEE International Conference on Advanced
Learning Technologies 24(3), 620–622.
186
9
Bibliography
Gillet, D. & Fakas, G. (2001), eMersion: A New Paradigm for Web-based Training
in Engineering Education, in ‘Proceedings of the International Conference on
Engineering Education’, Oslo, Norway.
Gillet, D., Geoffroy, F., Zeramdini, K., Nguyen, A. V., Rekik, Y. & Piguet,
Y. (2003), ‘The Cockpit: An Effective Metaphor for Web-based Experimentation in Engineering Education’, International Journal of Engineering Education
19(3), 389–397.
Gillet, D., Nguyen, A. V. & Rekik, Y. (2005), ‘Collaborative Web-Based Experimentation in Flexible Engineering Education’, IEEE Transactions on Education 48, 696–704.
Gómez, L. & Garcı́a, J. (2007), Advances on remote laboratories and e-learning
experiences, Deusto Publicaciones.
Guzmán, J., Domı́nguez, M., Berenguel, M., Fuertes, J., Rodrı́guez, F. &
Reguera., P. (2010), ‘Entornos de Experimentación para la Enseñanza de Conceptos Básicos de Modelado y Control’, Revista Iberoamericana de Automática
e Informática Industrial (RIAI) 7(1), 10–22.
Guzmán, J. L., Åström, K. J., Dormido, S., Hägglund, T., Berenguel, M.
& Piguet, Y. (2008), ‘Interactive learning modules for PID control [Lecture
Notes]’, IEEE Control Systems Magazine 28(5), 118–134.
Guzmán, J. L., Berenguel, M., Rodrı́guez, F., Vargas, H., Sánchez, J. & Dormido,
S. (2007b), Desarrollo de un entorno de experimentación basado en web para
estudios de ingenierı́a: un caso práctico, in ‘Proceedings of the 1st Congreso
Español de Informática (CEDI-EIWISA)’, Granada, Spain.
Guzmán, J. L., Vargas, H., Sánchez, J., Berenguel, M., Dormido, S. & Rodrı́guez, F. (2007a), Distance Education Issues and Challenges, NOVA Publishers, pp. 131–167.
Hahn, H. H. & Spong, M. W. (2000), Remote Laboratories for Control Educa-
187
9 Bibliography
tion, in ‘Proceedings of the 39th IEEE Conference on Decision and Control)’,
Sydney, Australia.
Heiming, B. & Lunze, J. (1999), Definition of the Three-Tank Benchmark Problem for Controller Reconfiguration, in ‘Proceedings of the 1th European Control Conference’, Karlsruhe, Germany.
Hu, W. & Bao, A. (2008), Application of Internet-Based Collaboration Model
in Engineering Education: A Case Study, in ‘Proceedings of the 2008 International Conference on Computer Science and Software Engineering’, IEEE
Computer Society, Washington, DC, USA, pp. 178–181.
Jara, C. A., Candelas, F. A. & Torres, F. (2008), ‘An Advanced Interactive Interface for Robotics E-Learning’, International Journal of Online Engineering
4(4), 17–25.
Jara, C., Candelas, F., Puente, S., Pomares, J. & Torres, F. (2009b), Practical
experiences using RobUALab.ejs: a virtual and remote laboratory for robotics
e-learning, in ‘Proceedings of the 8th IFAC Symposium on Advances in Control
Education (ACE)’, Kumamoto, Japan.
Jara, C., Esquembre, F., Candelas, F., Torres, F. & Dormido, S. (2009a), New
features of Easy Java Simulations for 3D modeling, in ‘Proceedings of the
8th IFAC Symposium on Advances in Control Education (ACE)’, Kumamoto,
Japan.
Java (2009), Sun microsystems Website.
http://java.sun.com/docs/books/tutorial/i18n/index.html.
JiL (2009), JiL Server Overview Website.
http://www.dia.uned.es/~hvargas/jiloverview.html.
Johansson, K. H. (2000), ‘The quadruple-tank process: a multivariable laboratory process with an adjustable zero’, IEEE Transactions on Control Systems
Technology 8(3), 456–465.
188
9
Bibliography
Johnson, L., Levine, A. & Smith, R. (2009), The Horizon Report 2009 Edition,
Technical report, New Media Consortium - EDUCAUSE Learning Iniciative.
http://www.nmc.org/publications/2009-horizon-report.
Kazmer, M. & Haythornthwaite, C. (2005), ‘Multiple perspectives on online learning’, Special issue on online learning communities 25(1), 7–11.
Kumpaty, S. & Haeg, D. (2007), Innovations 2007: World Innovations in Engineering Education and Research, International Network for Engineering Education & Research (iNEER), pp. 421–429.
Kurhila, J., Miettinen, M., Nokelainen, P. & Tirri, H. (2004), The Role of the
Learning Platform in Student-Centered e-Learning, Technical report, Helsinki
Institute for Information Technology HIIT.
http://cosco.hiit.fi/Articles/hiit-2004-10.pdf.
LabSQL (2009), Jeffrey Travis Studios Website.
http://jeffreytravis.com/lost/labsql.html.
LabVIEW (2009a), Website. http://www.ni.com/labview.
LabVIEW (2009b), Command-based Communication Using Simple TCP/IP Messaging - NI Website. http://zone.ni.com/devzone/cda/tut/p/id/3098.
Leva, A. & Donida, F. (2008), ‘Web-enabled laboratory on the implementation
of industrial controllers’, International Journal of Electrical Engineering Education 45(1), 72–91.
Lim, D. (2006), ‘A Laboratory Course in Real-Time Software for the Control of
Dynamic Systems’, IEEE Transactions on Education 49(3), 346–354.
London-External (2009), University of London Website.
http://www.londonexternal.ac.uk/.
M-Series (2009), NI DAQ M-Series Website.
http://sine.ni.com/nips/cds/view/p/lang/en/nid/14114.
189
9 Bibliography
Maharg, P. (2004), Virtual communities on the Web: Transactional learning and
teaching, Wolf Legal Publishers.
Martı́n, C. (2007), Object-Oriented Modelling of Virtual Laboratories for Control Education, PhD thesis, Universidad Nacional de Educación a Distancia,
Madrid, España.
Matlab (2009), Mathworks Website. http://www.mathworks.com.
Mignone, D. (2002), Estimation and Control of Hybrid Systems, Technical report,
Automatic Control Laboratory, ETH Zürich.
Modelica (2009), Modelica Association Website. http://www.modelica.org.
Morilla, F. (2005), Introducción al control multivariable: Curso de Doctorado,
Technical report, Department of Computer Science and Automatic Control,
UNED Madrid.
Ngolo, M., Brito, L., Coito, F., Gomes, L. & Costa, A. (2009), Architecture
for Remote Laboratories based on REST Web Services, in ‘Proceedings of
the 3rd IEEE International Conference on e-Learning in Industrial Electronic
(ICELIE)’, Porto, Portugal.
Nguyen, A. V. (2006), Web-based interaction and collaboration in flexible engineering education : an artifact-based approach, PhD thesis, Ecole Polytechnique Federal de Lausanne, Lausanne, Switzerland.
Nguyen, A. V. (2007), Activity theoretical analysis and design model for Webbased experimentation, in ‘Proceedings of the International Conference on
Human-Computer Interaction’, Beijing P.R., China.
Nguyen, A. V., Rekik, Y. & Gillet, D. (2006), Iterative Design and Evaluation of
a Web-Based Experimentation Environment, Idea Group Inc., pp. 286–313.
Niederlinski, A. (1971), ‘A heuristic approach to the design of linear multivariable
interacting control systems’, Automatica 7, 691–701.
190
9
Bibliography
Nitu, C. I., Gramescu, B. S., Comeaga, C. D. P. & Trufasu, A. O. (2005), ‘Optomechatronic System for Position Detection of a Mobile Mini-Robot’, IEEE
Trans. Industrial Electronics 52(4), 969–973.
Open-UA (2009), Athabasca University Website. http://www.open-au.com/.
Oppenheim, A., Willsky, A. & Hamid, S. (1996), Signals and Systems (2nd Edition), Prentice Hall Signal Processing Series.
OU (2009), The Open University Website. http://www.open.ac.uk/.
OUA (2009), Open Universities Australia Website.
https://www.open.edu.au/wps/portal.
Pastor, R., Martı́n, C., Sánchez, J. & Dormido, S. (2005), ‘Development of an
XML-based lab for remote control experiments on a servo motor’, International
Journal of Electrical Engineering Education 42(2), 173–184.
PHP (2009), Website. http://www.php.org/.
Quanser (2009), Website. http://www.quanser.com/.
React (2009), Real-Time Coordination and Distributed Interaction Systems
Group EPFL Website. http://lawww.epfl.ch/page5358.html.
Riva, G. (2001), Learning and Teaching on the World Wide Web, Academic Press,
pp. 131–148.
Rosen, M. A. (2007), Innovations 2007: World Innovations in Engineering Education and Research, International Network for Engineering Education & Research (iNEER), pp. 1–11.
Salzmann, C. (2005), Real-Time Interaction over the Internet: Quality of Service
and End-to-End Adaptation for Remote Experimentation, PhD thesis, Ecole
Polytechnique Federal de Lausanne, Lausanne, Switzerland.
Salzmann, C. & Gillet, D. (2002), Real-time interaction over the Internet, in
‘Proceedings of the 15th IFAC World Congress’, Barcelona, Spain.
191
9 Bibliography
Salzmann, C. & Gillet, D. (2007), Challenges in Remote Laboratory Sustainability, in ‘Proceedings International Conference on Engineering Education ICEE’, Coimbra, Portugal.
Salzmann, C. & Gillet, D. (2008), ‘From on-line experiments to smart devices’,
International Journal of Online Engineering 4, 50–54.
Salzmann, C., Gillet, D. & Huguenin, P. (2000), ‘Introduction to Real-time Control using LabVIEW with an Application to Distance Learning’, International
Journal of Engineering Education 16, 255–272.
Salzmann, C., Gillet, D. & Mullhaupt, P. (2005), Real-Time Interaction over the
Internet: Model for QoS Adaptation, in ‘Proceedings of the 16th IFAC World
Congress’, Prague, Czech Republic.
Salzmann, C., Gillet, D., Scott, P. & Quick, K. (2008), Remote lab: online support and awareness analysis, in ‘Proceedings of the 17th IFAC World Congress’,
Seoul, Korea.
Shinskey, F. G. (1996), Process Control Systems: Application, Design and Tunning, 4th edition, McGraw Hill.
Shirer, D. L. (2001), ‘LabVIEW 6i adds internet features to data acquisition
environment’, IEEE Computing in Science & Engineering 3(4), 8–11.
Sánchez, J. (2000), Un enfoque metodológico para la enseñanza a distancia de
asignaturas experimentales: Analisis, diseño y desarrollo de un Laboratorio
Virtual y Remoto para el estudio de la Automática a través de Internet, PhD
thesis, Universidad Nacional de Educación a Distancia, Madrid, España.
Sánchez, J., Dormido, S. & Esquembre, F. (2005), ‘The Learning of Control
Concepts Using Interactive Tools’, Computer Applications in Engineering Education 13(1), 84–91.
Sánchez, J., Dormido, S., Pastor, R. & Morilla, F. (2004), ‘A Java/Matlab-Based
Environment for Remote Control System Laboratories: Illustrated With an
Inverted Pendulum’, IEEE Trans. on Education 47(3), 321–329.
192
9
Bibliography
Sánchez, J., Morilla, F., Dormido, S., Aranda, J. & Ruipérez, P. (2002), ‘Virtual
and Remote Control Labs Using Java: A Qualitative Approach’, IEEE Control
Systems Magazine 22(2), 8–20.
SysQuake (2009), Calerga Website. http://www.calerga.com.
Thompson, C. W. (2005), ‘Smart Devices and Soft Controllers’, IEEE Computer
Society 9(1), 82–85.
Travis, J. (2000), Internet Applications in LabVIEW, Prentice Hall.
UDIMA (2009), Distance University of Madrid Website.
http://www.udima.es/.
UNAD (2009), Open University of Colombia Website.
http://www.unad.edu.co/.
UNED (2009), National University for Distance Education Website.
http://www.uned.es.
UOC (2009), Open University of Catalonia Website. http://iip.uoc.edu/.
Urquı́a, A., Martı́n, C. & Dormido, S. (2005), ‘Design of SPICELib: A Modelica library for modeling and analysis of electric circuits’, Mathematical and
Computer Modelling of Dynamical Systems 11(1), 43–60.
Valera, A., Diez, J. L., Vallés, M. & Albertos, P. (2005), ‘Virtual and Remote
Control Laboratory Development’, IEEE Control Systems Magazine 25(1), 35–
39.
Vargas, H., Dormido, R., Duro, N., Sánchez, J., Farı́as, G., Dormido, S., Canto,
M. & Esquembre, F. (2006a), Heatflow: Un laboratorio basado en Web usando Easy Java Simulations y LabVIEW para el entrenamiento en técnicas
de automatización, in ‘Proceedings of the XII Latin American Congress on
Automatic Control - CLCA’, Salvador de Bahı́a, Brasil.
Vargas, H., Farı́as, G., Dormido, S. & Sánchez, J. (2006b), Web-based learning
resources for automation technicians vocational training: illustred with a Heat-
193
9 Bibliography
flow and liquid level laboratory, in ‘Proceedings of the 7th IFAC Symposium
on Advances in Control Education (ACE)’, Madrid, Spain.
Vargas, H., Salzmann, C., Gillet, D. & Dormido, S. (2009c), Remote Experimentation Mashup, in ‘Proceedings of the 8th IFAC Symposium on Advances in
Control Education (ACE)’, Kumamoto, Japan.
Vargas, H., Sánchez, J. & Dormido, S. (2009b), The Spanish University Network of Web-based Laboratories for Control Engineering Education: The AutomatL@bs Project, in ‘Proceedings of the 10th European Control Conference’,
Budapest, Hungary.
Vargas, H., Sánchez, J., Dormido, S., Jara, C., Candelas, F. & Torres, F. (2010),
‘Docencia en Automática: Aplicación de las TIC a la realización de actividades prácticas a través de Internet’, Revista Iberoamericana de Automática e
Informática Industrial (RIAI) 7(1), 35–45.
Vargas, H., Sánchez, J., Duro, N., Dormido, R., Dormido-Canto, S., Farias, G.,
S.Dormido, Salzmann, C. & Gillet, D. (2008), ‘A Systematic Two-Layer Approach to Develop Web-Based Experimentation Environments for Control Engineering Education’, Intelligent Automation and Soft Computing 14, 505–524.
Vargas, H., Sánchez, J., Salzmann, C., Esquembre, F., Gillet, D. & Dormido, S.
(2009a), ‘Web-enabled Remote Scientific Environments’, Computing in Science
and Engineering 11, 34–46.
Visual.NET (2008), Visual Studio Website.
http://www.microsoft.com/spanish/msdn/latam/visualstudio2008/.
Vásquez, F. & Morilla, F. (1999), An iterative method for tuning decentralized
PID controllers, in ‘Proceedings of the 14th World Congress of the IFAC (International Federation of Automatic Control)’, Beijing, China.
Vásquez, F. & Morilla, F. (2002), Tuning decentralized PID controllers for MIMO
systems with decoupling, in ‘Proceedings of the 15th World Congress of the
IFAC (International Federation of Automatic Control)’, Barcelona, Spain.
194
9
Bibliography
Williams, R. (2007), Innovations 2007: World Innovations in Engineering Education and Research, International Network for Engineering Education & Research (iNEER), pp. 279–290.
Zutin, D. G., Auer, M. E., Bocanegra, J. F., López, E. R., Martins, A. C. B.,
Ortega, J. A. & Pester, A. (2008), ‘TCP/IP Communication between Server
and Client in Multi User Remote Labs Applications’, International Journal of
Online Engineering 4(3), 42–45.
APPENDICES
A
Modelling and Control
This appendix describes the modelling and control strategies applied in the development of the virtual and remote control laboratories presented in Chapter 4
of this thesis. First one, the mathematical model of the system is introduced.
Second one, simple PI controllers have been obtained for each process based on
these models. Finally, tracking references and performance tests to demostrate
the reliability of controller designs are presented.
Note: The information provided in the next sections have been used for developing the simulations and local control VIs of each didactical-setup.
198
A.1
A
Modelling and Control
The Three-tank system: Modelling and control
A.1.1
Modelling
The model obtained through physical relationships of the variables is first described. Mass balance equations and Torricelli’s law are here applied. Next, we
complement the modelling of the process obtaining a non-parametric representation of the system (transfer functions) through identification techniques.
Mathematical model
The mathematical model of the process is described by the following balance
equations:
dh1
= Q1 − Q13 − Q1leak
dt
(A.1)
dh3
= Q13 − Q32 − Q3leak
dt
(A.2)
dh2
= Q2 − Q32 − Q20 − Q2leak
dt
(A.3)
A
A
A
where t represents time, h1 , h2 , and h3 correspond to the liquid level in each tank,
A represents the tanks cross sections, Q1 and Q2 denote the flow rates of pumps
1 and 2, Qij denotes the flow rates between tank Ti and Tj ( j = 0 represents the
system’s output), and Qileak (i = 1, 2, or 3) represents the flows that leave the
tanki when its drain valve is open. These three balance equations mean that the
volume variation in each tank is equal to the sum of the flow rates that enter and
leave the tank.
Yet flows Q13 , Q32 , and Q20 are still unknown in Equations 1, 2, and 3. To
obtain them, we use Torricelli’s law :
√
Qij = azi Sn sgn(hi − hj ) 2g∣hi − hj ∣
(A.4)
where azi is the outflow coefficient, sgn(x) is the sign of the argument x, and g
is the acceleration due to gravity.
199
A.1 The Three-tank system: Modelling and control
The resulting equations to calculate the partial flows are thus,
√
Q13 = az1 Sn sgn(h1 − h3 ) 2g∣h1 − h3 ∣
(A.5)
√
Q32 = az3 Sn sgn(h3 − h2 ) 2g∣h3 − h2 ∣
(A.6)
√
Q20 = az2 Sn 2gh2
(A.7)
The valves of the pipe connections, the pumps, and the leaks have been modeled with the relationships which can be found in (Shinskey 1996). The value of
the physical parameters of the process are provided in the Appendix B.
Identification process
To get a description of the process by transfer functions, it is neccesary to make
the identification from experimental data. To get the experimental data, different
open loop experiments with the actual three-tank system were done. The identification of the process is done around the normal operating point. In this case, the
experiences have been done around the following working point in steady state:
Q1% = 19.56, Q2% = 43.24, H1 = 300 [mm] and H2 = 200 [mm].
H1 (mm)
H1 (mm)
400
350
300
5000
seconds
10000
0
15000
0.5
1
1.5
seconds
2
2.5
4
x 10
(a) H1 (step in u1 with u2 constant).
(b) H1 (step in u2 with u1 constant).
260
240
H2 (mm)
H2 (mm)
320
300
0
240
220
200
0
5000
seconds
10000
220
200
180
15000
0
0.5
1
1.5
seconds
2
2.5
4
x 10
(c) H2 (step in u1 with u2 constant).
(d) H2 (step in u2 with u1 constant).
100
100
Q1 & Q2 (%)
Q1 & Q2 (%)
340
50
0
0
5000
seconds
10000
(e) Step in u1 with u2 constant.
15000
50
0
0
0.5
1
1.5
seconds
2
2.5
(f) Step in u2 with u1 constant.
Figure A.1: Open loop experiences for identification.
4
x 10
200
A
Modelling and Control
Figure A.1 depicts six graphics. The plots corresponding to the first column
show the temporal response of the variables to control (levels in tank 1 and tank
2) when an input step is applied to the first manipulated variable (pump 1) while
the second one (pump 2) is kept constant. In the same way, the three graphics of
the second column show the evolution of these variables when the input step is
applied to the second manipulated variable (pump 2) while the first one (pump
1) remains constant.
It is possible to appreciate that the system presents a similar response to a first
order system with delay and therefore, a model with these characteristics should
be fit to provide a non-parametric description (by means of transfer functions) of
the system (Figure A.3).
Based on the above mentioned, the value of the parameters calculated for the
non-parametric description of the process have been obtained by analyzing the
last step change of the overall time window.
340
330
320
H1 (mm)
H1 (mm)
340
300
280
260
1.1
1.15
1.2
1.25
1.3
seconds
1.35
1.4
1.45
1.5
2
2.3
seconds
2.4
2.5
2.6
4
x 10
(b) H1 (step in u2 with u1 constant).
230
220
H2 (mm)
H2 (mm)
2.2
x 10
220
210
200
210
200
190
1.05
1.1
1.15
1.2
1.25
1.3
seconds
1.35
1.4
1.45
1.5
180
40
Q1 & Q2 (%)
50
40
30
20
1.1
1.15
1.2
1.25
1.3
seconds
2.1
2.2
1.35
1.4
1.45
1.5
4
x 10
(e) Step in u1 with u2 constant.
2.3
seconds
2.4
2.5
2.6
4
x 10
(d) H2 (step in u2 with u1 constant).
50
1.05
2
4
x 10
(c) H2 (step in u1 with u2 constant).
10
2.1
4
230
Q1 & Q2 (%)
310
300
1.05
(a) H1 (step in u1 with u2 constant).
190
320
30
20
10
2
2.1
2.2
2.3
seconds
2.4
2.5
2.6
4
x 10
(f) Step in u2 with u1 constant.
Figure A.2: Temporal window to calculate of the model parameters.
From data in Figure A.2, it is possible to get the parameters of the first order
transfer functions that relate the action of each of the pumps with the liquid
levels inside the tanks T1 and T2 , i.e., the representation in blocks diagram of the
process such as is shown in Figure A.3.
201
A.1 The Three-tank system: Modelling and control
G(s)
g11(s)
q1
+
+
h1
g12(s)
g21(s)
g22(s)
q2
+ +
h2
Figure A.3: Three-tank system representation by transfer functions.
Table A.1 contains the first order model parameters for each transfer function.
Table A.1: Parameters obtained from the identification process.
gij (s) T0 (seconds) Tp (seconds) K(cm/volts)
g11 (s)
0
405
2.4
g12 (s)
46.5
475.5
0.925
g21 (s)
49.5
400.5
1.167
g22 (s)
0
364.5
0.95
Finally, the description by means of transfer functions is shown in the equations A.8 and A.9:
2.4
0.925e−46.5s
Q1 (s) +
Q2 (s)
405s + 1
475.5s + 1
(A.8)
1.167e−49.5s
0.95
Q1 (s) +
Q2 (s)
400.5s + 1
364.5s + 1
(A.9)
H1 (s) =
H2 (s) =
A.1.2
Multivariable control
From a practical point of view, we can run controllers in two different modes:
manual or automatic. In manual mode, the operator directly manipulates the
controller output, typically by moving sliders that increase or decrease it. In automatic mode, a computer or some other automatism generates the controller output signals. Manual mode is most useful during the plant’s startup and shutdown
or in an emergency situation. Conventional controllers have a manual/automatic
switch to transfer the controller from automatic mode to manual.
202
A
Modelling and Control
Interaction study of the variables
Before addressing the design of controllers to be used in automatic mode, a variables interaction study has been done. A multivariable system has a set of input
and output variables which can be coupled with each other. We talk about coupling among variables when the change in one input variable affects to more than
one output variable. Hence, by studing the degree of interaction among variables,
we can decide both the variables pairing and the control strategy.
To analyze both pairing and interaction variables, it is neccesary to get the
steady state gain matrix SSGM and the relative gain array RGA (Morilla 2005,
Vásquez & Morilla 2002). For the system under study, the calculus of the SSGM
is carried out by appling limit (s → 0) to the transfer functions which relate the
input flows Q1 and Q2 with the liquid levels H1 and H2 (see equations A.8 and
A.9). Thus, the SSGM obtained is:
Table A.2: SSGM for the threetank system.
SSGMthreetank
H1
H2
Q1
Q2
2.4 0.925
1.167 0.95
To get the RGA, the following relation for n × n systems (same number of
input and output variables) is used (Bristol 1966):
rga = ssgm. ∗ (inv(ssgm))′
(A.10)
By replacing the SSGM in the equation A.10, we get the RGA:
Table A.3: RGA for the threetank system.
RGAthreetank
H1
H2
Q1 Q2
1.9 -0.9
-0.9 1.9
According the pairing criteria based on RGA, each output should be paired
with the input that presents the relative gain closest to unity, avoiding any pairing
with negative relative gain. Thus, by observing this matrix, the best pairing to
203
A.1 The Three-tank system: Modelling and control
get the less interaction degree between control loops would be: controlling H1
with Q1 and H2 with Q2.
On the other hand, it is necessary to verify whether pairing causes unstability
in closed loop. The Niederlinski theorem (Niederlinski 1971) is used to check
the stability of the system in closed loop. The theorem postulates: “The final
closed-loop system obtained from pairing u1 − y1 , u2 − y2 , ..., and un − yn , for a
n x n process is unstable if the cocient between the SSGM determinant and the
product of the elements in the diagonal is negative”, that is:
NI =
SSGM
n
<0
(A.11)
∏ kii
i=1
By using the previous formule for the threetank system, it is obtained:
N Ithreetank =
(2.4 × 0.95) − (0.925 × 1.167)
= 0.5265
2.4 × 0.95
(A.12)
As the NI obtained is positive, we need additional information to guarantee
the stability in closed loop. This rule is simple and its use is convenient just
steady state information is needed. This information is easily obtained during
the design process.
The interaction study of the variables suggests that a descentralized control
strategy can be applied to control the system.
Decentralized control
A controller objective in our system is to control the liquid level in both T1 and T2 .
From an inspection of the process equations, it seems natural to use the pump flow
rate Q1 (t) to control the level in the first tank h1 (t), and Q2 (t) to control h2 (t).
In this context, previous variables interaction analysis has demonstrated that
such pairing of variables can be applied for controlling the system. This strategy
is often called decentralized control, which is a simple approach to multivariable
controller design in which the matrix transfer function G(s) is a square plant
(2 × 2) to be controlled with a diagonal controller (see Figure A.4).
204
A
Modelling and Control
c(s)
h1_setpoint
h2_setpoint
+
-
e1
c1
u1
c2
u2
h1
G(s)
+
-
e2
h2
Figure A.4: Descentralized control strategy. G(s) is the three-tank system
to be controlled, C(s) is the controller to be designed, and is composed of
two elements C1 and C2. Ci controls the level in tank i. The variables
hi setpoint, ei, ui, and hi are the setpoint to be reached, the error signal,
the control signal and the liquid level in tank i, respectively.
This strategy works well if G(s) is close to diagonal because the plant to be
controlled is essentially a collection of independent subplants, and we can design
each element in the controller C(s) independently, as indicated in Equation A.13:
C(s) = diag {C1 (s)C2 (s)}
(A.13)
A classical and popular technique for designing C1 and C2 is via proportionalintegral-derivative (PID) control. A standard PID controller, also called a threeterm controller, has a transfer function C(s) given by
C(s) = Kp (1 +
1
+ Td s)
Ti s
(A.14)
where Kp is the proportional gain, Ti the integral time, and Td the derivative
time. For the three-term functionalities,
- the proportional term provides an overall control action proportional to the
error signal through the all-pass gain factor;
- the integral term reduces steady-state errors through low-frequency compensation via an integrator; and
- the derivative term improves transient response through high-frequency
compensation via a differentiator.
To calculate the PID controller parameters in each loop (SISO tunning), TITO
environment (Vásquez & Morilla 2002, 1999) has been used. This tool allows: to
205
A.1 The Three-tank system: Modelling and control
simulate 2 x 2 systems with descentralized control in both open and closed loop
with PID controllers, to analyze the performance of the controller design (RGA,
DNA, Gain and Phase Margin measurements), and to comparate several designs
to choose the most optimal. PI controllers (Td = 0) were calculated by using a
TITO environment for the threetank system.
C1 (s) = 3.38(1 +
1
1
) ; C2 (s) = 8.54(1 +
)
56.54s
50.89s
(A.15)
The controllers in A.15 were obtained for a Phase Margin = 60 ○ in a normal
frequency operation range for the system.
Reference tracking and disturbance rejection
Figure A.5 shows the experiment carried out on the threetank system for testing
the performance of the controllers in reference tracking (both simulation and
real testings). The PI controllers used for testing are the previously calculated
(equation A.15).
360
h1sim
h2sim
h3sim
ref1
ref2
h1real
h2real
h3real
340
levels (mm)
320
300
280
260
240
220
200
180
800
1000
1200
1400
1600
1800
2000
2200
2400
2600
2800
time (seconds)
90
q1%sim
q2%sim
q2%real
q1%real
80
% pumps
70
60
50
40
30
20
10
800
1000
1200
1400
1600
1800
2000
2200
2400
time (seconds)
Figure A.5: Tracking references - Three-tank system.
2600
2800
206
A
Modelling and Control
The experiment starts with the tanks in a zone close to the normal operating
point (h1 = 300 [mm], h2 = 200 [mm], h3 = 250 [mm]). Then, the reference
for the tank 1 is risen until 350 [mm] at t = 1000 [sec] and, after that, the
reference for the tank 2 is placed in 250 [mm] at t = 1800 [sec]. The plots in
Figure A.5 show the behaviour of the system under changes in the references in
both simulation and real. We can see that the liquid level for the tank 1 and
tank 2 track perfectly to the setpoint. Furthermore, the control signals do not
reach the pumps saturation for these jumps in the references. Nevertheless, the
controllers implement antiwindup techniques in order to counteract this effect
when saturation levels are reached.
320
h1sim
h2sim
h3sim
h1real
h3real
h2real
levels (mm)
300
280
260
240
220
200
180
500
600
700
800
900
1000
1100
1200
1300
1400
1500
time (seconds)
60
q1%sim
q2%sim
q2%real
q1%real
% pumps
50
40
30
20
500
600
700
800
900
1000
1100
1200
1300
1400
1500
time (seconds)
Figure A.6: Disturbance rejection - Three-tank system.
On the other hand, Figure A.6 shows the behaviour of the controllers under
these sudden changes in the dynamic of the system (disturbances). The experiment starts around the normal operating point. At time t = 600 [sec], the leak
valve of tank 1 is opened at 25% and the leak valve of tank 2 is opened at 15% at
time t = 1000 [sec]. In other words, a disturbance is added to the system at this
moment. We observe that controllers are able to keep the liquid levels around
the operating point in a reasonable time regardless the disturbances.
207
A.2 The DC Motor: Modelling and control
A.2 The DC Motor: Modelling and control
A.2.1
Modelling
The apparatus is composed of permanent magnets that provide a constant magnetic field whose value is weak due to the rotor’s current remains small. Under
this assumption and neglecting the inductance of the coil, the static and dynamic
equations that govern the behavior of the engine can be derived.
Mathematical model
The dymanic model of the DC motor is described by a set of variables:
u(t) [V ]: Voltage applied to the motor.
i(t) [A]: Current in the motor.
ω(t) [rad/s]: Rotational speed of the charge.
Mm (t) [N m]: Torque applied to the motor.
Φ [V s]: Constant flow generated by the inductor.
R [Ω]: Resistence in the motor inductor.
K [N m/AV s]: Constant of the motor.
Jd [N ms2 /rad]: Intertia of the steel disk (charge).
Jf , Jm [N ms2 /rad]: Inertia of the motor brake.
ff , fm [N ms/rad]: Friction coefficients of the motor brake.
The numerical values of the parameters can be obtained in Appendix B. The
voltage supplied to the motor u(t) must be compensated by voltage in the resistence of the inductor Ri(t) and the induced voltage generated by the rotational
motion ui (t):
u(t) = R i(t) + ui (t)
(A.16)
208
A
Modelling and Control
The induced voltage is proportional to the angular speed ω(t) of the motor:
ui (t) = Ke Φ ω(t)
(A.17)
where Ke is a constant associated to the motor and Φ the constant flow generated
by the inductor.
The torque Mm (t) produced by the engine is proportional to the current
passing through it:
Mm (t) = Km Φ i(t)
(A.18)
where Km denotes a constant. On the other hand, a simple energy balance
demontrates that constants Ke and Km are identical, that is:
Ke = Km = K
(A.19)
According to the Newton motion law, the electromagnetic torque supplied to
the motor is given, on one hand, accelerating the engine, the inertia and the
driven magnetic brake and, on the other hand, by compensating for the viscous
friction of the engine and the magnetic brake (the dry friction is ignored):
J ω̇(t) = Mm (t) − f ω(t)
(A.20)
where J is the rotational mass inertia, J = Jm + Jd + Jf and f is the total friction,
f = fm + ff .
For the model based on the experimental setup located in the laboratory, the
influence of the electromechanical pieces to measure and acting on the motor are
taken into account (see Figure A.7):
1
u(z)
Convert
D/A
1
Amplifier
U(s)
A
W(s)
Uw(s)
Kt
Tau.s+1
Tachymeter
Motor
1
s
Integrator
Th(s)
Convert
A/D1
Kp
Uth(s)
Position sensor gain
Figure A.7: Model of the DC Motor.
Convert
A/D2
1
Uw(z)
2
Uth(z)
209
A.2 The DC Motor: Modelling and control
where both the gain A and the time constant τ of the engine can be calculated
through the open loop step response of the system in speed. Kt and Kp are the
tachymeter and the position sensor constants, respectively.
A.2.2
Design of the PID controllers
Speed control
The DC motor is commonly used in processes where an angular speed is required
(for example, in lamination processes). Figure A.8 shows the schematic view of
a typical speed control system. The power amplifier receives a direct voltage U
that excites an induced magnetic field. The output Uw (s) from the tachymeter
is a voltage proportional to the angular speed.
Motor
reference
+
e
-
Controller
Power
Amplifier
U
Load
+
Uw(s)
-
T
Tachymeter
Figure A.8: Typical speed control system.
Figure A.9 illustrates the closed loop control sheme for this process where C
represents the controller used to close the loop.
DC Motor
reference
+
e
-
C
U
G(s)
W
Figure A.9: Control strategy for the DC Motor.
Two control strategies have been developed:
− Manual controller. This operating mode allows studying the system response in open loop without control actions. Simply, the changes carried
out by users will be directly applied on the system.
210
A
Modelling and Control
− PI controller. A PI controller is enough to control the engine speed. Notice
that, although the designed controller is a PI, the full PID control algorithm
has been programmed to test the effect of a derivative action as well.
The PI controller is as follows:
C(s) = Kp [1 +
1
]
Ti s
(A.21)
where:
− Kp is the proportional gain of the controller.
− Ti is the integral time of the controller.
Finally, the closed loop control structure can be seen in Figure A.10.
DC Motor
reference
+
e
U
W
-
Figure A.10: PI control for speed control on the DC Motor.
As known, if controller parameters are well tuned, the system is stable and
non steady state error occurs. In particular, the roots of the system in closed
loop (characteristic polynomial - see the equation A.22),
s2 +
AKp
1 + AKp
s+
=0
τ
τ Ti
(A.22)
are responsible of the oscilatory behaviour of the tachymeter output under step
changes in the input voltage. Thus, a simple pole placement controller design for
first order systems can be applied. With Kp = 0.08, Ti = 0.6 (for τ = 0.253 [sec]
and A = 27 [○ /sec ⋅ volts]) a stable behaviour of the system can be obtained.
Position control
In the same way, the motor DC is used also when a fix angular position of the
system is requiered. For example, to fix the position a robot arm requieres to
211
A.2 The DC Motor: Modelling and control
carry out an accurate position control of the engines in the joints. Figure A.11
illustrates a typical scheme of position control with internal feedback of speed in
which the output of the position sensor Uθ (s) is a voltage proportional to the
angular position of the motor axis.
Motor
reference
+
e
-
controller
Power
Amplifier
U
Load
integrator
position
sensor
Figure A.11: Typical position control system.
The PI parameters of the system in position control mode can be easily obtained from the scheme in Figure A.12. With Kp = 0.08, Ti = 0.6 a stable behaviour of the system in position control can be obtained.
DC Motor
reference
+
e
U
-
Figure A.12: PI controller for position control on the DC Motor.
Reference tracking
Some experiments for testing the performance of the obtained PI controller parameters in both speed and position control have been carried out. The first
experiment starts with the system stabilized around the operating point θ = 150○
in position control mode (see Figure A.13). At 60 [sec], the position reference is
changed to 200○ to observe the dynamic behaviour of the system.
The step response presents an under-damping characteristic with an overshoot
of around 21○ . The steady state is reached in almost 8 [sec], introducing a second
step change at 70 [sec]. Similarly, the steady state in this last test is reached
around 8 [sec]. It is also possible to appreciate that in the steady state the motor
oscillates slightly around the setpoint. Motors usually present a dead zone due
212
A
Modelling and Control
240
angle sim
ref pos
angle real
position (degrees)
220
200
180
160
140
58
60
62
64
66
68
70
72
74
76
78
time (seconds)
5
control signal sim
control signal real
4
3
volts
2
1
0
−1
−2
−3
58
60
62
64
66
68
70
72
74
76
78
time (seconds)
Figure A.13: Tracking reference in position control - DC motor.
to the friction of the mechanism. The dead zone is the input signal range to the
motor where no action occurs in the output. The dead zone for our didacticalsetup under study is about 0.3 [volts].
speed (degrees/sec)
160
vel sim
140
ref vel
120
vel real
100
80
60
40
58
60
62
64
66
68
70
72
74
76
78
time (seconds)
10
control signal sim
volts
8
control signal real
6
4
2
0
58
60
62
64
66
68
70
72
74
76
78
time (seconds)
Figure A.14: Tracking reference in speed control - DC motor.
On the other hand, Figure A.14 displays the closed-loop response of the system
when controlling speed. The tracking of reference in speed control is a bit simpler
than position control because there is not presence of an integrator in the control
213
A.3 The Heatflow system: Modelling and control
scheme. The control parameters has been calculated to get an over-dumped
response under step changes in the setpoint. The experiment starts with the
system running at 50 [○ /sec] in steady state. At 60 [sec] the speed reference value
is changed to 140 [○ /sec]. As previously mentioned, there is not overshoot in
the response (over-dumped response) and the new setpoint is reached in around
3 [sec]. It also can seen that control signal is not saturated for this range of
changes in the references.
A.3 The Heatflow system: Modelling and control
A complete thermodynamic model of the system is difficult to derive. In principle
the following equation applies:
Ṫn = F (Vh , Vb , Ta , xs )
(A.23)
where:
Tn → Temperature at the sensor n
Vb → Voltage applied to the blower
Vh → Voltage applied to the heater
Ta → Ambient temperature
Xn → Distance of the sensor n from the heater
Next sections are aimed to study the dynamic behaviour of the system both
in open and close loop. A very simple first order model will be obtained and then,
a feedback controller will be developed. In subsequent experiments, research on
system identification techniques and control of systems with time delay could be
addressed.
214
A
A.3.1
Modelling and Control
Modelling
A simple first order model
To obtain a simple first order model, we can apply step inputs to the heater and
observe the temperature change at each sensor.
Figure A.15 shows one of the plots that are obtained. In this case we see the
temperature in the three sensors (blue = S1 , green = S2 , red = S3 ) with a fixed
flow rate using Vb = 3.0 [Volts] and three different voltages applied to the heater.
Step response in open loop
70
65
Celcius
60
55
S1
S2
S3
50
45
40
35
200
250
300
350
seconds
400
450
500
550
4.5
Volts
4
Vh
Vf
3.5
3
2.5
200
250
300
350
seconds
400
450
500
550
Figure A.15: Step responses at the three sensors when Vh goes from 3 to
4 [volts] and a fan fixed flow rate voltage of 3 [volts].
To design a feedback controller to control the temperature at a desired sensor
location, we need to have a model of the system. Examining Figure A.15 we note
that the step response can be approximated by a simple first order system of the
form:
G
Tn
=
Vh τn s + 1
(A.24)
Now suppose we want to control the temperature at S1 with a fixed flow rate
using Vf = 3. Examining Figure A.15 we note the following:
215
A.3 The Heatflow system: Modelling and control
Applying Vh = 4 [volts] to the heater results in a temperature change of
approximately 21.5 degrees (65.5 - 44). The time constant is the elapsed time
to reach a 63.2% of the total change. In this case that would be approximately
44+0.632*21.5 = 57.588 degrees (approximately). Examining the figure we see
that 57.588 degrees is reached in about 17.9 seconds from the time when the step
input is applied (t = 212 [sec]).
So a simple first order approximation for the open loop model is:
21.5
T1
=
Vh 17.9s + 1
(A.25)
The same procedure should be followed to get a simple first order model for
sensors 2 and 3.
A.3.2
Controller design
Now, the design of a feedback controller to regulate T1 with zero steady state
error will be addressed. Notice that the procedure for designing controllers for
sensors 2 and 3 should be the same.
The controller is a simple PI of the form:
Vh = Kp (T1ref − T1 ) +
Ki
(T1ref − T1 )
s
(A.26)
Substituting into the first order model we obtain the closed-loop transfer
function:
T1
T1ref
=
G(Kp s + Ki )
s2 τ + (Kp G + 1)s + GKi
(A.27)
The denominator can be rewritten as follows:
s2 +
(Kp G + 1)s
Ki
+G
= s2 + 2ξω0 s + ω02
τ
τ
(A.28)
In this way, we can now obtain the gains Kp and Ki for a desired performance.
If we want to specify a peak time and damping ratio the following equation can
be applied:
216
A
Tpeak =
Modelling and Control
π
√
ω0 1 − ξ 2
(A.29)
By replacing equation A.29 in equation A.28, the gains for the PI controller
obtained are:
√
2ξπτ − Tpeak 1 − ξ 2
√
Kp =
GTpeak 1 − ξ 2
Ki =
(A.30)
−π 2 τ
2
GTpeak
(−1 + ξ 2 )
(A.31)
In order to set the gains Kp and Ki , a damping ratio = 0.4 and a time
peak = 12 can be used to compute them. Thus, the PI control parameters are:
Kp = 0.1437 [V /deg] and Ki = 0.0679 [V /(deg ⋅ sec)].
Reference tracking
A simple experiment to show the performance of the PI controller designed for
the control around sensor 1 has been carried out (see Figure A.16).
Closed−loop control around Sensor 1
T1 (celcius)
55
T1sim
T1ref
T1real
50
45
110
120
130
seconds
140
150
4.5
Vhsim
Vhreal
4
volts
160
3.5
3
2.5
110
120
130
seconds
140
150
160
Figure A.16: Tracking reference closing the loop around sensor 1 (constant
voltage applied to the blower of 3 [volts]).
A.3 The Heatflow system: Modelling and control
217
The experiment starts with the system stabilized around the operating point
T1 = 43 [○ C] and U = 3 [volts] (see Figure A.16). At 110 [sec], the temperature
reference T1ref is changed to 53 [○ C]. We can observe that the behaviour of the
system both in simulation and remote mode are similar for the set of control
parameters obtained during the designed process. The system reaches the steady
state in almost 20 [sec] (without saturation of the control signal) which is according to the performance requirements. It is also possible to see that practically
there is not delay between the change of the reference and the control action.
The effect of delays can be better appreciated when performing control around
the sensor 3 because its location is farther from heater and hence, a small lag
between the control action and its effect over the system can be observed.
B
Hardware Description
This appendix provides practical information about the hardware of the didacticalsetups presented in Chapter 4 of this dissertation. Furthermore, the technical
features of the DAQ boards used to sense/actuate on the mechanisms from a LabVIEW program will be described. In this context, three different DAQ boards
have been used to control the plants in the lab: the DAQ-MF614 (from HUMUSOFT s.r.o.), the DAQ-Q8 (from Quanser Consulting) and DAQ-NIPCI6221
(from National Instruments). While the last one can be accessed by using the
LabVIEW native driver library (DAQmx), the second one uses the propietary
LabVIEW driver software supplied by the provider. In the particular case of the
DAQ-MF614, the LabVIEW driver have been written from the scratch in C code.
In this way, the access to the hardware has been standarized to use LabVIEW
for controlling every process.
220
B.1
B
Hardware Description
The Three-tank system datasheet
B.1.1
Hardware
Figure B.1: Three-tank hardware in the Automatic Control Lab - UNED.
The three-tank system consists of three plexiglass-cylinders which are serially
interconnected by stop valves. The pumps 1 and 2 suck distilled water from the
basin, thus supplying the two cylinders on the left and right hand side of the
set-up. The level of the liquid inside the three cylinders is supervised via piezoresistive pressure sensors with integrated test amplifiers. The basin and the three
cylinders present a unit manufactured out of plexiglass (see Table B.2).
Table B.1: System parameters.
Parameter
simbol
Cross-section of tanks
A
Cross-section pipes
Sn
Outflow coeficient between valves 13 az1
Outflow coeficient between valves 20 az2
Outflow coeficient between valves 32 az3
Length container
lsumi
Width container
wsumi
Heigth container
hsumi
Gravity acceleration
g
value
154000 [mm2 ]
50 [mm2 ]
0.38
0.65
0.38
1300 [mm]
360 [mm]
150 [mm]
9810 [mm/sec2 ]
B.1 The Three-tank system datasheet
221
− Dimension sizes and weight of the system:
◾ Length: 1270 [mm]
◾ Width: 360 [mm]
◾ Height: 880 [mm]
◾ Weight: 40 [kg]
− Pumps:
◾ Voltage: +12 [Volt]
◾ Current consumption: 1.4 [A]
◾ Pump performance: 7 [l/min]
◾ Pressure: 1.4 [bar]
− Sensors:
◾ Supply voltage: +8 [V]
◾ Range: 0 ... 70 [mbar]
◾ Output voltage: 1 ... 6 [V]
Actuator with signal adaption unit
The amplifier, the mains supply unit, and a signal adaption unit are contained
inside of a 19”-box. The box offers a free slot for an electrical disturbance module.
− Mains:
◾ 230 [V], 50/60 [Hz] on request 110 [V], 50/60 [Hz]
− Amplifier inputs:
◾ Pump control signals: 0 ... +10 [V]
− Amplifier outputs:
◾ Voltages for the pumps: +12 [V] (PWM)
− Inputs of the signal adaption unit:
222
B
Hardware Description
◾ 3 sensor signals, range: 1 ... +6 [V]
◾ 2 control signals for the pumps in the range: -10 ... +10 [V]
− Outputs of the signal adaption unit:
◾ Liquid levels of cylinders: ±10 [V] +9 [V] = 0 [cm], -8.61 [V] = 60 [cm]
◾ 2 control signals for the pumps in the range: 0 ... +10 [V]
Controller (Option 200-02)
A/D-D/A-card and executable controller program for a PC with PCI slot running
with WINDOWS (for WIN98SE/ME/2000/XP). The controller program provides
a simple menu control (sampling period default 50 [ms], adjustable in the range
1-54 [ms]).
− Inputs: 3 sensor signals with -10/+10 [V] at 12 Bit A/D-converter.
− Outputs: 2 control signals with -10/+10 [V] at 12 Bit D/A-converter and
amplifier.
Program C-source (Option 200-03)
The controller program from Option 200-02 in C++ source with library functions
for graphical outputs, controlling the sampling period as well as controlling the
PC adapter card requires the Borland C++ Builder V6.
Electrical disturbance module (Option 200-05)
The three sensor signals can be disrupted by switches or scaled by potentiometers.
The control signals for the pumps can be scaled via potentiometers.
B.1.2
DAQ MF614 Humusoft Multifunction I/O
The MF 614 multifunction I/O card is designed to connect PC compatible computers to real electrical external signals. The MF 614 contains a 100 [kHz]
throughput 12 bit A/D converter with sample/hold circuit, 4 software selectable
B.1 The Three-tank system datasheet
223
input ranges and 8 channel input multiplexer, 4 independent 12 bit D/A converters, 8 bit digital input port and 8 bit digital output port, 4 quadrature encoder
inputs with single-ended or differential interface and 5 timers/counters.
The card is designed for standard data acquisition and control applications
and optimized for use with Real Time Toolbox for MATLAB. However, in order
to standarize the use of LabVIEW as a software tool to interact with hardware,
a LabVIEW driver to control the card has been written (see Figure B.3).
Figure B.2: Humusoft data acquisition board MF614 and LabVIEW driver.
Figure B.3: LabVIEW driver for Humusoft data acquisition board MF614.
Because of its small size and low power consumption, the MF614 can be used
not only in desktop computers but also in portable computers.
− Eight single-ended 12-bit analog input channels
− Four 12-bit analog output channels
224
B
− Sampling rate up to 100 [kHz]
− 8 digital inputs, 8 digital outputs
− Programmable A/D ranges
− Four quadrature encoder inputs (differential)
− Five counters/timers
− Low power consumption
− Driver for Real Time Toolbox for MATLAB included
− Driver for Real-Time Windows Target
− Driver for xPC Target
− Driver for Windows
Specifications
− Analog Inputs
◾ Channels: 8 single-ended
◾ A/D converter: 12-bit, 10 [µsec] conversion time
◾ Input ranges: ±10 [V], ±5 [V], 0-10 [V], 0-5 [V]
◾ Trigger mode: software
◾ Overvoltage: ±16 [V] max.
− Analog Outputs
◾ Channels: 4 channels, 12-bit
◾ Output Range: ±10 [V]
◾ Output current: 10 [mA] max.
− Digital I/O
◾ Input lines: 8, TTL compatible
Hardware Description
B.1 The Three-tank system datasheet
225
◾ Output lines: 8, TTL compatible
− Timer/Counter
◾ Timer chip: 9513
◾ Timer resolution: 50 [nsec]
− Encoder Inputs
◾ Input channels: 4, single ended or differential
◾ Inputs: A, B, Index
◾ Input frequency: max 2.5 [MHz]
− General
◾ Power consumption: 100 [mA] to +5 [V], 50 [mA] to +12 and -12 [V]
◾ Operating temperature: 0 to 50 [○ C] (32 to 140 [○ F ])
◾ Connector: 2 x DB-37
◾ Interface: PCI
226
B.2
B
Hardware Description
The Heatflow system datasheet
B.2.1
Hardware
Figure B.4: Heatflow hardware in the Automatic Control Lab - UNED.
The heat-flow experiment (HFE) system consist of a duct equipped with a
heater and a blower at one end and three temperature sensors located along the
duct. The power delivered to the heater is controlled using an analog signal. The
fan speed can also be controlled using an analog signal. Fast settling platinum
temperature transducers are used to measure the temperature. Fan speed is
measured using a tachometer and can be used to design speed controllers.
Table B.2: System parameters.
Parameter
Heater maximum power (5V Input)
Blower maximum Airflow (at max speed)
Blower maximum Airflow
Maximum blower speed ( 5 V Input)
Minimum blower speed ( 1 V Input)
Tachometer calibration
Sensor calibration
Duct cross section area
Max wind speed
Temp sensor settling time at max wind speed
Symbol
P
B
BSI
Fmax
Fmin
Ct
Cs
A
Ws
Ts
Value
400
46.9
1.33
3500
2500
1063
20
0.0074
179
4
Units
Watt
CFM
m3/min
RPM
RPM
RPM/V
Deg C/V
m2
m/min
seconds
227
B.2 The Heatflow system datasheet
Table B.3: Dimensions and power requirements.
Dimensions
Power Requirements
50 x 15 x 10 cm VAC
100 - 240
0.5
Kg Amps Max 5
Table B.4: Data acquisition requirements.
Data Acquisition Requirements
Analog inputs
4 0 - 5 V DC
Analog outputs 2 0 - 5 V DC
Calibration
Occasionally it is necessary to calibrate the sensor measurements. To do that, a
measurement of ambient temperature and a DC Voltmeter are required.
1. Power up the system.
2. Open the service panel as shown.
3. Measure S1 and adjust potentiometer P1 such that the voltage is proportional to the room temperature.
4. Measure S2 and adjust potentiometer P2 such that the voltage is proportional to the room temperature.
5. Measure S3 and adjust potentiometer P3 such that the voltage is proportional to the room temperature.
Table B.5 shows the voltages that should be obtained at various temperatures:
Table B.5: Calibration of the equipment.
Temp
Vs
19
0.95
20
1.00
21
1.05
22
1.10
23
1.15
24
1.20
25
1.25
26
1.30
27
1.35
28
1.40
29
1.45
30
1.50
228
B
B.2.2
Hardware Description
DAQ Q8 Hardware in the Loop H.I.L. Board
Figure B.5 shows the acquisition card used to control the Heatflow System. The
Q8 is an innovative H.I.L. control board with an extensive range of input and
output supports. A wide variety of devices with analog and digital sensors as well
as quadrature encoders are easily connected to the Q8. This single-board solution
is ideal for use in control systems and complex measurement applications.
(a) Q8 Hardware in the Loop H.I.L. Board.
(b) Terminal board Q8.
Figure B.5: Q8 acquisition card used to control the Heatflow System.
Figure B.6: LabVIEW driver for the Q8 acquisition card.
The Q8 is a versatile and powerful measurement and control board with an
extensive range of input and output supports. The card can be accessed from
LabVIEW programs by installing the driver (see Figure B.6).
Every Q8 is supplied complete with ribbon cables and a Terminal Board with
standardized connectors, simplifying your hardware integration. The Q8 has 8
single-ended analog inputs with 14-bit resolution (sign-extended to 16 bits in
hardware). With A/D conversion times of 2.4 µs/channel, simultaneous sampling and sampling frequencies of up to 350 [kHz] for 2 channels, the Q8 can
handle even your most demanding performance requirements. All 8 channels can
be sampled simultaneously at 100 [kHz].
B.2 The Heatflow system datasheet
229
The Q8 is equipped with 8 analog outputs, with software programmable voltage ranges and simultaneous update capability with an 8 [µsec] settling time over
full scale 20 [V].
Aside from having 8 x 24-bit single-ended quadrature encoder inputs using
TTL, CMOS, the Q8 uniquely supports simultaneous sampling of all eight encoder
channels. 32 lines of individually programmable digital I/O with Totem-pole outputs provide even more high-speed performance on the Q8.
Additional features include 2 on-board PWM outputs, two 32-bit general purpose counter/timers, watchdog timers and the ability to reconfigure the 8 encoder
counters as 24-bit counter/timers.
When combined with WinCon 4.0 and a PC, the Q8 yields a world of real-time
control possibilities:
− Control virtually any hardware system
− Rapid Control Prototyping
− Hardware-in-the-loop control
− Monitor and control production equipment
− Development of OEM real-time applications
Key Features:
− 8 x 14-bit programmable analog inputs.
− 8x 12-bit D/A voltage outputs.
− 8 quadrature encoder inputs.
− 32 programmable digital I/O channels.
− Simultaneous sampling of both analog and encoder sections.
− 2x 32-bit dedicated counter/timers.
− 8x 24-bit reconfigurable encoder counter/timers.
230
B
Hardware Description
− 2x on-board PWM outputs.
− 32-bit, 33 [MHz] PCI bus interface.
− Supports Quanser real-time control software WinCon (2000/XP).
− Totem Pole digital I/O for high speed.
− Easy synchronization of multiple Q8 boards.
231
B.3 The DC Motor datasheet
B.3
The DC Motor datasheet
B.3.1
Hardware
Figure B.7: DC Motor hardware in the Automatic Control Laboratory UNED.
Figure B.7 shows the hardware components of the DC motor didactical-setup.
The charge is composed of a inertia (steel disk tight to the motor’s axis) and a
viscous friction due to a magnetic brake. The engine is fed through a unity gain
amplifier capable of delivering the power required to the motor.
A tachometer provides a voltage proportional to the angular velocity of the
load. A potentiometer led through a reducer device provides a voltage proportional to its angular position. A similar potentiometer is also available to perform
a eventual change of the reference directly in the equipment. Tables B.6, B.7 and
B.8 show the technical features of the servo mechanism.
Table B.6: Motor parameters.
Parameter
Constant torque
Inertia (tachymeter + motor)
Resistance
Viscous friction coeficient
simbol
KΦ
Jm
R
fm
value
0.030 [N m/A]
24x10−7 [kgm2 ]
5.9 [Ω]
3.82x10⁻⁶ [N ms/rad]
232
B
Hardware Description
Table B.7: Steel disk parameters.
Disk
small
Masse [kg]
0.19
Inertia Jd [kgm2 ] 74x10−6
medium
0.58
342x10−6
large
1.4
1440x10−6
Table B.8: Other parameters.
Parameter
Tachymeter constant (C)
Reductor constant (Rd )
Potentiometer constant (B)
Magnetic brake constant (Jf )
B.3.2
value
0.041 [V s/rad]
1/60
3.37 [V /rad]
2.7x10⁻⁵ [kgm2 ]
The NI PCI-6221 Multifunction DAQ
The National Instruments PCI-6221 is a low-cost multifunction M Series data acquisition (DAQ) board optimized for cost-sensitive applications. M Series devices
are compatible with the following versions (or later) of NI application software:
LabVIEW, LabWindows/CVI, or Measurement Studio versions 7.x, and LabVIEW SignalExpress 2.x.
Figure B.8: The NI PCI-6221 Multifunction DAQ.
Low-cost M Series devices incorporate advanced features such as the NI-STC 2
system controller, NI-PGIA 2 programmable amplifier, and NI-MCal calibration
technology to increase performance and accuracy. To learn more about M Series
technologies, device specifications, and information on recommended cables and
accessories, please refer to the data sheet and specifications (M-Series 2009).
233
B.3 The DC Motor datasheet
Technical features
− Two 16-bit analog outputs (833 [kS/s])
− 10 digital I/O lines; 32-bit counters; digital triggering
− Correlated DIO (2 clocked lines, 1 [MHz])
− 37-pin D-Sub connector to reduce connectivty costs by 80
− Select high-speed M Series for 5X faster sampling rates or high-accuracy M
Series for 4X resolution
− NI-DAQmx driver software and NI LabVIEW SignalExpress interactive
data-logging software
Driver Software
M Series devices work with multiple operating systems using three driver software
options including NI-DAQmx, NI-DAQmx Base, and the Measurement Hardware
DDK. M Series devices are not compatible with the Traditional NI-DAQ (Legacy)
driver of LabVIEW. Figure B.9 shows the NI-DAQmx driver used to control the
NI-PCI6221 board from LabVIEW.
Figure B.9: LabVIEW driver DAQmx for NI PCI-6221.
Application Software
Every M Series data acquisition device includes a copy of NI LabVIEW SignalExpress so you can quickly acquire, analyze, and present data without program-
234
B
Hardware Description
ming. In addition to LabVIEW SignalExpress, M Series data acquisition devices
are compatible with the following versions (or later) of NI application software:
LabVIEW 7.x, LabWindows/CVI 7.x, or Measurement Studio 7.x; or LabVIEW
with the LabVIEW Real-Time Module 7.1. M Series data acquisition devices are
also compatible with Visual Studio .NET, C/C++, and Visual Basic 6.
More resources and information about both DAQ board and driver software can
be found in (DAQ-PCI6221 2009).
C
eMersion Management
This appendix provides information about the management of the eMersion environment from a student handling point of view. This documentation presents
a summary of the available options for this platform, i.e., the options that allow
a new user to start working with the remote experimentation environment and
to discover other new features by himself.
Note: This information is accesible to the students performing the hands-on
laboratories in the UNED from the eMersion environment.
236
C.1
C
eMersion Management
How to work with eMersion
C.1.1
Introduction
This document aims to serve to students as a guide for the management and
handling of eMersion. Through the steps described hereafter, the student will be
able to carry out and complete satisfactorily a remote experimentation session.
Figure C.1: Global view of the eMersion environment running the virtual
laboratory corresponding to the three-tank system.
C.1.2
General description
The experimentation environment meets in its interface all the management features to support and sustain remote and virtual labs for engineering education.
Thus, eMersion aims to provide a Web interface which allows students to perform
their practical experiences as well as they would do in traditional f2f (face-to-face)
laboratory sessions. The environment wrappes this conceptual structure taking
into account that to use remote and virtual labs for engineering education is
necessary to dispose of:
C.1 How to work with eMersion
237
− The documentation associated to the experimentation module, explanations
of the theory to solve the problems, brief description of the hardware to
be remotely manipulated, description of the graphical user interface used
to carry out the remote experiences in simulation and remote mode and,
finally, a description of the experiments to perform.
− The client interface: A Java applet (created by Ejs) to interact with the
process. By means of this GUI is possible to perform the hands-on activities using a mathematical model of the process (virtual-lab), or accessing
remotely to the real plant in the lab through Internet (remote-lab).
The main features of the environment are described in the next section. The
functional architecture of each module that constitutes the system is also presented.
C.1.3
Interface and eMersion functionalities
Figure C.1 shows the remote experimentation environment facade. The functionality of each work module that compose the system is described hereafter.
C.1.3.1 Navegation bar
The navegation bar is located on the top of the eMersion Web-application. This
window allows users to get access to the set of Web modules which compose the
environment. The Objective field contains a description about the fundamental
objective pursued with the experimental activity. On the other hand, each icon
located inside the Navegation area is used to access to the different Web modules
of the system and, at the same time, to the documentation associated to each
practice. The icons are described below:
The client interface of a remote and virtual lab (it also so-called Telemanipulation console) is obtained by pushing this icon. This window allows
students to carry out all the laboratory experiences such as they did it in the f2f
laboratory.
238
C
eMersion Management
The eJournal, the collaborative and shared space for handling data fragments
and user groups, is obtained by clicking on this icon. In this workspace, students
can save, store, and retrieve documents, such as: work reports, images with the
evolution of the experiments and/or data register (it also called fragments) for
later analysis.
The third icon opens a window that contains links to external Web tools.
Currently, the only link allows the access to the automatic bookings system to
make time slot reservations for a later use of the remote systems.
Through this icon all the exercises and theory documentation are accesible.
By clicking on it, an auxiliar window containing a link to the documentation is
popped-up (see Figure C.2).
Figure C.2: Accessing to the documentation of the practice.
This documentation is structured as follows. A first link called Protocol contains the set of activities that a student will must carry out to complete a module
(it is the first document to be consulted at starting to work). The second link
called Interface provides a functional description for each element of the tele-
C.1 How to work with eMersion
239
manipulation console. A third link called Guide contains the theory to afford
the development of the required tasks (system description, mathematical model,
guidelines to fullfil the sequence of activities).
Finally, two additional links are also available as appendixes. The first of
them contains an brief summary about first and second order system analysis
(Appendix 1 ); the second one provides a short description of the Matlab tool
ident for system identification (Appendix 2 ).
The fifth and sixth icons refresh (update) the navegation bar and exist
of the system, respectively.
The Current task area contains a link named Access Protocol. This link allows
to get access to a HTML document describing how to use the eMersion environment. It also shows a indicator of the current task. Finally, the Complements
area is reserved to include new web-components or plug-ins to the experimentation environment. Currently, only the news plugin is available. This functionality
is used as an agenda to report news about the laboratory.
C.1.3.2 Experimentation console
As it was above mentioned, the experimentation console is the Java applet created
by Ejs. This application allows the student to carry out their practical activities
in virtual and remote mode. A complete description of the interface can be
obtained from the icon (Navegation bar) that provides the documentation.
C.1.3.3 Working with eJournal
The eJournal is the container of the work carried out for students. Collaboration
and interaction features are implemented in this space. In this shared workspace,
students are going to store or retrieve their documents which can be files containing information of any kind, as for instance, data registers, image of the evolution
signals scope, the state of the system, notes about experimental results, work reports, etc.
240
C
eMersion Management
The communication between the experimentation console and the eJournal is
performed through the sub-menu called eJournal that is located on the left-top
part of the console. From here, it is possible to save either a graphical image of
the controlled and manipulated variables of the system or a data register in a text
file with extension *.m (to be loaded in the Matlab workspace). When users use
these options, these data files (called data fragments) are automatically stored in
the eJournal. Then, these data fragments can be used by students to generate
their practical reports to be evaluated by the teaching staff.
Figure C.3: Reduced (left) and extended (right) views of eJournal.
In eMersion, the initial view of the eJournal is a simplified version where
students can see the last 10 fragments existing in the current folder as well as
their state and authors. Figure C.3 illustrates an image of this version. Then,
the student can access to the extended version by clicking on the button located
in the lower part of the window. This general view shows the eJournal with all
its functionalities divided into three different sub-spaces. The extended eJournal
version is also shown in Figure C.3.
Subspace “eJournal”
− Access to other eJournals: Allows to get access to the eJournal of other
groups (this option will be not used in this practices).
C.1 How to work with eMersion
241
− Trash: The trash allows to see the data fragments deleted from the current
folder. These fragments can be reloaded in the eJournal workspace or
definitively deleted.
− Language: The language of the interface can be changed by pushing on the
flags located on the right-top part of the interface.
Subspace “Folders”
A folder represents a directory in the workspace. The Inbox folder is a directory
with special features. It is created automatically with the workspace and is used
to receive data from the different components of eMersion as, for example, data
fragments from the experimentation console. This folder can not be renamed or
deleted.
It is possible to create and to rename new folders that allow students to
organize the work carried out. Next, the basic functionalities of the eJournal in
this sub-space are described hereafter:
− Filter : Allows to choose the type of fragment to display in the main window.
There are two ways of filtering:
◾ by type: There are different type of fragments. They can be: fragments
(files) sent from the local hard disk of the student to his/her own
workspace in the eJournal, snapshots from the evolution signals scopes
(GIF images), and text files representing experimental data registers
received from the experimentation console. By this option is possible
to classify the fragments by these three types.
◾ by date: This option allows to classify fragments depending on the
creation date.
Note: It is necessary to refresh the eJournal after each filtering.
− Refresh: Updates the main window that contains the data fragments of the
eJournal. Each time a new fragment is saved or any thing is modified in
the eJournal, pushing this button is mandatory.
242
C
eMersion Management
− New : Creates a new folder. Be carefull not to use special characters of
Windows operating system.
− Rename: Modifies the name of a folder. The Inbox folder can not be
renamed.
− Delete: Eliminates a folder. The Inbox folder can not be deleted.
Subspace “Fragments”
The main functions in this subspace are listed below:
− Copy: This option allows to copy a set of fragments between eJournals or
folders of the same eJournal.
− Move: To move data fragments between eJournals or from one folder to
another in the same eJournal.
− Delete: By using this option, students can delete data fragments. Once
deleted, they are deposited in a new space where is possible to restore or
delete them definitively.
Figure C.4: The trash in the eJournal.
− Rename: This option allows to rename a data fragment.
− Import: This function allows to upload to eJournal a data fragment from
the local hard disk. It is possible to attach notes to the uploaded file.
− Export: By using this option, students can download (export from eJournal
point of view) fragments from eJournal to their local hard disk.
243
C.1 How to work with eMersion
Figure C.5: Export fragment “registroRealQ1.m” to the local hard disk.
− Send: By this option, students can send messages with questions to the
teacher assistants. Fragments from the workspace can be attached to the
messages. Figure C.6 shows the dialog window to send a message.
Figure C.6: Sending fragments by the dialog window Send.
The list of fragments is displayed in a table located at the lower part of
the eJournal interface (see Figure C.7). The displayed files depend on the
selected filter and the current work folder. It is also possible to add complementary information to the fragments to make them more comprehensibles.
For instance, in this space users can find information about date time of
creating of fragments, author, fragment size, etc. Even it is possible to display them in a cronological order. By dragging the mouse over a fragment,
a short description about its source is shown. This information includes:
the creation time, work module, task, size, etc.
244
C
eMersion Management
Figure C.7: Fields description of the fragments table.
On the other hand, by clicking on a fragment users can select open or save
the fragment (this action depends on the browser and type of fragment).
Some basic fragment types are described below:
◾ External Fragment: Fragments imported to the eJournal from the user
local hard disk (for example, reports in format *.doc or *.pdf).
◾ Image: Fragments of image type obtained from experimentation console. The format by default is *.gif.
◾ Result: Data registers obtained from a simulated or real experimental
session. An example would be the registers *.m containing measurements.
The fields of the fragment container table provide information about each
one of them:
◾ Name: Name of the fragment.
◾ Author : Owner of the fragment.
◾ Task : Shows whether fragment has been assigned to a task. The action
to assign a fragment to a task is done by clicking on this simbol.
◾ Status: Helps to visualize the state of a fragment.
◾ Creation: Date and time of creating a fragment.
245
C.1 How to work with eMersion
◾ Annotation: Allows users to associate notes to fragments. Each annotation is added as a attribute of a fragment. By this mechanism,
students can generate sets of annotations associated to particular fragments. For example, the creator of the fragment can link an annotation to the fragment and make a question about the obtained results.
Then, another user (or even a teacher assistant) can answer the question adding new annotations to the fragment. Figure C.8 shows the
dialog window to attach comments to a fragment.
Figure C.8: Adding annotations to a fragment.