1
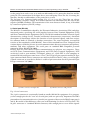
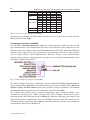
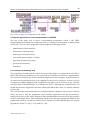
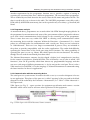
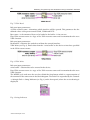
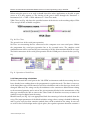
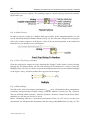
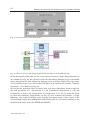
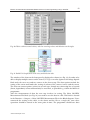
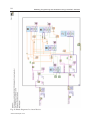
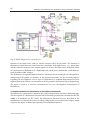
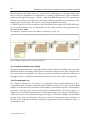
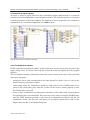
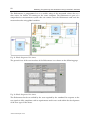
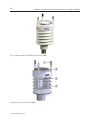
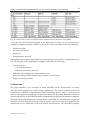
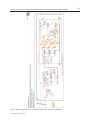
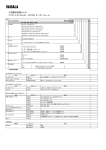
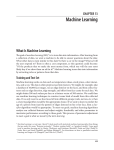
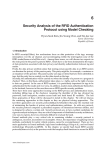
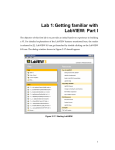
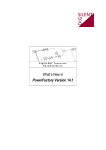
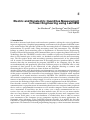
0
3
Electric and Nonelectric Quantities Measurement
in Power Engineering using LabVIEW
Jan Machacek1 , Jan Slezingr2 and Jiri Drapela3
Brno University of Technology
Czech Republic
1. Introduction
We need to measure both electric and nonelectric quantities solving the series of problems
in power engineering. Graphical programming environment of the program LabVIEW seems
to be useful helper and provides good tool for measuring both an automatic independent
measurements of specific tasks, using measuring cards and instruments. The LabVIEW
belongs to widely used measuring tools at Department of Electrical Power Engineering,
Faculty of Electrical Engineering and Communication power engineering, Brno University of
Technology. Since the LabVIEW is used to solve a number of projects at our department and
there is only limited space in this article, we decided to mention only the most interesting
ones. The first project deals with measuring operating characteristics of the photovoltaic
cell. It consists of standard interconnection of measuring devices (producer Metex), which
measure data that are transferred by program LabVIEW to the computer. Next, the data
are mathematically and graphically processed. Different projects in LabVIEW offer a wide
spectrum of front panels in the framework of this program allowing to connect each
measuring device by its specific way. Some of them are listed here.
Another of the many tasks developed at our department is an autonomous measurement of
electric and non-electric quantities of photovoltaic and wind power installation. A specific part
of this project included the connection of meteorological station VIASALA which required
a particular set of control interfaces created by LabVIEW. The LabVIEW environment has
also created a comprehensive measurement system for detection of resistance of modern light
sources to interference in the voltage supply, as well as a system to test and develop devices
to measure the flickering of light sources. The system is implemented on the PXI platform.
First describes control of serial communication in LabVIEW software here, because serial
communication is a popular means of transmitting data between a computer and a peripheral
device such as a programmable instrument or even another computer. Serial communication
uses a transmitter to send data, one bit at a time, over a single communication line to a
receiver. You can use this method when data transfer rates are low or you must transfer
data over long distances. Serial communication is popular because most computers have
one or more serial ports, so no extra hardware is needed other than a cable to connect
your instrument to the computer (or two computers together). In many applications, the
electronics takes advantage of the LabVIEW program provides. It is mainly the fact that
LabVIEW is a graphical programming language that uses icons instead of lines of text to create
applications. In contrast to text-based programming languages, where instructions determine
www.intechopen.com
40
Modelling, Programming and Simulations Using LabVIEW™ Software
program execution, LabVIEW uses dataflow programming, where the flow of data determines
execution. In LabVIEW, you build a user interface with a set of tools and objects. The user
interface is known as the front panel. You then add code using graphical representations of
functions to control the front panel objects. The block diagram contains this code. In some
ways, the block diagram resembles a flowchart.
2. Serial communication between LabVIEW and simple meter
Serial communication requires that you specify four parameters: the baud rate of the
transmission, the number of data bits encoding a character, the sense of the optional parity
bit, and the number of stop bits. Each transmitted character is packaged in a character frame
that consists of a single start bit followed by the data bits the optional parity bit, and the stop
bit or bits. A typical character frame encoding the letter “m”is shown here Lab (2006).
Fig. 1. Typical character frame encoding the letter “m”Lab (2006).
Baud rate is a measure of how fast data is moving between instruments that use serial
communication. RS-232 uses only two voltage states, called MARK and SPACE. In such
a two-state coding scheme, the baud rate is identical to the maximum number of bits of
information, including “control”bits, that are transmitted per second.
MARK is a negative voltage and SPACE is positive; the previous figure shows how the
idealized signal looks on an oscilloscope. The truth table for RS-232 is:
Signal > +3 V = 0
Signal < -3 V = 1
The output signal level usually swings between +12 V and -12 V. The “area dead”between
+3 V and -3 V is designed to absorb line noise.
A start bit signals the beginning of each character frame. It is a transition from negative
(MARK) to positive (SPACE) voltage; its duration in seconds is the reciprocal of the baud rate.
If the instrument is transmitting at 9600 baud, the duration of the start bit and each subsequent
bit will be about 0.104 ms. The entire character frame of eleven bits would be transmitted in
about 1.146 ms.
“Data bits”are transmitted “upside down and backwards”. That is, inverted logic is used and
the order of transmission is from least significant bit (LSB) to most significant bit (MSB). To
interpret the data bits in a character frame, you must read from right to left, and read 1 for
negative voltage and 0 for positive voltage. For the figure above, this yields 1101101 (binary)
or 6D (hex). An ASCII conversion table shows that this is the letter “m”.
An optional parity bit follows the data bits in the character frame. The parity bit, if present, also
follows inverted logic (1 for negative voltage and 0 for positive voltage.) This bit is included
as a simple means of error checking. You specify ahead of time whether the parity of the
transmission is to be even or odd. If the parity is chosen to be odd, the transmitter will then
www.intechopen.com
Electric and Nonelectric Quantities Measurement in Power Engineering using LabVIEW
41
set the parity bit in such a way as to make an odd number of 1’s among the data bits and the
parity bit. The transmission in the figure above uses odd parity. There are five 1’s among the
data bits, already an odd number, so the parity bit is set to 0.
The last part of a character frame consists of 1, 1.5, or 2 stop bits. These bits are always
represented by a negative voltage. If no further characters are transmitted, the line stays in the
negative (MARK) condition. The transmission of the next character frame, if any, is heralded
by a start bit of positive (SPACE) voltage.
2.1 Serial port (RS-232)
The RS-232 is a standard developed by the Electronic Industries Association (EIA) and other
interested parties, specifying the serial interface between Data Terminal Equipment (DTE)
and Data Communications Equipment (DCE). The RS-232 standard includes electrical signal
characteristics (voltage levels), interface mechanical characteristics (connectors), functional
description of interchange circuits (the function of each electrical signal), and some recipes
for common kinds of terminal to modem connections. The most frequently encountered
revision of this standard is called RS-232C. Parts of this standard have been “adopted”(with
various degrees of fidelity) for use in serial communications between computers and printers,
modems, and other equipment. The serial ports on standard IBM compatible personal
computers follow RS-232 Lab (2003).
Devices that use serial cables for their communication are split into two categories. These
are DCE (Data Communications Equipment) and DTE (Data Terminal Equipment.) DCE
are devices such as your modem, TA adapter, plotter, etc., while DTE is your computer or
terminal. RS-232 serial ports come in two “sizes”, the D-Type 25-pin connector and the D-Type
9-pin connector. Both of these connectors are male on the back of the PC; thus, you will require
a female connector on your device. Below is a table of pin connections for the 9-pin and 25-pin
D-Type connectors Lab (2006).
(a) DB-9 connector and pinouts.
(b) DB-25 connector and pinouts.
Fig. 2. Serial connectors
The 9 pin’s connector is occasionally found on smaller RS-232 lab equipment. It is compact,
yet has enough pins for the “core”set of serial pins (with one pin extra). Important: The DB-9
pin numbers for transmit and receive (3 and 2) are opposite of those on the DB-25 connector (2
and 3). Be careful of this difference when you are determining if a device is DTE or DCE. The
29 pin’s connector is “standard”RS-232 connector, with enough pins to cover all the signals
www.intechopen.com
42
Modelling, Programming and Simulations Using LabVIEW™ Software
Function
signal 9 pin 25 pin
TxD
Data
RxD
RTS
CTS
Handshake DSR
DCD
DRT
Common
Com
Other
RI
3
2
7
8
6
1
4
5
9
2
3
4
5
6
8
20
7
22
DTE
DCE
Output
Input
Output
Input
Input
Input
Output
Input
Input
Output
Input
Output
Output
Output
Input
Output
Table 1. Lines of serial interface Lab (2006).
specified in the standard. The table shows only the “core”set of pins that are used for most
RS-232 interfaces Lab (2003).
2.2 Control of serial port in LabVIEW
The LabVIEW Instrument I/O Serial subpalette contains functions and VIs used for serial
port communication. You should notice that some of the functions in this subpalette are the
VISA functions you used previously for GPIB communication. The VISA Write and VISA Read
functions will work with any type of instrument communication and are the same whether
you are doing GPIB or serial communication. However, because serial communication
requires you to configure extra parameters, you must start the serial port communication with
the VISA Configure Serial Port VI.
Fig. 3. VISA configure serial port Lab (2006).
The VISA Configure Serial Port VI initializes the port identified by VISA resource name to
the specified settings. Timeout sets the timeout value for the serial communication. Baud rate,
data bits, parity, and flow control specify those specific serial port parameters. The error in
and error out clusters maintain the error conditions for this VI Lab (2003).
The example above shows how to send the identification query command *IDN? to the
instrument connected to the COM2 serial port. The VISA Configure Serial Port VI opens
communication with COM2 and sets it to 9600 baud, 8 data bits, odd parity, one stop bit, and
XON/XOFF software handshaking. Then the VISAWrite function sends the command. The
VISA Read function reads back up to 200 bytes into the read buffer, and the error condition is
checked by the Simple Error Handler VI.
www.intechopen.com
Electric and Nonelectric Quantities Measurement in Power Engineering using LabVIEW
43
Fig. 4. The example of configuration. Lab (2006).
2.3 Specific application of serial communication in LabVIEW
The aim of the study was to create a measurement programme within a Lab VIEW
programming environment for a laboratory task of “efficiency measurement of photovoltaic
conversion”. The use of the programme has brought the following benefits:
– digitalization of measurement,
– automation of measurement,
– archiving of measured values,
– easy further processability of values,
– immediate graphic processing,
– speed of measurement,
– and others.
2.3.1 Analysis of laboratory task
The programme should read the values of current and voltage on a photovoltaic cell. This is
done with two Metex multimeters, one connected as a Voltmeter, the other as a Amperemeter.
The values measured by the devices should be displayed on the computer. A good solution is
to connect the measuring devices to the computer by means of a serial port. As there was not
a computer available equipped with two RS-232 serial ports, it was necessary to use a Delock
converter from a RS-232 interface to a USB for one device. Although the communication via
the RS-232 interface compared to the more advanced USB is rather slow, it is wholly sufficient
for this task.
The value from the measurement devices is displayed on the computer screen at once, without
delay, and that is why the programme meets another requirement for the measurement,
namely the recency of the values displayed. Data should further be processed in the structure
of tables and simple charts. This requirement has been met by using appropriate blocks in the
programme which as a result saves data in three columns of a table and then plots the current
dependency charts: P = f(I), U = f(1) and P,U = f(I).
www.intechopen.com
44
Modelling, Programming and Simulations Using LabVIEW™ Software
Another requirement for the programme function was to provide a option of saving or
exporting the measured data into a different programme. The measured data programme.
This is enabled by one block that asks the user to enter the file name and path to the file. The
data is saved in the way as shown in the table. The LabVIEW programme creates files with a
LVM suffix (LabVIEW Measurement), that can be opened in any text editor, e.g. NotePad, MS
Word.
2.3.2 Programme analysis
As mentioned above, programmes are created within Lab VIEW through merging blocks. In
the programme for measurement only some of the great amount of those prepared in advance
were used. Serial communication surely belongs to the essential parts of the programme.
There is more than one way within Lab VIEW to effecting serial communication within
the measuring device and the computer. Within the Functions -> Instrument I/O -> Serial
palette we will find nodes for communication with a serial port. These are now referred to
as “old-fashioned”. Their use is no longer recommended at present. They are included in
the palette to provide compatibility with the earlier applications. The author had difficulty
operating the control lines of the serial port using these functions. The other possibility of
operating the port is to use e.g. library .dll which exports the relevant functions. The author,
though, has not used the mentioned procedure either.
The National Instruments company has developed a higher level comprehensive interface
for the control of peripheries, named NI-VISA. This is basically a set of what is called “API
functions”, that can be generally called from almost any programmable language and that
can use a wide range of differing instruments, i.e. by far not just the serial port. There is also a
VISA interface for LabVIEW, i.e. for the language G. National Instruments recommends using
the latter interface for the new applications.
2.3.3 Communication with the measuring device
The serial port is a system means. In order to be able to use it, we need to designate it for use
in our application. This phase of the port use is called “opening”of the port and in the block
diagram it will be realized by the Functions ->Instrument I/O -> VISA -> VISA Advanced ->
Visa Open node.
VISA Open (see Fig. 5) - opens sessions for equipment specification and returns a session
identifier which can be used to call some other operations of this equipment.
Fig. 5. VISA Open with VISA Resource Name constant.
www.intechopen.com
Electric and Nonelectric Quantities Measurement in Power Engineering using LabVIEW
45
Relevant input parameters:
A VISA resource name - indicates category and source of the open VISA sessions. The session
does not have to be the correct one. Only the category of sessions and the resource name are
relevant.
The relevant output parameters:
A VISA resource name - is the source where a session and its category are opened. The
category has to match the input VISA resource name.
A VISA Resource Name constant will be created through right-mouse clicking on the node
and selecting the Create Constant option on the menu that will appear. Then we will define the
value of the constant in the pulldown menu. We will be able to choose from several options,
depending on what interfaces are installed in the system at that moment. ASRL1::INSTR is the
code for the first serial port, and similarly ASRL2::INSTR codes the other serial port.
Next the communication parameters will need to be set, i.e. the Baud Rate (speed of
communication) to 1200, the number of Data Bits to 7, the number of Stop Bits to 2.0, and
the level of RTS State control line to Unasserted. We will set the parameters for the open port
using the Functions - Instrument I/O -> VISA - VISA Advanced -> Property Node.
The Property Node (see Fig. 6) - This node has an adjustable number of input and output
terminals. In the individual Property Node arrays the required property can be set up. Each
array is either designed for reading or for entry. We will set this property in the menu by the
right - mouse clicking (“Change to Read”, resp. “Change to Write”items). To summarize, we
will choose the needed properties, set them for writing and assign values to them using the
constants.
Fig. 6. Property Node with the set transmission parameters.
After that we will use the WHILE cycle and repeatedly execute entering of the CD command
to the port and reading of the string (fourteen symbols for the Metex multimeters) from the
port. The Functions -> Instrument I/O -> VISA -> VISA Read node is used for reading and
the Functions -> Instrument I/O -> VISA -> VISA Write node for writing.
VISA Read (see Fig. 7) - the function is reading the prescribed number of bytes from the
designated device or interface.
www.intechopen.com
46
Modelling, Programming and Simulations Using LabVIEW™ Software
Fig. 7. VISA Read.
Relevant input parameters:
A VISA resource name - determines which interface will be opened. This parameter has the
defined values of the ports named COM1, COM2 and LPT1.
Byte count - is the amount of bytes to be loaded to the buffer - 14 in our case.
Dup VISA resource name is a copy of the VISA resource name and is transmitted to the next
VISA function.
Relevant input parameters:
Read buffer - transmits the symbols read from the entered interface.
VISA Write (see Fig. 8). Enters data from the “write buffer”to the device or interface specified
in the VISA resource name.
Fig. 8. VISA Write.
Relevant input parameters:
write buffer - contains data to be entered in the device.
Dup VISA resource name is a copy of the VISA resource name and is transmitted to the next
VISA function.
The WHILE cycle ends once the user has clicked the Stop button which is a representation of
the terminal of the same name in the block diagram. The node D is responded by the Controls
-> String & Path -> String Indicator (see Fig. 9) on the front panel, where the received string is
displayed.
Fig. 9. String Indicator.
www.intechopen.com
Electric and Nonelectric Quantities Measurement in Power Engineering using LabVIEW
47
When using the port is at an end, it should closed for other applications to be able to gain
access to it if they request to. The closing of the port is done through the Functions ->
Instrument I/O -> VISA ->VISA Advanced -> Visa Close node.
VISA Close (see Fig. 10) closes the specified session of the device or the resulting object. VISA
Close accepts all the available categories.
Fig. 10. Visa Close.
The general view of the serial port operation:
We have two measuring devices connected to the computer over two serial ports. Within
the programme the serial port operation has to be executed twice. The simplest serial
communication will be activated by just connecting of all the aforementioned blocks in a row.
The block connection of the serial port operation for the COM2 port is shown below (see Fig.
11):
Fig. 11. Operation of Serial Port.
2.3.4 Data processing, calculations
We have activated the serial port in the Lab VIEW environment and the measuring devices
have already been sending data to the programme in regular intervals. The data is, however,
of the String data type which cannot be used for calculations and so the data type needs to be
changed. Moreover, the string sent by the multimeter also contains an abbreviation relating
to the measured quantity and a unit of the given quantity, blocks for the transmission of the
data type would not be able to convert the values and it is therefore necessary to remove all
symbols except for digits from the string.
Match Pattern (see Fig. 12) is an appropriate block for removing of selected symbols from the
string. The input parameters of the block include a string, where a string is loaded for filtering,
and a regular expression that contains symbols that will be retained in the string. In our case
we wish to leave all the digits and a sign in place, the regular expression therefore contains a
www.intechopen.com
48
Modelling, Programming and Simulations Using LabVIEW™ Software
string of the necessary symbols. The resulting output is a match substring which only contains
digits and a sign.
Fig. 12. Match Pattern.
In order to convert a string to a “double”data type used by all the computing blocks, we will
use the Fract!Exp String To Number block (see Fig. 13). We will send a string to the string input
and on the number output we will obtain a value of the measured quantity in the numerical
form that we can already use for calculations.
Fig. 13. Fract/Exp String to Number.
From the serial ports’ outputs we have obtained the Voltage U and Current I values, flowing
through the FV (photovoltaic) cell. We will calculate the Performance P value by using the
Multiply block (see Fig. 14) which can perform multiplication between the numbers brought
to the input x and y, and their product then appears on the output.
Fig. 14. Blok Multiply.
We will set the value of an impact performance Pdopad , to be calculated based on pyranometer
sensitivity and pyranometer output voltage, using the Numeric Control (see Fig. 15) block.
This we will find within Controls - Numeric Controls - Numeric Control on the Front Panel.
Similarly, we will also set the size of area S.
Before calculating efficiency a maximum performance Pmax of a FV cell yet needs to be
determined. We will obtain the maximum value by using a Max&Min block (see Fig. 16). The
www.intechopen.com
Electric and Nonelectric Quantities Measurement in Power Engineering using LabVIEW
49
Fig. 15. Numeric Control on the Front Panel and Block Diagram.
Fig. 16. Max&Min.
Max&Min block downloads the values transferred to its inputs, which results in the value on
the Max output.
Using the Multiply block (see Fig. 14) we will determine the area capacity rating Pplon as the
product of a maximum performance Pmax and a cell area S.
The values Pdopad and Pplon are known to us, and using the Divide block we can determine
the efficiency of a FV cell. The Divide block (see Fig. 17) executes the quotient of two values
transferred to its inputs, and the output shows the quotient as the result. The quotient and
the product could also be determined using the Formula block, but the Multiply and Divide
blocks are sufficient for calculations this simple.
Fig. 17. Blok Divide.
The immediate value of efficiency η, along with the values of Current I, Voltage U,
Performance P, Cell Area S and Impact Performance Pdopad can be displayed on the front panel
(see Fig. 18).
The front panel further consists of a table to which we enter the measured values. The block
for the table is placed in Controls -> Text indicators -> Table (see Fig. 19). In order to be able to
write at the same time the values of current, voltage and performance to the table, we need to
use the Merge Signals (see Fig. 19) block which will merge the signals into a single one which
we will bring to the single input of the table. We can set the number of columns and rows in
the table, in our case 3 columns and 20 rows. The options further provide for the display of
headings for columns and rows and of a scroll-bar.
www.intechopen.com
50
Modelling, Programming and Simulations Using LabVIEW™ Software
Fig. 18. Current values on the Front panel.
Fig. 19. Table of values with Merge Signals block and tabs for entry and deletion.
On the front panel of the table we can see the values of current, voltage and performance in
the columns (see Fig. 20). We will enter values into the table by bringing Log 1 to the Enable
input, and perform the table deletion by bringing Log 1 to the Reset input. These operations
are executed by means of two tabs on the Front panel, to be found in the Controls -> Buttons
& Switches -> Text Button (see Fig. 20).
We can plot the measured values in charts; there were three dependence charts needed for
this task, specifically VA - characteristic U = f(I), Performance characteristic P = f(I) and
Performance as well as VA characteristics in a single chart U,P = f(I). To create the charts
we chose three Build XY Graph blocks (see Fig. 21), to be found in the Controls -> Graph
Indicators ->XY Graph. Each block of the chart has two inputs for the values x and y on the
axis and further inputs for enabling Entry and Deletion, that we will connect similarly as for
the block of the table, to the tabs ENTER and DELETE.
www.intechopen.com
Electric and Nonelectric Quantities Measurement in Power Engineering using LabVIEW
51
Fig. 20. Table with measured values, tabs for entering values and deletion on the right.
Fig. 21. Build XY Graph block with entry and deletion tabs.
The window of the chart on the front panel is displayed as shown (see Fig. 22). In order to be
able to display multiple courses on the chart U,P = f(I), we need to again use the Merge Signals
block and select two axes and two courses in the chart setup. The chart options include the
setting of the cursor and further the setting of colours of the courses/curves and the cursor.
The chart can connect points (values) in several ways, though any connecting line of a trend
(linear, logarithmic) cannot unfortunately be used here, as provided e.g. within the MS Excel
programme.
After the measurement of data the next step involves its saving. The Write LabVIEW
Measurernent File block (see Fig. 23) was used to save the data in a file. This block is located
in the Function -> Output -> Write LabVIEW Measurement File in the Block diagram. I have
connected the writing to the table, to the charts and the file to a single tab, since these
operations should be started at the same point in time. The programme should save data
www.intechopen.com
52
Modelling, Programming and Simulations Using LabVIEW™ Software
Fig. 22. Grafy na pøedním panelu.
to a single file, give the user a possibility of choosing a path to the file and the file name, and
that is why I have chosen to use t’Action -> Save to one file -> Ask user to choose file -> Ask
only onet’ in the block setting. During the first measurement a dialog box appears to save a
file (see Fig. 23). Within the block setting you can further select display of a heading for a file
and time of measurement. To delete the content of a file we use the DELETE tab, which is
common for the table and the chart. The LabVIEW programme creates files with a LVM suffix
(LabVIEW Measurement), that can be opened in any text editor.
Fig. 23. Dialog box for writing to a file.
Overall view of the front panel and the block diagram is shown below.
www.intechopen.com
Electric and Nonelectric Quantities Measurement in Power Engineering using LabVIEW
Fig. 24. General view of the front panel of a virtual device.
www.intechopen.com
53
54
Modelling, Programming and Simulations Using LabVIEW™ Software
Fig. 25. Block diagram of a virtual device.
www.intechopen.com
Electric and Nonelectric Quantities Measurement in Power Engineering using LabVIEW
55
This is an example of a functioning virtual device which communicates through a serial line
with a real measuring device, visualizes the measured values and further processes them.
This is one of the basic uses of Lab VIEW for the construction of a practical application.
A device constructed in this way, or a source code, can be further compiled to form a separate
application independent of the LabVIEW programming environment.
The following picture is just a sample design of Metex, a simple virtual device communicating
through a serial port.
Fig. 26. Block diagram of a Metex 4560 cr. virtual device.
VISA configurator module is used again for communication via a serial port, which is,
however, part of a “sub vi”application. The other blocks are just the means to process, control
and display data. A detailed analysis of this application, however, is not the focus of this
paper.
3. Flickermeter in the LabVIEW environment
3.1 Introduction
One of the major problems in regard to the quality of electric power involves quick changes
in the voltage, i.e. its fluctuation, causing flickering of the light flow from the light sources.
The light flow flickering may subsequently create an undesired perception of flickering which
adversely impacts visual performance. This is a subjective visual impression initiated by a
light stimuli, whose brightness or spectral distribution changes in time. The flickering of light
sources may cause mental or physical fatigue or major physiological discomfort in people.
Voltage fluctuation may be caused by interference during the generation, transmission,
distribution and consumption of electricity. The voltage fluctuation in the grid may be due
especially to the fluctuation of active and reactive power of some appliances.
In order to measure the degree of perception of flickering was developed a UIE/IEC
flickermeter which based on the measurement of voltage fluctuations evaluates the
corresponding level of perception of flickering. The flickermeter models the transmission
www.intechopen.com
56
Modelling, Programming and Simulations Using LabVIEW™ Software
Fig. 27. Block diagram of a virtual device.
function of the light source and eye and the memory effect on the brain. The function of
flickermeter is based on two critical activities: simulation of the light source - eye - brain chain
and the statistical analysis of the output signal in real time. The light source modelled within
the construction of flickermeter is a light bulb with a 60 W power and double coiled filament,
rated for 230 or 120 V voltages.
The flickermeter is typically implemented as a function in the measuring devices designed for
monitoring of the quality of electricity in the electrical networks. For the research purposes
regarding the development of new types of flickermeter, a standard flickermeter has been
implemented in the Labview environment at the Department of Electrical Power Engineering.
The meter is used as a reference instrument for the new development constructions of
flickermeter.
3.2 Implementation of the flickermeter in the LabView environment
The flickermeter construction is based on the study of human brain reaction to flickering light.
The description of a flickermeter function and its detailed specification is included in the EN
61000 - 4 - 15 standard, see IEC (1997). The flickermeter function has been described in the
introduction. It evaluates the course of voltage and provides a Pst value for the output, which
expresses the degree of flicker perception by the normalized observer.
www.intechopen.com
Electric and Nonelectric Quantities Measurement in Power Engineering using LabVIEW
57
The flickermeter described in the standard is an analogue measuring device. The present-day
digital measuring devices use a modified version of the standard flickermeter. S-transmission
functions of analogue filters, used for describing the device in the standard, have been
transformed into a digital form using bilinear Z-transformation.
UIE / IEC flickering-meter model was constructed as a virtual device within LabView. It is
made up of the following basic blocks:
– voltage measurement,
– input signal normalization,
– filtration and weighting,
– statistical analysis.
Fig. 28. Block diagram of a virtual device.
3.3 Voltage measurement
The voltage measurement uses the NI-PXI 4472 measurement card which is able to measure
voltage in the range +-1OV. To measure the mains voltage it is necessary a ballast that will
modify the magnitude of voltage; Slezingr et al. (2009).
The card’s inputs are galvanically separated and properly isolated so it is possible to bring the
mains voltage potential to the input terminals. This allow for using the voltage modification
with a resistance voltage divider proven to provide the highest accuracy and linearity in the
broad frequency range.
Voltage measurement for the flickermeter in the LabView block diagram is taken by means
of express VI DAQ Assistant from the Input palette. The assistant automatically finds the
measurement cards connected to the computer and mediates their configuration by the user.
The measurement card is then represented by a single block in the block diagram, whose
output is a data flow with an excessive quantity.
The measurement card connection is detailed in the LabView Help. For the purpose of
flickermeter operation it was necessary to set an “Acquire Continuously”option in the Task
Timing tab. A sampling frequency is set for the required 3200 S/s. The sampling frequency
selection has to be made right at the start of flickermeter designing as all the filters used are
specified using constants that depend on the sampling frequency.
3.4 Simulation of the light source - eye - brain chain
The block of signal normalization includes the measurement of input voltage effective value
and calculates a maximum value. The input signal is normalized to a unit-amplitude signal.
www.intechopen.com
58
Modelling, Programming and Simulations Using LabVIEW™ Software
The simulation of the light source -ėye - brain chain is performed as a cascade of filters. The
filters used in the flickermeter are designed as a cascade of digital filters. There is IIR Filter
used from the Signal Processing -> Filters -> Advanced IIR Filtering menu. The transmission
function of this filter is specified using Forward Coefficients and Reverse Coefficients in the
form of array of coefficients. The array is set up using the Build Array block.
A “TRUE”signal to the init/cont input is also transferred to the input of the TIR Filter block,
for the signal filtering to go on continually for the whole period of the programme run,
Hanzelka & Bien (2000).
The complete solution of one of the filters is shown in (see Fig. 29).
Fig. 29. Block diagram of the constructed filter.
3.4.1 Problems relating to filter stability
The practical implementation of the digital filters within LabView has indicated an increased
likelihood of filters becoming unstable if the transmission function of the filter is higher than
the second order of magnitude. It is therefore useful to transform transmission functions of
the higher orders to a product of transmission functions of the lower orders of magnitude.
3.4.2 The programme run
The complete flickermeter is created as a programme loop named WhileLoop with 1
s programme delay using the TimeDelay block. Within each step of the loop a block of 3200
samples is read from the measurement card and data is transformed from the DynamicData
type to the Array data type which is processed by individual filters. The filters’ output is a
single value for each block, denoted as Pf, of immediate degree of perception of flickering. Pf
values are saved in an accumulator designed as Express VI Collector, during each individual
passage of the loop. It accumulates values for a period of time required for calculation of
the PST value (typically 10 minutes, though the programme allows for different times of
accumulation. too).
www.intechopen.com
Electric and Nonelectric Quantities Measurement in Power Engineering using LabVIEW
59
3.4.3 Statistical signal analysis
An array of values is again placed on the accumulator output, administered in a statistical
classifier whose block diagram is represented here below. The classifier function is consistent
with the description within the standard. The number of classes required by the standard is
minimally 64, the constructed algorithm uses 10000 of them.
Fig. 30. Statistical evaluation of data.
3.4.4 The flickermeter control
START and STOP pressbuttons and Pf and Pst indicators are placed on the front panel. The
input voltage curve, Pf current value and Pst measured results are displayed on the graphic
displays.
The text indicator displays information about the current status of the meter. Three possible
states may take place:
– starting the meter with counting-down the time-period for which it has to wait for the
initial transient performance to pass,
– “Wait”status when the flickermeter stands by and waits for the START button to be
pressed. This status takes place after the set time for the meter’s starting lapsed, or after
the STOP button is pressed,
– status of data accumulation for subsequent calculation of Pst value while counting down
the remaining time of accumulation. This state stays active after pressing the START button
until the STOP button is pressed, or the time of accumulation has lapsed, and the Pst
calculation is made. The Pst value will always be overriden with the latest value on the
display after the time of accumulation lapsed.
www.intechopen.com
60
Modelling, Programming and Simulations Using LabVIEW™ Software
The flickermeter is programmed so as to enable using of the measured values also as a
data source for further VI running on the same computer. The flickermeter is part of a
comprehensive measurement system that can remote start the flickermeter and read the
measured results using global variables.
Fig. 31. Block diagram of the timer.
The general view of the user interface of the flickermeter is as shown on the following page.
Fig. 32. Block diagram of the timer.
The flickermeter has been verified by the tests required by the standard. Its response to the
test signals is fully compliant with its requirements and it now used within the development
of the new types of the meter.
www.intechopen.com
Electric and Nonelectric Quantities Measurement in Power Engineering using LabVIEW
61
The described meter is now used as a reference device in the research of new constructional
solutions of the flickermeter and in the development of a generator of different kinds
of disturbance voltage fluctuations. It can be operated on any kind of computer with a
measurement card connected. It can be built into comprehensive systems focusing on the area
of electric power quality, based on virtual instrumentation.
4. Communication and control of Viasala WXT520 meteostation in LabVIEW
environment
Finally the communication of LabView and a Viasala WXT520 meteostation is described. The
meteostation is part of an extensive measurement system which on a long-term basis monitors
electrical and physical quantities of the system of solar panels. A picture of a meteostation is
shown in 33.
The meteostation delivery also included configuration software which, though, can only be
used for meteostation configuration and testing of meteostation. With regard to the needs of
the considered system of long-term online monitoring of data from solar panels the delivered
software was inadequate as it did not enable digital access to the measured data. It was
therefore needed to define and create our own application that would allow for integrating
the WXT52O meteostation into the measurement system.
The core of the problem thus was to create an application within LabVIEW, that would
be able to communicate with the meteostation using the RS-232 serial interface and would
transfer the measured data further on, making it available for further processes within
the measurement system that has also been programmed in the LabVIEW development
programme environment.
The unique feature of this application is that it enables connection of a device to LabVIEW
which does not have a primary support within LabVIEW in the form of measurement card,
proving universality of the LabVIEW software environment. The only supported common
communication standard is the serial port RS-232 interface.
The meteostation includes numerous detectors and sensors (see Fig. 33) measuring
temperature, pressure, speed of wind, rainfall etc.
where:
1 wind transducers (3 pcs)
2 precipitation sensos
3 pressure sensor inside PTU module
4 Humidity and temperature sensors inside the PTU module
The basis for the communication configuration is the table of wiring of screw terminal pins on
the meteostation terminal block, based on which the VISA block was set in the block diagram
of the measurement application.
www.intechopen.com
62
Modelling, Programming and Simulations Using LabVIEW™ Software
Fig. 33. Meteostanice WXT520 Viasala VIA (2008).
Fig. 34. Cut away view VIA (2008).
www.intechopen.com
Electric and Nonelectric Quantities Measurement in Power Engineering using LabVIEW
63
Fig. 35. Connection of pins for different VIA communication interfaces VIA (2008).
As can be seen from the block diagram of the application (see Fig. 37), it was necessary to
configure a number of further variables to ensure the correct function, such as the following:
– channel selection,
– measurement interval,
– input port,
– communication protocol.
Subsequently the complete programme was created, whose user interface is shown below (see
Fig. 36). The logic of the programme is roughly outlined by the following:
– setting of inputs
– on/off measurements
– definition of channels, ports etc.
– definition and configuration of individual sensors,
– repeated reading of data from the meteo-station in set intervals,
– display and entry of values.
5. Conclusion
The paper describes a few examples of using LabVIEW for the measurement of electric
and non-electric quantities in electro-energy applications. The most frequently involved is
evidently the LabVIEW communication with a measuring device using a serial port, but
there are also applications putting it to good use, such as the described flickermeter which is
constructed directly on the NIPXI platform, distributed by the National Instruments company.
Through virtual instrumentation and launching of LabVIEW the simplification and greater
effectiveness of the design have been achieved, and the same has in turn been applied in the
construction of new laboratory tasks and research measurements. The described examples
www.intechopen.com
64
Modelling, Programming and Simulations Using LabVIEW™ Software
Fig. 36. User interface.
indicate possible use of LabVIEW as a concentrator of individual measuring devices and
peripheries, which can be customized based on user requirements. Its operation is based on a
single measurement interface which combines all the varied instruments used, and visualizes,
archives and processes the measured data and if necessary also transmits it to another part of
the measurement system. An integral part of the programme is the possibility of creating an
effective user interface, from which the system can be administered as a whole. The final part
of the paper also deals with a possibility of connecting LabVIEW to and its communication
with a non-standard instrument which is not primarily designed for the communication with
LabVIEW. As it has turned out, provided that standards of the communication interface are
complied with, in our case the RS 232 protocol, the connection can be basically made without
difficulty. This makes LabVIEW a universal software in the sphere of virtual instrumentation.
6. Acknowledgment
This paper includes the results of research funded by the Ministry of Education, Youth and
Sports of the Czech Republic as part of project No.MSM 0021630516 and project No. CZ.1.05
/2.1.00/01.0014 Centre for Research and Utilization of Renewable Energy.
7. References
Hanzelka, Z. & Bien, A. (2000). Guide to quality of electrical supply for industrial installations,
part 5, flicker and voltage fluctuations, Technical report, Power Quality - Working
Group WG2, Tomsk.
www.intechopen.com
Electric and Nonelectric Quantities Measurement in Power Engineering using LabVIEW
Fig. 37. Block diagram of the communication and control programme .
www.intechopen.com
65
66
Modelling, Programming and Simulations Using LabVIEW™ Software
IEC (1997). 61000-4-15 - cem - part 4: Testing and measurement techniques - section 15:
Flickermeter - functional and design specifications, International Electrotechnical
Commission.
Lab (2003). LabVIEW User Manual, edition - part number 320999e-01 edn.
Lab (2006). LabVIEW™Basic I Introduction Course Manual, edition edn.
Slezingr, J., Drapela, J. & Tezky, J. (2009). Flickermeter implementation in labview, Proceedings
of the 15t h International Scientific and Practical Conference of Students, Post- graduates and
Young Scientists MODERN TECHNIQUE AND TECHNOLOGIES MTT 2009, Tomsk,
pp. 11–13.
VIA (2008). User’s Guide, edition - m210906en-a edn.
www.intechopen.com
Modeling, Programming and Simulations Using LabVIEW™
Software
Edited by Dr Riccardo De Asmundis
ISBN 978-953-307-521-1
Hard cover, 306 pages
Publisher InTech
Published online 21, January, 2011
Published in print edition January, 2011
Born originally as a software for instrumentation control, LabVIEW became quickly a very powerful
programming language, having some characteristics which made it unique: simplicity in creating very effective
User Interfaces and the G programming mode. While the former allows for the design of very professional
control panels and whole applications, complete with features for distributing and installing them, the latter
represents an innovative way of programming: the graphical representation of the code. The surprising aspect
is that such a way of conceiving algorithms is extremely similar to the SADT method (Structured Analysis and
Design Technique) introduced by Douglas T. Ross and SofTech, Inc. (USA) in 1969 from an original idea by
MIT, and extensively used by the US Air Force for their projects. LabVIEW enables programming by
implementing directly the equivalent of an SADT "actigram". Apart from this academic aspect, LabVIEW can be
used in a variety of forms, creating projects that can spread over an enormous field of applications: from
control and monitoring software to data treatment and archiving; from modeling to instrument control; from real
time programming to advanced analysis tools with very powerful mathematical algorithms ready to use; from
full integration with native hardware (by National Instruments) to an easy implementation of drivers for third
party hardware. In this book a collection of applications covering a wide range of possibilities is presented. We
go from simple or distributed control software to modeling done in LabVIEW; from very specific applications to
usage in the educational environment.
How to reference
In order to correctly reference this scholarly work, feel free to copy and paste the following:
Jan Machacek, Jan Slezingr and Jiri Drapela (2011). Electric and Nonelectric Quantities Measurement in
Power Engineering Using LabView, Modeling, Programming and Simulations Using LabVIEW™ Software, Dr
Riccardo De Asmundis (Ed.), ISBN: 978-953-307-521-1, InTech, Available from:
http://www.intechopen.com/books/modeling-programming-and-simulations-using-labview-software/electricand-nonelectric-quantities-measurement-in-power-engineering-using-labview
InTech Europe
University Campus STeP Ri
Slavka Krautzeka 83/A
51000 Rijeka, Croatia
www.intechopen.com
InTech China
Unit 405, Office Block, Hotel Equatorial Shanghai
No.65, Yan An Road (West), Shanghai, 200040, China
Phone: +86-21-62489820
Phone: +385 (51) 770 447
Fax: +385 (51) 686 166
www.intechopen.com
Phone: +86-21-62489820
Fax: +86-21-62489821