1
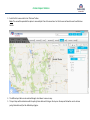
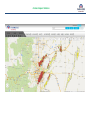
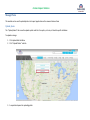
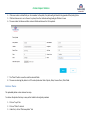
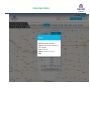
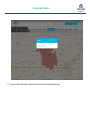
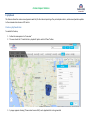
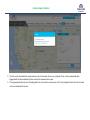
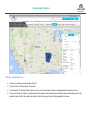
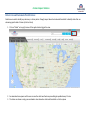
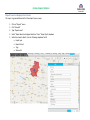
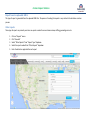
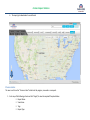
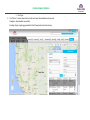
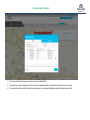
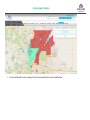
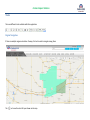
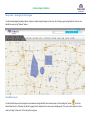
Farmers Impact Solution Farmers Impact User Manual Farmers Impact Solution Coverage: Glossary ....................................................................................................................................................................................................................... 5 Launch Cognizant Impact Visualization Tool.................................................................................................................................................................... 7 Data Filters ................................................................................................................................................................................................................... 8 Visualization of Policies Data...................................................................................................................................................................................... 8 Visualization of Claims Data ..................................................................................................................................................................................... 13 Visualization of resources data................................................................................................................................................................................. 14 View Data ............................................................................................................................................................................................................... 16 Policies/Claims Visualization – Views............................................................................................................................................................................ 18 Point View .............................................................................................................................................................................................................. 18 Heat Map................................................................................................................................................................................................................ 19 Cluster View............................................................................................................................................................................................................ 23 Distance Calculator ..................................................................................................................................................................................................... 26 Manage geospatial files............................................................................................................................................................................................... 29 Upload geospatial files............................................................................................................................................................................................. 29 Retrieve geospatial files:.......................................................................................................................................................................................... 30 Upload Data through Excel Utility................................................................................................................................................................................. 33 Upload Data:........................................................................................................................................................................................................... 33 Track Upload status:................................................................................................................................................................................................ 34 Manage Photo ............................................................................................................................................................................................................ 36 Upload photo.......................................................................................................................................................................................................... 36 Retrieve Photos....................................................................................................................................................................................................... 37 Places Filter ................................................................................................................................................................................................................ 40 Farmers Impact Solution Map Territory ............................................................................................................................................................................................................. 43 Create Region ......................................................................................................................................................................................................... 43 Retrieve/Edit/Delete Region .................................................................................................................................................................................... 51 Layers......................................................................................................................................................................................................................... 53 Active Perils ............................................................................................................................................................................................................ 53 Forecast Perils......................................................................................................................................................................................................... 54 Manage Locations ....................................................................................................................................................................................................... 56 Add Locations ......................................................................................................................................................................................................... 56 Retrieve Locations................................................................................................................................................................................................... 57 Views ......................................................................................................................................................................................................................... 59 Save View ............................................................................................................................................................................................................... 59 Retrieve/Edit View .................................................................................................................................................................................................. 59 E-playbook.................................................................................................................................................................................................................. 62 Create e-playbook view ........................................................................................................................................................................................... 62 Retrieve e-playbook view:........................................................................................................................................................................................ 64 Display totals .............................................................................................................................................................................................................. 66 Robot view and Automated Notifications ..................................................................................................................................................................... 67 Reports....................................................................................................................................................................................................................... 69 Peril Layer report .................................................................................................................................................................................................... 69 Report based on displayed territories ....................................................................................................................................................................... 70 Report based on uploaded KMLS:............................................................................................................................................................................. 73 Other reports.......................................................................................................................................................................................................... 73 Process status ......................................................................................................................................................................................................... 74 Pre and Post Imagery .................................................................................................................................................................................................. 77 Farmers Impact Solution Claims Triage: ............................................................................................................................................................................................................. 81 Create triage event (by Supervisor) .......................................................................................................................................................................... 81 View job list (all claims by claims supervisor)............................................................................................................................................................. 81 Performing phone triage (by phone triage adjuster) .................................................................................................................................................. 82 Performing field triage (by field triage adjuster) ........................................................................................................................................................ 84 Retrieve/Manage territories (by claims triage supervisor): ......................................................................................................................................... 85 Workflow for claims triage:...................................................................................................................................................................................... 88 Ability to add notes ..................................................................................................................................................................................................... 89 Ability to change address:............................................................................................................................................................................................ 92 User Roles .................................................................................................................................................................................................................. 93 Tools .......................................................................................................................................................................................................................... 94 Region Navigation ................................................................................................................................................................................................... 94 Clear Map ............................................................................................................................................................................................................... 95 Scale....................................................................................................................................................................................................................... 95 Zoom and select tool ............................................................................................................................................................................................... 96 Pan......................................................................................................................................................................................................................... 96 Shape tools – Rectangle/Circle/Polygon.................................................................................................................................................................... 97 Switch Base Layer.................................................................................................................................................................................................... 97 Zoom In/Out ........................................................................................................................................................................................................... 98 Map Legend............................................................................................................................................................................................................ 99 Mobile View ..............................................................................................................................................................................................................100 Farmers Impact Solution Glossary signifies that the filter results exceed 7500 policies/claims, and the map view is limited to show only up to 7500 policies/claims “ * ” symbol on any module signifies that the module tab is being used Signifies a retrieved location. signifies policy signifies claim Used to specify a radius within which a particular place is available. Farmers Impact Solution Excel Upload of cl aims, claims tri age res ults, resources, COD s hops a nd unres ourced claims data Upl oad geospatial files Upl oad photos Crea te, edit, a nd del ete Vi ew a ggrega tes of regi ons / terri tori es fi l tered data, vi ew data us i ng pre-defi ned & a ttri butes, zoom in to a freehand tools or us i ng s peci fi c pol i cy/cl a i m dri ve ti me a nd export da ta Tri gger robot vi ew Sol uti on i ntegra tes wi th 3rd pa rty da ta s ources to vi ew peri l /CAT/wea ther rel a ted da ta on the ma p. Toggl e display tota l s (on/off) Da ta filters to retri eve pol icy/claim/resources da ta Ma p Legend Ca l culate distance of filtered policies or cl a i ms from a n overl a i d wi l dfi re/peri l regi on or coa s tl i ne Retri eve pl a ces ba s ed on Retri eve a nd vi ew pre a nd keywords wi thi n a pre pos t di s a s ter i ma ger defi ned ra di us Sa ve, retrieve & edit “vi ew” Crea te a nd manage tri a ge events Generate reports ba s ed on overl a i d peri l s , terri tori es , s ha pe fi l es a nd depl oyment reports Farmers Impact Solution Launch Cognizant Impact Visualization Tool To launch Cognizant Impact Visualization, navigate to the solution link provided to Farmers. Enter the login credentials and click “Login” button. The user is navigated to the solution page: Farmers Impact Solution Data Filters Data filters modules (policies and claims) allow users to apply business filters to view policy/claim data on the map. This section includes the following options to aid the user in applying filters: Toggle icon to clear/show policy/claims data on the map (without clearing the filter) Refresh symbol to refresh the data (based on the filters applied) Point view symbol by default. Clicking on this allows the user to switch to other views like Bubble, Cluster and Heat map Visualization of Policies Data The policy module filter includes key business filters defined based on business requirements. This filter values also include a section on “Advanced filter” which allows the user to set value based filters (e.g. Coverage limit) 1. Apply Filters: The user can click on the ‘Retrieve’ button which visualizes the policy data as unique markers on the map. Clicking on the ‘Reset’ button clears all filter values and map view for the user. Farmers Impact Solution Farmers Impact Solution The data is shown as “Point view” by default (as unique markers on the screen). the results are retrieved on the map. turns to mark once the filter data is applied and 2. Save filters: The user also has the option to save commonly used filters. To save a filter the user can click on the save filter button, and enter a unique name to the filter. These saved filters can be viewed and retrieved from the saved filters drop down on the top of the policy module. Farmers Impact Solution 3. Viewing Policy attributes: Clicking on any of the policy markers displays key policy information to the user. Farmers Impact Solution Farmers Impact Solution Visualization of Claims Data The claims data module offers the same functionality as the policy module. Farmers Impact Solution Visualization of resources data 1. Apply filters: This module is used to filter Adjusters (Resources) data based on the filters defined based on business requirements. This filter values also include a section on “Advanced filters” which allows the user to retrieve filters based on resources pending deployment Farmers Impact Solution Farmers Impact Solution 2. Save filters: The user also has the option to save commonly used filters. To save a filter the user can click on the save filter button, and enter a unique name to the filter. These saved filters can be viewed and retrieved from the saved filters drop down on the top of the Resources module. 3. Viewing Adjuster attributes: Clicking on any of the Adjuster markers displays key information of the Adjuster. View Data This module allows the user to view details on claims or policies visualized on the map. The user can click on the “Download button” to download an excel copy of the policy/claims data. Clicking on the “ ” icon will zoom into the specified policy/claim location. Farmers Impact Solution Farmers Impact Solution Policies/Claims Visualization – Views The user can click on the visualization button to view filtered policy/claims data in the various ways: Point View Pointers are markers representing the data points. This is the default view of policy/claims data. Farmers Impact Solution Bubble View Click on the bubble view radio button to view the policy/claim data as circle representation, the size of the circle determined by the combined limit. The color of the circle will be based on the legend set for the various lines of business/loss type for policies and claims respectively Heat Map Heat maps are 2D displays of the values in a data matrix. Larger values were represented by red and smaller values by green. Heat maps can be retrieved at Country level/State level/County level/Zip level/CBG level. This view can be further customized to view by “Combined limit (C. Limit)” or “Count”. Farmers Impact Solution Note: By design, the selection can go down 2 levels from the selected option. E.g., when the filter is set at State level, the heat map view can be viewed at county and zip level. If no filter is set at State level, the view can be generated for state level and county l evel only (Zip level will be in-active) County level heat map view of policies: Farmers Impact Solution Farmers Impact Solution Zip Code gets disabled at Country level. The user also has the ability to view aggregates associated with any region shown on the map (state/county/zip/CBG) by clicki ng on the region. A pop-up would display the region name and associated aggregates Farmers Impact Solution Cluster View This view organizes policies/claims data into clusters. Cluster proximity: These clusters aggregates policy/claims data over an area per zoom level with the cluster view being recreated based on user zoom. Farmers Impact Solution Farmers Impact Solution Cluster county, cluster zip, cluster CBG These clusters display associated numbers for fixed boundaries – per county, zip, and CBG Farmers Impact Solution Distance Calculator This tool is used to calculate the distance in miles for Policies or Claims filtered. The following steps should be followed to perform distance calculation: 1. 2. 3. 4. 5. Filter Claims or Policies on map The user can choose to overlay the territory/peril layer/point/line on the map from which the distance is to be measured Click on “Distance Calculator” tab Enter the radius bands in miles Select the export type ( policy or claims) from dropdown, based on whether the distance of policies or claims is required to be measured from the Geometry Farmers Impact Solution 6. The user can either select “continue with selected geometry on map” or “continue with nearest coastline on map” 7. If the user selects “continue with nearest coastline on map”, the system will measure the distance of the policies/claims overlaid on the map with the nearest coastline and an excel with the data will get generated 8. If the user selects “continue with selected geometry on map”, the system will check for a geometry on map and selection. If available, it will continue with the calculation; if not selected, the system will prompt the user to select a shape on the map 9. The user can click on the area boundary/line or point, and on confirmation, an excel gets generated with distance calculated as per the mentioned bands. Farmers Impact Solution Farmers Impact Solution Manage geospatial files Upload geospatial files There is an option to upload KML Files, KMZ files and shape files under “Upload Data” tab. To upload files: 1. Click on “Upload Data” 2. Click on “Upload geospatial files” 3. Enter unique “file Name” Farmers Impact Solution 4. Click on “Add file” and select the file to be uploaded. 5. Click on the “Upload” button. The user will be provided with an upload successful message. 6. There is also a “Reset” button. Retrieve geospatial files: The uploaded files can be retrieved using the following steps: 1. Go to the “Layer” tab and click on “Others” 2. Click on “Custom KML” Farmers Impact Solution 3. Select the file to view and click on “Retrieve” button. Note: The user will be provided the option to view multiple files at the same time. For this the user will need to search and Retrieve the file. 4. The different peril data can be selected through check boxes to view on map. 5. This peril layer will be interactive with the policy/claims data and clicking on the layer on the map will allow the user to retrieve policy/claims data only for the defined layer/region. Farmers Impact Solution Farmers Impact Solution Upload Data through Excel Utility Upload Data: There is an option to upload data (claims data /claims triage results /resource/un-resourced claims/COD) from the “Upload Data” tab. To upload data through the utility, the user has to follow the below steps: 1. 2. 3. 4. 5. Click on “Upload data” tab Click on “Upload Excel” button Enter a “Name” (optional field) Select the “Upload category” (claims data /claims triage results /resource/un-resourced claims/COD) Select the file using “Add file” button and click “Upload” button Note: 1. The system supports file upload based on a specified format. The user can view the accepted format by the system (claims data /claims triage results /resource/un-resourced claims/COD) by clicking on the “Download template” button. 2. The resource upload is done through individual sheets for equipment, license, skills, employee, schedule, CAT Pay. Farmers Impact Solution Track Upload status: The user can click on the “Process status” tab to view the status of any files that have been uploaded. To view the status: 1. Enter any of the following criteria and click “Apply” to view the required file upload status Name Upload Category Select “From” & “To” dates 2. The files last uploaded are also available for view in the same tab 3. The “Status” column shows the status of each of the file uploads and may read: a) Completed – all records in the files have been uploaded Farmers Impact Solution b) Partially completed – some of the total records in the file have failed c) Failed – all records in the file have failed 4. The “Remarks” column provides additional data on the upload result 5. The last column has a button that helps to download the error log for all records failed Farmers Impact Solution Manage Photo This module can be used to upload photos into Impact application and to view and retrieve them Upload photo The “Upload photos” tab is used to upload a photo and link it to a policy or claim, or linked to specific attributes To upload an image: 1. Click Upload data tab Menu 2. Click “Upload Photos” sub-tab 3. A separate tab opens for uploading photo Farmers Impact Solution 4. If the user enters a related Policy or claim number to the photo, the photo will get linked to the geocode of that policy/claim. 5. If the location service is on in the user’s system, then the Latitude and Longitude gets filled on its own. 6. The user enters the Name and other relevant fields and chooses the file to upload. 7. The “Reset” button is used to reset the entered fields. 8. The user can also tag the photo to a CAT code or/and enter Date of photo, State, Cause of Loss, Other fields. Retrieve Photos The uploaded photos can be retrieved on map. To retrieve the photos that may or may not be linked to claims/policy numbers 1. Click on “Layer” tab 2. Click on “Others” sub-tab 3. Under that, click on “Retrieve photos” tab Farmers Impact Solution 4. Enter the “Photo Filter” fields. 5. The photo icon is shown on map. Farmers Impact Solution 6. The user can click on the photo icon and the photo opens. To retrieve photos linked to policy/claims numbers: 1. The user can open the claims/policies module and choose to filter with “show policies with images” or “show claims with image s” 2. Based on the filter set, all claims/policies with photos tagged will appear as pointers on the map for the user to view Farmers Impact Solution Places Filter The “Places tab” is used to view a particular location within a pre-defined radius. The user will have the option to retrieve places based on keywords (which could be well known establishments like Walmart, Home Depot) or using the categories that are predefined in Google places ( 90 + categories such as airports, hotels etc.) . To retrieve places the user will: 1. Click on “Places” module and “search” tab 2. Enter the radius to search. Note: The maximum radius within which a place can be searched is 30 miles. 3. Enter a keyword or select a category from the places type drop down 4. Click on “Retrieve” button Farmers Impact Solution 5. A peg is displayed on the screen and the user may move the peg to retrieve results for the defined area 7. The user can click on the place to view details of the place 8. The user can also click on the “view” tab in the places module to view details of places in proximity to the point on map, with detail s including type, address, distance from point, website and ranking (if applicable) shown Farmers Impact Solution . Farmers Impact Solution Map Territory The Map territory option provides the user the ability to create, view, edit and delete regions created using freehand tools or using predefined boundaries. Create Region The Create tab under Map territory tab helps to create a territory either by a) Freehand: Enter the Region name, Description, Tag and Share with specific user roles or directly “Draw on Map” There is also a “Reset” button. (Or) b) Predefined boundaries: Enter the Region name, Description, Tag and Share with specific user roles. Select State or County or Zip Code radio button and “Save”. “Select on Map” can also be used to directly select a region on the map. There is also a “Reset” button. To create a region: 1. Click on “Map Territory” tab 2. To draw a region using predefined tools, the user will select it from the radio button, select the region type and click on the “draw on map” 3. The user can click on any of these tools. Note: The user will need to click on the to draw a region on the map icon to undo the selection of the region creation tool Farmers Impact Solution 4. Once the region is drawn on the map, the user can right- click and Add/Remove a region. Farmers Impact Solution 5. Clicking on Remove button removes the selected territory. 6. On clicking “Add” button, the user can enter a name for the territory and save it. Farmers Impact Solution Note: The first saved territory turns a unique color. Farmers Impact Solution 7. The user can also create another nearby territory and save the same using the above steps. Farmers Impact Solution Note: The latest territory turns another unique color. Farmers Impact Solution Farmers Impact Solution 8. To user can also choose to overlap two regions. To do this the user can either select the same regions and save, or the user can click on “Add” button, check the name of the territory to which the latest territory is to be added. The overlapped territories will be shown on the map on clicking “Save” button. 9. Once the territories are saved locally, the user will be required to navigate to the territories tab to save the created territories a. Go to map territories b. Select any overlaid territory in “Region name” dropdown c. Enter “Description” (optional field) d. Enter “tag” from dropdown ( Note: This provides an easy way to index a territory) Farmers Impact Solution e. Enter LOB type ( homeowners, auto or none) based on deployment/non-deployment usage f. The user can choose to “Share” the region with user roles g. All territories overlaid on map are saved through this Note: the user can individually save each territory overlaid on the map as well using this tab. Retrieve/Edit/Delete Region The “Retrieve” tab under the “Map Territory” tab helps to retrieve a region or edit an already saved region. To retrieve a region, 1. 2. 3. 4. 5. Enter the “Region name” Choose a “tag” Click on “Retrieve” button All versions of the created region will be shown to the user Click on the link shown under Results and choose the action to be performed – View, Edit, and Delete. Farmers Impact Solution 6. 7. 8. 9. If the user edits a view by adding /deleting regions, the tab shows an “Update View” button. On clicking the same, a pop up appears asking “Do you want to override the existing version?” On clicking No, a new version of the same is created. On clicking “Yes”, the previous versions are deleted and this version alone remains. 10. The “Download” button is used to download the zip code and their respective LOBs for the territories created. 11. “Clear” button clears the map of all territories. Farmers Impact Solution Layers Impact solution integrates with various third party data source providers that allow the user to view peril/CAT/weather related data on the map. The peril/CAT events and the source for the feed are provided in the table alongside. The peril types have been categorized into active and forecast to allow the user to view active/ongoing CAT/peril events or view any forecast feeds as provided by the third party sources. Category Peril Name/CAT type Source Wildfire GeoMac and Modis Hurricane/Surge NHC NOAA Earthquake USGS Hail SPC NOAA Tornado SPC NOAA Active Active Perils To view active perils/CAT events on the map, the user will be required to: SPC outlook SPC 1. Click on the layers tab Flood /Sewer & Drain HPC NOAA 2. Select the active peril tab Forecast 3. Select the date (Note: The user will be provided with the option to Winter Storm HPC NOAA view active peril data up to 5 days prior to current date) 4. Select the applicable source to view the data on the map. Filters within each peril s ource allow the user to filter and view data based on the user scenario (e.g. only the forecast cone for hurricane data) 5. The “Clear” button is used to clear the peril filter. 6. Each of these peril layers is interactive. The user can click on the layer to retrieve policy/claims for the area of interest Farmers Impact Solution Forecast Perils The peril forecast layers works in a similar way to active peril/CAT events. The user can view the peril forecasting from “Today” to “5 days ago” For e.g., the “Winter Storm” option selected for “Today” retrieves Day 1 forecast, Day 1-3 forecast. The retrieved results in inches can be filtered under this view. Farmers Impact Solution Farmers Impact Solution Manage Locations This functionality allows the user to add and manage any locations that may be added on the map. Add Locations To add a location, 1. Enter the location address in the search bar on top and click on Go. 2. The location appears on the map with a 3. 4. 5. 6. sign. The user can click on the to save the location with a unique name The user can also enter associated description The user can also enter a type to the location. This may be a bus, car, flag, Red Cross and default. The icon linked to the location is based on the “type” selection Farmers Impact Solution Retrieve Locations To retrieve a location: 1. 2. 3. 4. Click on “Layer” tab Click on “Others” tab Click on “Custom Marker Overlay” Type in “Search” bar (or) Click the check box of the required saved region. Farmers Impact Solution 1. Click on the location to view the description or click “Edit/Delete” button modify Farmers Impact Solution Views The view tab allows the user to save and retrieve any “view” that may be created using a CAT event. A view comprises of multi ple modules from the application (such as territories, peril layers, policy/claim data) Save View To save a view, the user will: 1. Click on ‘View’ once all the modules that the user wants to save are shown on the map 2. The user enters “View name, Description” and select a “tag” from dropdown. Note: A tag provides an easy way for the user to index a view. 3. The user will then select option to “Auto/Freeze” the peril layer Note: Auto- Selecting this option auto-update’s the peril layer with the latest feed that is available in the system. Each time the user retrieves the view, the latest feed from the peril source will be shown to the user. Freeze – Selecting this option freezes the peril layer for future user. Each time the user retrieves the view, the peril layer (bounda ry) shown at the time of save will be retrieved for the user. 4. Option to Share the view with user roles using the “Share” dropdown 5. Click on “Save” button. Retrieve/Edit View The user will be able to search and retrieve all views created. 5. 6. 7. 8. 9. Click on “View” tab Click on “Retrieve View” tab Select a “View Name” from dropdown The user can also select a “tag” which would limit ‘views’ linked to the tag name Click on “Retrieve” button. Note: The Results shown can be filtered by date. The user can click on the radio button and click on “View” to see the view. Farmers Impact Solution 10. User can also edit the view by clicking on “Edit’ button. Click on “Update View” and save the View. Farmers Impact Solution Farmers Impact Solution E-playbook This feature allows the create a view (separate web link) for the internal reporting of key catastrophe metrics, and also send periodic updates to the communication team on CAT metrics Create e-playbook view To enable this feature, 1. Follow the same process to “save view” 2. The user checks the “Create link for e-playbook” option and click “Save” button. 3. A pop-up appears showing “View created successfully” and e-playbook link is also generated. Farmers Impact Solution 4. This link can be shared with the communications team to share with all users on e-playbook. There is also an automated email triggered with the associated policy/claims count to the communications team. 5. The link generated allows all users (including public users) to view the saved view on a URL. The privileges linked to this URL are based on the associated role of the user Farmers Impact Solution Retrieve e-playbook view: 1. 2. 3. 4. The user can retrieve a saved view from this tab. The user clicks on “Choose tag” & “View name” On checking the “E-Play Book Views” option, the user can see the number of views created generated for a particular view. The user can choose to stop the e-playbook emails from being sent by unchecking the e-playbook option while editing a view. This would not make the URL inactive but only stop the details (incoming claims) from being updated in the view Farmers Impact Solution Farmers Impact Solution Display totals The user will also be able to view claims count split as a scroll on the top of the map. This can be used as a ready reckoner on the count of claims/underlying PIF during CAT events. 1. The process to activate a view to display totals is linked to “create link for eplaybook”. This option also activates the view to display totals on the top of the screen. The ability to stop the view to display totals is also controlled through the e-playbook option 2. The user will also have an option to toggle on/off the scroll on the top of the screen using the total on/off button on the top right of the application Farmers Impact Solution Robot view and Automated Notifications Robot view is used to identify any aberrancy in claims pattern through Impact based on state wide thresholds to identify states that are witnessing rapid intake of claims (in the last hour) 1. Click on “Robot” on top right corner of the application to trigger the view. 2. An automated view opens and the user can see the state-level heat map view that gets updated every 15 mins. 3. The states are shown in red, green and amber colors based on state level thresholds set in the system Farmers Impact Solution 4. The view periodically zooms into: a) Red color states (states with high claims volumes in T-2 days) b) the states that are blinking (states with high incoming claims in the last hour) 5. on zoom in, the user is shown a cluster based view of the claims volume 6. Running totals will be displayed in the Robot View. 7. Automatic notifications (email) will be sent to identified user groups based on the spike in claims volume. Farmers Impact Solution Reports The user will be able to view any type of report using the “Reports” tab. The following types of reports can be created by the user: 1. 2. 3. 4. 5. Peril layer report Report based on displayed territories Report based on uploaded files Combined coast distance report Other reports Peril Layer report This report is based on the filtered policies /claims for territories on map and is used to create a report based on any of peril feeds available in the system. This data overlaid on the map may be linked to a “view” or it could be data overlaid on the map 1. 2. 3. 4. 5. Click on “Reports” menu. Click “New tab” Type “Report name” Select “Peril Layer Report” from “Report Type” dropdown Select the relevant details from the following dropdown fields: Export type Report Extract Tags Share with 6. Type “Report description” and click save to run the report. 7. If the data on the map is not linked to a view the user will be shown a message indicating that the user would need to save the data as a view if the intent is to re-run the report in the future. Note: Please note that the system will perform checks to ensure that a peril layer is available and valid before running the report. For e.g. if the user selects report based on MMI bands, the system will check to ensure an earthquake layer is overlaid on the map Farmers Impact Solution Report based on displayed territories This report is generated based on the filtered peril layers on map. 1. 2. 3. 4. 5. Click on “Reports” menu. Click “New tab” Type “Report name” Select “Report based on displayed territories” from “Report Type” dropdown Select the relevant details from the following dropdown fields: Export type Report Extract Tags Share with Farmers Impact Solution 6. Type “Report description” and hit save to run the report 7. If the data on the map is not linked to a view the user will be shown a message indicating that the user would need to save the data as a view if the intent is to re-run the report in the future. 8. The user can either link it to a view or save the one –time run of report Note: Please note that the system will perform checks to ensure that a territory is available before running the report. Farmers Impact Solution Farmers Impact Solution Report based on uploaded KMLS: This type of report is generated from the uploaded KML files. The process of creating this reports is very similar to the territories creation process. Other reports These type of reports are primarily one-time run reports created to assess claims volume, staffing, geocoding errors etc. 1. 2. 3. 4. 5. Click on “Reports” menu. Click “New tab” Select “Other Reports” from “Report Type” dropdown Select the report needed from “Other Reports” dropdown Enter the details as applicable for each report Farmers Impact Solution 6. The report gets downloaded in excel format. Process status The user can click on the “Process status” tab to track the progress, view and re-run reports. 1. Enter any of the following criteria and click “Apply” to view the required file upload status Report Name View Name Tags Report Type Farmers Impact Solution Peril Type 2. The “Status” column shows the status of each report downloaded and may read: Complete –Downloaded successfully Pending- Report is getting generated for the filtered policies/claims territory Farmers Impact Solution 3. The last column has a button that helps to download the report again & Icon is used to rerun the report and show the data on the map 4. “Clear” button is used to clear the filters 5. can be used to re-run a report and will be available only for reports that were run with an existing view as base Note: This tab is common in function for all type of reports Farmers Impact Solution Pre and Post Imagery The Post imagery dropdown available in the Impact application is used to view the disaster impacted regions. 1. The user uploads the disaster-related images into the system. 2. The “Post imagery” dropdown displays the names of uploaded images to be viewed on map. 3. On selecting a particular image, Impact shows a split screen with the same image and the pre-imagery satellite view of the same location before disaster. Farmers Impact Solution 4. The user can overlay policies/claims/data layers on the post disaster image and save the view/perform any other function on the same. Farmers Impact Solution 5. The user can also zoom in/zoom out of the post disaster image, based on which the pre-disaster image is also responsive on the screen. Farmers Impact Solution Farmers Impact Solution Claims Triage: This module can help the claims triage supervisor create a triage event and manage the workflow of claims triaging. This will also allow claims triage adjusters to document their findings, notes and decision on claims triage. The below section describes key activities involved in managing a triage event by supervisor and adjusters Create triage event (by Supervisor) This functionality will help the claims supervisor create a claims triage event to perform phone or field triage. To do this, the supervisor will be required to: 1. 2. 3. 4. 5. 6. 7. 8. 9. Filter claims/policies criteria that need to be triaged Create territories where triage is required Filter adjusters that are candidates for triage adjusters Drag and drop adjusters to the territories which they need to service. The system will pin these adjusters to the territories. The user can click on the flag at any time to view list of all adjusters who have been linked to the territory The system will also indicate all adjusters that have been pinned in a separate indication to the user The claims supervisor will click on the claims triage module and click on manage “Manage triage events”. ( note: This functionality will only be available to the claims supervisor role) The user will be able to view all adjusters and all territories from the map on the list The user can make any changes and add any adjusters (that are filtered) through the list The user will then enter Triage event name, select assignment type ( field/phone) and click create View job list (all claims by claims supervisor) The claims supervisor will be able to view all jobs assigned to the system and the total job list at any time: 1. 2. 3. 4. The claims supervisor can click on the job list tab (under claims triage) The user can then select assignment view name, triage type, status etc. to view details All claims assigned by the system will be shown in list view to supervisor. Note: in case of a phone triage, the distribution is done to balance workload while in case of field triage route and distanc e is taken into account while splitting claims across adjusters Farmers Impact Solution 5. The claims supervisor will be able to view the claim details (or policy details if policies are being triaged) and also assoc iated status (the status workflow is provided in section below) along with details on the phone and/or field adjuster the claim has been assigned to 6. The supervisor will be able to modify the status of the claim/policy at any time and also change the phone adjuster/field adj uster to whom the job has been assigned 7. A flag will indicate to the supervisor if any jobs have been pending for over a pre-determined time period 8. The supervisor will click on save the save any changes made Performing phone triage (by phone triage adjuster) 1. The phone triage user will be required to select the event that is to be triaged 2. All jobs assigned to him will be shown Farmers Impact Solution Farmers Impact Solution 1. The user will be able to enter notes, and enter triage decision 2. The user will then hit confirm to update decision 3. The job will change status to “pending supervisor approval” and leave the users basket. (Note: detailed view of workflow provided in section below) Performing field triage (by field triage adjuster) 1. The user will be able to view all jobs assigned to him that need to be phone triaged. These claims have been assigned by system based on user proximity to the location 2. Similar to phone triage, the user will be able to enter notes and decision in the screen 3. The user will also be provided with a ‘Route Optimize’ option on the top left of the screen 4. To use route optimizer, the user will be able to select claims in the list and click on the route optimize button Farmers Impact Solution 5. The system will show the optimal route to the user along with directions for drive-by Retrieve/Manage territories (by claims triage supervisor): The claims triage supervisor will have the ability to manage triage events that have been created. This includes the ability to edit territories, claims filters, adjusters for phone and field triage as well as marking event as complete (to stop claims/policy assignment) 1. The user will click on the claims triage module and select manage triage events Farmers Impact Solution 2. The user will enter the triage event name he wants to edit/modify 3. The triage event will be displayed on the map and associated adjusters and territories will be shown in a list view 4. The user will be able to modify the territories, adjusters or create new field/phone territories from data overlaid. Farmers Impact Solution 5. The user will be able to view any changes in the list view and be able to save the modified view Farmers Impact Solution Workflow for claims triage: Farmers Impact Solution Ability to add notes The user will also be allowed to add notes to any of the filtered values (policies/claims/resources). 1. Notes can be added by clicking on “Add notes” 2. The user enters the note in the pop-up text box that appears Farmers Impact Solution 4. The saved notes can be viewed by clicking on “View notes”. Farmers Impact Solution 5. The user can overwrite/delete the saved notes. Farmers Impact Solution Ability to change address: The user will have the ability to change any address of claim/policy location. This change will remain within the application and will not be sent to any other external system Change address through map functionality 1. 2. 3. 4. The user should have laid policies/claims on the map in the mobile device On clicking a particular policy/claim, a pop up appears User clicks on “Change by address” button A pop up appears with “Change by address” & “Move to current address” options. Note: the change of address functionality will also be enabled for web application access through laptop/ Change by address 5. 6. 7. 8. User clicks “Change by address” radio button and clicks “OK” User enters address in search bar and clicks “Search” Click on displayed address and select “Confirm” or click “Cancel” On clicking “Confirm”, the new address gets saved to the policy/claim. Move to current address This functionality will be enabled for mobile devices and for browsers which have the option to have location detection enabled 9. User clicks on “Move to current address” option. Note: “Location services-GPS” should be enabled in the tablet device for this option to work. 10. The pop up shows the address. 11. User selects the radio button against the displayed address and clicks “Confirm” for the address to change or clicks “Cancel” . 12. If the location-GPS services are disabled, the app throws an error saying “GPS for location services is disabled. Please enable it to proceed” 13. User enables “GPS” option in the tablet Back to step 11 Farmers Impact Solution User Roles Multiple user roles have been configured in the system with varying privileges for Viewing/performing functionalities and Data viewing Each user added in the system is assigned one or multiple roles which will govern his privileges in the system. Farmers Impact Solution Tools There are different tools available within the application. Region Navigation If there are multiple regions selected on the map, this tool is used to navigate among them. The tool is used to select all layers shown on the map. Farmers Impact Solution The number (E.g., 2) represents the number of layers selected. There is a previous and next arrow The used to navigate among the regions. button is used to deselect the regions. Clear Map The button is used to clear the map and zoom to default level Scale Use the ‘Distance’ tool to measure distances on the map. Measure the distances between existing policies/claims, any location on the map to an exposure, distances to CAT zones, or distance between exposure and places such as fire stations, hospitals etc . Click on the icon to deselect the ruler. Farmers Impact Solution Zoom and select tool Zoom and select tool is used to select a region and zoom to the area of interest. Pan Use the ‘Pan’ tool to move across the map – left or right, up or down Farmers Impact Solution Shape tools – Rectangle/Circle/Polygon Use the round/polygon/rectangle button to draw a custom shape/rectangle on the map. On clicking a region using hand tool, the user can delete the same using “Remove” option. Switch Base Layer Use the satellite/map view to change the view between Google Satellite View and map view. Click and drag the ‘person’ icon to the desired location (or at full zoom) to switch to google street view (works the same way as Google maps). The user can also switch to street view by clicking “street view” in the policy/claims pop-up Farmers Impact Solution Zoom In/Out Use the ‘Zoom In/out’ tool to zoom in/out view Farmers Impact Solution Map Legend The Map Legend panel explains the markers and data shown on the map. Farmers Impact Solution Mobile View The user can also access the Impact application in a mobile phone/tablet device. The functionality available in the application is controlled to allow easy navigation and usage of the device To access the application on tablet: 1. The user should navigate to the Impact URL in the Mobile browser 2. Login using valid credentials 3. The enabled tabs for Mobile devices can be seen by the user