1
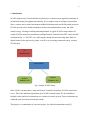
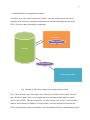
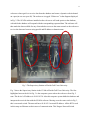
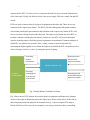
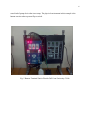
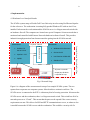
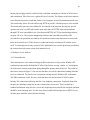
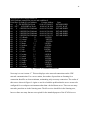
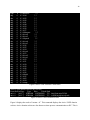
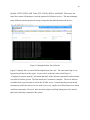
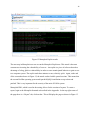
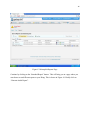
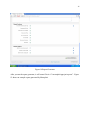
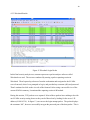
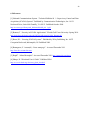
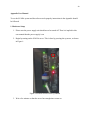
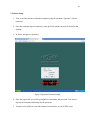
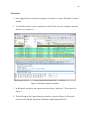
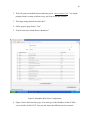
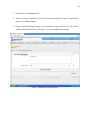
1 Remote Control and Reporting using SCADA Michael Humphries CNT 4101 Software Project in Computer Networks Dr. Zalewski Florida Gulf Coast University 12/09/2011 2 1. Introduction SCADA (Supervisory Control and Data Acquisition) is a control system applied prominently in an industrial setting for equipment monitoring. It is a complex setup of computer systems that allow a remote user to control and monitor industrial infrastructures and facility based processes. SCADA systems can be found in industries such as telecommunications, water and waste control, energy, oil and gas refining and transportation. A typical SCADA setup consists of a central SCADA control host workstation, multiple Remote Terminal Units (RTU) and a local PC workstation (Fig. 1). The RTU’s are collecting the analog data and converting these data to a digital format for the supervisory system, as well as are executing commands sent by a remote SCADA host. PC WORKSTATION SCADA SERVER REMOTE TERMINAL UNIT REMOTE TERMINAL UNIT Fig. 1 Simple SCADA Setup In the CS lab, currently there is only one Remote Terminal Unit and one SCADA control unit server. This is the minimum requirement for a SCADA control system. We do indeed have multiple remote and local workstations as to conduct test on the system. These workstations are within the same local area network and outside. This project is a continuation of a previous project, for which documentation exists [2]. 3 1.1 In-depth Hardware Component Description A SCADA server, also called “Supervisory Station” is the heart of the system. The main operation of the station is to maintain communications with the field equipment such as the RTUs. This job is done with multiple components. WEBSERVER SCADA Software DATABASE SCADA Software SCADA CONTROL UNIT Fig. 2 Simple SCADA Server Supervisory Station Software Setup Fig. 2, show the basic setup of the Supervisory Station in a SCADA control system. The first unit, “SCADA Control Unit” receives digital data from and sends digital signals to remote devices such as RTUs. This unit is labeled as “SCADA Control Unit” in Fig. 2. This unit then sends its received data to a database. SCADA software is used to interpret the data from the RTUs and to send these data to the database. Next, the database strikes up communication with a 4 webserver whose goal is to receive data from the database and create a dynamic website hosted on a port (in our case: port 80). The webserver is tagged “Webserver” in the diagram displayed in Fig. 2. The SCADA software installed on the web server will send queries to the database, with which the database will respond with the corresponding requested data. The software will then make the data available for any client who has access to the same network as the webserver to view the data on a browser using port 80 and IP address or domain name. Fig. 3 The Supervisory Station at Florida Gulf Coast University Fig. 3 shows the Supervisory Station in the CS lab at Florida Gulf Coast University. The first highlighted area on the left in Fig. 3 is the computer system where the webserver from Fig. 2 runs. This device’s IP address is 69.88.163.30. Also this computer system holds the database and interprets the received data with the SCADA software. Moving on to the center circle in Fig. 3, this is a network switch. The network has a 69.88.163.1 network IP address. All the RTUs used in this setup use Ethernet as their source of communication. This Netgear Network Switch 5 connects all the RTU’s. It also receives a connection from the local area network infrastructure of the University. Finally, the final red circle is the power supply. This has a simple On and Off switch. RTUs are used to connect directly to physical equipment at the other end. These devices are connected to the Supervisory Station. The RTUs will take analog input and signals and then convert them into digital representations and send them to the Supervisory Station. RTUs will also receive data coming from the other direction. The Supervisory Station may tell a RTU to perform a function with the physical measure. In this case, the RTU will convert the digital signal to an analog signal, which the physical equipment can understand. Common examples of what RTUs can measure are: pressure, flow, voltage, current or open/closed status. By converting the digital signals received from the Supervisory Station the RTU can perform action such as closing a switch or a valve, or setting the speed of a pump. Controlling physical environment Receiving control requests from Supervisory Station REMOTE TERMINAL UNIT PHYSICAL ENVIRONMENT Receiving analog signals from physical environment Reporting physical environment data to Supervisory station Fig. 4 Simple Remote Terminal Unit Setup Fig. 4 shows how a RTU interacts between the physical equipment and Supervisory Stations. Arrows to the right are data being sent to the Supervisory Station, while arrows on the left are data being interpreted from physical environment. In Fig. 5, shows a simple RTU setup at Florida Gulf Coast University. In our example we are using a control box that is controlling 6 some kind of pump device that is not setup. The physical environment in this example is the human reaction when a person flips a switch. Fig. 5 Remote Terminal Unit in Florida Gulf Coast University CS lab 7 2. Definition of the Problem The SCADA technology was created to provide for an efficient and accessible control system. Unfortunately, this has caused huge security risks to be allowed in to the system. Many governmental and critical infrastructure facilities are run by a SCADA backbone, thus the interest in SCADA security is increased in recent years. Thus, the goal of the project is to analyze the security state of the current SCADA setup. 8 3. Prospective Solution 3.1 Hardware Level Analysis As with any SCADA systems, the setup in the CS lab is that of many devices each with their own level of security. Therefore, it makes sense to analyze the security implementations of each device in the simple SCADA setup. This will also include nonphysical devices such as the Computer Science Department local network and the Internet itself. While this is a hardware analysis, current running software will also be part of the report. 3.2 Software to Use Because of the protection provided by the extreme Networks router (see section 4.1), most of the software security analysis is conducted within the local area network. The two computer terminals on this network are: the workstation and the SCADA server. Fortunately, there are many options for security analysis on Linux/Apache servers. For this project netstat, Metasploit and Wireshark are used. However, because of the inability to log into the Red Hat server with a root account, it is impossible to install software on that machine. Netstat is a command line application that displays network connections for both incoming and outgoing. This also includes routing tables and many other network interface statistics. Netstat is preinstalled on Red Hat, thus this testing is done on the SCADA server. In the next step, Metasploit is used on the Windows XP workstation to pose a threat against the Red Hat SCADA server. The Metasploit project is an open source computer security project that focuses on penetration testing and vulnerabilities scanning [5]. Finally, Wireshark is used to scan the packets being sent from the workstation to the server, and the ones that return. This will tell, if the packets are being encrypted as they are sent or if HTTPS is used. Wireshark is a packet analyzer that is used often for network troubleshooting and security analysis [6]. 9 4. Implementation 4.1 Hardware Level Analysis Results The SCADA system setup at Florida Gulf Coast University involves using Red Hat and Apache for the webserver. The workstation is running fully patched Windows XP with no Anti-Virus installed. In between the work station and the SCADA server is a Netgear network switch with no hardware firewall. The computers are located on a special Computer Science network that is monitored and controlled with Extreme Networks hardware/software firewall. This provides industrial strength protection from Internet outsiders getting into the SCADA network. SCADA Server Red Hat 7.0 Kernel 2.2.16 Apache 1.3.12 MySQL RTU WorkStation Windows XP Professional Service Pack 3 Intel Pentium 4 2.80 GHZ 504MB of Ram All ports are stealth except port 80 which is opened for http RTU Computer Science Private Netw0ork Zone NETGEAR SWITCH All ports “Closed” Fig. 6 Network Setup Figure 6 is a diagram of the current network setup of our sample SCADA system. The two squares boxes represent our computer systems. More details are written in each box. The SCADA server is connected to the RTU’s without any kind of security protection. In between the SCADA server and the workstation, there is a Netgear network switch. This switch has all of its networks ports set to “Closed”. This means that the ports can be opened if the correct security requirements are met. This allows for SSH and HTTP communication to occur, or whatever else is needed between the SCADA server and the workstation. This could be a security risk if a 10 hacker physical plugs into the switch. He/she could then communicate with the SCADA server and workstation. This is however, a physical layer of security. The Netgear switch also connects to the Extreme Networks switch that “houses” the Computer Science Department network zone. This switch only allows for web traffic using HTTP on port 80. All other ports are set to stealth. This means other ports are not available for user outside of the network. Having only port 80 open proved to be very difficult, because many sites that use HTTPS or provide downloads through FTP were unavailable to me. Sites that used HTTPS or FTP for downloading software use port 443 or 21. This requires transporting software that is needed to install by USB. Nevertheless, the protection provided by the extreme networks router limits most security risks to the local network level. Thus, the test is conducted from the workstation PC and the server itself. Even though, no security system is 100% unhackable, however the protection provided by the extreme networks router is that of an industrial level. 4.2 Software Level Analysis 4.2.1 Netstat Results These netstats tests were conducted using an SSH connection via Putty on the Windows XP workstation connected to the Red Hat SCADA. The first test is using “netstat –at”, this displays all of the active network connections going through the primary network device. The results of this test are shown in Figure 7. One can see that there are several connections running when the test was conducted. The first few are connections coming from the Windows XP workstation. The SSH connection are the first two, while the other four are the actual SCADA website hosting. The connections following the first 5 are loopback connections. Loopback means that the ports are listening waiting for an active connection to be created. This is normal for a standard workstation setup, but for a server only required ports needed for the designed operation should be in the listening state. For this setup, that would be SSH and port 80 for HTTP access, all other ports should be closed and not listening. 11 [mgr@HyperTACII mgr]$ netstat -at Active Internet connections (servers and established) Proto Recv-Q Send-Q Local Address Foreign Address State tcp 0 268 HYPERTACII:ssh 69.88.163.28:4032 ESTABLISHED tcp 8217 0 HYPERTACII:ssh 69.88.163.28:3818 CLOSE_WAIT tcp 0 0 HYPERTACII:dfsinfo 69.88.163.28:1086 ESTABLISHED tcp 0 0 HYPERTACII:dfsinfo 69.88.163.28:1906 ESTABLISHED tcp 0 0 HYPERTACII:dfsinfo 69.88.163.28:1143 ESTABLISHED tcp 0 0 HYPERTACII:dfsinfo 69.88.163.28:1139 ESTABLISHED tcp 0 0 *:dfsinfo *:* LISTEN tcp 0 0 *:mysql *:* LISTEN tcp 0 0 *:www *:* LISTEN tcp 0 0 *:https *:* LISTEN tcp 0 0 *:printer *:* LISTEN tcp 0 0 *:ssh *:* LISTEN tcp 0 0 *:ftp *:* LISTEN tcp 0 0 *:time *:* LISTEN tcp 0 0 *:telnet *:* LISTEN tcp 0 0 *:shell *:* LISTEN tcp 0 0 *:login *:* LISTEN tcp 0 0 *:finger *:* LISTEN tcp 0 0 *:auth *:* LISTEN tcp 0 0 *:1024 *:* LISTEN tcp 0 0 *:sunrpc *:* LISTEN Fig. 7 Active TCP Internet Connections Next step is to run “netstat –l”. This test displays active network connections on the UDP network communication. For a server station, the number of ports that are listening for a connection should be at a bare minimum, maintaining only necessary connection. The results of this test are shown in Figure 8. Again we are faced with the problem that the server seems to be configured for a workspace environment rather than a locked down server. There are too many networks ports that are in the listening state. The dfs services should be in the listening sate, however there are many that are not required for the intended purpose of the SCADA server. 12 Udp udp udp udp udp udp udp udp udp udp udp udp udp udp udp udp udp udp udp udp udp udp udp udp udp udp udp udp udp udp udp udp udp udp 0 0 0 0 0 0 0 0 0 0 0 0 0 0 0 0 0 0 0 0 0 0 0 0 0 0 0 0 0 0 0 0 0 0 0 *:dfsvoice *:* 0 *:1044 *:* 0 *:1043 *:* 0 *:1042 *:* 0 *:1041 *:* 0 *:1040 *:* 0 *:1039 *:* 0 *:1038 *:* 0 *:1037 *:* 0 *:dfshsuport *:* 0 *:driver6 *:* 0 *:driver5 *:* 0 *:dfspatch *:* 0 *:driver0 *:* 0 *:driver3 *:* 0 *:1036 *:* 0 *:1035 *:* 0 *:1034 *:* 0 *:driver4 *:* 0 *:1033 *:* 0 *:driver2 *:* 0 *:driver1 *:* 0 *:1032 *:* 0 *:1031 *:* 0 *:1030 *:* 0 *:1029 *:* 0 *:1028 *:* 0 *:1027 *:* 0 *:1026 *:* 0 *:dfsinfo *:* 0 *:1025 *:* 0 *:1002 *:* 0 *:1024 *:* 0 *:sunrpc *:* Figure 8 Active UDP Network Connections Active UNIX domain sockets (only servers) Proto RefCnt Flags Type State I-Node Path unix 0 [ ACC ] STREAM LISTENING 792 /tmp/.font-unix/fs7100 unix 0 [ ACC ] STREAM LISTENING 797 /var/lib/mysql/mysql.sock Figure 9 Active UNIX Domain Sockets Figure 9 displays the result of “netstat –xl”. This command displays the Active UNIX domain sockets. Active domain sockets are also known as inter-process communication or IPC. This is 13 the data communications endpoint for exchanging data between processes executing within the same host operating system. This analysis proves to give a secure state result. The fs7100 process is required for xserver, which is the graphical interface required for terminal. FS stands for font server. Next, there is a mysql socket. The SCADA webserver uses a MySQL database, so this socket connection is required. No unnecessary socket processes are running. 4.2.2 Metasploit results Figure 10 Metasploit Bruteforce Configurations The next step in the SCADA security testing is to use Metasploit. To recap, Metasploit is an open source computer security project that provides extensive analysis on the security of a computer. A penetrability test is a method of evaluating the security of a computer system by simulating an attack from malicious outsiders. The first test with Metasploit is related to the brute-force attack. Brute-force involves systematically checking all possible keys until the correct key is found. Figure 10 shows the configuration that ran with the brute-force attack. All the known processes to be running on the server have been selected, which this includes 14 MySQL, HTTP, HTTPS, SSH, Telnet, FTP, LOGIN, SHELL, and SNMP. This means, the brute-force attack will attempt to crack the password of all those services. The attack attempts many different/common passwords, trying to login into the individual network services. Figure 11 Metasploit Brute-Force Results Figure 11 displays the very end of the Metasploit brute-force test. The entire attack log is very long and would not fit in this report. As one can see in the line at the end of figure 11, “Complete (0 sessions opened)”, this means that none of the dictionary passwords and usernames were able to hack the system. The fake attack took 7 minutes to complete. The test is indeed a result that shows good security levels for the SCADA server. It means that the passwords and usernames used for the various services used are at a very complex level that a brute-force attack could not compromise. However, there are more complex and long lasting brute-force attacks that could eventually compromise the system. 15 Figure 12 Metasploit Exploit results The next step in Metasploit tests was to run the Metasploit Exploit test. This attack is the most common test in testing the vulnerability of a server. An exploit is a piece of software that takes advantage of a bug, glitch or vulnerability in order to cause unanticipated behavior to gain access to a computer system. The exploit took three minutes to run, relatively quick. Again, at the end of the screenshot shown in Figure 12, the attack resulted with 0 opened sessions. This means that the current Red Hat operating system and Apache/MySQL installation are up to date and patched. This is very important for the security of the entire SCADA system. Metasploit PRO, which is used in the testing, allows for the creation of reports. To create a report, login to the Metasploit frontend as described in the Appendix. In the top right corner of the page there is a “Report” tab, click on that. This will display the page as shown in Figure 13. 16 Figure 13 Metasploit Reports Page Continue by clicking on the “Standard Report” button. This will bring you to a page where you can choose to run different reports to your liking. This is shown in Figure 14. Finally click on “Generate Audit Report”. 17 Figure 14 Report Generator After you run the report generator, it will create files in “C:\metasploit\apps\pro\reports”. Figure 15 shows an example report generated by Metasploit. 18 Figure 15 Sample Metasploit Report 19 4.2.3 Wireshark Results Figure 15 Wireshark Login Packet In this final security analysis test, common open-source packet analyzer software called Wireshark was used. The test was conducted by starting a packet capturing session in Wireshark. Then I opened up a browser from the workstation and navigated to the SCADA server front end, where I was prompted to log in, and provided my username (dfs) and password. Then I continued to click on the view tab of the frontend. After seeing a successful view of the current SCADA summary, I terminated the capturing session in Wireshark. During this session, 5325 packets were captured. Most of these packets have nothing to do with our SCADA security testing, however they can be filtered out by looking for the server’s IP address (69.88.163.30). In figure 13, one can see the login attempt packet. The packet displays the username “dfs”, however successfully encrypts the password part of the data packet. This is 20 extremely important, because a third party hacker could be sitting on the network and be able to get the password. But if he was able to capture this packet, he would need to unencrypt the password. Figure 16 Broken Packets caught by Wireshark Figure 14 shows that there are multiple packets being highlighted by a black highlighting and red font. Looking into the Wireshark color coding rules, one can see that this type of highlighting is reported as a “bad TCP” packet. With TCP, each packet is sent with a checksum. When the packet arrives on the server end, the checksum is checked, however with these packets, the checksums are not met. This does not necessary report a security threat. Nevertheless, having a constant stream of incomplete packets may be a potential vulnerability that could be exploited. Further investigation into why so many packets are sending with bad checksum would be recommended. 21 5. Conclusion Due to the industrial strength provide by FGCU Network Services on the Computer Science local area network, this SCADA setup is very secure from outside attacks. In order for a hacker to even touch the SCADA setup, he/she will need to be physically attached to one of the devices in the room. With the further testing of software security using Wireshark, Metasploit and netstat, we conclude that our SCADA server is fairly secure. Many of the tests reported in Section 4, show that the SCADA server running Red Hat is secure and patched with the latest updates. One slight problem is the fact that unnecessary ports are being left on the listening state. For the future of the project, it would be important to gain Root access to the Red Hat server. This will allow us to install the client version of Nexpose, which is an extensive vulnerabilities scanner. It is also highly recommended that the workstation computer is replaced, as it has multiple software issues. These issues severely delayed the success of the project. 22 6. References [1] National Communications System. “Technical Bulletin 04 1: Supervisory Control and Data Acquisition (SCADA) Systems”. Published by Communication Technologies, Inc. 14151 Newbrook Drive, Suite 400 Chantilly, VA 20151. Published October 2004. http://www.ncs.gov/library/tech_bulletins/2004/tib_04 1.pdf [2] Bennett, T. “Security in SCADA Applications”. Florida Gulf Coast University. Spring 2010. http://itech.fgcu.edu/faculty/zalewski/CNT4104/Projects/SCADA_Report6.pdf [3] Krutz, R L. “Securing SCADA Systems”. Published by Wiley Publishing, Inc. 10475 Crosspoint Boulevard, Indianapolis, IN. Published 2009 [4] Baumgarter, F. “netstat(8) – Linux man page”. Accessed December 2011 http://linux.die.net/man/8/netstat [5] Rapid7. “About Metasploit”. Accessed December 2011 http://metasploit.com/about/ [6] Sharpe, R. “Wireshark User’s Guide”. Published 2004 http://www.wireshark.org/docs/wsug_html_chunked/ 23 Appendix User Manual To use the SCADA system and the software tools properly instructions in the Appendix should be followed. 1. Hardware Setup 1. Please note the power supply unit should never be turned off. Thus it is implied in this user manual that the power supply is on. 2. Begin by turning on the SCADA server. This is done by pressing the up arrow, as shown in Figure 1. Figure 1 SCADA Server Power Up Button 3. Wait a few minutes so that the server has enough time to turn on. 24 2 Software Setup 1. Turn on and log into the workstation computer using the username “Operator” with no password. 2. Once the computer logs in completely, open up firefox which can easily be found on the desktop. 3. In firefox navigate to: hypertacii Figure 2 Hypertacii Frontend Login 4. Once the page loads, you will be prompted for a username and password. You can use: mgr for the username and htiimgr for the password. 5. You have successfully accessed the frontend web interface of our SCADA setup. 25 3 Netstat Netstat is only available on the Red Hat SCADA server. Red Hat comes preinstalled with netstat, thus there is no need for installation. You must plug in a monitor into the SCADA server. To the right of the power buttons is a VGA port. Please see Figure 16 for a reference. Next you will need to find a PS2 keyboard. There are USB ports on the server, however the Red Hat installation does not have USB drivers installed. Once you have your monitor and keyboard installed and ready to go, log into the console using mgr and htiimgr. Once logged in, reference section 4.2.1 for netstat commands and usage. 26 4 Wireshark 1. Once logged into the workstation computer (see section 5.2), open “Wireshark” from the desktop. 2. You will then want to create a connection to the SCADA server by visiting the frontend interface (see section 5.2). Figure 3 Wireshark Capture Screenshot 3. In Wireshark, navigate to the capture menu and choose “Interfaces”. This is shown in Figure 3. 4. This will bring up the Capture Interfaces window as shown in Figure 4. Choose the network device labeled “Broadcom NetXtreme Gigabit Ethernet Driver”. 27 Figure 4 Wireshark Capture Interfaces Dialog Box 5. Let this run for a few seconds and log into the Frontend interface. Once you think you have all the captured packets, you can stop the scan. 28 5 Metasploit Metasploit is already installed on the workstation computer. It also use a webbased frontend that can be viewed by using any browser on. This section will explain how to scan for vulnerabilities and run a brute-force attack. Figure 5 Metasploit in Start menu 1. Click on start on “Start” → “All Programs” → “Metasploit” → “Access Metasploit Web UI”. As shown in Figure 5. 29 2. This will open your default browser and bring you to “http://localhost:3790”. You maybe prompted with a security certificate issue, just click accept and continue. 3. Then login using zalewski and zalewski1! 4. On the projects page choose “Test” 5. To do a brute-force attach choose “Bruteforce”. Figure 6 Metasploit Brute-Force Configuration 6. Figure 6 shows the brute-force page. You must type in the IP address of the SCADA server which is 69.88.163.30. You can also choose the different services to attack. 30 7. Finally click “Launch Bruteforce” 8. Next you can run a Exploit test. You can do this by choosing the “Exploit” option on the project Test dashboard page. 9. On the “Automated Exploit” page, you will also have to type in 69.88.163.30 as your IP address to the SCADA server. See Figure 7 for other configuration settings. Figure 7 Metasploit Exploit Scanner