1
System 814
User Manual
Larson¥Davis Inc.
1681 West 820 North
Provo, UT 84601-1341
Phone: (801) 375-0177
FAX: (801) 375-0182
www.lardav.com
P/N: I814.01
SYSTEM 814 USER MANUAL
Copyright
Copyright Ó 1997 by Larson¥Davis, Incorporated. This manual and the software described in
it are copyrighted, with all rights reserved. The software may not be copied in whole or in
part for commercial use without prior written consent of Larson¥Davis Inc. The manual may
not be copied in whole or in part for any use without prior written consent of Larson¥Davis
Inc.
Disclaimer
The following paragraph does not apply in any state or country where such statements are
not agreeable with local law:
Even though Larson¥Davis, Inc. has tested the software and reviewed its documentation,
Larson¥Davis Incorporated makes no warranty or representation, either expressed or
implied, with respect to this software and documentation, its quality, performance, merchantability, or Þtness for a particular purpose. This documentation is subject to change
without notice, and should not be construed as a commitment or representation by Larson¥Davis Inc.
This publication may contain inaccuracies or typographical errors. Larson¥Davis Inc. will
periodically update the material for inclusion in new editions. Changes and improvements
to the program described in this manual may be made at any time.
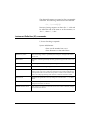
Please examine your instrument and record the following information below. You may be
asked to give this information in any future communications you have with Larson¥Davis,
Inc.
System 814 Serial # ______________________
Microphone Model ______________________
Microphone Serial # _____________________
ii
System 814 USER MANUAL
TTools Key ........................................................................................... 2-16
About .................................................................................................. 2-18
Calibration.......................................................................................... 2-19
Clock/Timer ...................................................................................... 2-21
Memory .............................................................................................. 2-23
Lock..................................................................................................... 2-25
Power Monitor................................................................................... 2-25
Communication................................................................................. 2-26
P Print Key ........................................................................................... 2-27
Chapter 3
OBA Octave Band Analyzer
3-1
Setting up the OBA ................................................................................. 3-2
Available Settings................................................................................ 3-3
Title Setting .......................................................................................... 3-4
OBA ScanMode Setting ...................................................................... 3-5
OBA ProÞle Setting ............................................................................. 3-6
OBA Bandwidth Setting..................................................................... 3-7
Range Setting ....................................................................................... 3-7
Transducer Setting .............................................................................. 3-8
Intv Enable Setting.............................................................................. 3-8
Intv Period Setting .............................................................................. 3-9
Intv Time Sync Setting........................................................................ 3-9
Intv Auto Stop Setting ...................................................................... 3-10
AC Out Weight Setting..................................................................... 3-10
Understanding OBA Displays............................................................. 3-11
Available OBA Displays ................................................................... 3-13
Live...................................................................................................... 3-14
Current................................................................................................ 3-16
OverAll ............................................................................................... 3-18
Interval History ................................................................................. 3-20
Run Log .............................................................................................. 3-22
Using the OBA ....................................................................................... 3-23
Simple OBA Scan............................................................................... 3-23
Chapter 4
sSLM-simple Sound Level Meter
4-1
Introduction to the Simple SLM Mode................................................. 4-1
Selecting the permanent Simple SLM setup........................................ 4-2
ii
System 814 USER MANUAL
Utilizing the Simple SLM setup when it is the active setup ......... 4-3
Editing the Simple SLM setup ............................................................... 4-4
Quick Keys ........................................................................................... 4-4
Editing Using the Setup Menu.......................................................... 4-7
sSLM Settings Menu ........................................................................... 4-9
Detector Setting ........................................................................................4-10
Weighting Setting .....................................................................................4-10
Range Setting ............................................................................................4-11
Transducer Setting ...................................................................................4-11
Pk-I Weighting Setting.............................................................................4-12
Current Exchange Setting........................................................................4-12
Current Threshold Setting.......................................................................4-13
Controls Settings Menu.................................................................... 4-14
AC Out Filter Setting ...............................................................................4-14
Logic Input Setting ...................................................................................4-15
Output 1 Logic Setting.............................................................................4-16
Output 1 Timer Setting ............................................................................4-18
Check Menu ....................................................................................... 4-18
Graph Menu ..............................................................................................4-19
Settings.......................................................................................................4-20
Controls......................................................................................................4-20
Understanding sSLM Displays............................................................ 4-20
Available sSLM Displays ................................................................. 4-23
SLM ..................................................................................................... 4-23
SnapShot............................................................................................. 4-25
Using the sSLM...................................................................................... 4-26
Simple sSLM Scan ............................................................................. 4-27
Chapter 5
∫SLM-Logging
Sound Level Meter
5-1
Setting up the ∫SLM................................................................................. 5-2
Title Setting .......................................................................................... 5-4
SLM Settings Menu............................................................................. 5-4
Detector Setting ..........................................................................................5-5
Weighting Setting .......................................................................................5-5
Range Setting ..............................................................................................5-6
Transducer Setting .....................................................................................5-6
Pk-I Weighting Setting...............................................................................5-7
OBA Filter....................................................................................................5-7
iii
System 814 USER MANUAL
TWA Menu ........................................................................................... 5-8
Overall Exchange Setting ..........................................................................5-8
Overall Threshold Setting .........................................................................5-9
Overall Criterion Level Setting.................................................................5-9
Current Exchange Setting........................................................................5-10
Current Threshold Setting.......................................................................5-10
Current Criterion Level Setting..............................................................5-11
LN Menu ............................................................................................. 5-11
Triggering Menu................................................................................ 5-12
SPL Trigger Level 1 Setting.....................................................................5-13
SPL Trigger Level 2 Setting.....................................................................5-13
Peak I Trigger Level Setting....................................................................5-14
Peak II Trigger Level Setting ..................................................................5-14
Hysteresis Setting .....................................................................................5-14
Time History Menu........................................................................... 5-15
History Enable Setting .............................................................................5-15
Hist Period Setting ...................................................................................5-16
Period Units Setting .................................................................................5-16
Other Level Setting...................................................................................5-17
Resolution Setting.....................................................................................5-17
Intervals Menu .................................................................................. 5-17
Interval Period Setting .............................................................................5-19
Interval Sync Enable Setting ...................................................................5-19
Interval LN Enable Setting.......................................................................5-19
Interval Auto-Stop Enable Setting .........................................................5-20
Interval Threshold Setting.......................................................................5-20
Interval Exchange Rate Setting...............................................................5-20
DeÞne Report Menu ......................................................................... 5-21
Data Report Setting ..................................................................................5-22
SPL Histogram Report Setting................................................................5-22
Pk-I Histogram Setting ............................................................................5-22
Pk-II Histogram Setting...........................................................................5-22
Intv Report Setting ...................................................................................5-22
Hist Report Setting ...................................................................................5-23
Controls Settings Menu.................................................................... 5-23
AC Out Filter Setting ...............................................................................5-24
Logic Input Setting ...................................................................................5-24
Logic Output Setting................................................................................5-25
iv
System 814 USER MANUAL
Logic Output Timer Setting ....................................................................5-27
Check Menus ..................................................................................... 5-28
Graph Menu....................................................................................... 5-29
Graph Level...............................................................................................5-29
Graph Scale................................................................................................5-29
Settings.......................................................................................................5-30
TWA ...........................................................................................................5-30
Understanding ∫SLM Displays ............................................................ 5-30
Available ∫SLM Displays .........................................................................5-32
Current / Overall -a SLM Displays .......................................................5-34
Current / Overall -b SLM Display.........................................................5-35
Current /Overall -c SLM Displays ........................................................5-36
Current / Overall -d SLM Displays.......................................................5-37
Current / Overall - e SLM Displays ......................................................5-38
Exposure-a Display ..................................................................................5-39
Exposure-b Display ..................................................................................5-40
Ln-a Display ..............................................................................................5-41
Ln-b Display..............................................................................................5-42
Stats-a Display ..........................................................................................5-43
Stats-b Display ..........................................................................................5-44
Stats-c Display...........................................................................................5-45
LDL Display ..............................................................................................5-46
Using the ∫SLM ...................................................................................... 5-48
Simple ∫SLM Scan .....................................................................................5-48
Chapter 6
Printing Reports from the 814
6-1
Connecting the 814 to a Serial Printer .................................................. 6-1
Printing Normal SLM Reports .............................................................. 6-2
DeÞning and Printing Tailored Reports........................................... 6-4
Using the Recall Format ..................................................................... 6-7
Default Settings Values for the Recall Format Reports.........................6-8
Printing a Custom Report ................................................................ 6-15
Printing Simple SSM Reports .............................................................. 6-16
Printing Octave OBA Reports ............................................................. 6-17
Chapter 7
Using the 814 Utility Software
7-1
Connecting the 814 to Your Computer ................................................ 7-1
814 Utility Installation ............................................................................ 7-2
v
System 814 USER MANUAL
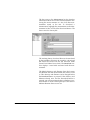
Starting the 814 Utility Software ........................................................... 7-2
814 Setups ................................................................................................. 7-3
Modifying and Uploading Setups to the 814 .................................. 7-4
Saving Setups to Disk Files................................................................ 7-5
Opening Setup Disk Files................................................................... 7-6
Creating a New Setup......................................................................... 7-7
Downloading Measurement Data......................................................... 7-7
Translating Measurement Data from a Downloaded File............. 7-9
Viewing a Translated File Within a Spreadsheet Program.......... 7-10
App. A
System Layout
A-1
System Menus .........................................................................................A-1
Octave Band Analyzer.......................................................................A-2
Simple Sound Level Meter................................................................A-3
Logging SLM System Menus ...........................................................A-5
System Displays....................................................................................A-10
Octave Band Analyzer.....................................................................A-10
Simple Sound Level Meter.............................................................. A-11
Logging Sound Level Meter ........................................................... A-11
App. B
Integrated Level Calculations
B-1
App. C
Serial Port Interface Remote Control
C-1
Interface Cables....................................................................................... C-2
Daisy Chain Addressing ....................................................................... C-3
814 Network, Addressing Commands............................................ C-3
Commands .............................................................................................. C-4
History Oriented Commands........................................................... C-5
Locating History Records.........................................................................C-6
Control Oriented Commands........................................................... C-7
Remote Control Commands (Detailed)............................................... C-7
Mode Commands............................................................................... C-7
ÒReadÓ Command (Reads out data variables)............................... C-8
Other Read Commands................................................................... C-19
Group Read Programming ............................................................. C-19
Settings................................................................................................... C-20
Querying Settings ............................................................................ C-21
vi
System 814 USER MANUAL
Entering Settings .............................................................................. C-22
Option Settings ........................................................................................C-22
Numeric Settings .....................................................................................C-23
Character String Settings........................................................................C-23
Template Settings ....................................................................................C-23
Setting List ............................................................................................. C-25
Histogram Reports........................................................................... C-29
Tailored Report ........................................................................................C-30
Miscellaneous...........................................................................................C-30
Error Checking I/O ......................................................................... C-33
History Records .................................................................................... C-35
Types of History ......................................................................................C-35
Advance ....................................................................................................C-35
Backup.......................................................................................................C-36
Find............................................................................................................C-36
History Data Variables ........................................................................ C-36
Exceedance History Variables ........................................................ C-36
Interval History Variables............................................................... C-38
Daily History Variables - (D1-D102)............................................. C-41
Run Log Variables ............................................................................ C-42
Calibration History Variables......................................................... C-42
Time History Variables (Logging SLM) ........................................ C-43
Histogram Table Variables.............................................................. C-43
Print Commands................................................................................... C-44
Error Messages and Warnings ........................................................... C-45
Modem Control Mode ......................................................................... C-47
Modem Mode (154).......................................................................... C-48
Dial Out Mode (155) ........................................................................ C-48
Monitor Number .............................................................................. C-48
814 Phone Dialing Procedure ......................................................... C-49
Model 814 Answering Procedure .................................................. C-50
Unsupported Miscellaneous Commands ......................................... C-50
Data File Commands ........................................................................... C-51
Name restrictions & conventions for IDs (Instrument DeÞnitions) .
C-52
Instrument DeÞnition (ID) commands ......................................... C-53
Sending Binary Data to the 814...................................................... C-54
vii
System 814 USER MANUAL
Data Block format....................................................................................C-55
ID upload .......................................................................................... C-56
ID Structures ............................................................................................C-56
Receiving binary data from the 814 ................................................... C-57
&S1 Ð Set Calibration Block command ......................................... C-58
&S2Ð Set System Settings Block command................................... C-58
&S3 Ð Set Measurement Settings Block......................................... C-59
Keyboard Simulation ........................................................................... C-59
Creating Bitmap of 814 Screen............................................................ C-60
Operation Notes ................................................................................... C-60
App. D
Technical Specifications
D-1
App. E
Glossary
E-1
Allowed Exposure Time (Ti).................................................................... E-1
Average Sound Level (Lavg) ................................................................... E-1
Calibration .................................................................................................. E-2
Community Noise Equivalent Level (CNEL, Lden) ............................ E-2
Criterion Duration (Tc)............................................................................. E-2
Criterion Sound Exposure (CSE)............................................................. E-3
Criterion Sound Level (Lc)....................................................................... E-3
Daily Personal Noise Exposure (LEP,d)................................................. E-3
Day-Night Average Sound Level (DNL, Ldn) ...................................... E-3
Decibel (dB) ................................................................................................ E-4
Department of Defense Level (LDOD)................................................... E-5
Dose ............................................................................................................. E-5
Detector....................................................................................................... E-5
Eight Hour Time-Weighted Average Sound Level (L TWA(8))......... E-5
Energy Equivalent Sound Level (Leq).................................................... E-5
Exchange Rate (Q), Exchange Rate Factor (q), Exposure Factor (k)... E-6
Far Field ...................................................................................................... E-6
Free Field .................................................................................................... E-7
Frequency (Hz, rad/sec) .......................................................................... E-7
Frequency Band Pass Filter ...................................................................... E-7
Frequency Filter - Weighted .................................................................... E-8
Leq ............................................................................................................... E-9
Level (dB).................................................................................................... E-9
Measurement Duration (T) .................................................................... E-10
Microphone Guidelines .......................................................................... E-10
viii
System 814 USER MANUAL
Near Field ................................................................................................. E-12
Noise.......................................................................................................... E-13
Noise Dose (D) ......................................................................................... E-13
Noise Exposure ........................................................................................ E-14
OSHA Level (LOSHA)............................................................................ E-14
Preamplifier.............................................................................................. E-14
Projected Noise Dose .............................................................................. E-14
Single Event Noise Exposure Level (SENEL, LAX) ........................... E-14
Sound ........................................................................................................ E-14
Sound Exposure (SE)............................................................................... E-15
Sound Exposure Level (SEL, LET) ........................................................ E-15
Sound Pressure ........................................................................................ E-16
Sound Pressure Level (SPL, Lp) ............................................................ E-17
Sound Power(W) ..................................................................................... E-18
Sound Power Level (PWL, Lw) ............................................................. E-18
Sound Speed, (c,) ..................................................................................... E-19
Spectrum (Frequency Spectrum)........................................................... E-19
Threshold Sound Level (Lt) ................................................................... E-19
Time Weighted Average Sound Level (TWA, LTWA(TC)) .............. E-19
Time Weighting ....................................................................................... E-19
Vibration ................................................................................................... E-20
Wavelength (l).......................................................................................... E-20
Wavenumber (k)...................................................................................... E-20
Yearly Average Sound Level (YDNL, Lydn)....................................... E-20
Index
ix
System 814 USER MANUAL
x
CHAPTER
1
Introduction
Welcome to the Larson¥Davis System 814. This versatile instrument, with graphic display, performs the
functions of several instruments. It is a simple Òpoint
and shootÓ Sound Level Meter (SLM), an integrating
SLM with data logging, and an Octave Band Analyzer
(OBA) with automatic scanning. Although many users
discover the features and operation of the System 814
by glancing at its keypad, we invite you to read this
manual to get the most out of your new Larson¥Davis
sound level meter.
About This Manual
This manual has 5 chapters and 3 appendices covering
the following topics:
Chapters
¥ Chapter 1 - Introduction: overview of this user
manual and the System 814Õs features, functions
and measurement capabilities; unpacking the System 814; quick start procedures.
¥ Chapter 2- Reference: overall system setup; description of each key along with its function and displays; working with menus.
¥ Chapter 3- OBA (octave band analyzer): Setting up,
viewing displays, and using the OBA.
¥ Chapter 4- sSLM (simple sound level meter): Setting up, viewing displays, and using the sSLM.
1/23/98
Introduction
1-1
¥ Chapter 5- ∫SLM (data logging sound level meter):
Setting up, viewing displays, and using the ∫SLM.
Appendices
¥ Appendix A - System Layout: layout of instrument
menus and displays.
¥ Appendix B - Integrated Level Calculations: basic
and SEL calculations, dose and projected dose calculations.
¥ Appendix C- Technical SpeciÞcations: listing of
acoustic, electronic, environmental, and physical
characteristics of the System 814.
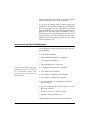
About This Chapter
SpeciÞcally, this introductory chapter covers the following topics:
¥ Formatting Conventions: explanation of the fonts
and other formatting conventions used in this manual.
¥ Features: overview of the System 814 keypad, functions and measurement capabilities.
¥ Getting Started: instructions for unpacking, inspecting and initially assembling the System 814.
Formatting Conventions
This manual uses the following format conventions:
In step-by-step directions, the process (what you do) is
shown in the left column, and the rationale (why you
do it) with other cautions and comments are shown in
the right column.
1-2
System 814 User Manual
1/23/98
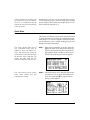
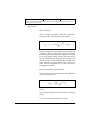
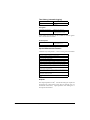
Information or messages that are shown on the System
814Õs LCD display are shown in a bold sans serif font.
For example:
Éas indicated by a ÒCalculatingÓ status message.
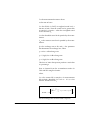
Keys to press on the System 814 are shown in a font
representing the appropriate key. For example:
Press the v key
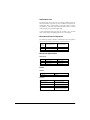
Items that appear in various on-screen menus (such as
settings) are shown in an italicized font. For example:
Detector
[Slow]
Features
The Larson¥Davis System 814 has the following features: general, OBA, simple SLM, and logging SLM.
General
¥ Large backlit true bitmapped graphics display
¥ Soft rubber backlit keys
¥ Pop-up menus with scroll bars
¥ Pick and choose setup...just click and run!
1/23/98
Introduction
1-3
¥ Three instruments in one: simple sound level meter,
octave band analyzer, and data logging sound level
meter
¥ File management system (stores multiple measurements)
¥ Type 1 precision integrating sound level meter (satisÞes IEC 651-1979, 804-1985, draft standard IEC
1672 and ANSI S1.4 1983) with optional integrated,
autoscanned 1/1 and 1/3 octave Þlters
¥ Exceptionally large dynamic range (up to 110 dB)
¥ Slow, Fast, and Impulse RMS detectors
¥ Dual Peak detectors
¥ Standard memory (256 KB) sufÞcient to store:
- 6,564 1/1 octave spectra
- 3,200 1/3 octave spectra
- 5,688 simple SLM snapshots
- 7,529 intervals without Ln
- 4,923 intervals with Ln
- 240,000 point time history
¥ Optional memory:
- 512 KB (814 OPT-90 - .5)
- 1.25 MB (814 OPT-90 - 1)
- 2.0 MB (814 OPT-90 - 2)
¥ AC output with gain control: -6 to +20 dB
¥ DC output
¥ Flash memory for in-Þeld Þrmware upgrades
¥ Environmentally friendly low power usage battery
with life up to 40 hours
¥ Multi-tasking real-time operating system: continue
to measure while viewing, transferring, or printing
data
¥ RS-422 serial interface (serial bit rate to 115 Kbps)
¥ Direct report printouts
1-4
System 814 User Manual
1/23/98
¥ WindowsTM-based software included for setup, control, and high speed data downloading and translation to ASCII format
OBA Features
¥ Automatic Þlter scanning
¥ Live, current, and overall spectra graphs
¥ Interval history of spectra
¥ Filter sets:
- 31.5Hz to 8KHz, octave and Þlters (814 OPT-30)
- 31.5Hz to 16KHz octave and Þlters and 25Hz to 20
KHz .one-third octave Þlters (814 OPT-31)
Simple SLM Features
¥ Quick on-screen setting adjustment
¥ Back-erase (up to 50 seconds)
¥ Snapshot memory (Snapshots of data stored to
memory)
Logging SLM Features
¥ Overall SLM
¥ Current SLM, resetable for making spot checks during measurements
¥ Functions measured: SPL, Lmax, Lmin, Lpeak I,
Lpeak II, TWA, SEL, elapsed time, start time, end
time, six Ln values (0.01 to 99.9%), time stamps for
single events (Lmax, Lmin, etc.).
¥ Interval statistics history (includes 6 Ln values)
¥ Time history
¥ Ln statistic graph (1 to 99%)
¥ Printable distribution and cumulative histograms
Overall & Current measurements
1/23/98
Introduction
1-5
¥ Contains two independent data buffers (primary
and secondary)
¥ Primary buffer contains data referred to as the
ÒoverallÓ measurements
¥ Secondary buffer contains data referred to as the
ÒcurrentÓ measurement
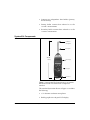
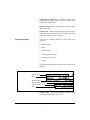
System 814 Components
Condenser
Microphone
PreampliÞer
38 cm
(15Ó)
LCD Display
Keypad
9 cm
(3.5Ó)
Connectors
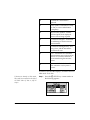
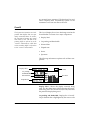
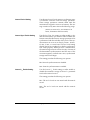
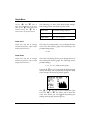
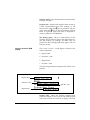
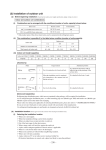
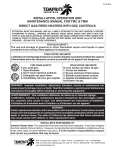
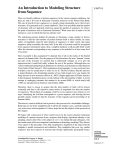
Figure 1-1 System 814. The System 814 is a convenient
hand-held sound level meter with a simple user
interface.
The standard System 814 shown in Figure 1-1 includes
the following:
¥ 1/2Ó diameter condenser microphone
¥ Backlit graphic 64 x 128 pixel LCD display
1-6
System 814 User Manual
1/23/98
¥ 14-key soft rubber backlit keypad
¥ AC output gain control, AC/DC output, control,
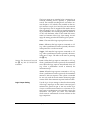
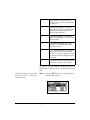
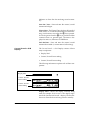
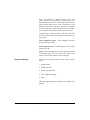
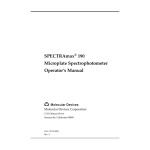
serial, and external power connectors (shown in Þgure Figure 1-2)
¥ True Òhand heldÓ instrument with Òsure gripÓ pads
¥ Sealed to prevent electrical shorts due to weather
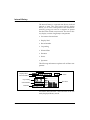
AC/DC Output Connector
AC Output Gain Adjustment (-6 to +20dB)
Control Connector
Serial Interface Connector
External DC Power Connector
Figure 1-2 System 814 Connectors. The System 814 has a
series of connectors located at the bottom of the device
consisting of an AC and DC output connection, AC
output gain adjustment, control connector, serial
interface connector, and external DC power connector.
AC/DC Output Connector
AC Output Gain Adjustment (-6 to +20dB)
Control Connector
Serial Interface Connector
External DC Power Connector
1/23/98
Introduction
1-7
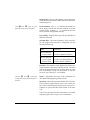
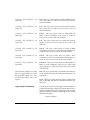
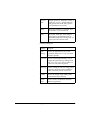
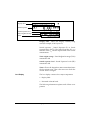
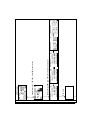
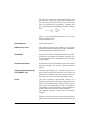
The following is a layout of the control connector,
serial connector and the AC/DC output connector:
3
1
2
4
5
8
7
6
9
Figure 1-3 Control Connector: The control connector is a
9 pin mini DIN connector.
1 - Ground, Control
2 - Logic output (0 to +5 volts, active high)
3 - Logic input (0 to +5 volts, active high)
4 - Wind speed input (.05 to 10 volts AC peak to peak)
5 - Wind direction A:D input (0 to +5 volts DC)
6 - Wind direction power (+5 volts DC through 250
ohms)
7 - Calibrator control output (0 or +5 volts DC)
8 - Heater control output (open collector, +50 volts DC
max, 0 556- .3 DC min 100mA)
9 - External power Input/Output (+8 to +15 volts DC)
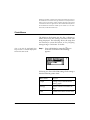
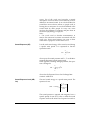
The serial connector is used for computer, printer and
modem communications:
1
3
6
2
4
7
5
8
Figure 1-4 Serial Connector: The serial connector is an 8
pin mini DIN connector (AppleTalk TM compatible
pinout).
1 - Flow control output (RS-232C levels)
2 - Flow control input (RS-232C levels)
3 - Transmit data negative output (RS-232C levels)
1-8
System 814 User Manual
1/23/98
4 - Ground
5 - Receive data negative input (RS-422)
6 - Transmit data positive output (RS-422)
7 - Control input (RS-232C levels)
8 - Receive data positive input (RS-422)
The AC/DC output connector is used to output the
signal from the System 814 microphone to external
devices such as DAT recorders, other sound level
meters, or other sound/vibration equipment.
AC Output
DC Output(+)
Ground (-)
Figure 1-5 AC/DC output connector
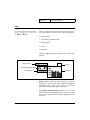
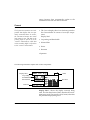
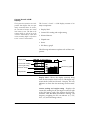
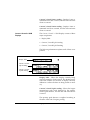
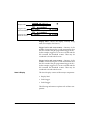
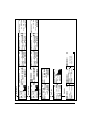
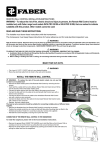
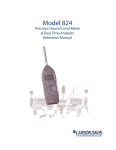
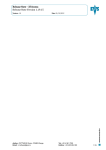
System Diagram
Figure 1-6, which follows, illustrates the acoustic-todigital signal path in the System 814. As you can see,
incoming sound is Þrst converted to an electrical signal
by the microphone. This electrical signal is Þltered,
detected (true RMS detector) and in turn sampled by
an analog-to-digital converter (ADC). The processor
then calculates all of the desired data based on the
sampled data (sample rate of 32 Hz).
1/23/98
Introduction
1-9
Figure 1-6 System Diagram.
1-10
System 814 User Manual
1/23/98
PreampliÞer
Key Pad
Control
I/O
mic
RAM
1/4 to 2 MB
Filter Set
814 OPT 30
814 OPT 31
1/1 or 1/3 +1/1
Flat
C
A
Flash ROM
Serial
Communications
Recommended System (minimum)
IBM PC or compatible
OS: Windows3.1 or Windows95
Processor: 486 or greater
RAM: 8 megabytes
Hard Disk space: 2 mega bytes
Available Serial Port
Real-time Clock
& Calendar
Microcomputer
True RMS Detector
Peak Detector II
Peak Detector I
Digital
Converter
Analog
to
AC
DC
Computer
(User Supplied)
I/O
Serial
Printer
CBL006
128 x 64 w/ Backlight
CBL042
DC
AC
PSA017
Liquid Crystal
Display
CBL002
RS-422
Transceiver
Power
Supply
Battery
+
External
Power
Overall and Current Measurements
The System 814 contains two independent data buffers
that can separately accumulate data. In essence, the
instrument becomes two sound level meters in one.
The data in the primary buffer is referred to as the
ÒoverallÓ measurement, while data in the secondary
buffer is referred to as the ÒcurrentÓ measurement.
When a new measurement is initiated, the data in the
ÒoverallÓ and ÒcurrentÓ buffers will be identical until
the ÒcurrentÓ buffer is reset. Following the reset, the
data in the ÒcurrentÓ buffer represents a new measurement originating at that instant while the ÒoverallÓ
buffer continues with the original measurement.
Getting Started
This section outlines the steps to follow when you Þrst
receive and unpack the System 814. The following topics are covered:
¥ Unpacking and Inspection
¥ Accessories and Optional Equipment
¥ Connecting Internal or External Power
¥ Quick Start
¥ Environmental Considerations
You will then be ready to use the System 814 for actual
measurements.
Unpacking and Inspection
Your System 814 has been shipped in protective packaging. Please verify the package contents with the following list (Accessories and Optional Equipment) and
retain the shipping containers for safe shipment at a
1/23/98
Introduction
1-11
future date. Report any damage or shortage immediately to Larson¥Davis, Inc. at (801) 375-0177.
If you have not already done so, please record your
instrumentÕs serial number (located on the label on the
back of the System 814), the microphone model and
serial number (located on the inside ring of the microphone, and on the side of the pre-ampliÞer), and the
purchase date at the beginning of this manual (see the
copyright page). You may be asked to give this information in any future communications you may have
with Larson¥Davis, Inc.
Accessories and Optional Equipment
The System 814 is delivered with the following standard accessories:
¥ System 814 instrument
¥ Model PRM904 microphone preampliÞer
¥ Air condenser microphone
¥ Alkaline batteries, 3 x AA 1.5 volt
Wind noise can adversely affect measurements. Using the windscreen
on the microphone reduces wind
noise and protects the element from
dust and bumps.
¥ 3Ó diameter windscreen (L¥D # WS001)
¥ User manual (L¥D #I814.01)
¥ Serial cable to computer (L¥D # CBL006)
¥ Serial cable to printer (L¥D # CBL002)
¥ AC/DC out cable 1/8Ó miniphone to dual BNC
(L¥D #CBL042)
¥ AC power adapter (US only) 115 volts AC to 9 volts
DC (L¥D # PSA017)
¥ Hard case 15Óx19Óx7Ó (L¥D #CCS001)
¥ 814 utility software (WindowsTM)
The following optional equipment is also available:
1-12
System 814 User Manual
1/23/98
¥ CAL200 Sound Level Calibrator (IEC 942-1988
Class 1L)
¥ CAL250 Sound Level Calibrator (IEC 942-1988
Class 1L)
¥ Outdoor preampliÞer (L¥D # PRM2101)
¥ 20 foot microphone extension cable (L¥D # EXL020)
¥ Direct BNC microphone input adapter (L¥D
#ADP005)
Connecting Internal or External Power
To insert the three AA batteries in the System 814,
unscrew the battery cover at the back of the System 814
by hand or using a ßat blade screwdriver. Insert the
batteries so that the markings in the battery compartment match those found on the batteries. For greatest
battery life use alkaline AA batteries. (Refer to the v
key description in Chapter 2 and Appendix C of this
manual for additional battery information.)
WARNING!
Inserting the batteries incorrectly can cause damage to
the unit!
Figure 1-7 Internal Battery Source.
1/23/98
Introduction
1-13
If the System 814 is not being used
for long periods of time (3 months or
more), it is recommended that the
batteries be removed to avoid damage
to the instrument.
Alternatively, you may use an external power source
via the external power connector using the provided
power adapter. The System 814 accepts 8V to 15V DC
and is internally fused at 0.5 A.
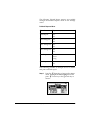
Quick Start
This section will help you turn on the System 814 (Step
1), check the battery level (Step 2), calibrate the instrument (Steps 3-5), activate a speciÞc instrument deÞnition ID (Steps 6-7), take a sample reading (Step 8), and
Þnally turn off the instrument.
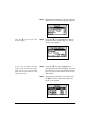
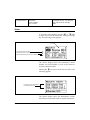
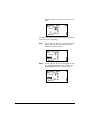
This screen displays three lines of
user information which may be
deÞned as name and address settings. This display also shows the
serial number of the instrument and
the Þrmware version and date. The
System 814 then loads the last
instrument deÞnition (ID) selected.
Step 1 Turn on the System 814. To do this, press the
v key (located on the left portion of the key
pad). By pressing this key, the Larson¥Davis
logo appears while a number of tests are performed. The following screen then appears:
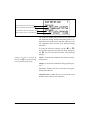
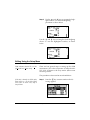
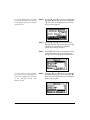
This screen shows you the current
power source, battery level, and
external power voltage.
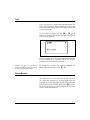
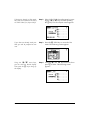
Step 2 Check the battery level. After the System 814
is turned on, you can check the battery level.
To do this, press the v key again. The following screen appears:
1-14
System 814 User Manual
1/23/98
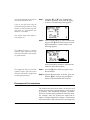
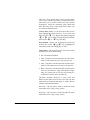
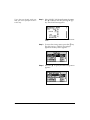
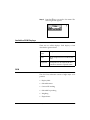
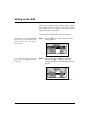
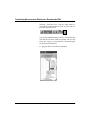
Step 3 Calibrate the instrument. To do this, press the
TTOOLS key. The following menu appears:
Press the r key to edit the Calibration settings.
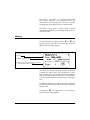
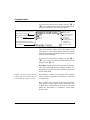
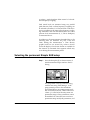
Step 4 Using the d key, highlight the Calibration
menu item, then press the r key. The following screen appears:
If you select to calibrate the high
range as well as the Normal range,
there will be a forty second delay
while the instrument stabilizes at the
High range setting.
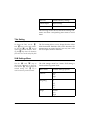
Step 5 Using the d key again, highlight the
Change menu item. Press the c key to accept
the Calibration settings. Activate the calibrator
(optional equipment) and follow the on-screen
instructions.
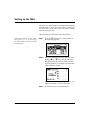
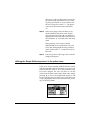
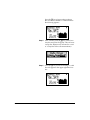
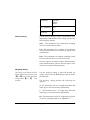
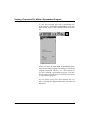
Step 6 Activate an instrument ID. To do this, press
the SSETUP key and the following Setup
menu screen appears:
1/23/98
Introduction
1-15
You may be prompted at this time to
save the last ID used or data.
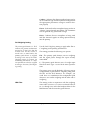
Step 7 Using the u or d keys, highlight the
ÒSIMPLEÓ ID (SSM). Then, press the c key
to select it. The following screen appears:
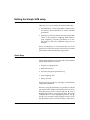
If this is your Þrst time using the
System 814 and you have not set up
any IDÕs, or have not taken any readings, select ÒnoÓ if prompted to save
last ID or to save data.
The Simple Sound Level Meter is
now ready to use.
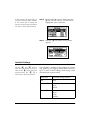
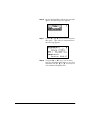
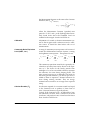
Step 8 Take a sample reading. To take a sample reading press the s RUN/STOP key to start taking measurements. A screen similar to the
following appears:
The instrument shows a running
symbol (upper right hand corner)
when the instrument is actively taking measurements.
Let the instrument continue to take measurements for about three minutes.
The instrument shows a black box
(upper right had corner)
symbol
when the instrument is stopped and
not taking measurements.
Step 9 Press the s RUN/STOP key again to stop
the instrument.
Step 10 Turn off the instrument. To do this, press and
hold the v key until you are prompted to
release it. The instrument then turns off.
Environmental Considerations
The System 814 sound level meter can be used and
stored in a wide range of temperatures, which are free
of moisture and condensing humidity conditions.
However, common-sense precautions should be taken.
For example, allow the System 814 ample time to
adjust to abrupt temperature changes. Condensation
may form inside a cold instrument if it is brought into
1-16
System 814 User Manual
1/23/98
a warm room or vehicle and may persist long after the
outside case has adjusted to the ambient temperature.
Temperatures inside closed vehicles can also reach
excessive levels. Therefore, do not leave the instrument in
direct sunlight in a vehicle. A simple safeguard is to keep
the instrument inside its sealed foam insulated case
with desiccant silica gel, available at photographic
equipment stores.
1/23/98
Introduction
1-17
1-18
System 814 User Manual
1/23/98
CHAPTER
2
Reference
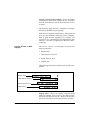
This chapter contains information on the functions
which are accessed through the System 814 keypad
(see Figure 2-1 below):
Figure 2-1 System 814 Keypad.
The 14 keys on the System 814 keypad are organized
into these four sections: Power, Measurement, Navigation, and Control. These keys are covered in the following order in this chapter:
2/27/98
Reference
2-1
Power Key
v
POWER
Turns on / off the System 814.
Measurement Keys
s
RUN/
STOP
Begins and ends measurements.
p
PAUSE
Pauses readings.
R
RESET
Resets data. (Current, Overall,
Options, etc.)
Navigation Keys
....u
lr
....d
ARROW
Used to move through System 814
menus and change settings.
c
SELECT
Selects highlighted menu items (like
a button on a mouse), concludes data
entry (like the Enter key on a PC keyboard) and activates context speciÞc
menus (called Check menus).
Control Keys
2-2
V
VIEW
Changes views in sSLM, OBA, or
∫SLM modes. Selects data to view.
D
DATA
Displays the Data Files menu.
System 814 User Manual
2/27/98
S
SETUP
Displays the Setup menu. Allows you
to view and change system modes
and conÞgurations within a chosen
mode.
T
TOOLS
Displays the Tools menu. Allows you
to change Calibration, Clock/Timer,
Memory, Lock, Power Monitor, and
Communication settings.
P
PRINT
Displays the Print menu. Allows you
to change print settings, and to print
data reports and Snapshots.
The functions and displays associated with the above
keys are next described. In addition, relevant reference
material is included for parameters and options which
may be available for keys on the System 814 keypad.
NOTE: The reference information in this chapter is organized
according to functions, rather than by tasks (which can use several
functions). We therefore invite you to also read the tasks which are
outlined in Chapters 3-5 of this manual.
v
Power Key
The purpose of the POWER key v on the System 814
is to turn the power on or off, exit and close menus,
and display the remaining battery life. Once the System 814 is turned on, pressing the v key again will
activate a PWR display which allows you to change
screen contrast, turn the backlight on or off, and adjust
power options. To turn the instrument off, press and
hold down the v key until prompted to Please
release key. Release the v key and the instrument
turns off.
This section discusses the following:
¥ Power-up the Instrument / Viewing PWR Display
¥ Power Settings
2/27/98
Reference
2-3
¥ Extra Notes on Power Conservation
Power-up the Instrument / Viewing PWR Display
To turn on the power:
Step 1 Press the v key.
Step 2 Allow the instrument to stabilize (warm up)
as indicated by the hourglass symbol in the
screenÕs upper right hand corner.
Step 3 After the instrument has Þnished stabilizing
(as indicated by the black box symbol in the
screenÕs upper right hand corner), the System
814 is ready for operation.
After the System 814 is turned on, you can view the
battery life and display settings through the PWR display. To do this:
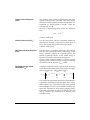
Step 4 Press the v key so the following PWR display appears:
a. Pressing the v key again will return you to the previous display.
b. From this display, you can adjust the contrast and turn
the backlight on or off. Pressing the u or d key
adjusts the contrast. Pressing the r key turns the
backlight on or off.
This simple display indicates that the System
814 is not plugged into an external source
which is 0.0 volts; the battery is 66% full; the
backlight is off; and contrast is at 60%.
2-4
System 814 User Manual
2/27/98
Step 5 From the PWR display, you can adjust the
Power setting. To do this, press the c key.
The following Check menu appears:
a. Check menus allow you easy access to system or instrument settings.
b. Using the uord arrow keys, select the desired
menu item then press the r key to make changes to
the setting.
This menu allows you to adjust the contrast (or viewing angle), turn the backlight on or off, and adjust settings that control the power-conservation features.
These power-conservation features allow you to set the
instrument to do the following:
¥ Turn the backlight off after a set amount of time
¥ Automatically go into a standby mode after a set
amount of time
¥ Automatically shut off the instrument after a set
amount of time
¥ Conserve internal battery for memory retention
If no keyboard activity is detected for the period of
time set by the Backlight Time setting, the instrument
will turn off the backlight. This conserves battery life
since the backlight is a major consumer of battery
power. If Backlight Time is set to zero (0), then the timer
is disabled and the backlight will stay on until turned
off manually. If the battery capacity is less than 30%,
the backlight will automatically shut off in 3 seconds.
2/27/98
Reference
2-5
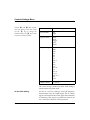
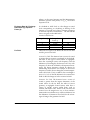
Power Settings
Use the u and d keys to
move from one setting to the next.
Then use the r key to change the
selected setting. The l key is
used to return to previous menus.
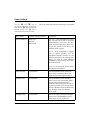
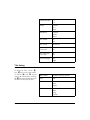
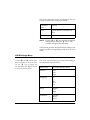
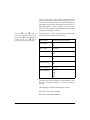
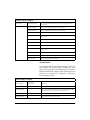
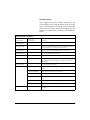
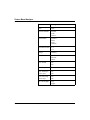
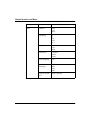
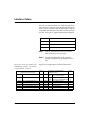
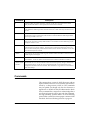
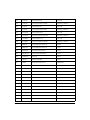
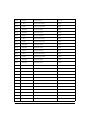
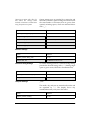
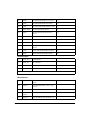
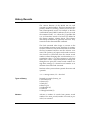
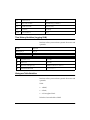
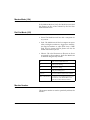
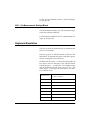
The Power menu provides the following seven options:
Menu Items
Available Settings Options
Description
Power Off Mode
Blank LCD
Auto Off
Manual Off
Blank LCD
- The instrument LCD display will turn off as well as the serial
communication port after the keyboard and serial port have been inactive for the period of time set by the
ÒStandby TimeÓ option.
- If the instrument is stopped
with no reports printing, and the
instrument remains inactive for the
period of time set by the Auto-Off Time
setting (i.e with no serial interface
commands or key presses), the instrument will turn off.
Auto Off
Manual Off - No
automatic power reduction features are enabled.
Auto Off Time
0 - 99 minutes
Time (in minutes) when ÒAuto OffÓ
power save is activated. When activated, the System 814 powers down.
Standby Time
0 - 99 minutes
Time (in minutes) when ÒStandby
TimeÓ power save is activated. When
activated, the System 814 screen
blanks and the serial port turns off. If
any key is pressed or if incoming serial
activity is detected, the instrument will
exit ÒStandby TimeÓ and become
active again.
Backlight Time
0 - 99 seconds
Time (in seconds) when the backlight
is turned off. The backlight is reactivated when any key is pressed.
2-6
System 814 User Manual
2/27/98
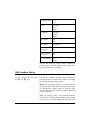
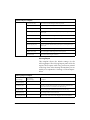
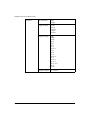
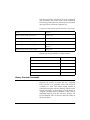
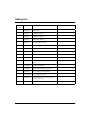
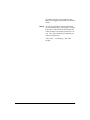
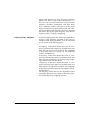
Backlight
On/Off
Turns backlight on/off.
LCD Contrast
0 - 99%
Adjusts the viewing angle of the LCD
display. This is done by pressing either
the up or down arrow key. The u
key increases the contrast percentage,
darkens the display and makes it visible from a higher angle (when viewing
from the bottom of the instrument).
The d key decreases the contrast
percentage, lightens the display and
makes it more visible from a lower
angle.
External Power
AC Pwr
Battery
Allows the user to select the source of
power consumption, either AC or battery.
- Indicates that the external
power source is not a battery. In this
mode, if the external voltage is less
than the internal battery voltage, then
the internal batteries will supply
power for the instrument.
AC Pwr
Battery - Indicates that the external
power source is a battery (which
should not be allowed to deep-discharge).
Extra Notes on Power Conservation
If you are using an external power supply, rather than
a battery, the v key will display the constant voltage
coming from the power supply. The System 814 can
operate for approximately 40 four hours when it is
running from new alkaline batteries. The instrument
can be set to conserve the internal batteries for memory retention only if it is to be powered by an external
power source by setting Ext Power to [Battery]. If the
external supply ever drops below the voltage set by
the Cut Off Volts setting, or reverts to internal battery,
the unit stops and turns off. This cut-off voltage is usu2/27/98
Reference
2-7
ally set to 10.8V which is the lowest voltage recommended for 12V sealed lead-acid batteries.
Discharging batteries deeply will greatly shorten their
service life.
s
Run/Stop Key
Use the s RUN/STOP key to toggle the data taking
mode of the instrument from stop to run or from run to
stop. The mode of the instrument is indicated on the
display in the upper right hand corner by a running
symbol if the instrument is running, or a black box
symbol if the instrument is stopped.
Repeatedly pressing the s RUN/STOP key after
beginning a measurement will stop, then restart the
measurement without resetting the data buffer. As a
result, the time will continue to increase for both the
current and overall measurements and the respective
integrated levels (time weighted averages) will represent data measured since the last reset.
NOTE: The System 814 contains two independent data buffers
that can separately accumulate data. In essence, the instrument
becomes two sound level meters in one. The data in the primary
buffer is referred to as the ÒoverallÓ measurement, while data in the
secondary buffer is referred to as the ÒcurrentÓ measurement.
R
Reset Key
Use the R RESET key to clear out the data of the current measurement.
Pressing the s RUN/STOP key after beginning a
measurement will stop the measurement, then restart
it without resetting the data buffer. If you are using the
simple sound level meter (SLM) instrument and wish
to reset the data, simply press the R RESET key. This
will reset the data including the accumulated measurement values such as Leq.
2-8
System 814 User Manual
2/27/98
NOTE: The System 814 contains two independent data buffers
that can separately accumulate data. In essence, the instrument
becomes two sound level meters in one. The data in the primary
buffer is referred to as the ÒoverallÓ measurement, while data in the
secondary buffer is referred to as the ÒcurrentÓ measurement.
For the other instrument types, the System 814 gives
additional ßexibility when resetting the data. If you
press the R RESET key while the instrument is running, the instrument will reset its data buffer for the
current measurement (i.e. the secondary SLM) and set
the elapsed time for the current measurement to zero
without affecting the data in the overall buffer.
On the other hand, if you press the R RESET key
while the instrument is stopped, a menu will appear
that will give you the choice of resetting the current
data, the overall data, or both current and overall data
together with the appropriate elapsed time counters.
When editing system or instrument settings containing
a string of characters, the R RESET key can also be
used to clear the characters from the current position
of the cursor to the end of the string.
p
Pause Key
Use the p PAUSE key to pause the measurement of
acoustic data. It is used to hold a displayed value or
prevent some undesired sound from affecting the measurement. In the sSLM mode, you can use pause to
extract the last measured data (up to 50 seconds) by
moving the cursor back in time on the graph, to
remove contaminated data. This can be accomplished
in the Pause, Back Erase screen. To activate this screen,
press the p PAUSE key when the instrument is running or actively taking measurements. The following
screen appears:
2/27/98
Reference
2-9
Use the l and r arrow keys to move the vertical
bar across the graph. As the vertical bar moves, the
SPL value from the time history display is shown digitally on the left of the screen. Once it is at the desired
point, press the c key to continue.
Moving the bar left is like moving
back in time.
Like the ÒstopÓ command, a ÒpauseÓ ignores incoming
signals; however, unlike the stop command, when a
ÒpauseÓ changes to the ÒrunÓ command, the instrument does not begin a new record.
Pressing the p PAUSE key when a instrument is
ÒstoppedÓ brings up a Preview display (shown below),
which allows the user to view the SPL and instantaneous peak levels without affecting measured data.
Pressing the p PAUSE key again will exit this screen
(or simply press the s RUN/STOP key to exit this
screen and start taking measurements again).
lrud
Arrow Keys
Use the u and d (Up and Down) arrow keys to
move from one item to another in a menu, or from one
record to another when displaying history data. Holding the key for a period of time will repeat the actuation of the key; the longer it is held the faster it repeats.
2-10
System 814 User Manual
2/27/98
These keys are also used to modify settings. Use the
u key to step to the next higher number or character value, and use the d key to step to the next
lower number or character value.
Use the l and r (Left and Right) arrow keys to
move between data displays, to move between characters of a setting being modified, and to move through
menus. Use the r arrow key to move from the current menu into a sub-menu or to modify a setting. Use
the l arrow key to move out of a setting, to move
from a sub-menu back to its parent menu, or to move
back to a previous menu or display. Holding the key
for a period of time will repeat the actuation of the key;
the longer it is held the faster it repeats.
c
Check Key
Use the c key to choose an item from a menu or to
confirm the entry of a setting. Pressing c in some displays will bring up a menu that will allow you to make
changes to settings appropriate to that display.
V
View Key
Use the VIEW key V to select the particular data display you wish to view. When you press the V VIEW
key, a menu containing the available data displays will
appear. The following example is a View menu for the
OBA (Octave Band Analyzer) instrument:
2/27/98
Reference
2-11
Use the u or d keys and c key to select the display desired. While viewing data, often more than one
display screen is available. You can use the l and
r arrow keys to move from one screen to another.
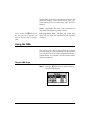
D
Data Key
Use the D DATA key to control the storing and
recalling of measurements from memory. Each measurement may contain cumulative data, time history,
interval history, and histogram tables that can be
stored and segregated in memory from other measurements with their data and histories. A list of all stored
data is shown and individually recalled by selecting it
using the arrow keys and check key.
To access the Data Files menu press the D DATA key.
A screen similar to the following appears:
From this menu you can store data, view stored data
(or Snapshots if you are using the simple sound level
meter) or recall data.
If the instrument is running when
you try to store a Data File, you will
be prompted to stop the measurement before storing the Þle.
2-12
To store measurement information into a Data File,
highlight Store Data (Store SnapShot is also available if
using the simple sound level meter) using the u or
d keys. Press the c key to select. The instrument
will beep twice to signify that the measurement has
been stored.
System 814 User Manual
2/27/98
To move from one record to another,
use the uor dkeys.
To exit the Data Records view, use
the VIEW key V.
Pressing the c key from this menu
brings up a menu that allows you to
recall data, jump to beginning or end
of all records, Þnd a speciÞc data Þle,
or purge all data Þles.
To view a Data File, use the u or d keys to select
the desired data Þle. Each data Þle is marked with a
number (e.g.: Recall: 01) and the instrument used (e.g.:
SIMPLE SSM). An entry with a * next to it indicates
that the data Þle is still in memory or that the data Þle
is currently recalled. Use the r key to view a summary of the data Þle. The following screen appears:
The Data Records screen shows the currently selected
record number (1/12), start / stop dates and times, and
the total bytes used by the record.
When recalling a data Þle, the System 814 will switch to the instrument that the data Þle was stored as
(i.e. OBA to sSLM, if the user was
currently using the OBA instrument and recalled an sSLM data
Þle).
S
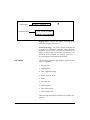
Using the c key after highlighting a data Þle from the
Data Files menu, allows you to recall previously stored
measurements. The menu will then close, and the previously active data display will be shown.
Setup Key
To the left of each ID is a symbol giving information about that ID: The
Ô>Õ symbol indicates that the ID is
currently active or that the ID is
currently in memory.
The locked symbol indicates that
the ID is locked which protects the
ID from being easily deleted.
The ÔpÕ symbol indicates that the ID
is permanent and pre-deÞned.
The Ô *Õ symbol indicates that the ID
has changed and is not yet been
saved.
2/27/98
Use the S SETUP key to access the Setup menu where
you can select, create, and manipulate groups of
instrument settings known as Òinstrument deÞnitionsÓ
(ID). The Setup menu presents a list of pre-deÞned IDs
(marked with a ÒpÓ) and user-deÞned IDs that are
available for use. To access the Setup menu, press the
S key. The following screen appears:
Reference
2-13
An ID defines the data that is to be measured for a particular project or type of application. The defined
project IDs are listed in the Setup menu. Using this
menu you can create, edit, copy, and delete these
project settings. You can also define a project ID on a
computer and then install it into the instrument where
it may be selected for use. For example, one project
may be the Òsimple SLMÓ (sSLM) where no data logging is performed and the weighting and detector controls are available in the data display (rather than in a
menu). Another example may be an hourly statistical
measurement set to run for 8 hours.
If data from a previous ID was not
saved, you will be prompted to do so
at this time. This can include data
that was accumulated from measurements or changes in ID settings.
To select an instrument deÞnition (ID), use the u or
d keys to highlight the desired ID. Press the c key
to select and activate the instrument deÞnition. The
Setup menu then closes and the main display reappears.
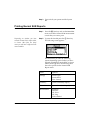
Use the Setup Tools menu to create new IDs. To do this,
press the T TOOLS key from the Setup menu. The
following screen appears:
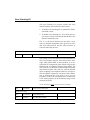
The Setup Tools menu allows you to create and/or
modify instrument deÞnition (ID) settings. The Setup
Tools menu provides the following three options,
2-14
System 814 User Manual
2/27/98
which are later described in greater detail:
Menu Items
Description
Save ID
Saves/Creates a ID
Title
Description of ID
ID Name
Name of ID
Save ID
The Save ID menu item creates a new ID. Use the u
or d keys to highlight ÒSave IDÓ, then press c.
You will then be prompted to enter a name for the ID.
The ID name Þeld is capable of holding up to 8 characters. Any spaces will be replaced with a Ò_Ó character.
Title
The Title menu item allows you to attach a description
to your ID. This description can be used on printed
reports and other items. The Title Þeld is capable of
holding up to 30 characters.
ID Name
The ID Name menu item allows you to give an ID a
unique name that represents the ID in the Setup menu.
The ID name Þeld is capable of holding up to 8 characters.
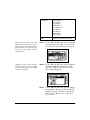
Write Protect, Delete, Write Enable IDs
After an ID has been created, it can be protected (or
locked), or deleted if necessary. To do this, use the u
or d keys from the Setup menu to highlight the
desired ID. Then press the T TOOLS key, and the following screen appears:
2/27/98
Reference
2-15
Permanent IDs (marked with a ÔpÕ
Setup menu) cannot be write protected, modiÞed, or deleted.
To write protect (or lock) an ID, use the u or
dkeys to highlight ÒWrite ProtectÓ, and then press
the c key. A locked symbol appears next to the ID
in the Setup menu symbolizing that this ID is ÒWrite
ProtectedÓ. Once the ID is write protected, it cannot be
changed or deleted until it is ÒWrite EnabledÓ.
Permanent IDs (marked with a ÔpÕ
symbol on the Setup menu) or write
protected IDs (marked with a locked
symbol on the Setup menu) cannot
be deleted.
To delete an ID that has not been write protected, use
the u or d keys to highlight ÒDelete IDÓ, then
press the c
key. The ID is removed from memory
and the ID name is removed from the Setup menu.
TTools
To write enable (or unlock) an ID, use the u or d
keys from the Setup menu to highlight the desired
write protected ID (marked with a locked symbol ).
Press the T TOOLS key. Press the c key on the
highlighted Write Enable menu option. The locked
symbol disappears next to the ID shown in the Setup
menu, symbolizing that this ID is write enabled.
Key
Use the T TOOLS key to access controls and operations such as calibration, battery usage, memory usage,
setting date and time, timer, or computer port settings.
In certain situations you also use the T TOOLS key
to delete, write enable, or write protect instrument definitions (ID) from the Setup menu (as previously
described).
Press the T TOOLS key to access the Tools menu.
Pressing the r key on a menu item from the Tools
menu allows you to modify settings. Pressing the c
key on a menu item from the Tools menu allows you to
view current settings and other displays.
2-16
System 814 User Manual
2/27/98
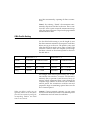
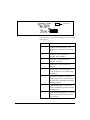
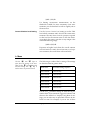
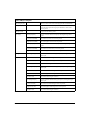
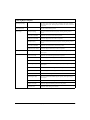
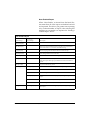
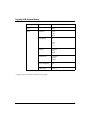
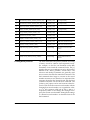
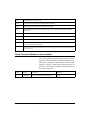
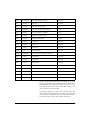
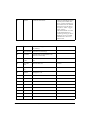
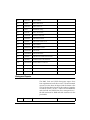
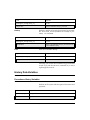
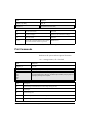
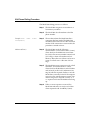
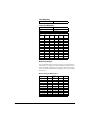
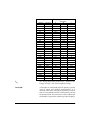
The Tools menu provides the following seven options,
which are afterwards described in greater detail:
Menu Items
Available Settings Options
(rkey from Tools menu)
Setting Screens
( c key from Tools menu)
About
Name
Name
Name
Title
a - System date and numbers
b - User information
c - Installed options
Calibration
Check
Change
Cal Level
Calibrator S/N
Calibration - dates, times, and
measurement when checked or
changed
Clock/Timer
Current Time
Current Date
Day of Week
Timer Mode
Run Date
Stop Date
Run Time 1
Stop Time 1
Run Time 2
Stop Time 2
a - Current time, date, and time
until next action
b - Timer mode status and settings
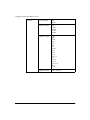
Memory
Purge All
Allocated IDÕs
Create EEPROM Backup
a - Memory status & current
......instrument memory information
b - Overall memory status
Lock
On/Off
Lock status
Power Monitor
Power Off Mode
Auto-Off Time
Standby Time
Backlight Time
Backlight
LCD Contrast
External Power
Battery - Power status and information
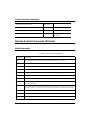
2/27/98
Reference
2-17
Communication
Baud Rate
Serial Address
Flow Control
Communications - List of bytes
sent and received, standby
timer
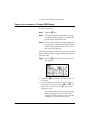
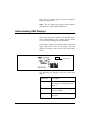
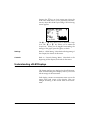
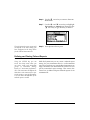
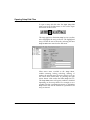
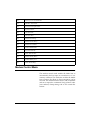
About
To access the About displays, use the u or d key
to select About from the Tools menu, then press the c
key. The following screen appears:
Instrument model number
Instrument serial number
Internal Þrmware revision number and
Internal SLM Þrmware revision number and
The About-a display shows the instrumentÕs model
number and serial number as well as the Þrmware
revision number and date.
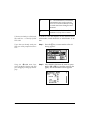
Pressing the rkey moves to the About-b screen. The
following appears:
Company name and address
(Customized by user)
The About-b display shows the instrumentÕs custom
name based on title Þelds used for System 814 reports.
2-18
System 814 User Manual
2/27/98
The Þelds are generally set to the ownerÕs name and
address. The name Þeld is used on summary data
reports.
Pressing the rkey again moves to the About-c
screen. The following appears:
Filter option availability (1/1 Octave Filter
Environmental Þrmware availability (Not availTotal instrument memory (in bytes)
Double boxes indicate that no optional ram is
installed
The About-c display shows the instrumentÕs total memory as well as the availability of the optional Þlter
module and environmental noise analyzer Þrmware.
To access the About settings, use the u or d key
to select About from the Tools menu, then press the
r key. The About setting offers three Name fields
and one Title Þeld for use on System 814 reports.
Settings can also be accessed by
pressing the c key from the setting
screens (previously described).
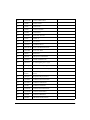
Name, Name, Name - There are three name lines available for user speciÞc data. Each Name Þeld provides 30
alpha/numeric characters, and is used to describe the
instrument or the organization to whom it belongs.
Title - Like the Name Þeld, the Title Þeld is capable of
holding 30 alpha/numeric characters. It shows you the
title of the ID (Instrument DeÞnition) you have created, and is used to describe the measurement.
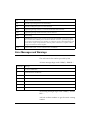
Calibration
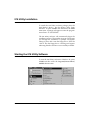
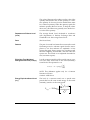
To access the Calibration display, use the u or d
key to select Calibration from the Tools menu, then press
the c key. The following appears:
2/27/98
Reference
2-19
Date and time of the last calibration
The level detected during the last check
Date and time of the last calibration change
Offset currently in use to calibrate the levels
The Calibration display shows the date and time of the
last calibration change and the offset being used to calibrate the levels. It also shows the date and time of the
last calibration check and the level detected during
that check.
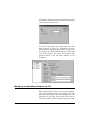
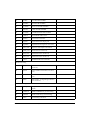
To access the Calibration settings, use the u or d
key to select Calibration from the Tools menu, then press
the r key. The Calibration has these four following
settings:
Settings can also be accessed by
pressing the c key from the setting
screens (previously described).
Check - Activates the calibration check (level veriÞcation) process.
Change - Activates the calibration change (adjust) process.
Cal Level - Enables the user to enter the level generated by the calibrator.
Calibrator S/N - Enables the user to record the serial
number of the calibrator (for reference).
2-20
System 814 User Manual
2/27/98
Clock/Timer
To access the Clock/Timer display, use the u or d
key to select Clock/Timer from the Tools menu, then
press the c key. The following appears:
Current time
Current day of the week and date
The time of the next timer function
The Þrst Time-a or clock display shows the current
time, day of the week, date, and the time of the next
timer function.
Pressing the r key again
moves to the Time-b screen.
The following appears:
The currently-selected timer mode
The run and stop dates
The Þrst run and stop times
The time of the next timer function
The Time-b or timer display shows the current timer
programming including the mode and all run and stop
times and dates.
Settings can also be accessed by
pressing the c key from the setting
screens (previously described).
2/27/98
To access the Clock / Timer settings, use the u or
d key to select Clock / Timer from the Tools menu,
then press the r key.
Reference
2-21
The Clock / Timer menu allows you to set the instrument's clock/calendar and timer. The Þrst three menu
items allow you to set the current time, date, and day
respectively, while the remaining items (Run/Stop
Date, Run/Stop Time 1, Run/Stop Time 2) allow you
to control the timer function.
Current Time / Date - To set the current time and/or
date, highlight the desired item (i.e. Time or Date) and
then press the r key. Modify the setting using the
l or r key to select the digit desired to modify,
then use the u or d key to modify.
Day Of Week - Allows you to change the current day
of the week. Use the u or d key to highlight the
desired day, then press the c key to select.
Timer Mode - The System 814 has four timer modes
selected by the Timer Mode setting:
¥
Off
- The timer is disabled.
¥
1/Day - The
¥
2/Day - The timer will automatically turn the instrument on and initiate two run/stop cycles per day.
¥
Block
timer will automatically turn the instrument on and initiate one run/stop cycle per day.
- The timer will automatically turn the instrument on and initiate a single measurement beginning at a certain time on one day and ending at a
certain time on the same or another day.
The three ÒenabledÓ modes (i.e. 1/Day, 2/Day, and
Block) use the dates set by the Run Date and Stop Date
menu items to determine the range of ÒvalidÓ days on
which to make measurements.
Run Date - The run date is used to enable the timer
mode when set to 1/Day, 2/Day, or Block.
Stop Date - The run date is used to disable the timer
mode when set to 1/Day, 2/Day, or Block.
2-22
System 814 User Manual
2/27/98
Run Time 1 / Stop Time 1 - If you have selected the
block mode, the timer will automatically turn the
instrument on. This setting allows the user to specify
the beginning and ending times of a measurement.
Run Time 2 / Stop Time 2 - Used to specify a second
measurement beginning and ending times in the 2/
day timer mode.
Memory
To access the Memory display, use the u or d key
to select Memory from the Tools menu, then press the
c key. The following appears:
Available memory (as a percentage of total data
memory)
Available memory (in bytes)
Number of various types of history records for
a given ID (sSLM in this example)
The Memory-a display shows the amount of memory
available for storing data. This information is given
both in bytes and as a percentage of the total memory
that can be used for storing data. (This Òtotal memoryÓ
does not include the memory allocated for setup registers.)
In addition, the Memory-a display shows the number of
previously-stored history records (of various types) for
the given ID.
Pressing the r key again moves to the Memory-b
screen. The following appears:
2/27/98
Reference
2-23
Available memory (as a percentage of
total data memory)
Available memory (in bytes)
Total data Þles in memNumber of setup registers allocated for
storing instrument deÞnitions (IDs)
Total memory, including both data and setup
register memory
The default value of this setting is 10
allocated setup registers (which uses
5120 bytes of memory). The maximum value of this setting is 50 allocated setup registers. The System
814 has Þve pre-deÞned ID registers
that are stored in permanent memory. These pre-deÞned ID registers
cannot be changed or deleted and do
not reduce the amount of data memory available. They are to be used
primarily as templates for new, userdeÞned IDs.
The top portion of the Memory-b display shows the
same Òavailable memoryÓ information as in the Memory-a display. In addition, the Memory-b display shows
the number of data Þles in memory; number of setup
registers allocated; and the total amount of memory,
including that which has been allocated for setup registers.
Settings can also be accessed by
pressing the c key from the setting
screens (previously described).
To access the Memory settings use the u or d key
to select Memory from the Tools menu, then press the
r key.
Purge All Data Files - Pressing the ror c key
when the Purge All Data Files menu item is highlighted,
allows you to purge all data Þles in memory.
Allocated IDÕs - Determines the number of setup registers that are allocated in memory for storing IDs. In
essence, this setting determines how much memory is
allocated for storing instrument deÞnitions. Setting
this to a higher value allows more IDs to be created,
but reduces the amount of memory available for data
storage by 512 bytes per allocated ID.
Create EEPROM Backup - Creates a permanent record
of the most recently used OBA, simple SLM, and logging SLM IDs so that they may be recreated in the
event of a memory loss.
2-24
System 814 User Manual
2/27/98
Lock
The Lock function is used to limit unauthorized control of the instrument. The Lock menu provides access
to the password setting and to the settings which lock
various operations.
To access the Lock display, use the uor d key to
select Lock from the Tools menu, then press the c key.
The following appears:
The Lock display shows the lock status and restrictions.
If the instrument is currently locked, the display
prompts you for the unlock password.
Settings can also be accessed by
pressing the c key from the setting
screens (previously described).
To change one of these Lock settings, highlight the
desired item and then press the r key.
Power Monitor
This menu allows you to adjust the auto-power on or
off, adjust the contrast (or viewing angle), turn the
backlight on or off, and adjust settings that control the
power-conservation features. Refer to the v key (earlier in this chapter) for a full description of the Power
Monitor menu and displays.
2/27/98
Reference
2-25
Communication
To access the Communication display, use the u or
d key to select Communication from the Tools menu,
then press the c key. The following appears:
Indicates current
address status.
Ô Õ Indicates system
ready to receive
commands.
Ô Õ Indicates
controlling device
(computer,
modem, etc.) is
ready to receive
Shows the last characters received
(none in this example)
Shows the last characters sent
(none in this example)
Shows the minutes of inactivity
remaining before the serial interface
powers down
The Communication display shows the status of the
serial port (i.e. how many minutes until the standby
mode is automatically enabled) and the last characters
received and transmitted.
To access the Communication settings, use the u or
d key to select Communication from the Tools menu,
then press the r key.
Baud Rate - Speed at which the System 814 communicates with controlling devices (computer, modem, etc.)
through the serial port. The baud rate has a range from
300 to 115000 baud.
Default is set to the value of the last
2 digits of the serial number and can
be set within the range of 1 to 100.
Serial Address - Address of instrument. This setting is
used to identify a particular instrument on a network
of instruments.
Flow Control - Flow control of the serial connection.
Flow control can be changed to None, Hardware, Xoff,
or Both. Flow control prevents the loss of data when
either the instrument or controllerÕs input buffer
becomes full.
2-26
System 814 User Manual
2/27/98
P
Print Key
Use the P PRINT key to print graphical and tabular
data reports directly from the instrument to a printer.
You can create high-resolution presentation-quality
reports when printing to a laser printer because of the
instrumentÕs PDL (page description language) capabilities. Draft-quality tabular data reports can also be
printed on virtually any printer.
The Print menu provides the ability to output reports
containing all the data gathered for the measurement
to an attached printer. The main Print menu is activated by pressing the P PRINT key and is common
to all ÒinstrumentÓ types (i.e. sSLM, OBA, and ∫SLM).
With an appropriate printer connection, you can print
any of the four indicated reports by highlighting the
corresponding menu item and pressing the c key.
Use any one of the Þrst three menu items to print the
corresponding standardized report. The three reports
are the same, regardless of the current instrument type.
Use the fourth menu item, Tailored Report, to print the
custom reports that are deÞned as part of an instrument deÞnition.
You can also request reports from a
computer and then print them using
the computer's printer.
2/27/98
Before you print a report, you can also select the Print
Option sub-menu which allows you to further customize a report. In this sub-menu you can selecting the
speciÞc elements to include in the report and also the
various data ranges for histograms, time histories, etc.
To access this sub-menu, highlight the Print Options
item then press the r key.
Reference
2-27
2-28
System 814 User Manual
2/27/98
CHAPTER
3
OBA Octave Band Analyzer
This chapter will help you better understand the System 814Õs OBA (Octave Band Analyzer). SpeciÞcally,
this chapter covers the following topics:
¥ Setting up the OBA: overview of the possible settings and conÞgurations of the System 814 in OBA
mode.
¥ Understanding OBA Displays: overview of the displays used in OBA mode and simple explanations
of how to read them.
¥ Using the OBA: simple applications that can be
used with the System 814 in OBA mode.
1/23/98
OBA Octave Band Analyzer
3-1
Setting up the OBA
There are four general steps for setting the System 814
to OBA mode: 1) Go to the Setup menu. 2) Select the
OCTAVE OBA. 3) Return to the Setup menu. 4)Then
enter the Settings menu.
This procedure is discussed in more detail below:
If the 814 is already in OBA mode,
there will be a Ô>Õ to the left of
OCTAVE OBA. In which case, skip
to Step 4 below.
Step 1 Press the S SETUP key. A menu similar to
the following appears:
Step 2 Select OCTAVE OBA from the menu by pressing the u or dkeys and then pressing
the c key. The OBA screen which was last
accessed appears. For example, this particular
OBA screen may appear.
If you have not already saved your data, you
will be prompted to save it at this step.
Step 3 The 814 is now set to the OBA mode.
3-2
System 814 User Manual
1/23/98
In this example, the Title setting is
selected and Octave Band Analyzer
is the current title. To change the
title, use the arrow keys described in
the ÒTitleÓ section (discussed later).
Step 4 To access the OBA Settings menu, press the
S key. The Edit Settings: *OCTAVE OBA is
highlighted as the Setup menu:
Step 5 Press the rkey and the Settings menu
appears:
Available Settings
Use the u and d keys to
move from one setting to the next.
Then use the r key to change the
selected setting. The l key is
used to return to previous menus.
1/23/98
The 814 offers a number of OBA settings for controlling, gathering, and logging spectral data. The following is a chart of these settings. Each setting is then
described later in greater detail.
Menu Items
Available Settings Options
Title
Title
OBA ScanMode
Manual
Auto
Timed
OBA ProÞle
Normal
Short
Long
Custom
OBA Octave Band Analyzer
3-3
OBA Bandwidth
1/1
1/3
Range
Normal
Low
High
Transducer
Condnsr
Elctret
Direct
Intv Enable
No
Yes
Intv Period
(hh:mm:ss)
Intv Time Sync
(Time Sync)
No
Yes
Intv Auto Stop
(Auto Stop)
No
Yes
AC Out Weight
Flat
Wght
Menu Items
Available Settings Options
Title
Title
OBA ScanMode
Manual
Auto
Timed
OBA ProÞle
Normal
Short
Long
Custom
Title Setting
To change the Title, use the r
and lkeys to select each character. Use the u and d keys to
replace the selected letter. Pressing
the R key clears all characters from
the cursor to the end of the Þeld.
3-4
System 814 User Manual
1/23/98
OBA Bandwidth
1/1
1/3
Range
Normal
Low
High
Transducer
Condnsr
Elctret
Direct
Intv Enable
No
Yes
Intv Period
(hh:mm:ss)
Intv Time Sync
(Time Sync)
No
Yes
Intv Auto Stop
(Auto Stop)
No
Yes
AC Out Weight
Flat
Wght
Use the Title setting to create a title or header for
printed reports. This title/header will be placed at the
top of each OBA report you print.
OBA ScanMode Setting
You can change the Þlter by using
the l and r keys.
Use the OBA ScanMode setting to set the method for
scanning the octave or third octave Þlters. This setting
provides the following three options:
Manual - By selecting ÒManual,Ó you control the timing and the order of the Þlters measured. The 814 does
not automatically change Þlters as with the other
options; instead, the 814 measures using the Þlter that
you have selected.
Auto - By selecting ÒAuto,Ó the instrument measures
each Þlter for a selected time (see OBA proÞle on page
3-6) to ensure an accurate reading and then steps to the
1/23/98
OBA Octave Band Analyzer
3-5
next Þlter automatically, repeating all Þlters continuously.
Timed - By selecting ÒTimed,Ó the instrument automatically steps from one Þlter to the next. This is similar to the ÒAutoÓ option except the measurement stops
when the elapsed run time is equal to the programmed
measurement run time.
OBA Profile Setting
Use the OBA ProÞle setting to set the length of time
that the instrument measures the output for each Þlter
before moving on to the next. The proÞle is only used
when the OBA Scan mode is set to Auto or Timed. The
total time it takes to make one complete cycle through
the Þlters is based on the selected proÞle as shown in
the table below:
Bandwidth = 1/1
Bandwidth = 1/3
ProÞle
Cycle Time
ConÞdence Limits
Cycle Time
ConÞdence Limits
Short
20 seconds
98% " 1.0 dB
2 minutes
98% +/- 1.0 dB
Normal
1 minute
98% " 0.6 dB
5 minutes
98% +/- 0.6 dB
Long
2 minutes
98% " 0.4 dB
10 minutes
98% +/- 0.4 dB
For example, if the interval period setting was 15 minutes and the scan rate for 1/3 octaves was Normal (5
minutes), then a spectrum would be stored every 15
minutes which represented three scans through the
complete range of Þlters. At the end of each 15 minute
interval period, the accumulator would be reset and
prepared to begin accumulating spectral data over the
next 15 minute period.
When you deÞne a proÞle, you can
effectively remove one or more Þlters
from the scan sequence by setting the
corresponding stabilize and dwell
times to zero seconds.
3-6
Custom - Using a personal computer, you can create
and download to the System 814 a user deÞned proÞle
of stabilization and scan times for each Þlter.
System 814 User Manual
1/23/98
Each of the three standard options, Norm, Short and
Long, have the same stabilization time proÞle. However, each option provides for a different dwell time
(i.e. the time that the Þlter is active and providing accurate data). In addition, the custom option allows you to
choose a previously deÞned user scan proÞle that you
can create and download to the System 814 with a personal computer.
OBA Bandwidth Setting
Third octave requires that OPT-31
be installed.
Use the Bandwidth setting to select either full-octave or
third-octave Þlters. This setting provides the following
two options:
¥ 1/1 - The instrument uses octave Þlters.
¥ 1/3 - The instrument uses third-octave Þlters.
Range Setting
Use the Range setting to select the desired measurement range for the instrument. This setting provides
the following three options:
Normal - The instrumentÕs available dynamic range is
positioned in the ÒnormalÓ range which is typically
20dB to 130dB when using a Larson¥Davis high-sensitivity microphone.
Low - The instrumentÕs input circuitry provides an
additional 20dB of gain which has the effect of moving
the instrumentÕs available dynamic range downward
relative to the ÒnormalÓ range (see below). The net
effect is that you can measure lower-level sounds effectively. The degree of beneÞt varies depending upon the
weighting or octave Þlter that you are using.
Not available for electret or direct
transducer types.
(see ÒTransducer SettingsÓ below).
1/23/98
High - The instrumentÕs sensitivity is reduced by 20dB
which has the effect of moving the instrumentÕs available dynamic range upward relative to the ÒnormalÓ
range (see above). The net effect is that you can mea-
OBA Octave Band Analyzer
3-7
sure higher-level sounds effectively. The beneÞt varies
depending upon the weighting or octave Þlter that you
are using.
NOTE: The Range setting is not meant to be switched dynamically
in real timeÑin part because selecting the ÒHighÓ option requires a
stabilization period. Furthermore, the System 814Õs large dynamic
range (110dB) makes dynamic range switching unnecessary. The
Range setting merely allows you to move the available dynamic
range either up or down when you need to measure extremely high
sound levels.
Transducer Setting
Use the Transducer setting to select the desired transducer. This setting provides the following three settings:
Condnsr - Indicates that the microphone being used is
an air condenser type and the System 814 will generate
the appropriate polarization voltage to make it function properly.
Elctret - Indicates that the microphone being used is an
ÒelectretÓ (pre-polarized) microphone. The instrument
will not generate any polarization voltage.
Direct - Indicates that no microphone is being used
and that electrical signals are being injected directly
into the preamp.
Intv Enable Setting
Use the Intv Enable setting to either enable or disable
the automatic storage of spectral time-history records.
The OBA instrument has the ability to store the spectral data at a user-determined interval. This setting
provides the following two options:
Yes - Time-history storage is enabled.
No - Time-history storage is disabled.
3-8
System 814 User Manual
1/23/98
Intv Period Setting
For example, if you want to set the
Intv Period to 1 hour 45 minutes
and 30 seconds, it would be
expressed as: Ò01:45:30Ó.
Use the Intv Period setting to set the time interval
between successive spectral time history storage operations. These storage operations continue either until
the instrument is stopped or it runs out of memory.
This setting can take on any time value within the following range:
(hh:mm:ss) - 00:00:01 - 99:59:59
Intv Time Sync Setting
Use the Intv Time Sync setting to either enable or disable the time-history sync feature. When enabled, this
feature causes the time history storage operations to be
synchronized with the real-time of day clock. This synchronization can occur on an hourly, 30 min., 20 min.,
15 min., 5 min., or 1 min. basis. Please note that the Intv
Period setting should also be set accordingly so that the
synchronization works properly. When you start a
measurement, the initial storage interval will last for
only a fraction of the determined synchronization until
the start of the next time segment; at which time a new,
synchronized storage interval begins.
If the Interval Period is set to the time shown in the
Þrst column then the Þrst interval after a run will end
at the time shown in the second column (the hh means
any hour and the hh:m means any hour and tens of
minutes).
1/23/98
Intv Period
Sync on
01:00
hh:00
00:30
hh:00, hh:30
00:20
hh:00, hh:20, hh:40
00:15
hh:00, hh:15, hh:30, hh:45
OBA Octave Band Analyzer
3-9
00:10
hh:m0
00:05
hh:m0, hh:m5
00:0x
hh:mm (sync to nearest minute
This setting provides the following two options:
Yes - Time sychronization is enabled.
No - Time sychronization is disabled.
Intv Auto Stop Setting
Do not use this feature with the time
sync feature or you will not get the
full time period you desire.
Use the Intv Auto Stop setting to either enable or disable the Auto Stop feature. When enabled, this feature
causes the instrument to automatically stop the measurement at the end of each history storage interval.
This allows you to precisely time a series of manual
measurements. To start a new measurement after an
automatic stop, simply press the sRUN key.
This setting provides the following two options:
Yes - Automatic stopping after the time interval is
enabled.
No - Automatic stopping after the time interval is disabled.
AC Out Weight Setting
Use the AC Out Weight setting to set the frequency
characteristics of the AC output signal. The AC output
signal is derived from the actual signal the instrument
is measuring. This signal is available for external use at
the base of the System 814.
This setting provides the following two options:
3-10
System 814 User Manual
1/23/98
Flat - The AC output signal has the ßat frequency
weighting applied to it.
Wght - The AC output signal has the same frequency
characteristics as the displayed RMS level.
Understanding OBA Displays
The System 814 has Þve displays for the OBA instrument. Understanding each of these displays allows
you to take full advantage of the instrument.
Each display contains an instrument status icon in the
upper right hand corner of the display. This icon
changes according to the current state of the instrument.
Status icon
The following list describes each icon which may
appear:
Status Icon
Description
Animated Running Figure Instrument is running and acquiring data.
Solid Box - Instrument is stopped,
data is available.
Open Box - Instrument is stopped,
and reset.
1/23/98
OBA Octave Band Analyzer
3-11
Double Bar - Instrument is
paused.
Play Symbol - Instrument is ready
to run (as soon as stabilization
completes).
Bar and Play Symbol - Current
SPL and peak levels displayed,
but no data is being acquired.
Animated Hourglass - Instrument
is stabilizing to ensure accurate
measurement.
Animated Draining Battery - Battery is low, and the instrument
will shut off soon.
O.L. - Instrument is overloaded;
measurement may not be accurate
due to an overload condition at
some time during the measurement.
Animated Clock - Indicates that
the automatic run/stop timer is
active.
In order to view the OBA displays, switch the device to
OBA mode. To do this:
If the 814 is already in OBA mode,
there will be an asterisk to the left of
OCTAVE OBA. If this so, skip to
Step 3.
3-12
Step 1 Press the S SETUP key. A menu similar to
the following appears:
System 814 User Manual
1/23/98
Step 2 Select OCTAVE OBA from the menu by pressing the uordkeys and then pressing
the c key. The OBA screen which was last
accessed appears. For example, this particular
OBA screen may appear:
If you have not already saved your data, you
will be prompted to Save it at this point.
Using the uandd arrow
keys, select the desired display then
press the c key to bring up that
display.
Step 3 Press the Vkey to access the View menu. The
following screen appears:
Available OBA Displays
Following is a list of the Þve possible displays. Each
display is then described in greater detail.
1/23/98
Menu Item
Purpose
Live
Leq of each ÞlterÕs latest sample.
Current
Leq spectrum of the Current buffer.
Overall
Leq spectrum of the OverAll buffer.
Interval History
Shows a running log of past
measurements.
OBA Octave Band Analyzer
3-13
Run Log
Logs key functions.
Live
To switch between the OBA displays
(Live, Current and Overall) use
theuand dkeys.
The Live display shows the most recently sampled levels for each Þlter. It consists of Þve major components:
¥ Display label
¥ Leq reading and Bandwidth
¥ Selected Þlter
¥ Status
¥ Spectrum
The following information explains each of these components:
Display label
Status
Leq reading and Bandwidth
Selected Þlter
Spectrum
Display label - Indicates what display is currently
being shown. The Þrst three letters (OBA) describes the
instrument being used. The second word (Live)
describes the particular display being used.
Leq reading and Bandwidth - Displays the ÒLiveÓ Leq
for the Þlter that is highlighted by the cursor or the Leq
that was accumulated when the Þlter highlighted was
last active.
3-14
System 814 User Manual
1/23/98
Use the l and r arrow keys
to move the cursor from one Þlter to
the next.
Selected Þlter - The center frequency of the highlighted Þlter. The following table shows the range of
this selection:
Filter
Frequency
OPT-30 Þlter set
1/1 Octave Þlter
31.5 Hz to 8000 Hz (9 Þlters)
OPT-31 Þlter set
1/1 Octave Þlter
1/3 Octave Þlter
31.5 Hz to 16 kHz (10 Þlters)
25 Hz to 20 kHz (30 Þlters)
Status - Represents the state of the instrument (as
described at the beginning of this section).
Use the l and r arrow keys
to move the cursor from one Þlter to
the next.
Spectrum - Shows the spectrum of live Þlter data that
are continuously updated as the instrument scans
(either manually or automatically) from one Þlter to
the next. The resulting spectral bars show the Leq for
each Þlter during the period that a particular Þlter is
active.
The far right bar is not part of the
spectrum, but instead shows the SPL
of the Þlter the instrument is currently measuring.
The bar for the Þlter that the instrument is currently
measuring shows the Leq as it is accumulated. Every
other bar holds its previous level until the corresponding Þlter again becomes the active Þlter. When a Þlter
becomes active, the instrument begins a new Leq accumulation for that Þlter.
When you move the cursor from one
Þlter to the next, you will notice a
slight pause before the data is
updated because of the need to ignore
the transient effects of switching
between Þlters. The status will show
an hour glass during this delay.
If you have selected the Manual OBA mode, the Þlter
you select with the cursor will also become the active
Þlter. The Leq for the active Þlter will continue to accumulate until you move the cursor to a new Þlter.
If you have selected Manual mode,
you will not be able to move the cursor to the far right bar.
If you have selected one of the automatic scan modes,
you can also move the cursor to the far right bar which
shows the SPL of the Þlter the instrument is currently
measuring. When you move the cursor to this bar, the
display shows the Leq and center frequency of the Þlter currently being measured. The displayed Leq and
1/23/98
OBA Octave Band Analyzer
3-15
center frequency then automatically update as the
instrument scans from one Þlter to the next.
Current
The System 814 contains two independent data buffers that can separately accumulate data. In essence,
the instrument becomes two sound
level meters in one. The data in the
primary buffer is referred to as the
ÒoverallÓ measurement, while data
in the secondary buffer is referred to
as the ÒcurrentÓ measurement.
¥ The Current display shows live data being stored in
the Current buffer. It consists of six major components:
Display label
¥ Leq reading and Bandwidth
¥ Selected Þlter
¥ Status
¥ Run time
¥ Spectrum
The following information explains each of these components:
Display label
Status
Leq reading
and Bandwidth
Selected Þlter
Spectrum
Run time
Display label - Shows the display currently being
used. The Þrst three letters (OBA) describes the instrument being used. The second word (Current) describes
the particular display being used.
3-16
System 814 User Manual
1/23/98
Leq reading and Bandwidth - Displays the Current
Leq accumulated for the Þlter that is highlighted by
the cursor since the last current reset.
Use the l and r arrow keys
to move the cursor from one Þlter to
the next.
Selected Þlter - The center frequency of the highlighted Þlter. The range of this selection is as follows:
Filter
Frequency
OPT-30 Þlter set
1/1 Octave Þlter
31.5 Hz to 8 kHz (9 Þlters)
OPT-31 Þlter set
1/1 Octave Þlter
1/3 Octave Þlter
31.5 Hz to 16 kHz (10 Þlters)
25 Hz to 20 kHz (30 Þlters)
Status - Represents the state of the instrument
(described at the beginning of this section).
Run time - The run time clock displays the time that
has elapsed since the last ÒcurrentÓ reset. The clock
updates when the OBA is running (or active).
Use the l and r arrow keys
to move the cursor from one Þlter to
the next.
Spectrum - Shows the spectrum of Leq accumulation
since the last ÒcurrentÓ reset. The accumulation continues through each period of Þlter activity as the Þlters
are scanned (either manually or automatically).
The far right bar is not part of the
spectrum, but instead shows the SPL
of the Þlter currently being measured.
When you move the cursor from one
Þlter to the next, you will notice a
slight pause before the data is
updated because of the need to ignore
the transient effects of switching
between Þlters.
If you have selected the Manual OBA mode, the Þlter
you select with the cursor will also become the active
Þlter. The Leq for the active Þlter will continue to accumulate until you move the cursor to a new Þlter.
If you have selected Manual mode,
you will not be able to move the cursor to the far right bar.
If you have selected one of the automatic scan modes,
you can also move the cursor to the far right bar which
shows the SPL of the Þlter the instrument is currently
measuring. When you move the cursor to this bar, the
display shows the Leq and center frequency of the Þl-
1/23/98
OBA Octave Band Analyzer
3-17
ter currently being measured. The displayed Leq and
center frequency then automatically update as the
instrument scans from one Þlter to the next.
OverAll
The System 814 contains two independent data buffers that can separately accumulate data. In essence,
the instrument becomes two sound
level meters in one. The data in the
primary buffer is referred to as the
ÒoverallÓ measurement, while data
in the secondary buffer is referred to
as the ÒcurrentÓ measurement.
The OverAll display shows live data being stored in the
Overall buffer. It consists of six major components:
¥ Display label
¥ Leq reading and Bandwidth
¥ Selected Þlter
¥ Elapsed time
¥ Status
¥ Spectrum
The following information explains each of these components:
Display label
Status
Leq reading
and Bandwidth
Selected Þlter
Spectrum
Elapsed time
Display label - Shows the display currently being
used. The Þrst three letters (OBA) describe the instrument being used. The second word (OverAll) describes
the particular display being used.
Leq reading and Bandwidth- Displays the ÒOverAllÓ
Leq for the Þlter that is highlighted by the cursor or the
3-18
System 814 User Manual
1/23/98
Leq that was accumulated when the highlighted Þlter
was last active.
Use the l and r arrow keys to move the cursor from
one Þlter to the next.
Selected Þlter - The center frequency of the cursor Þlter.
The range of this selection is follows:
Filter
Frequency
OPT-30 Þlter set
1/1 Octave Þlter
31.5 Hz to 8000 Hz (9 Þlters)
OPT-31 Þlter set
1/1 Octave Þlter
1/3 Octave Þlter
31.5 Hz to 16 kHz (10 Þlters)
25 Hz to 20 kHz (30 Þlters)
Elapsed time - The elapsed time clock displays the
time that has elapsed since the ÒoverallÓ reset. The
clock updates when the OBA is running (or active).
Status - Represents the state of the instrument (as
described at the beginning of this section).
Use the l and r arrow keys
to move the cursor from one Þlter to
the next.
The far right bar is not part of the
spectrum, but instead shows the SPL
of the Þlter currently being measured.
When you move the cursor from one
Þlter to the next, you will notice a
slight pause before the data is
updated because of the need to ignore
the transient effects of switching
between Þlters.
If you have selected Manual mode,
you will not be able to move the cursor to the far right bar.
1/23/98
Spectrum - Shows the spectrum of Leq accumulations
since the last ÒoverallÓ reset. The accumulation continues through each period of Þlter activity as the Þlters
are scanned (either manually or automatically).
If you have selected the Manual OBA mode, the Þlter
you select with the cursor will also become the active
Þlter. The Leq for the active Þlter will continue to accumulate until you move the cursor to a new Þlter.
If you have selected one of the automatic scan modes,
you can also move the cursor to the far right bar which
shows the SPL of the Þlter the instrument is currently
measuring. When you move the cursor to this bar, the
display shows the Leq and center frequency of the Þlter currently being measured. The displayed Leq and
center frequency then automatically update as the
instrument scans from one Þlter to the next.
OBA Octave Band Analyzer
3-19
Interval History
The interval history is a spectral time history for Þxed
periods of time. The OBA Interval History display
allows you to view a time proÞle of the sound measured by giving you access to a sequence of spectra
that have been stored at set intervals. The Interval History display consists of eight major components:
¥ Occurrence date and time
¥ Display label
¥ Record number
¥ Leq reading
¥ Selected Þlter
¥ Duration
¥ Status
¥ Spectrum
The following information explains each of these components:
Occurrence date and time
Display label
Record number
Status
Leq reading
Spectrum
Selected Þlter
Duration
Occurrence date and time - Date and time of the currently displayed history record.
3-20
System 814 User Manual
1/23/98
Display label - Shows what display is currently being
used. The Þrst three letters (OBA) describes the instrument being used.
Use uand d keys to move
from one stored record to another.
Record number - The Ò1 / 3Ó indicates the record currently being viewed and the total number of records
stored (in this example, Ò1 / 3Ó represents the Þrst
record of three total possible records).
Leq reading - Displays the Leq for the selected Þlter of
this interval record.
Selected Þlter - The center frequency of the cursor Þlter. The range of this selection is changeable. You can
choose the following:
Filter
Frequency
OPT-30 Þlter set
1/1 Octave Þlter
31.5 Hz to 8000 Hz (9 Þlters)
OPT-31 Þlter set
1/1 Octave Þlter
1/3 Octave Þlter
31.5 Hz to 16 kHz (10 Þlters)
25 Hz to 20 kHz (30 Þlters)
Duration - The duration clock displays the duration or
elapsed time for this interval history record. This time
will be the programmed interval time unless it is the
last record before a stop was performed, or the Þrst
record if ÒIntv Time SyncÓ was enabled.
Use the l and r arrow keys
to move the cursor from one Þlter to
the next.
Status - Represents the state of the instrument (as
described at the beginning of this section).
Spectrum - Shows the spectrum of Þlter data. The OBA
Interval History display allows you to view a time proÞle of the sound measured by giving you access to a
sequence of spectra that have been stored at set intervals.
The bar for the Þlter that the instrument is currently
measuring shows the Leq as it was accumulated.
1/23/98
OBA Octave Band Analyzer
3-21
Run Log
The Run log display is a log of operations that affect the
measurements taken by the OBA instrument. It consists of Þve major components:
¥ Current Display
¥ Record Number
¥ Run Log Action
¥ Status
¥ Run Log Action Time
The following information explains each of these components:
Current Display
Record Number
Status
Run Log Action
Run Log
Action Time
Current Display - Shows what display is currently
being used (in this case the Operation Log).
Pressing theu and d keys
allows you to move from one stored
log to another.
Record Number - Shows the number of the current
record being displayed, followed by the total number
of records. (In this example, the displayed screen is
record 1 of 6 possible records.)
In the screen on page 3-28, there are
two logs:
1. Run 1 Key
2. Stop 1 Key
Run Log Action - The run log action consists of three
parts: action, measurement number, and cause. The
Þrst part displays what action took place (Run, Stop,
Pause, Continue, Reset, and Mark -- M8 command, M6
command). The second part displays what measure-
3-22
System 814 User Manual
1/23/98
ment number or record was affected by the action. The
third part displays what caused the log (Key, I/O,
Timer, Battery (low), Intv (auto-stop), Logic, and Calibration).
Status - Represents the state of the instrument (as
described at the beginning of this section).
In this example, the sRUN/STOP
key was pressed at 18:11:02 and
again at 18:11:45, both on 24 Sept.
1996.
Run Log Action Time - The Run Log Action Time
shows the day, date, and time that the run log action
occurred.
Using the OBA
This section gives a step by step example of a possible
scenario using the OBA instrument. In this scenario,
you will select the Octave OBA instrument and take 3
measurements. You will then view the results of these
three measurements.
Simple OBA Scan
Step 1 Press the S SETUP key. A menu similar to
the following appears:
1/23/98
OBA Octave Band Analyzer
3-23
If the 814 is already in OBA mode,
there will be an asterisk to the left of
OCTAVE OBA. If so, skip to Step 3.
Step 2 Select OCTAVE OBA from the menu by pressing the uordkeys and then pressing
the c key. The OBA Default screen appears:
If you have not already saved your
data, you will be prompted to save
now.
Step 3 Press the V VIEW key to access the View
menu. The following screen appears:
Using the ud arrow keys,
you can select the desired display.
Then press the c key to bring up
the display.
Step 4 Using theu and d keys select Live, then
press c to select. The following screen
appears:
3-24
System 814 User Manual
1/23/98
Step 5 Press the s RUN/STOP key to begin taking
readings. A screen similar to the following
appears:
Step 6 Run the measurement for about 2 minutes.
Press the s RUN/STOP key to halt the
measurement. A solid box will appear in the
upper right hand corner:
Step 7 Repeat Steps 5 and 6 two more times to take
two more measurements. Then, press the
VVIEW key to access the View menu. The
following screen appears:
1/23/98
OBA Octave Band Analyzer
3-25
Notice that the record number
(1/3) in this example shows that the
Þrst history record of 3 possible
records is currently being displayed.
Step 8 To view the history of these runs, use theu
and d keys to select History, then press c
to select. The following screen appears:
Step 9 Use theu and d keys to move from one
history to the next.
3-26
System 814 User Manual
1/23/98
CHAPTER
4
sSLM-simple Sound Level
Meter
This chapter will help you better understand the System 814 sSLM (simple Sound Level Meter). SpeciÞcally, this chapter covers the following topics:
¥ Setting up the sSLM: overview of the settings and
conÞgurations of the System 814 in sSLM mode.
¥ Understanding sSLM Displays: overview of the displays used in sSLM mode and explanations about
how to read them.
¥ Using the sSLM: simple applications that can be
used with the System 814 in sSLM mode.
Introduction to the Simple SLM Mode
The Simple SLM Mode of the Model 814 provides the
functionality of a precision sound level meter for
Òpoint-and-shootÓ type measurements where a single
measurement is taken and the data stored manually.
For sound measurements where data are to be measured and stored automatically, such as commonly
done for environmental noise monitoring applications,
the Logging SLM Mode should be utilized.
The sound pressure level is measured using one selection of broadband frequency weighting (A,C or Flat)
and one selection of RMS detector (Fast, Slow or
Impulse). For versions of the instrument equipped
with 1/1 octave or 1/3 octave Þlters, it is also possible
2/27/98
sSLM-simple Sound Level Meter
4-1
to utilize a single bandpass Þlter instead of a broadband frequency weighing.
Peak sound levels are measured using two parallel
peak detectors; Peak 1 whose frequency weighting can
be selected to be either C or Flat and Peak 2 whose frequency weighting is the same as the frequency weighting selected for use with the RMS detector for sound
pressure level measurements (A, C, Flat or bandpass)
as mentioned above.
In addition to the measurements described above, the
following data are obtained: Leq, SEL, Lmax and
Lmin. During the measurement, a Time History
graphic based on one second Leq values is drawn
across the display. A back erase feature is available for
the removal of unwanted data segments which may
occur during the measurement period.
Selecting the permanent Simple SLM setup
Step 1 Press the Setup Key S to obtain a menu of
stored instrument setups similar to the following.
The setup listed at the top of the list, along
with the text string ÒEdit SettingsÓ, is the
setup presently active in the instrument.
Those listed below are existing setups available for selection and use. Those which have
a letter ÒpÓ to the left of the setup name are
permanent setups, whose parameters cannot
be modiÞed. Of course the user can select a
permanent setup, modify the parameters, and
4-2
System 814 User Manual
2/27/98
then store it under another name, leaving the
permanent setup unmodiÞed. Once an existing setup, permanent or not, has been made
the active setup, the symbol Ò>Ó will appear
to the left of the name instead of the letter
ÒpÓ.
Step 2 If the active setup in the instrument is not
entitled SIMPLE SSM, then search further
down the list and use the u and dkeys to
highlight the setup with that name which has
the small letter ÒpÓ to the left side of the setup
name.
If the presently active setup is entitled
SIMPLE SSM, then search further down the
list to Þnd and highlight the setup with that
name which has the Ò>Ó symbol to the left of
the name.
Step 3 Press the c which will bring to the screen the
Simple SLM display.
Utilizing the Simple SLM setup when it is the active setup
If the active setup is entitled SIMPLE SSM, this means
that the permanent Simple SLM setup was previously
selected and that some or all of the parameters may
have been changed. The user can select to use this
rather than the permanent Simple SLM setup simply
pressing l to exit to the Simple SLM display. It will
be seen later that the use of the c key when the active
setup is highlighted leads to the Standard form of editing via the Setup Menu.
2/27/98
sSLM-simple Sound Level Meter
4-3
Editing the Simple SLM setup
There are two ways to modify the Simple SLM setup.
¥ Standard Setup, via the Setup Menu, which permits
the selection and modiÞcation of all the available
parameters.
¥ Quick Keys, which permit the selection and modiÞcation of the frequency weighting, RMS detector,
peak weighting, secondary parameter to be displayed and to select the amplitude range (Low or
Normal).
Due to its simplicity, we will describe the use of the
Quick Keys in the next section, followed by a detailed
presentation of the Standard Setup procedure.
Quick Keys
The default parameters associated with the permanent
Simple SLM setup are as follows:
¥ Frequency weighting: Flat
¥ RMS detector: Slow
¥ Secondary displayed parameter: Leq
¥ Peak weighting: Flat
¥ Range: Normal
Simply pressing the s key will begin a measurement
using those parameters.
However, using the Quick Keys it is possible to edit the
parameters of the Simple SLM measurement On the Fly
from this display screen. Using the u and d keys, a
highlighting window can be moved about the screen
as shown below. For each highlighted position, the l
and r keys are used to page through a series of available parameter choices, also shown below. After select-
4-4
System 814 User Manual
2/27/98
ing a new parameter in a particular highlighted
position, the user can either move the highlighted window to another position or wait approximately four
seconds for the highlight window to close.
Weighting
(A, C, Flat or
Selected Filter)
Detector
(Fast, Slow, Impulse)
Secondary Parameter
(Leq, SEL, Lmin, Lmax, Lpk)
Peak Parameter
(Peak1; C-wgt
Peak1; Flat
Peak2)
A reset is automatically performed
when the frequency weighting, RMS
detector or Range are changed. No
reset is required when changing the
secondary displayed parameter,
LEQ, SEL, Lmin, Lmax, or Lpk
since this does not represent a
change in the measurement itself.
Selected Filter
(Center Frequency)
Range
(Low, Normal)
Note that these parameters can be edited while a measurement is in progress.
Example 1 Changing the frequency weighting from
ÒFltÓ to ÒAÓ.
Step 1 Use the u and d keys to position the highlight window over the frequency weighting
parameter as shown below.
Step 2 Use the l and r keys to bring the
desired frequency weighting choice, ÒAÓ, into
the highlighted window, as shown below,
then either move the position of the high-
2/27/98
sSLM-simple Sound Level Meter
4-5
lighted window or wait four seconds for it to
close.
Example 2 Selecting the Secondary Display Parameter
to be Peak with C-weighting.
Step 1 Use the u and d keys to position the highlight window over the Secondary Display
Parameter as shown below.
Step 2 Use the l and r keys to bring the secondary displayed parameter choice ÒPeakÓ into
the highlighted window, as shown below.
4-6
System 814 User Manual
2/27/98
Step 3 Use the u and d keys to position the highlight window over the Peak Weighting
parameter as shown below.
Use the l and r keys to bring the Peak Weighting
choice ÒCÓ into the highlighted window, as shown
below.
Editing Using the Setup Menu
SSM indicates that the ID is a simple Sound Level Meter setup.
There are four general steps to setting up the sSLM
instrument: 1) Go to the Setup menu. 2) Select the SIMPLE SSM. 3) Return to the Setup menu. 4)Then enter
the Settings menu.
This procedure is discussed in more detail below:
If the 814 is already in sSLM mode,
there will be a Ô>Õ to the left of SIMPLE SSM. In which case, skip to
Step 4 below.
2/27/98
Step 1 Press the S key. A menu similar to the following appears:
sSLM-simple Sound Level Meter
4-7
If you have not already saved your
data, you will be prompted to save it
at this step.
Step 2 Select SIMPLE SSM from the menu by using
the uordkeys and then pressing the c
key. The sSLM screen appears:
The System 814 is now set to the sSLM instrument.
Step 3 To access the Settings menu, press the S key.
The Edit Settings: *SIMPLE SSM is highlighted as the Setup menu appears:
Step 4 Press the r or c key and the Settings menu
appears:
4-8
System 814 User Manual
2/27/98
The Settings menu gives a list of sub-menus. The following is a table of the settings sub-menus:
Sub-Menu
Items
Purpose
SLM
SpeciÞc Sound Level Meter settings
Controls
System 814 Controls for the sSLM
Step 5 Use the u or d keys to select the desired
sub-menu, then press the r key to view
available settings for the sub-menu.
The following sections discuss the sSLMÕs settings submenus and their corresponding menu items in more
detail.
sSLM Settings Menu
Use the u and d keys to move
from one setting to the next. Then
use the r key to change the
selected setting. The l key is used
to return to previous menus.
2/27/98
The sSLM Settings menu has 7 items. Each setting is
later described in greater detail.
Menu Items
Available Settings Options
Detector
Slow
Fast
Impl
Weighting
A
C
FLT
OCT
1/3
Range
Normal
Low
High
Transducer
Condnsr
Elctret
Direct
sSLM-simple Sound Level Meter
4-9
Detector Setting
Pk-1 Weighting
Flat
C
Current
Exchange
3dB
4dB
5dB
6dB
Current Threshold
(0)dB - (255) dB
Use the Detector setting to set the time weighting characteristics of the instrumentÕs RMS detector. This setting provides the following three options:
Slow - The instrument uses exponential averaging
with a one second time constant.
Fast - The instrument uses exponential averaging with
a 1Ú8 second time constant which allows more variability to appear in the measurement.
Impl - The instrument uses impulse weighting which
has a fast rise time but a very slow decay time.
Weighting Setting
Use the Weighting setting to select the desired frequency weighting for the RMS and secondary peak
detectors.
This setting can be changed from the
default sSLM screen by pressing the
u or d keys to select the
desired setting and the r or l
keys to adjust.
The Weighting setting provides the following Þve
options:
A - The instrument uses an A-weight input Þlter.
C - The instrument uses an C-weight input Þlter.
FLT - The instrument uses Flat weighting (see speciÞcations for passband frequency in Appendix C).
OCT - The instrument becomes a single-octave sound
level meter (for the octave speciÞed in the Filter setting).
4-10
System 814 User Manual
2/27/98
1/3 - The instrument becomes a single third-octave
sound level meter (for the third octave speciÞed in the
Filter setting).
Use the Range setting to select the desired measurement range for the instrument. This setting provides
the following three options:
Range Setting
Normal - The instrumentÕs available dynamic range is
positioned in the ÒnormalÓ range which is typically
20dB to 130dB when using a Larson¥Davis high-sensitivity microphone.
Not available for electret or direct
transducer types (see ÒTransducer
SettingsÓ below).
Low - The instrumentÕs input circuitry provides an
additional 20dB of gain which has the effect of moving
the instrumentÕs available dynamic range downward
relative to the ÒnormalÓ range (see below). The net
effect is that you can measure lower-level sounds effectively. The degree of beneÞt varies depending upon the
weighting or octave Þlter that you are using.
High - The instrumentÕs sensitivity is reduced by 20dB
which has the effect of moving the instrumentÕs available dynamic range upward relative to the ÒnormalÓ
range (see above). The net effect is that you can measure higher-level sounds effectively. The beneÞt varies
depending upon the weighting or octave Þlter that you
are using.
NOTE: The Range setting is not meant to be switched dynamically
in real timeÑin part because selecting the ÒHighÓ option requires a
stabilization period. Furthermore, the System 814Õs large dynamic
range (110dB) makes dynamic range switching unnecessary. The
Range setting merely allows you to move the available dynamic
range either up or down when you need to measure extremely high
sound levels.
Transducer Setting
Use the Transducer setting to select the desired transducer. This setting provides the following three settings:
Condnsr - Indicates that the microphone being used is
an air condenser type and the System 814 will generate
the appropriate polarization voltage to make it function properly.
2/27/98
sSLM-simple Sound Level Meter
4-11
Elctret - Indicates that the microphone being used is an
ÒelectretÓ (pre-polarized) microphone. The instrument
will not generate any polarization voltage.
Direct - Indicates that no microphone is being used
and that electrical signals are being injected directly
into the preamp.
Pk-I Weighting Setting
Use the Peak-I Weighting setting to apply either Flat or
C weighting to the primary peak detector.
The primary peak detector (i.e.
Pk-I) measures the greatest instantaneous (i.e. non-time-averaged as in
RMS) level (Lpk) that has occurred
since the last current or overall reset.
As stated above, this primary peak
detector is weighted according to the
state of the Peak-I Weighting setting.
In contrast, the secondary peak
detector is a separate peak detector
which is weighted the same as the
RMS detector according to the state
of the Weighting setting.
This setting provides the following two options:
Flat - The primary peak detector uses no weighting
and the signal passes through the input circuitry
unmodiÞed.
C - The primary peak detector uses a C-weight input
Þlter that meets Type 1 sound level meter speciÞcations.
This setting gives you the ßexibility of having various
conÞgurations of peak-detector weightings using both
the Pk-I and the Pk-II detectors. For example, you
could have two simultaneous but independent peak
detectorsÑone with A weighting and the other with C
weighting.
Current Exchange Setting
This setting effects the System 814
current buffer.
Use the Current Exchange rate setting to set the
exchange rate (sometimes called the Òdoubling rateÓ)
that is used to calculate the TWA (Time Weighted
Average). The exchange rate reßects the relationship
between the permitted exposure levels and the exposure duration. Selecting an exchange rate of 5dB, for
example, means that 5dB may be added to the permissible exposure level every time the exposure duration
is cut in half. This setting provides the following four
options:
3dB - The default 3dB option is the most commonly
used and results in the Leq time weighted average
which is used worldwide and for measurements that
4-12
System 814 User Manual
2/27/98
comply with U.S. Environmental Protection Agency
(EPA) regulations.
4dB - The 4dB option results in the LDOD time weighted
average which is used for measurements that comply
with U.S. Department of Defense (DOD) regulations.
5dB - The 5dB option results in the LOSHA time
weighted average which is used for measurements
that comply with U.S. Occupational Safety and Health
Administration (OSHA) regulations.
6dB - The 6dB option results in the LAvg time weighted
average which is merely a convenient representation of
the long-term average noise level as opposed to the
RMS noise level.
The formulas for calculating TWA are found in Appendix B.
Current Threshold Setting
This setting effects the System 814
current buffer.
Use the Threshold setting to set the threshold for computing the current time weighted average (TWA).
As per the requirements of various regulatory agencies, only those sound levels which are above a certain
threshold level are used when computing the TWA.
Accordingly, this setting can take on any integral value
within the following range:
(0)dB - (255)dB
For hearing conservation purposes, set the threshold to
80dB. For most community noise purposes, set the
threshold to 0dB.
2/27/98
sSLM-simple Sound Level Meter
4-13
Controls Settings Menu
Use the u and d keys to move
from one setting to the next. Then
use the r key to change the
selected setting. The l key is used
to return to previous menus.
Menu Items
Available Settings Options
AC Out Filter
Flat
Wght
Logic-In Mode
None
Pause
Toggle
Level
Alarm
Output 1 Logic
Off
RMS
Peak
R+P
Intv
R+I
P+I
R+P+I
A:D
R+A
P+A
R+P+A
I+A
R+I+A
P+I+A
R+P+I+A
R/S
Excd
Output 1 Timer
0 ~ 255 sec
The Control Settings menu has 4 items. Each setting is
later described in greater detail.
AC Out Filter Setting
4-14
Use the AC Out Filter setting to select the frequency
characteristics of the AC output signal. The AC output
signal is derived from the actual signal the instrument
is measuring. This signal is available for external use
via a connector at the base of the System 814.
System 814 User Manual
2/27/98
This setting provides the following two options:
Flat - The AC output signal has the ßat frequency
weighting applied to it.
Wght - The AC output signal has the same frequency
characteristics as the displayed SPL level: A, C or Flat.
Logic Input Setting
Use the Logic Input setting to select the functionality of
the logic input pin on the control connector (pin 3).
This logic input pin is intended to be connected to an
external switching deviceÑpossibly a push-button
switch. The external switching device will either connect the pin to +5V (which is also available on the control connector on pin 6) or leave the pin unconnected.
This signal may also be supplied from another device
that can supply a 0 to +5 volt logic signal (input loading is 100K ohms). The resulting logical state (either on
or off) will determine what occurs inside the instrument as a function of this Logic Input setting. Accordingly, the setting provides the following Þve options:
None - The state of the logic input pin has no effect.
Pause - Whenever the logic input is connected to +5V
(e.g. when a push-button switch is pressed), the instrument pauses if it is in the run mode.
Toggle - Each time the logic input is connected to +5V
(e.g. when a push-button switch is pressed), the instrument runs or stops. The effect is the same as pressing
the s key.
Level - When the logic input is connected to +5V (e.g.
when a push-button switch is pressed), the instrument
runs. When the logic input is disconnected from +5V
(e.g. when a push-button switch is released), the
instrument stops.
Caution: This function will override the s key and I/
O RUN/STOP commands.
Alarm - When the logic input is connected to +5V (e.g.
when a push-button switch is pressed), the instrument
initiates a dial-out sequence. This option is intended
2/27/98
sSLM-simple Sound Level Meter
4-15
for use only with advanced remote monitoring applications where the instrument is paired with a modem.
Output 1 Logic Setting
Use the Logic Output setting to select the functionality
of the logic output pin on the control connector (pin 2
referenced to ground on pin 1). You can use this Logic
Output to actuate external devices as a function of certain events or combinations of events that occur in the
instrument. The option you select will determine
which event or combination of events will turn on the
logic output line.
Once the Logic Output turns on, it will stay on for the
length of time set by the Logic Output Time setting.
NOTE: In many of the options below, notice the use of a shorthand
identiÞer which includes the Þrst letters of the various events along
with the plus + symbol. The plus symbol indicates a logical ÒORÓ
function between events. In other words, if for a given option, any
one of the listed events occurs alone or in combination with another
event, the logic output will turn on.
The Logic Output setting provides the following 17
options (many of which will be functional in the near
future):
Off - The Logic Output is always off (i.e. it is disabled).
RMS - The Logic Output turns on when an RMS
exceedance event occurs. An RMS exceedance event
occurs when the RMS sound pressure level (SPL)
exceeds either of the thresholds set by the SPL TriggerLevel settings.
Peak - The Logic Output turns on when a Pk-II exceedance event occurs. A Pk-II exceedance event occurs
when the Pk-II level exceeds the threshold set by the
Pk-II Trigger Level setting.
R+P - The Logic Output turns on when either an RMS
or Pk-II exceedance event occurs.
Intv - The Logic Output turns on when an interval
begins.
4-16
System 814 User Manual
2/27/98
R+I - The Logic Output turns on when an RMS exceedance event occurs or when an interval begins.
P+I - The Logic Output turns on when any peak exceedance event occurs or when an interval begins.
R+P+I - The Logic Output turns on when either an RMS
or peak exceedance event occurs or when each interval
begins.
Currently NOT available on the
System 814.
A:D - The Logic Output turns on when an event on one
of the A:D channels occurs. These A:D channels are
typically used for wind monitoring.
Currently NOT available on the
System 814.
R+A - The Logic Output turns on when an RMS exceedance event occurs or when an event occurs on one of
the A:D channels.
Currently NOT available on the
System 814.
P+A - The Logic Output turns on when a Pk-II exceedance event occurs or when an event occurs on one of
the A:D channels.
Currently NOT available on the
System 814.
R+P+A - The Logic Output turns on when either an
RMS or Pk-II exceedance event occurs or when an
event occurs on one of the A:D channels.
Currently NOT available on the
System 814.
I+A - The Logic Output turns on when each interval
begins or when an event occurs on one of the A:D
channels.
Currently NOT available on the
System 814.
R+I+A - The Logic Output turns on when an RMS
exceedance event occurs, when each interval begins, or
when an event occurs on one of the A:D channels.
Currently NOT available on the
System 814.
P+I+A - The Logic Output turns on when a Pk-II
exceedance event occurs, when each interval begins, or
when an event occurs on one of the A:D channels.
Currently NOT available on the
System 814.
R+P+I+A - The Logic Output turns on when either an
RMS or Pk-II exceedance event occurs, when each
interval begins, or when an event occurs on one of the
A:D channels.
2/27/98
sSLM-simple Sound Level Meter
4-17
Note that the output hold time
does not apply when you select
this particular option (see ÒOutput Hold Time SettingÓ later in this
chapter).
R/S - The Logic Output turns on when the instrument is
in run mode and turns off when the instrument is in
stop mode.
Output 1 Timer Setting
Use the Logic Output Time setting to set the number of
seconds that the logic output will remain turned on or
remain asserted following a triggering event. Accordingly, this setting can take on any integral value within
the following range:
Excd - The Logic Output turns on when a valid exceedance is detected and after itÕs minimum duration has
been met.
(0)sec to (255)sec
NOTE: If set below 5 seconds, the output will remain on as long as
the conditions are true, and turn off x seconds (0 to 5) after the condition. If set to 6 seconds or greater, the line will stay on for at least
5 seconds but will turn off as soon as the condition becomes false or
the condition has lasted the number of set seconds (i.e. 0-5 minimum time, 6-255 maximum time).
Check Menu
In addition to the on-screen controls, a menu of associated settings is available as a Check menu by pressing
the c key. This menu allows you to change the Detector setting and the Weighting setting from the sSLM display. To change the display settings, do the following:
Step 1 From the sSLM display, press the c key to
access the Check menu. The following
appears:
4-18
System 814 User Manual
2/27/98
Following is a chart of the SLM settings. Each setting is
then described in greater detail.
Menu Items
Purpose
Graph
Change the scaling of the sSLM
SPL history graph
Settings
SpeciÞc Sound Level Meter settings
Controls
System 814 Controls for the sSLM
There are two sSLM Graph settings:
Graph Menu
.
Use the u and d keys to move
from one setting to the next. Then
use the r key to change the
selected setting. The l key is used
to return to previous menus
Graph Level may also be changed
interactively with the Adjust Graph
display (below).
Graph Level may also be changed
interactively with the Adjust Graph
display (described next).
Menu Items
Available Settings Options
Graph Level
(0) to (799)
Graph Scale
2, 1, 1/2, 1/4, 1/8
The Graph Level setting allow you to change the base
level of the SPL history graph. The following is the
possible setting range:
0 - 255
The Graph Scale setting allows you to change the vertical range of the SPL history graph, using the following
possible settings:
2, 1, 1/2, 1/4, 1/8 dB per dot (pixel)
2/27/98
sSLM-simple Sound Level Meter
4-19
Pressing the c key on Graph menu item (from the
SLM Check menu) allows you to graphically and interactively adjust the sSLM Graph settings. The following
screen appears:
Theu or d key allows you to adjust the Graph
Level. The l or r key allows you to adjust the
Graph Scale. When you are Þnished customizing the
settings of the graph, press the c key to Þnish.
Settings
Refer to ÒsSLM SettingÓ (described at the beginning of
this chapter) for details on this menu.
Controls
Refer to ÒControls Setting MenuÓ (described at the
beginning of this chapter) for details on this menu.
Understanding sSLM Displays
The System 814 has two displays for the sSLM instrument. Understanding these displays allows you to take
full advantage of the instrument.
Each display contains an instrument status icon in the
upper right hand corner of the display. This icon
changes according to the current state of the instrument.
4-20
System 814 User Manual
2/27/98
Status icon
The following is list and description of icons which
may appear:
Status Icon
Description
Animated Running Figure - The
instrument is running and acquiring
data.
Solid Box - The instrument is
stopped, data available.
Open Box - The instrument is
stopped, and reset.
Double Bar - The instrument is
paused.
Play Symbol - The instrument is
ready to run (as soon as stabilization
completes).
Bar and Play Symbol - The instrument is in preview. Current SPL and
peak levels are displayed, but no data
is being acquired.
Animated Hourglass - The instrument is stabilizing to ensure accurate
measurement.
Animated Draining Battery - The battery is low, and the instrument will
shut off soon.
2/27/98
sSLM-simple Sound Level Meter
4-21
O.L. - The instrument is overloaded;
measurement may not be accurate
due to an overload condition having
occurred some time during the measurement.
Animated Clock - Indicates that the
automatic run/stop timer is active.
If the 814 is already in sSLM mode,
there will be a Ô>Õ to the left of SIMPLE SSM.
In order to view the displays on the System 814 in
sSLM mode, switch the device to sSLM mode. To do
this:
If you have not already saved your
data, you will be prompted to Save it
here.
Step 1 Press the S key. A menu similar to the following appears:
Using the uandd arrow keys,
select the desired display and then
press the c key to bring up that display.
Step 2 Select SIMPLE SSM from the menu by pressing the uordkeys and then pressing the
c key. The sSLM Default screen appears:
4-22
System 814 User Manual
2/27/98
Step 3 Press the V key to access the View menu. The
following screen appears:
Available sSLM Displays
There are two sSLM displays. Each display is later
described in greater detail.
Menu
Items
Purpose
SLM
Main simple Sound Level Meter display.
SnapShots
A SnapShot of all simple SLM measurements stored at a speciÞc time.
SLM
The SLM View sub-menu consists of eight major components:
¥ Display label
¥ Selected detector
¥ Current SPL reading
¥ Selectable Leq reading
¥ Weighting
¥ Elapsed time
2/27/98
sSLM-simple Sound Level Meter
4-23
¥ Status
¥ SPL history graph
The following information explains each of these components.
Display label
Selected detector
Current SPL reading
Status
Weighting
SPL history graph
Selectable reading
Elapsed time
Display label - Shows the display currently being
used. In this display, Simple SLM states that you are
using the simple sound level meter.
Selected detector - The selected detector determines
the speed at which the SPL history graph scrolls from
right to left.
Option: Takt3 and Takt5 are also
available if ÒGermanÓ functionality
has been enabled (factory setting).
Current reading - Displays the current SPL reading
(also the level of the moving bar on the far right of the
SPL history graph). The frequency weighting for SPL
can be changed to: A, C, FLT, OCT, or 1/3.
Selectable reading - The selectable reading allows you
to view a second level which can be Leq, SEL, Lmin,
Lmax, or Lpeak.
Weighting - When the selectable reading is showing
Lpeak, the weighting for the Lpeak can be set to: A, C
or Flat (depending on the current SPL frequency
weighting).
When weighting is set to 1/1 or 1/3 octave, then the Þlter frequency is displayed:
4-24
System 814 User Manual
2/27/98
Frequency
Elapsed time - Displays the length of time current
readings have been running. It will reset to zero when
the R RESET key is pressed. It will also pause when
the p PAUSE key is pressed and then continue when
it is pressed again. The timer is displayed as mm:ss.ss,
hh:mm:ss or hhhhh:mm.
Status - Represents the state of the instrument (as
described at the beginning of this section).
SPL history graph - Shows history of SPL readings.
The far right bar moves and displays the current one
second Leq reading. As readings are taken, they are
placed onto the scrolling graph from right to left every
second. The time axis, in the SPL history graph, shows
time increasing from left to right.
SnapShot
SnapShots can be captured by pressing the
D key, then selecting
Store SnapShot and pressing the c
key (see Chapter 2).
2/27/98
The SnapShot View sub-menu displays SnapShots of
sSLM readings. The SnapShot view consists of Þve
screens. Each of the Þve screens are similar to the following:
sSLM-simple Sound Level Meter
4-25
Display label
Selected SnapShot with
Date and Time
SPL
Range
Elapsed Time
Each screen displays the date and time of the SnapShot,
the duration and the current SnapShot record being displayed, and the current record number over total number of SnapShot record stored (shown above is record 1
of 2). The following table describes each of the Þve
SnapShot screens:
Use the l or r arrow keys to
move between SnapShots a, b, c, d,
and e and the u and d arrow
keys to move between different SnapShot record numbers.
Screen
Displays
SnapShot -a
SPL and range
SnapShot -b
TWA exchange rate
SEL
SnapShot -c
Lmax
Lmin
SnapShot -d
Lpeak - I
Lpeak - II
SnapShot -e
Number of times overloaded
Using the sSLM
This section gives a step by step example of a possible
scenario using the sSLM instrument. In this scenario,
you will select the Simple SLM instrument and take 3
4-26
System 814 User Manual
2/27/98
measurements (or ÒSnapShotsÓ of measurements). You
will then view the results of these three measurements.
Simple sSLM Scan
If the 814 is already in sSLM mode,
there will be a Ô>Õ to the left of Simple
SSM. If so, skip to Step 4.
Step 1 Press the S key. A menu similar to the following appears:
If you have not already saved your
data, you will be prompted to save it
here.
Step 2 Select SIMPLE SLM from the menu by pressing the uordkeys and then pressing the
c key. The Simple SLM screen appears:
Step 3 Select SIMPLE SLM from the menu by pressing the uordkeys and then pressing the
c key. The Simple SLM screen appears:
2/27/98
sSLM-simple Sound Level Meter
4-27
Press the s key to begin taking readings.
Run for about 3 minutes. A screen similar to
the following appears:
Step 4 After 1 minute press the D key. Select StoreSnapShot and press the c key. This will store
a snap shot. Repeat every minute (for a total
of l3 SnapShots in this one measurement).
Step 5 Press the s key to halt the readings. A solid
box will appear in the upper right hand corner:
4-28
System 814 User Manual
2/27/98
Step 6 To view the SnapShots of these runs, press the
V key. The following screen appears:
Step 7 Use theu and d keys to select SnapShots,
then press c to select. A screen similar to
the following appears:
Step 8 Using theu or d keys, you can move
from one SnapShot to the next (i.e. view all 3
SnapShots).Use the l or r arrow keys to
view additional SnapShot data.
2/27/98
sSLM-simple Sound Level Meter
4-29
4-30
System 814 User Manual
2/27/98
CHAPTER
5
∫SLM-Logging Sound Level
Meter
This chapter will help you better understand the System 814 ∫SLM (Logging Sound Level Meter). SpeciÞcally this chapter covers the following topics:
¥ Setting up the ∫SLM: overview of the settings and
conÞgurations of the System 814 in ∫SLM mode.
¥ Understanding ∫SLM Displays: overview of the displays used in ∫SLM mode and simple explanations
of how to read the displays.
¥ Using the ∫SLM: simple applications that can be
used with the System 814 in ∫SLM mode.
1/23/98
∫SLM-Logging Sound Level Meter
5-1
Setting up the ∫SLM
There are four general steps to setting up the System
814 in ∫SLM mode: 1) Go to the Setup menu. 2) Select
the NORMAL SLM. 3) Return to the Setup menu.
4)Then enter the Settings menu.
This procedure is discussed in more detail below:
If the 814 is already in ∫SLM mode,
there will be a Ô>Õ to the left of NORMAL SLM. In which case, skip to
Step 3 below.
Step 1 Press the S key. A menu similar to the following appears:
If you have not already saved your
data, you will be prompted to save it
at this step.
Step 2 Select NORMAL SLM from the menu by
pressing the u or dkeys and then
pressing the c key. The ∫SLM Default screen
appears:
The 814 is now set to the ∫SLM instrument.
5-2
System 814 User Manual
1/23/98
Step 3 To access the Settings menu, press the S key.
The Edit Settings: NORMAL SLM is highlighted as the Setup menu appears.
Step 4 Press the r key and the Settings menu
appears:
Step 5 Use the uor dkeys to select the desired
sub-menu, then press ther key view available settings of the sub-menu.
The Settings menu gives a list of sub-menus. The following is a table of the Settings sub-menus:
1/23/98
Sub-Menu Items
Purpose
Title
Title of ID settings
SLM
SpeciÞc Sound Level Meter settings
TWA
Time Weighted Average settings
Ln
Percentile Level settings
Triggering
Set Peak and SPL triggers
Time History
Time History settings
∫SLM-Logging Sound Level Meter
5-3
Intervals
Statistical History settings
DeÞne Report
Report settings
Controls
Controls for the ∫SLM
The following sections discuss the ∫SLMÕs Settings submenus and their corresponding menu items in more
detail.
Title Setting
To change the Title, use the r
and lkeys to select each character. Use the u and d keys to
replace the selected character. Pressing the R key clears all characters
from the cursor to the end of the Þeld
The Title setting allows you to change the title of this
∫SLM Instrument Definition (ID) which describes the
measurement on printed reports. You may use a title
that is 30 alpha/numeric characters.
SLM Settings Menu
Use the u and d keys to
move from one setting to the next.
Then use the r key to change the
selected setting. The l key is
used to return to previous menus.
5-4
The SLM settings menu has 5 items. Each setting is
later described in greater detail.
Menu Items
Available Settings Options
Detector
Slow
Fast
Impl
Weighting
A
C
FLT
OCT
1/3
Range
Normal
Low
High
System 814 User Manual
1/23/98
Transducer
Condnsr
Elctret
Direct
Pk-1 Weighting
Flat
C
OBA Filter
30
Use the Detector setting to set the characteristics of the
instrumentÕs RMS detector. This setting provides the
following three options:
Detector Setting
Slow - The instrument uses exponential averaging
with a one second time constant.
Fast - The instrument uses a shorter 1Ú8 second time
constant which allows more variability to appear in the
measurement.
Impl - The instrument uses impulse weighting which
has a fast rise time but a very slow decay time.
The Slow option is normally used for OSHA measurements. Either the Slow option or the Fast option can be
used for environmental measurements.
Weighting Setting
This setting can be changed from the
default sSLM screen by pressing the
uordkeys to select the desired
setting and the r or l keys
to adjust.
Use the Weighting setting to select the desired frequency response for the RMS detector and secondary
peak detector.
The Weighting setting provides the following Þve
options:
A - The instrument uses an A-weight input Þlter that
meets Type 1 sound level meter speciÞcations.
C - The instrument uses a C-weight input Þlter that
meets Type 1 sound level meter speciÞcations.
FLT - The instrument uses FLAT weighting (see speciÞcations for passband frequency in Appendix C).
1/23/98
∫SLM-Logging Sound Level Meter
5-5
OCT - The instrument becomes a single-octave sound
level meter (for the octave speciÞed in the Filter setting).
1/3 - The instrument becomes a third-octave sound
level meter (for the third octave speciÞed in the Filter
setting).
Range Setting
Use the Range setting to select the desired measurement range for the instrument. This setting provides
the following three options:
Normal - The instrumentÕs available dynamic range is
positioned in the ÒnormalÓ range which is typically
20dB to 130dB when using a Larson¥Davis high-sensitivity microphone.
Low - The instrumentÕs input circuitry provides an
additional 20dB of gain which has the effect of moving
the instrumentÕs available dynamic range downward
relative to the ÒnormalÓ range (see below). The net
effect is that you can measure lower-level sounds effectively. The degree of beneÞt varies depending upon the
weighting or octave Þlter that you are using.
Not available for electret or direct
transducer types (see ÒTransducer
SettingÓ below).
High - The instrumentÕs sensitivity is reduced by 20dB
which has the effect of moving the instrumentÕs available dynamic range upward relative to the ÒnormalÓ
range (see above). The net effect is that you can measure higher-level sounds effectively. The beneÞt varies
depending upon the weighting or octave Þler that you
are using.
NOTE: The Range setting is not meant to be switched dynamically
in real timeÑin part because selecting the ÒHighÓ option requires a
stabilization period. Furthermore, the System 814Õs large dynamic
range (110dB) makes dynamic range switching unnecessary. The
Range setting merely allows you to move the available dynamic
range either up or down when you need to measure extremely high
sound levels.
Transducer Setting
5-6
Use the Transducer setting to select the desired transducer. This setting provides the following three settings:
System 814 User Manual
1/23/98
Condnsr - Indicates that the microphone being used is
an air condenser type and the System 814 will generate
the appropriate polarization voltage to make it function properly
Elctret - Indicates that the microphone being used is an
ÒelectretÓ (pre-polarized) microphone. The instrument
will not generate any polarization voltage.
Direct - Indicates that no microphone is being used
and that electrical signals are being injected directly
into the preamp.
Pk-I Weighting Setting
The primary peak detector (i.e. Pk-I)
measures the greatest instantaneous
averaged as in level (Lpk) that has
occurred since the last current or
overall reset. As stated earlier, this
primary peak detector is weighted
according to the state of the Peak-I
Weighting setting. In contrast, the
secondary peak detector is a separate peak detector which is weighted
according to the state of the Weighting setting.
Use the Peak-I Weighting setting to apply either Flat or
C weighting to the primary peak detector.
This setting provides the following two options:
Flat - The primary peak detector uses no weighting
and the signal passes through the input circuitry
unmodiÞed.
C - The primary peak detector uses a C-weight input
Þlter that meets Type 1 sound level meter speciÞcations.
This setting gives you the ßexibility of having various
conÞgurations of peak-detector weighting using both
the Pk-I and the Pk-II detectors. For example, you
could have two simultaneous but independent peak
detectorsÑone with A weighting and the other with C
weighting.
OBA Filter
1/23/98
This setting works in conjunction with the weighting
menu when 1 octave or 1/3 octave is selected. Enter Þlter # 1 through 30 to select the bandpass Þlter for the
RMS detector and the secondary peak detector.
∫SLM-Logging Sound Level Meter
5-7
TWA Menu
Use the u and d keys to
move from one setting to the next.
Then use the r key to change the
selected setting. The l key is
used to return to previous menus.
The following is a chart of the TWA settings. Each setting is then described in greater detail.
Menu Items
Available Settings Options
Ovll Exchange
3dB
4dB
5dB
6dB
Ovll Threshold
0 to 255 dB
Ovll Criterion
0 to 255 dB
Criterion Time
0 to 99 hours
Crnt Exchange
3dB
4dB
5dB
6dB
Crnt Threshold
0 to 255 dB
Crnt Criterion
0 to 255 dB
Overall Exchange Setting
This setting affects the System 814Õs
primary or overall buffer.
Use the Overall Exchange rate setting to set the
exchange rate (sometimes called the Òdoubling rateÓ)
that is used to calculate the overall TWA. The exchange
rate reßects the relationship between the permitted
exposure levels and the exposure duration. Selecting
an exchange rate of 5dB, for example, means that 5dB
may be added to the permissible exposure level every
time the exposure duration is cut in half. This setting
provides the following four options:
3dB - The default 3dB option is the most commonly
used and results in the Leq time weighted average
which is used in Europe and for measurements that
comply with U.S. Environmental Protection Agency
(EPA) regulations.
5-8
System 814 User Manual
1/23/98
4dB - The 4dB option results in the LDOD time weighted
average which is used for measurements that comply
with U.S. Department of Defense (DOD) regulations.
5dB - The 5dB option results in the LOSHA time
weighted average which is used for measurements
that comply with U.S. Occupational Safety and Health
Administration (OSHA) regulations.
6dB - The 6dB option results in the LAvg time weighted
average which is merely a convenient representation of
the long-term average noise level as opposed to the
RMS noise level.
Overall Threshold Setting
This setting affects the System 814Õs
primary or overall buffer.
Use the Threshold setting to set the threshold for computing the overall time weighted average (TWA).
As per the requirements of various regulatory agencies, only those sound levels which are above a certain
threshold level are used when computing the TWA.
Accordingly, this setting can take on any integer value
within the following range:
(0)dB - (255)dB
For hearing conservation measurements, set the
threshold to 80dB. For most community noise measurements, set the threshold to 0dB.
Overall Criterion Level Setting
Use the Overall Criterion Level setting to set the TWA
level which constitutes 100% dose for the overall measurement. The 100% dose occurs if a person is exposed
to that level for the criterion time. Accordingly, this setting can take on any integer value within the following
range:
(0)dB to (255)dB
Exposures at higher levels than the overall criterion
level will result in a 100% dose in less time; or, if exposure continues, the overall dose will exceed 100%.
1/23/98
∫SLM-Logging Sound Level Meter
5-9
Current Exchange Setting
This setting affects the System 814Õs
secondary or current buffer.
Use the Current Exchange rate setting to set the
exchange rate (sometimes called the Òdoubling rateÓ)
that is used to calculate the current TWA. The
exchange rate reßects the relationship between the permitted exposure levels and the exposure duration.
Selecting an exchange rate of 5dB, for example, means
that 5dB may be added to the permissible exposure
level every time the exposure duration is cut in half.
This setting provides the following four options:
3dB - The default 3dB option is the most commonly
used and results in the Leq time weighted average
which is used in Europe and for measurements that
comply with U.S. Environmental Protection Agency
(EPA) regulations.
4dB - The 4dB option results in the LDOD time weighted
average which is used for measurements that comply
with U.S. Department of Defense (DOD) regulations.
5dB - The 5dB option results in the LOSHA time
weighted average which is used for measurements
that comply with U.S. Occupational Safety and Health
Administration (OSHA) regulations.
6dB - The 6dB option results in the LAvg time weighted
average which is merely a convenient representation of
the long-term average noise level as opposed to the
RMS noise level.
The calculation formulas for TWA are provided in
Appendix B of this manual.
Current Threshold Setting
This setting affects the System 814Õs
secondary or current buffer.
Use the Threshold setting to set the threshold for computing the current time weighted average (TWA).
As per the requirements of various regulatory agencies, only those sound levels which are above a certain
threshold level are used when computing the TWA.
Accordingly, this setting can take on any integer value
within the following range:
5-10
System 814 User Manual
1/23/98
(0)dB - (255)dB
For hearing conservation measurements, set the
threshold to 80dB. For most community noise measurements, set the threshold to 0dB or slightly above
the noise ßoor.
Current Criterion Level Setting
Use the Current Criterion Level setting to set the TWA
level which constitutes 100% dose for the current measurement. The 100% dose occurs if a person is exposed
to that level for the criterion time or full dose hours.
Accordingly, this setting can take on any integer value
within the following range:
(0)dB to (255)dB
Exposures at higher levels than the overall criterion
level will result in a 100% dose in less time; or, if exposure continues, the overall dose will exceed 100%.
LN Menu
Use the u and d keys to
move from one setting to the next.
Then use the r key to change the
selected setting. The l key is
used to return to previous menus.
The following is a table of the LN settings. The settings
are then described in greater detail.
Menu Items
Available Settings Options
Lnn 1 Percent
.01 to 99.99%
Lnn 2 Percent
.01 to 99.99%
Lnn 3 Percent
.01 to 99.99%
Lnn 4 Percent
.01 to 99.99%
Lnn 5 Percent
.01 to 99.99%
Lnn 6 Percent
.01 to 99.99%
Use the six LN percentile settings to select the six percentile values to be measured, logged (if selected) and
shown in the Ò∫SLM LN-aÓ display. Using these six settings, you can select any six percentile values to be utilized at a time. For example, if you set one of these
1/23/98
∫SLM-Logging Sound Level Meter
5-11
settings to 10.5, then L10.5 would be one of the six percentiles that is measured. The value of L10.5 is the level
that has been exceeded 10.5% of the time during the
time of overall measurement. As shown above, these
settings can each take on any value within the following range:
(.01) to (99.99)
NOTE: Whenever you change any percent value, the instrument
sorts and reorders the LN levels and the associated percent values
into ascending order as demonstrated in the following example.
Example: Suppose you change Lnn 3 from 30.0 to 5.0.
The original setting values will then be automatically
sorted into ascending order and reassigned as shown
in the table below:
Original Setting
After Change and Sort
Lnn 1 Percentile = 10.0
*Lnn 1 Percentile = 5.0
Lnn 2 Percentile = 20.0
Lnn 2 Percentile = 10.0
*Lnn 3 Percentile = 30.0
Lnn 3 Percentile = 20.0
Lnn 4 Percentile = 40.0
Lnn 4 Percentile = 40.0
Lnn 5 Percentile = 50.0
Lnn 5 Percentile = 50.0
Lnn 6 Percentile = 60.0
Lnn 6 Percentile = 60.0
Triggering Menu
Trigger levels can be set as follows: two for the SPL
(RMS value) and one each for Peak I and Peak II. These
levels are used for counting the number of exceedances
during the measurement period, which are displayed
in the Stats-a and b displays, and are also for the initiation of noise event measurements when using the Logging SLM Mode.
5-12
System 814 User Manual
1/23/98
Use the u and d keys to
move from one setting to the next.
Then use the r key to change the
selected setting. The l key is
used to return to previous menus.
SPL Trigger Level 1 Setting
The following is a chart of the Triggering Menu settings.
Each setting is then described in greater detail.
Menu Items
Available Settings Options
SPL Excd Lvl 1
0.0 to 255.99 dB
SPL Excd Lvl 2
0.0 to 255 dB
Pk-1 Excd Lvl
0.0 to 255 dB
Pk-2 Excd Lvl
0.0 to 255 dB
Hysteresis
0 to 9 dB
Use the SPL Exceedance Level 1 setting to set the lowest
SPL trigger level. You can view this count on the Statsa display. This count is associated with the overall
measurement data and is reset when the overall measurement is reset.
This setting can take on any value within the following
range:
(0.0)dB to (255.9)dB
This setting, unlike the other trigger level settings, has
an additional decimal place of accuracy.
SPL Trigger Level 2 Setting
Use the SPL Exceedance Level 2 setting to set the higher
trigger level. When the SPL exceeds the level set by
this setting, the corresponding count is incremented
once. You can view this count on the Stats-a display.
This count is associated with the overall measurement
data and is reset when the overall measurement is
reset.
This setting can take on any integer value within the
following range:
(0)dB to (255)dB
1/23/98
∫SLM-Logging Sound Level Meter
5-13
Peak I Trigger Level Setting
Use the Peak I Exceedance Level setting to set the trigger
level for the primary peak detector (i.e. Pk-I). When the
primary peak detector level exceeds the threshold set
by this setting, the corresponding Pk-I exceedance
count is incremented once. You can view this count on
the Stats-b display. This count is associated with the
overall measurement data and is reset when the overall measurement is reset.
This setting can take on any integer value within the
following range:
(0)dB to (255)dB
Peak II Trigger Level Setting
Use the Peak II Exceedance Level setting to set the trigger
level for the secondary peak detector (i.e. Pk-II). When
the secondary peak detector level exceeds the threshold set by this setting, the corresponding Pk-II exceedance count is incremented once. You can view this
count on the Stats-b display. This count is associated
with the overall measurement data and is reset when
the overall measurement is reset.
This setting can take on any integer value within the
following range:
(0)dB to (255)dB
Hysteresis Setting
To prevent multiple triggering/counting of the same
event, a hysteresis value may be entered. The event is
triggered when a level goes over a corresponding trigger level; but does not become re-armed until the level
drops below the value of the trigger level minus the
hysteresis value.
dB
Begin
Trigger
Hysteresis
End
Time
5-14
System 814 User Manual
1/23/98
This setting can take on an integer value within the following range:
(0)dB to (9)dB
Time History Menu
Time history recording is used to store only the value
of the SPL and, if selected, one additional user-selected
parameter such as Lpk or Lmax. Levels can be stored
rapidly, up to 32 samples per second. Since this function continues storing data as long as the measurement
is in progress, the combination of a fast storage rate
and a long measurement time can utilize a large
amount of data memory.
Use the u and d keys to
move from one setting to the next.
Then use the r key to change the
selected setting. The l key is
used to return to previous menus.
History Enable Setting
1/23/98
The following is a chart of the Time History settings.
Each setting is then described in greater detail.
Menu Items
Available Settings Options
Hist Enable
No
Yes
Hist Period
1 to 255
Period Units
1/32s
1.0s
10.0s
60.0s
Other Level
No
Pk-II
Pk-I
Lmax
Resolution
0.1 dB
1.0 dB
Use the History Enable setting to either enable or disable the automatic storage of simple time-history
records. The instrument has the ability to store data at
a user-determined rate. You can then view these history records at a later time.
∫SLM-Logging Sound Level Meter
5-15
This setting provides the following two options:
No - Time-history storage is disabled.
Yes - Time-history storage is enabled.
Hist Period Setting
This setting is used in conjunction
with the ÒPeriod Units SettingÓ
(below).
Use the time History Period setting to set the number of
history periods that transpire between successive time
history samples. These samples continue either until
the instrument is stopped or runs out of memory. This
setting can take on any integral value in the following
range:
(1) to (255)
Period Units Setting
Use the time history Period Units setting to select the
type of units the instrument uses to calculate the time
which transpires between successive time history storage operations. To calculate the timer period, the
instrument multiplies the units selected in this setting
by the number set in the Time History Period setting (see
the previous ÒHist Period SettingÓ and the following
example).
This setting provides the following four options:
Example: To measure 2 sample per
second, set Hist Period to 16 and
Period Units to 1/32s (16/32=1/2).
1/32s - The instrument uses its 1/32 second internal
sample period as the history period unit. Since the
instrument samples the detector 32 times per second,
this is the smallest resolution time period that you can
use. If you set the time history period to 1/32 second
(i.e. period setting = 1 and unit setting = Sample = 1/
32s), the instrument will store every sample it takes.
1.0s - The instrument uses one second as the history
period unit.
10.0s - The instrument uses ten seconds as the history
period unit.
60.0s - The instrument uses one minute as the history
period unit.
5-16
System 814 User Manual
1/23/98
Other Level Setting
Use the Other Level setting to select the second measurement level stored in each time history record along
with the Leq. This setting provides the following
options:
No - The instrument stores the Leq but does not store a
second level.
Pk-I - The second level the instrument stores is the
greatest instantaneous level (Lpk) detected by the primary peak detector that occurred during the time history period. The primary peak level is weighted
according to the state of the Peak I Weighting setting.
Pk - II - The second level the instrument stores is the
greatest instantaneous level (Lpk) detected by the secondary peak detector that has occurred during the
time history period. The secondary peak level is
weighted according to the state of the Weighting setting.
Lmax - The second level the instrument stores is the
maximum level (Lmax) that has occurred during the
time history period.
Resolution Setting
In order to double the memory capacity, it is possible
to reduce the resolution of the Time History record
from 0.1dB to 1.0dB.
0.1dB - Leq and the optional Other Level are stored
with full resolution which requires 2 bytes of memory
per level.
1.0dB - Leq and the optional Other Level are stored
with 1dB resolution which requires only 1 byte per
level stored. Levels are rounded to the nearest integer
(85.5 would be stored as 86dB and 85.4 would be
stored as 85dB).
Intervals Menu
The Interval menu sets the following parameters to
automatically stored to memory at regular time peri-
1/23/98
∫SLM-Logging Sound Level Meter
5-17
ods: Leq, SEL, Lmax, Lmin, Lpk1, LpkII, and six Ln
values. The interval time period can range from one
second to one hundred hours. The Interval feature is
particularly useful when monitoring noise levels for
extended periods of time, because you can determine how the statistical makeup of the acoustic environment has changed over time.
Use the u and d keys to
move from one setting to the next.
Then use the r key to change the
selected setting. The l key is
used to return to previous menus.
The following is a chart of the Intervals settings. Each
setting is then described in greater detail.
Menu Items
Available Settings Options
Intv Enable
No
Yes
Intv Period
hh:mm:ss
Intv Time Sync
No
Yes
Intv Save LnÕs
No
Yes
Intv Auto Stop
No
Yes
Intv Threshold
0 to 255
Intv Exchange
3dB
4dB
5dB
6dB
Use the Interval Enable setting to either enable or disable the automatic storage of interval statistical
records.
This setting provides the following two options:
No - Interval storage is disabled.
Yes - Interval storage is enabled.
5-18
System 814 User Manual
1/23/98
Interval Period Setting
Use the time Interval Period setting to set the time interval between successive interval storage operations.
These storage operations continue either until the
instrument is stopped or runs out of memory. This setting can take on any time value in the following range:
00:00:01 to 99:59:59 (i.e. one minute to 99
hours, 59 minutes and 59 seconds).
Interval Sync Enable Setting
Use the Intv Time Sync setting to either enable or disable the time-history sync feature. When enabled, this
feature causes the time history storage operations to be
synchronized with the real-time of day clock. This synchronization can occur on an hourly, 30 min., 20 min.,
15 min., 5 min., or 1 min. basis. The Intv Period setting
should also be set accordingly so that the synchronization works properly. When you start a measurement,
the initial storage interval will last for only a fraction of
the determined synchronization until the start of the
next time segment; at which time a new, synchronized
storage interval will begin.
This setting provides the following two options:
No - Interval synchronization is disabled.
Yes - Interval synchronization is enabled.
Interval LN Enable Setting
Use the Interval LN Enable setting to either enable or
disable the automatic storage of the six LN percentile
levels in the interval record.
This setting provides the following two options:
No - The six LN levels are not stored with the interval
record.
Yes - The six LN levels are stored with the interval
record.
1/23/98
∫SLM-Logging Sound Level Meter
5-19
Interval Auto-Stop Enable
Setting
Do not use this feature with the time
sync feature, or you may not get the
full time period you desire.
Use the Auto-Stop setting to either enable or disable the
auto-stop feature. When enabled, this feature causes
the instrument to automatically stop the measurement
at the end of each storage interval. This allows you to
precisely time a series of manual measurements. To
start a new measurement after an automatic stop, just
press the s key.
This setting provides the following two options:
No - Automatic stop feature is disabled.
Yes - Automatic stop feature is enabled.
Interval Threshold Setting
Use the Interval Threshold setting to set the threshold
for computing the interval time weighted average
(TWA). As per the requirements of various regulatory
agencies, only those sound levels which are above a
certain threshold level are used when computing the
overall TWA. Accordingly, this setting can take on any
integral value within the following range:
(0)dB to (255)dB
For hearing conservation measurements, set the
threshold to 80dB. For most community noise measurements, set the threshold to 0dB or slightly above
the noise ßoor.
Interval Exchange Rate Setting
Use the Interval Exchange Rate setting to set the
exchange rate (sometimes called the Òdoubling rateÓ)
that is used to calculate the interval TWA. The
exchange rate reßects the relationship between the permitted exposure levels and the exposure duration.
Selecting an exchange rate of 5dB, for example, means
that 5dB may be added to the permissible exposure
level every time the exposure duration is cut in half.
This setting provides the following four options:
3dB - The 3dB (default) option is the most commonly
used and results in the Leq time weighted average
which is used in Europe and for measurements that
5-20
System 814 User Manual
1/23/98
comply with U.S. Environmental Protection Agency
(EPA) regulations.
4dB - The 4dB option results in the LDOD time
weighted average which is used for measurements
that comply with U.S. Department of Defense (DOD)
regulations.
5dB - The 5dB option results in the LOSHA time
weighted average which is used for measurements
that comply with U.S. Occupational Safety and Health
Administration (OSHA) regulations.
6dB - The 6dB option results in the LAvg time weighted
average which is merely a convenient representation
of the long-term average noise level as opposed to the
RMS noise level.
Define Report Menu
Use the u and d keys to
move from one setting to the next.
Then use the r key to change the
selected setting. The l key is
used to return to previous menus.
1/23/98
The following is a chart of the DeÞne Report settings.
Each setting is then described in greater detail.
Menu Items
Available Settings Options
Data Report
No
Yes
SPL Histogram
No
Yes
Pk-1 Histogram
No
Yes
Pk-2 Histogram
No
Yes
Intv Report
No
Short
Long
Hist Report
No
Yes
∫SLM-Logging Sound Level Meter
5-21
Data Report Setting
Use the Data Report Enable setting to either enable or
disable the printing of the data report. The data report
contains all the basic measurement parameters for
both the overall and current measurements. This setting provides the following two options:
No - The data report will not print.
Yes - The data report will print.
SPL Histogram Report Setting
Use the SPL Histogram Report enable setting to either
enable or disable the printing of the SPL histogram
report. The histogram report contains a histogram of
the SPL levels that have occurred during the overall
and current measurements. The report also prints a
table of all (1 to 99%) LN percentiles. This setting provides the following two options:
No - The SPL histogram report will not print.
Yes - The SPL histogram report will print.
Pk-I Histogram Setting
Use the Peak I Histogram setting to either enable or disable the printing of the Peak I histogram report. The
histogram report contains a histogram of the Peak I
levels that have occurred during the overall measurement. This setting provides the following two options:
No - The peak I histogram report will not print.
Yes - The peak I histogram report will print.
Pk-II Histogram Setting
Use the Peak II Histogram setting to either enable or disable the printing of the Peak I histogram report. The
histogram report contains a histogram of the Peak II
levels that have occurred during the overall measurement. This setting provides the following two options:
No - The peak II histogram report will not print.
Yes - The peak II histogram report will print.
Intv Report Setting
5-22
Use the Interval Report setting to either disable the
printing of the interval report or enable either the
ÒlongÓ or the ÒshortÓ version of this report. The
System 814 User Manual
1/23/98
ÒshortÓ interval report contains all the basic measurement parameters for each interval period in a speciÞed
range of records. The ÒlongÓ interval report contains
everything the short report contains plus some additional information.
This setting provides the following three options:
No - The interval report will not print.
Short - The ÒshortÓ interval report (including Lmax,
Lmin, SEL, Leq, Pk-I, Pk-II, overloads, and exceedances)
will print.
Long - The ÒlongÓ interval report (including Lmax, Lmin,
SEL, Leq, Pk-I, Pk-II, overloads, and exceedances) will
print.
Use the History Report setting to either enable or disable the printing of the Time history report. The history report contains the Leq, and optionally one
selectable level (Lpk-I, Lpk-II, or Lmax) basic measurement parameter for each time history period.
Hist Report Setting
This setting provides the following two options:
No - The history report will not print.
Yes - The history report will print.
Controls Settings Menu
Use the u and d keys to
move from one setting to the next.
Then use the r key to change the
selected setting. The l key is
used to return to previous menus.
1/23/98
The following is a chart of the Control settings. Each
setting is then described in greater detail.
Menu Items
Available Settings Options
AC Out Filter
Flat
Wght
∫SLM-Logging Sound Level Meter
5-23
AC Out Filter Setting
Logic-In Mode
None
Pause
Toggle
Level
Alarm
Logic Output
Off
RMS
Peak
R+P
Intv
R+I
P+I
R+P+I
A:D
R+A
P+A
R+P+A
I+A
R+I+A
P+I+A
R+P+I+A
R/S
Excd
Logic Output
Timer
0 sec ~ 255 sec
Use the AC Out Filter setting to select the frequency
characteristics of the AC output signal. The AC output
signal is derived from the actual signal the instrument
is measuring. This signal is available for external use
via a connector at the base of the System 814.
This setting provides the following two options:
Flat - The AC output signal has the ßat frequency
weighting applied to it.
Wght - The AC output signal has the same frequency
characteristics as the 0SPL level: A, C or Flat.
Logic Input Setting
5-24
Use the Logic Input setting to select the functionality of
the logic input pin on the control connector (pin 3).
System 814 User Manual
1/23/98
This logic input pin is intended to be connected to an
external switching deviceÑpossibly a push-button
switch. The external switching device will either connect the pin to +5V (which is also available on the control connector on pin 6) or leave the pin unconnected.
This signal may also be supplied from another device
that can supply a 0 to +5 volt logic signal (input loading is 100K ohms). The resulting logical state (either on
or off) will determine what occurs inside the instrument as a function of this Logic Input setting. Accordingly, the setting provides the following Þve options:
None - The state of the logic input pin has no effect.
Pause - Whenever the logic input is connected to +5V
(e.g. when a push-button switch is pressed), the instrument pauses if it is in the run mode.
Toggle - Each time the logic input is connected to +5V
(e.g. when a push-button switch is pressed), the instrument runs or stops. The effect is the same as pressing
the s key.
Caution: This function will override
the s key and I/O RUN/STOP
commands.
Level - When the logic input is connected to +5V (e.g.
when a push-button switch is pressed), the instrument
runs. When the logic input is disconnected from +5V
(e.g. when a push-button switch is released), the
instrument stops.
Alarm - When the logic input is connected to +5V (e.g.
when a push-button switch is pressed), the instrument
initiates a dial-out sequence. This option is intended
for use only with advanced remote monitoring applications where the instrument is paired with a modem.
Logic Output Setting
1/23/98
Use the Logic Output setting to select the functionality
of the logic output pin on the control connector (pin 2
referenced to ground on pin 1). You can use this Logic
Output to actuate external devices as a function of certain events or combinations of events that occur in the
instrument. The option you select will determine
which event or combination of events will turn on the
logic output line.
∫SLM-Logging Sound Level Meter
5-25
Once the Logic Output turns on, it will stay on for the
length of time set by the Logic Output Time setting.
NOTE: In many of the options below, notice the use of a shorthand
identiÞer which includes the Þrst letters of the various events along
with the plus Ò+Ó symbol. The plus symbol indicates a logical
ÒORÓ function between events. In other words, if for a given
option, any one of the listed events occurs alone or in combination
with another event, the logic output will turn on.
The Logic Output setting provides the following 17
options, many of which will be available in the future.
Off - The Logic Output is always off (i.e. it is disabled).
RMS - The Logic Output turns on when an RMS
exceedance event occurs. An RMS exceedance event
occurs when the RMS sound pressure level (SPL)
exceeds either of the thresholds set by the SPL trigger
level settings.
Peak - The Logic Output turns on when a Pk-II exceedance event occurs. A Pk-II exceedance event occurs
when the Pk-II level exceeds the threshold set by the
Pk-II trigger level setting.
R+P - The Logic Output turns on when either an RMS
or Pk-II exceedance event occurs.
Intv - The Logic Output turns on when an interval
begins.
R+I - The Logic Output turns on when an RMS exceedance event occurs or when an interval begins.
P+I - The Logic Output turns on when any peak exceedance event occurs or when an interval begins.
R+P+I - The Logic Output turns on when either an RMS
or peak exceedance event occurs or when each interval
begins.
Currently NOT available on the
System 814.
5-26
A:D - The Logic Output turns on when an event on one
of the A:D channels occurs. These A:D channels are
typically used for wind monitoring.
System 814 User Manual
1/23/98
Currently NOT available on the
System 814.
R+A - The Logic Output turns on when an RMS exceedance event occurs or when an event occurs on one of
the A:D channels.
Currently NOT available on the
System 814.
P+A - The Logic Output turns on when a Pk-II exceedance event occurs or when an event occurs on one of
the A:D channels.
Currently NOT available on the
System 814.
R+P+A - The Logic Output turns on when either an
RMS or Pk-II exceedance event occurs or when an
event occurs on one of the A:D channels.
Currently NOT available on the
System 814.
I+A - The Logic Output turns on when each interval
begins or when an event occurs on one of the A:D
channels.
Currently NOT available on the
System 814.
R+I+A - The Logic Output turns on when an RMS
exceedance event occurs, when each interval begins, or
when an event occurs on one of the A:D channels.
Currently NOT available on the
System 814.
P+I+A - The Logic Output turns on when a Pk-II
exceedance event occurs, when each interval begins, or
when an event occurs on one of the A:D channels.
Currently NOT available on the
System 814.
R+P+I+A - The Logic Output turns on when either an
RMS or Pk-II exceedance event occurs, when each
interval begins, or when an event occurs on one of the
A:D channels.
Note that the output
does not apply when
this particular option
put Hold Time SettingÓ
chapter).
R/S - The Logic Output turns on when the instrument is
in run mode and turns off when the instrument is in
stop mode.
hold time
you select
(see ÒOutlater in the
Logic Output Timer Setting
Excd - The Logic Output turns on when a valid exceedance is detected and after itÕs minimum duration has
been met.
Use the Logic Output Time setting to set the number of
seconds that the logic output will remain turned on or
remain asserted following a triggering event. Accordingly, this setting can take on any integral value within
the following range:
(0)sec to (255)sec
1/23/98
∫SLM-Logging Sound Level Meter
5-27
NOTE: If set below 5 seconds, the output will remain on as long as
the conditions are true and turn off x seconds (0 to 5) after the condition. If set to 6 seconds or greater, the line will stay on for at least
5 seconds but will turn off as soon as the condition becomes false or
the condition has lasted the number of set seconds (i.e. 0-5 minimum time, 6-255 maximum time).
Check Menus
The ∫SLM on the System 814 also has a shortcut to
menus that access the settings associated with data
being displayed. The following shows the steps that
are necessary to access the Detector or Freq. Weighting
settings using a Check menu. To do this:
Step 1 can also be performed from
any Current or Overall display and
achieve the same result.
Step 1 From a ∫SLM display, press the c key to
access the Check menu. The following
appears:
Following is a chart of the SLM settings. Each setting is
then described in greater detail.
5-28
Menu Items
Purpose
Graph
Change view of the ∫SLM SPL
history graph
Settings
SpeciÞc Sound Level Meter settings
TWA
System 814 Controls for the SLM
System 814 User Manual
1/23/98
Graph Menu
Use the u and d keys to
move from one setting to the next.
Then use the r key to change the
selected setting. The l key is
used to return to previous menus.
The following is a chart of the ∫SLM Graph settings.
Each setting is then described in greater detail.
Menu Items
Available Settings Options
Graph Level
(0) to (255)
Graph Scale
2, 1, 1/2, 1/4, 1/8
Graph Level
Graph Level may also be changed
interactively with the Adjust Graph
display (described next).
The Graph Level setting allows you to change the base
level of the SPL history graph. The following is the
possible setting range:
0 - 255
Graph Scale
Graph Level may also be changed
interactively with the Adjust Graph
display (described next).
The Graph Scale setting allows you to change the size of
the scrolling SPL history graph. The following are the
possible settings:
2, 1, 1/2, 1/4, 1/8 dB per dot (pixel)
Pressing the c key on Graph (from the ∫SLM shortcut
menu), will allow you to graphically change the ∫SLM
Graph settings. The following screen appears:
The l or r key allows you to adjust the Graph
Level. The u or d key allows you to adjust the
Graph Scale. When you are Þnished customizing the
settings of the graph, press the c key.
1/23/98
∫SLM-Logging Sound Level Meter
5-29
Settings
Refer to ÒSLM SettingÓ (described earlier in this chapter) for details on this menu.
TWA
Refer to ÒTWA SettingÓ (described earlier in this chapter) for details on this menu.
Understanding ∫SLM Displays
The System 814 has many displays for the ∫SLM instrument. Understanding these displays allows you to take
full advantage of the instrument.
Each display contains an instrument status icon in the
upper right hand corner of the display. This icon
changes according to the current state of the instrument.
Status icon
The following is list and description of icons which
may appear:
Status Icon
Description
Animated Running Figure - Instrument is running and acquiring data.
Solid Box - The instrument is
stopped, data available.
Open Box - The instrument is
stopped, and reset.
Double Bar - The instrument is
paused.
5-30
System 814 User Manual
1/23/98
Play Symbol - The instrument is
ready to run (as soon as stabilization
completes).
Bar and Play Symbol - The instrument is in preview. Current SPL and
peak levels are displayed, but no
data is being acquired.
Animated Hourglass - The instrument is stabilizing to ensure accurate
measurement.
Animated Draining Battery - The
battery is low, and the instrument
will shut off soon.
O.L. - The instrument is overloaded;
measurement may not be accurate
due to an overload condition having
occurred some time during the measurement.
Animated Clock - Indicates that the
automatic run/stop timer is active.
In order to view the displays on the System 814 in
∫SLM mode, switch the device to ∫SLM mode. To do
this:
If the 814 is already in Logging SLM
mode, there will be a Ô>Õ to the left of
NORMAL SLM.
1/23/98
Step 1 Press the S SETUP key. A menu similar to
the following appears:
∫SLM-Logging Sound Level Meter
5-31
If you have not already saved your
data, you will be prompted to Save it
here.
Step 2 Select NORMAL SLM from the menu by
pressing the uordkeys and then pressing the c key. The ∫SLM Default screen
appears:
Using the uandd arrow
keys, select the desired display then
press the c key to bring up that
display.
Step 3 Press the V key to access the View menu.
The following screen appears:
Available ∫SLM Displays
There are six Logging SLM main displays and Þve
additional displays. Each display is described in
greater detail.
Main Displays:
5-32
Display
Purpose
Current
SLM
Maintains an accumulation of data that
may be reset immediately.
OverAll
SLM
Maintains an accumulation of data over
the entire measurement period and is
reset when the entire measurement is
reset.
Exposure
The exposure display shows either
dose and projected dose, or the sound
exposure (E).
System 814 User Manual
1/23/98
Ln Centiles
Display shows six selected Ln values, a
graph of L1 to L99, a graph of the percent greater than level, and graph of
level distribution in percent.
Stats
Shows the number of overloads, and
the number of events detected.
LDL
Shows the TWA, SEL, dose and projected dose as recalculated with an
adjustable threshold, exchange rate, criterion level and criterion time.
Additional Displays:
1/23/98
Display
Purpose
Time
History
Shows the time history of Leq and
optionally either Lmax or Lpk over short
duration periods.
Intervals
Shows a full statistical history over a
longer time period by providing TWA,
SEL, Lmin, Lmax, Lpk-I, Lpk-II, and six Ln
values for each interval period.
Run Log
Shows a listing of each run, stop, pause,
continue, and mark actions with their
cause, and date/time of occurrence.
PassBy
Shows the largest single 10dB passby
event detected (not present).
Wind/
Tach
Shows wind or tachometer measurements (not present).
∫SLM-Logging Sound Level Meter
5-33
Current / Overall -a SLM
Displays
The System 814 contains two independent data buffers that can separately accumulate data. In essence,
the instrument becomes two sound
level meters in one. The data in the
primary buffer is referred to as the
ÒoverallÓ measurement, while data
in the secondary buffer is referred to
as the ÒcurrentÓ measurement.
The Current / Overall - a SLM display consists of six
major components:
¥ Display label
¥ Current SPL reading and weight setting
¥ Selected detector
¥ Elapsed time
¥ Status
¥ SPL history graph
The following information explains each of these components.
Display label
Status
Current SPL reading
and weight setting
SPL history graph
Detector setting
Elapsed time
Display label - Shows the display currently being
used (in this example, SLM Current-a). The display represents both Current and Overall -a display. The only
difference is where the data are being stored in memory.
Current reading and weight setting - Displays the
current SPL reading for the moving bar on the far right
of the SPL history graph. This displays the SPL measurement while the ∫SLM instrument is running. The
frequency weighting for SPL can indicate: A, C, FLT,
OCT, 1/3 (see SLM settings above).
5-34
System 814 User Manual
1/23/98
Detector setting - The current detector is indicated (for
example, Slow SPL).
Elapsed time - Displays the length of time current or
overall measurements have been running. It will
restart at zero when the R key is pressed. It will also
pause when the p key is pressed and then continue
when it is pressed again. The timer is displayed as
mm:ss.ss, hh:mm:ss or hhhhh:mm.
SPL history graph - Shows a recent history of SPL
readings. The far right bar moves and displays the current SPL reading. As readings are taken, they are
placed onto the scrolling graph from right to left one
time per second.
Current / Overall -b SLM
Display
The Current / Overall - b SLM display consists of four
major components:
¥ Display label
¥ Start date / time
¥ Elapsed time
¥ End date / time
The following information explains each of these components:
Display label
Start date / time
End date / time
Elapsed time
Display label - Shows the display currently being
used (for example, SLM Current-b). The display represents both Current and Overall -b display. The only
1/23/98
∫SLM-Logging Sound Level Meter
5-35
difference is where the data are being stored in memory.
Start date / time - Date and time the current/overall
measurement began.
Elapsed time - The Elapsed Time displays the length of
time current or overall measurements have been running. It will restart at zero when the R key is pressed.
It will also pause when the p key is pressed and then
continue when it is pressed again. The timer is displayed as mm:ss.ss, hh:mm:ss or hhhhh:mm
End date/time - Date and time the current/overall
measurement ended (or current time if still running).
Current /Overall -c SLM
Displays
The Current/Overall - c SLM Display consists of three
major components:
¥ Display label
¥ Current/Overall Lmax reading
¥ Current/Overall Lmin reading
The following information explains each of these components:
Display label
Current / Overall
Lmax reading
Current / Overall
Lmin reading
Display label - Shows the display currently being
used (for example, SLM Current-c). The display represents both Current and Overall -c display. The only difference is where the data are being stored in memory.
5-36
System 814 User Manual
1/23/98
Current / Overall Lmax reading - Displays Lmax or
maximum level that occurred, and the date and time
when it occurred.
Current / Overall Lmin reading - Displays Lmin or
minimum level that occurred, and the date and time
when it occurred.
Current / Overall -d SLM
Displays
The Current / Overall - d SLM Display consists of three
major components:
¥ Display label
¥ Current / Overall Lpk-I reading
¥ Current / Overall Lpk-II reading
The following information explains each of these components:
Display label
Current / Overall
Lpk-I reading
Current / Overall
Lpk-II reading
Display label - Shows the display currently being
used (for example, SLMCurrent-d). The display represents both Current and Overall -d display. The only
difference is where the data are being stored in memory.
Current / Overall Lpk-I reading - Shows the largest
instantaneous peak levels detected by the primary
(Peak-I) peak detector, and the date and time when it
occurred.
This primary peak detector is weighted according to
the state of the Peak-I Weighting setting.
1/23/98
∫SLM-Logging Sound Level Meter
5-37
Current / Overall Lpk-II reading - Shows the largest
instantaneous peak levels detected by the secondary
(Peak-II) peak detector and the date and time when it
occurred.
The secondary peak detector is weighted according to
the state of the RMS Weighting setting.
With these two separate peak detectors, the System 814
gives you the ßexibility of having various conÞgurations of peak-detector weighting. For example, you
could have two simultaneous but independent peak
detectorsÑone with A weighting and the other with C
weighting.
Current / Overall - e SLM
Displays
The Current / Overall - e SLM Display consists of four
major components:
¥ Display label
¥ TWA indicator and level
¥ Sound exposure level
¥ Elapsed time
The following information explains each of these components:
Display label
TWA indicator and level
Sound exposure level
Elapsed time
Display label - Shows the display currently being
used (for example, SLM Current-e). The display represents both Current and Overall -e display. The only difference is where the data are being stored in memory.
5-38
System 814 User Manual
1/23/98
TWA indicator and level - Indicator based on the
exchange rate (3dB: Leq, 4dB: Leq, etc.) and the Time
Weighted Average Level.
Sound exposure level - Sound Exposure Level (SEL)
measured in dB.
Elapsed time - Shows the elapsed run time accumulated since the last current reset. This is the time over
which the current TWA is averaged.
The Exposure -a Display consists of seven major components:
Exposure-a Display
¥ Display label
¥ Dose
¥ Projected dose
¥ Time weighted average
¥ Sound exposure level
¥ Timer
The following information explains each of these components:
Display label
Dose
Projected Dose
Time weighted average
Sound exposure level
Timer
Display label - Shows the display currently being
used (for example, SLM Exposure-a).
1/23/98
∫SLM-Logging Sound Level Meter
5-39
Dose - By deÞnition, a person receives 100% dose
when exposed to a noise having a TWA equal to the
selected criterion level for a time equal to the criterion
time (usually eight hours). This corresponds to the
maximum safe noise exposure. Exposures at higher
levels will result in a 100% dose in less time; or if exposure continues, the exposure will exceed 100% dose.
Projected dose - Projected dose is the dose that will
occur if current noise levels continue for the entire criterion time.
Time weighted average - Time Weighted Average
(TWA) measured in dB.
Sound exposure level - Sound Exposure Level (SEL)
measured in dB.
Timer - The timer displays shows the elapsed run time
accumulated since the last current reset. This is the
time over which the current TWA is averaged.
Exposure-b Display
The Exposure-b display consists of Þve major components:
¥ Display label
¥ Sound exposure
¥ Sound exposure level
¥ Time weighted average
¥ Timer
The following information explains each of these components:
5-40
System 814 User Manual
1/23/98
Display label
Sound exposure
Sound exposure level
Time weighted average
Timer
Display label - Shows the display currently being
used (for example, SLM Exposure-b).
Sound exposure - Sound Exposure (E) in Pascal
squared hours (Pa2H). The Sound Exposure (E) is a
function of the Leq and the elapsed time of the overall
measurement.
Time weight average - Time Weighted Average (TWA)
measured in dB.
Sound exposure level - Sound Exposure Level (SEL)
measured in dB.
Timer - Shows the elapsed run time accumulated since
the last current reset. This is the time over which the
current TWA is averaged.
Ln-a Display
The Ln-a display consists of two major components:
¥ Display label
¥ Percentile values & levels
The following information explains each of these components:
1/23/98
∫SLM-Logging Sound Level Meter
5-41
Display label
Percentile values &
levels
Display label - Shows the display currently being
used (for example, SLM Ln-a).
Percentage settings are entered with
a 1/100th dB resolution, but are displayed to the nearest 1/10th dB when
10 dB or greater.
Percentile values & levels - The Ln (percentile levels)
level is that which was exceeded ÔnÕ percent of the
measurement time. By modifying the six settings you
can select any six percentile values to be displayed at a
time. For example, if you set one of these settings to
10.5, then L10.5 would be one of the six percentiles that
is displayed. The value of L10.5 is the level that has
been exceeded 10.5% of the time during the overall
measurement.
Ln-b Display
The Ln-b display consists of Þve major components:
¥ Display label
¥ Current % record
¥ Ln
¥ Timer
¥ Ln graph
The following information explains each of these components:
5-42
System 814 User Manual
1/23/98
Display label
Current%
Ln
Ln graph
Timer
Display label - Shows what display currently being
used (for example, Ln-b Centiles).
Current% - Selects % of Ln to display (1 to 99), using
the u and d arrow keys to move from one Centile to another.
Ln - Current Ln value.
Timer - Shows the elapsed run time accumulated since
the last current reset.
Ln graph- Graph of LnÕs from 1 to 99 (1 being on the
left, 99 on the right).
Stats-a Display
The Stats-a display consists of three major components:
¥ Display label
¥ Trigger level 1 and event counter
¥ Trigger level 2 and event counter
The following information explains each of these components:
1/23/98
∫SLM-Logging Sound Level Meter
5-43
Display label
Trigger level 1
and event counter
Trigger level 2
and event counter
Display label - Shows the display currently being
used (for example, SLM Stats-a).
Trigger level 1 and event counter - Summary of the
number of times during the overall measurement that
the SPL exceeded the pre-programmed trigger level 1.
In this example, trigger level 1 is set to 115 dBA and the
SPL exceeded this threshold 0 times. These may be
considered to be individual events.
Trigger level 2 and event counter - Summary of the
number of times during the overall measurement that
the SPL exceeded the pre-programmed trigger level 2.
In this example, trigger level 1 is set to 120 dBA and the
SPL exceeded this threshold 0 times. These may be
considered to be individual events.
Stats-b Display
The Stats-b display consists of three major components:
¥ Display label
¥ Peak-I trigger
¥ Peak-II trigger
The following information explains each of these components:
5-44
System 814 User Manual
1/23/98
Display label
Peak-I trigger
Peak-II Trigger
Display label - Shows the display currently being
used (for example, SLM Stats-b).
Peak-I trigger - Summary of the number of times during the overall measurement that the peak-I level
exceeded its pre-programmed trigger level. In this
example, peak-IÕs trigger level is set to 140dBA and the
peak-I level exceeded this threshold 0 times. These
may be considered to be individual events.
Peak-II trigger - Summary of the number of times during the overall measurement that the peak-II level
exceeded its pre-programmed trigger level. In this
example, peak-IIÕs trigger level is set to 140dBA and
the peak-II level exceeded this threshold 0 times. These
may be considered to be individual events.
Stats-c Display
The Stats-c display consists of two major component:
¥ Display label
¥ Overload message
The following information explains this component:
1/23/98
∫SLM-Logging Sound Level Meter
5-45
Display label
Overload message
Display label - Shows the display currently being
used (for example, SLM Stats-c).
Overload message - The Stats-c display indicates the
occurrence of instrument overloads during the measurement. If one or more overloads have occurred, the
display will show the total number of overloads. If no
overloads have occurred, the display will show a
No Overloads have occurred message instead.
LDL Display
The LDL (Logged Data Logic) display consists of nine
major components:
¥ Display label
¥ Validity status
¥ Time weighted average
¥ Sound exposure level
¥ Dose
¥ Projected dose
¥ LDL threshold
¥ LDL criterion level
¥ LDL exchange rate
The following information explains each of these components:
5-46
System 814 User Manual
1/23/98
Validity status
Display label
Time weighted average
Sound exposure level
Dose
Projected dose
LDL threshold
LDL criterion level
LDL exchange rate
These LDL settings are completely independent of the
corresponding ÒoverallÓ settings which are used to calculate the conventional dose. You can modify the LDL
settings using the LDL shortcut menu by pressing the
c key.
Display label - Shows the display currently being
used (for example, LDL).
Validity status - The logged data logic (LDL) recalculator is useful for precise recalculation of dose and TWA
to perform a Òwhat ifÓ type analysis on the data that
the instrument has already collected or is currently collecting. If the instrument is running, it will automatically calculate a new dose every Þve seconds as
indicated by a Calculating status message on the display. After the calculation, the display will show a
LDL Valid status message for a short period of time.
The display will then show an LDL Invalid status message as new data is added until the next calculation
begins. Whenever you change any of the LDL settings,
the recalculation begins immediately.
Time weighted average - Time Weighted Average
(TWA) measured in dB.
Sound exposure Level - Sound Exposure Level (SEL)
measured in dB.
Dose - By deÞnition, a person receives 100% dose
when exposed to a noise having a TWA equal to the
selected criterion level for a time equal to the criterion
1/23/98
∫SLM-Logging Sound Level Meter
5-47
time (usually eight hours). This corresponds to the
maximum safe noise exposure. Exposures at higher
levels will result in a 100% dose in less time; or if exposure continues, the exposure will exceed 100% dose.
Projected dose - Projected dose is the dose that would
occur if current noise levels continue for the entire criterion time.
LDL threshold - Threshold rate that is currently being
used to calculate the time weighted average.
LDL criterion level - Used to set the TWA level which
constitutes 100% dose for the current measurement.
The 100% dose occurs if a person is exposed to that
level for the criterion time or full dose hours.
LDL exchange rate -Exchange rate that is currently
being used to calculate the time weighted average.
Using the ∫SLM
This section gives a step by step example of a possible
scenario using the ∫SLM instrument. In this scenario,
you will select the Logging SLM instrument and take
three measurements. You will then view the results of
these three measurements. In this example,
SLM_DEMO SLM will be used. This is a demo version
of the Logging SLM instrument which already contains Interval and Time History data.
Simple ∫SLM Scan
5-48
Step 1 Press the S SETUP key. A menu similar to
the following appears:
System 814 User Manual
1/23/98
If the 814 is already in ∫SLM demo
mode, there will be a Ô>Õ to the left of
SLM_DEMO SLM
Step 2 Select SLM_DEMO SLM from the menu by
pressing the uordkeys and then pressing the c key. A ∫SLM screen appears:
If you have not already saved your
data, you will be prompted to save it.
Step 3 Press the V VIEW key to access the View
menu. The following screen appears:
Using the ud arrow keys,
you can select the desired display.
Then press the r arrow key to
bring up the display.
Step 4 Using u and d keys select Current
SLM, then press c to select. The following
screen appears:
1/23/98
∫SLM-Logging Sound Level Meter
5-49
Step 5 Press the s RUN/STOP key to begin taking
a measurement. Run for about 3 minutes. A
screen similar to the following appears:
Pressing the V VIEW key also
allows you to view more detailed
information about this measurement.
5-50
Step 6 Press the s RUN/STOP key to stop taking
readings. Use the u,d,l,rkeys
to move to other Logging SLM displays (to
view more detailed information about this
measurement).
System 814 User Manual
1/23/98
CHAPTER
6
Printing Reports from the 814
The System 814 allows you to print a report from data
collected during a measurement. This chapter will discuss the following aspects of printing reports:
¥ Connecting the 814 to a Serial Printer
¥ Printing Normal SLM Reports
¥ Printing Simple SSM Reports
¥ Printing Octave OBA Reports
While most users will normally print 814 data using a
computer, it is possible to print both graphical and tabular data reports directly from the 814 to virtually any
serial printer. Printouts range from high resolution
presentation quality reports when printing to a laser
printer because of the instrumentÕs PDL (page description language) capabilities to draft-quality tabular data
reports that can also be printed to a serial printer.
Connecting the 814 to a Serial Printer
Make sure the System 814 and your printer are turned
off before initiating any of the following steps.
Step 1 Connect the provided serial cableÕs 8-pin min
DIN connector to the System 814 serial port.
Step 2 Connect the serial cableÕs 25-pin male ÒDÓ
connector to your printerÕs serial port.
1/23/98
Printing Reports from the 814
6-1
Step 3 Turn on both your printer and the System
814.
Printing Normal SLM Reports
Step 1 Press the D Data key and use the Data Files
menu to recall the Normal SLM measurement
record that you want to print.
Depending on whether you have
selected Normal SLM, Simple SSM,
or Octave OBA from the Setup
menu you will have a different Print
menu available.
Step 2 To print the data Þle press the P Print key.
The following screen appears:
The Print menu provides the following
options depending upon whether you have
selected normal SLM, simple SSM, or Octave
OBA from the S menu. he following table
shows the options for the Normal SLM
Report menu:
6-2
Status
Options
Settings
Printer Type
Printer Baud
Flow Control
Summary
[prints a summary report]
Tailored
[prints the tailored report]
Recall Format
Summary
Tailored
All, short
All, long
None enabled
System 814 User Manual
1/23/98
Customize
Unformatted
Data Report
Log Report
Setup Report
SPL Histogram
Intv Report
Hist Report
Print Range
Histograms
Print
[prints the selected report(s)]
Make sure your printer has serial
capabilities as most printers are parallel. If you have any questions about
which printers work with the 814,
contact the Larson¥Davis marketing department.
Step 3 Use the u and d arrow keys to highlight
Settings, then press the r arrow key or c
key to select it. The following menu appears:
Depending on your printer conÞguration you may also have to modify
the Printer Settings for Printer Baud
and Flow Control also.
Step 4 Use the u and d arrow keys to highlight
the Printer Type item, then press the r
arrow key or c Check key to select it. The
following menu appears:
Step 5 Use the u and d arrow keys to highlight
the appropriate printer type that matches the
printer that your System 814 is connected to,
then press the r arrow key or c Check
key to select it.
1/23/98
Printing Reports from the 814
6-3
Step 6 Use the l arrow key to return to the main
Print menu.
Step 7 Use the u and d arrow keys to highlight
the Summary or Tailored item, then press the
r arrow key or c Check key to select it.
The title printed on your report will
correspond to the Title setting you
have conÞgured in the Setup menu
for the selected Instrument ID.
Step 8 Your reports will now print.
Defining and Printing Tailored Reports
Using the SETUP key you can
access the Setup menu where you
can select, create, and manipulate
groups of instrument settings
known as Òinstrument deÞnitionsÓ
(ID). The instrument ID deÞnes the
data that is to be measured for a particular project or type of application.
It is also where the deÞnition of the
tailored report is created.
6-4
With the System 814 you can create a tailored report
setting for your instrument IDs (e.i. each instrument
user can set up their own user-deÞned instrument settings). Therefore, each instrument ID can have its own
pre-set customized report settings. This section discusses how to deÞne and print tailored reports for an
instrument ID.
System 814 User Manual
1/23/98
The following Tailored Report settings are available
through the DeÞned Reports menu in the Settings
menu.
Defined Reports Menu
Menu Items
Options
Data Report
Yes
No
SPL Histogram
Yes
No
Pk-1 Histogram
Yes
No
Pk-2 Histogram
Yes
No
Intv Report
No
Short
Long
Hist Report
Yes
No
The following provides an example of how to deÞne
and print a tailored report:
Step 1 Press the S Setup key to bring up the Setup
menu. Highlight the Edit Settings item and
press r arrow key or the c Check key to
select it.
1/23/98
Printing Reports from the 814
6-5
It is in the DeÞne Report item that
you deÞne the reports to be printed
in the tailored report for the selected
instrument ID.
Step 2 Use the u and d arrow keys to highlight
the DeÞne Report item, then select it using the
r arrow key or the c Check key. The following screen appears:
Step 3 Use the u and d arrow keys to scroll
through available report settings. Use the c
Check key to toggle between available
options for each type of report.
Step 4 Use the S SETUP key to completely back out
of all of the Setup menu screens, then press
the P Print key to bring up the Print menu.
For your report to print properly
your printer must be properly connected and conÞgured as discussed
in the ÒPrinting Normal SLM
ReportsÓsection.
6-6
Step 5 Using the u and d arrow keys highlight
the Tailored item, then select it using the r
arrow key or the c Check key. Your tailored
report will now print.
System 814 User Manual
1/23/98
NOTE: Make sure you save your instrument ID before you change
to a different Instrument ID, otherwise all your newly deÞned tailored print settings will be lost.
Using the Recall Format
The Recall Format menu allows you to customize the
summary report or the tailored report and gives you
two more customized reports called All,Long and
All,Short. When the summary report is recalled the
Customize menu is changed to reßect those parameters which will be printed in the summary report.
The Customize menu is a template for each report
selected in the Recall Format menu. You can choose to
print the default template that is recalled for each
report or you can go into the Customize menu and
make further changes to the template.
Step 1 To print from the Recall Format menu press
the P PRINT key. The following screen
appears:
Step 2 Use the u and d arrow keys to highlight
the Recall Format menu. Press the c key and
the following screen appears:
1/23/98
Printing Reports from the 814
6-7
Step 3 Use the u and d arrow keys and select
the report that you want to print (Summary,
Tailored, All,Short, or All,Long.
The following tables shows the default settings for
each of the templates available from the Recall Format
menu (Summary, Tailored, All,Long, All,Short, and
None Enabled).
Default Settings Values for the
Recall Format Reports
Summary Report Template
This template shows the default settings for the Summary Report. The Summary Report includes the Data
Report and the Log Report. After selecting the template you can modify it as explained in ÒPrinting a
Custom ReportÓ below.
Summary Report Template
Report Settings
Lower Level
Report Settings
Description
Unformatted [No]
Data Report [Yes]
This shows general information such as Leq, SEL, Dose, Projected Dose,
Lmin, Lmax, Peak, LnÕs, exceedance, and calibration logs.
Log Report [Yes]
The run/stop log and with the date and time of each run/stop.
Setup Report [No]
Lists settings and their values on the 814.
SPL HIstogram [No]
The 6 Ln values, Lmax, Lmin, and a bargraph of the level distribution.
Intv Report [No]
Leq, SEL, Lmin, Lmax, Peak, Uwpk, exceedances, time, date, and duration in the short report. The Long reports adds the Ln values for the
Interval period.
Hist Report [No]
Leq for each time history period.
Print Range
6-8
Intv Report [No]
You can customize the interval report by choosing the long or short
report.
Lowest Record (00000)
Selects the lowest interval record to be printed.
Highest Record (65535)
Selects the highest interval record to be printed.
Hist Report [No]
You can customize the time history report by choosing the long or short
report.
Lowest Record (00000)
Selects the lowest time history record to be printed.
Highest Record (>99999)
Selects the highest time history record to be printed.
System 814 User Manual
1/23/98
Summary Report Template
Histograms
SPL Histogram [No]
You can customize the SPL Histogram report by choosing the long or
short report.
Lowest Level (045)
Selects the lowest SPL histogram level to be printed.
Highest Level (095)
Selects the highest SPL histogram level to be printed.
Resolution (5.0)
Selects the SPL histogram resolution
Pk-1 Histogram [No]
You can customize the Peak1 Histogram report by choosing the long or
short report.
Lowest Level (110)
Selects the lowest Peak1 histogram level to be printed.
Highest Level (160)
Selects the highest Peak1 histogram level to be printed.
Resolution (5.0)
Selects the Peak1 histogram resolution
Pk-2 Histogram [No]
You can customize the Peak2 Histogram report by choosing the long or
short report.
Lowest Level (070)
Selects the lowest Peak2 histogram level to be printed.
Highest Level (120)
Selects the highest Peak2 histogram level to be printed.
Resolution (5.0)
Selects the Peak2 histogram resolution
Tailored Report
This template shows the default settings for the Tailored Report.The Tailored Report includes the Data
Report, the Log Report, the Setup Report, the Interval
Report and the History Report. After selecting the template you can modify it as explained in ÒPrinting a
Custom ReportÓ below.
Tailored Report Template
Report Settings
Lower Level
Report Settings
Description
Unformatted [No]
Data Report [Yes]
This shows general information such as Leq, SEL, Dose, Projected Dose,
Lmin, Lmax, Peak, LnÕs, exceedance, and calibration logs.
Log Report [Yes]
The run/stop log and with the date and time of each run/stop.
Setup Report [No]
Lists settings and their values on the 814.
1/23/98
Printing Reports from the 814
6-9
Tailored Report Template
SPL Histogram [No]
The 6 Ln values, Lmax, Lmin, and a bargraph of the level distribution.
Intv Report [Short]
Leq, SEL, Lmin, Lmax, Peak, Uwpk, exceedances, time, date, and duration in the short report. The Long reports adds the Ln values for the
Interval period.
Hist Report [Yes]
Leq for each time history period.
Print Range
Histograms
6-10
Intv Report [Short]
You can customize the interval report by choosing the long or short
report.
Lowest Record (00000)
Selects the lowest interval record to be printed.
Highest Record (65535)
Selects the highest interval record to be printed.
Hist Report [Yes]
You can customize the time history report by choosing the long or short
report.
Lowest Record (00000)
Selects the lowest time history record to be printed.
Highest Record (>99999)
Selects the highest time history record to be printed.
SPL Histogram [No]
You can customize the SPL Histogram report by choosing the long or
short report.
Lowest Level (040)
Selects the lowest SPL histogram level to be printed.
Highest Level (090)
Selects the highest SPL histogram level to be printed.
Resolution (5.0)
Selects the SPL histogram resolution
Pk-1 Histogram [No]
You can customize the Peak1 Histogram report by choosing the long or
short report.
Lowest Level (110)
Selects the lowest Peak1 histogram level to be printed.
Highest Level (140)
Selects the highest Peak1 histogram level to be printed.
Resolution (5.0)
Selects the Peak1 histogram resolution
Pk-2 Histogram [No]
You can customize the Peak2 Histogram report by choosing the long or
short report.
Lowest Level (070)
Selects the lowest Peak2 histogram level to be printed.
Highest Level (120)
Selects the highest Peak2 histogram level to be printed.
Resolution (5.0)
Selects the Peak2 histogram resolution
System 814 User Manual
1/23/98
All, Short Report
This template shows the default settings for the
All,Sort Report. The All,Short Report prints all of the
reports. Those reports with a Short version are printed
in the short form. After selecting the template you can
modify it as explained in ÒPrinting a Custom ReportÓ
below.
All,Short Report Template
Report Settings
Lower Level
Report Settings
Description
Unformatted [No]
Data Report [Yes]
This shows general information such as Leq, SEL, Dose, Projected Dose,
Lmin, Lmax, Peak, LnÕs, exceedance, and calibration logs.
Log Report [Yes]
The run/stop log and with the date and time of each run/stop.
Setup Report [Yes]
Lists settings and their values on the 814.
SPL Histogram [Yes]
The 6 Ln values, Lmax, Lmin, and a bargraph of the level distribution.
Intv Report [Short]
Leq, SEL, Lmin, Lmax, Peak, Uwpk, exceedances, time, date, and duration in the short report. The Long reports adds the Ln values for the
Interval period.
Hist Report [Yes]
Leq for each time history period.
Print Range
Histograms
1/23/98
Intv Report [Short]
You can customize the interval report by choosing the long or short
report.
Lowest Record (00000)
Selects the lowest interval record to be printed.
Highest Record (65535)
Selects the highest interval record to be printed.
Hist Report [Yes]
You can customize the time history report by choosing the long or short
report.
Lowest Record (00000)
Selects the lowest time history record to be printed.
Highest Record (>99999)
Selects the highest time history record to be printed.
SPL Histogram [Yes]
You can customize the SPL Histogram report by choosing the long or
short report.
Printing Reports from the 814
6-11
All,Short Report Template
Lowest Level (045)
Selects the lowest SPL histogram level to be printed.
Highest Level (095)
Selects the highest SPL histogram level to be printed.
Resolution (5.0)
Selects the SPL histogram resolution
Pk-1 Histogram [Yes]
You can customize the Peak1 Histogram report by choosing the long or
short report.
Lowest Level (110)
Selects the lowest Peak1 histogram level to be printed.
Highest Level (160)
Selects the highest Peak1 histogram level to be printed.
Resolution (5.0)
Selects the Peak1 histogram resolution
Pk-2 Histogram [Yes]
You can customize the Peak2 Histogram report by choosing the long or
short report.
Lowest Level (070)
Selects the lowest Peak2 histogram level to be printed.
Highest Level (120)
Selects the highest Peak2 histogram level to be printed.
Resolution (5.0)
Selects the Peak2 histogram resolution
All,Long Report
This template shows the default settings for the
All,Long Report. The All,Long Report prints all of the
reports. Those reports with a long version are printed
in the long form. After selecting the template you can
modify it as explained in ÒPrinting a Custom ReportÓ
below.
All,Long Report Template
Report Settings
Lower Level
Report Settings
Description
Unformatted [No]
Data Report [Yes]
This shows general information such as Leq, SEL, Dose, Projected Dose,
Lmin, Lmax, Peak, LnÕs, exceedance, and calibration logs.
Log Report [Yes]
The run/stop log and with the date and time of each run/stop.
Setup Report [Yes]
Lists settings and their values on the 814.
SPL Histogram [Yes]
The 6 Ln values, Lmax, Lmin, and a bargraph of the level distribution.
6-12
System 814 User Manual
1/23/98
All,Long Report Template
Intv Report [Long]
Leq, SEL, Lmin, Lmax, Peak, Uwpk, exceedances, time, date, and duration in the short report. The Long reports adds the Ln values for the Interval period.
Hist Report [Yes]
Leq for each time history period.
Print Range
Histograms
1/23/98
Intv Report [Long]
You can customize the interval report by choosing the long or short
report.
Lowest Record (00000)
Selects the lowest interval record to be printed.
Highest Record (65535)
Selects the highest interval record to be printed.
Hist Report [Yes]
You can customize the time history report by choosing the long or short
report.
Lowest Record (00000)
Selects the lowest time history record to be printed.
Highest Record (>99999)
Selects the highest time history record to be printed.
SPL Histogram [Yes]
You can customize the SPL Histogram report by choosing the long or
short report.
Lowest Level (045)
Selects the lowest SPL histogram level to be printed.
Highest Level (095)
Selects the highest SPL histogram level to be printed.
Resolution (1.0)
Selects the SPL histogram resolution
Pk-1 Histogram [Yes]
You can customize the Peak1 Histogram report by choosing the long or
short report.
Lowest Level (110)
Selects the lowest Peak1 histogram level to be printed.
Highest Level (140)
Selects the highest Peak1 histogram level to be printed.
Resolution (5.0)
Selects the Peak1 histogram resolution
Pk-2 Histogram [Yes]
You can customize the Peak2 Histogram report by choosing the long or
short report.
Lowest Level (070)
Selects the lowest Peak2 histogram level to be printed.
Highest Level (120)
Selects the highest Peak2 histogram level to be printed.
Resolution (1.0)
Selects the Peak2 histogram resolution
Printing Reports from the 814
6-13
None Enabled Report
When ÒNone EnableÓ is selected from the Recall Format menu then all of the reports are disabled and will
not be printed. This allows you greater ease in printing
only a selected number of reports. After selecting this
template you can modify it as explained in ÒPrinting a
Custom ReportÓ below.
None Enabled Report
Report Settings
Lower Level
Report Settings
Description
Unformatted [No]
Data Report [No]
This shows general information such as Leq, SEL, Dose, Projected Dose,
Lmin, Lmax, Peak, LnÕs, exceedance, and calibration logs.
Log Report [No]
The run/stop log and with the date and time of each run/stop.
Setup Report [No]
Lists settings and their values on the 814.
SPL HIstogram [No]
The 6 Ln values, Lmax, Lmin, and a bargraph of the level distribution.
Intv Report [No]
Leq, SEL, Lmin, Lmax, Peak, Uwpk, exceedances, time, date, and duration
in the short report. The Long reports adds the Ln values for the Interval
period.
Hist Report [No]
Leq for each time history period.
Print Range
Histograms
6-14
Intv Report [No]
You can customize the interval report by choosing the long or short report.
Lowest Record (00000)
Selects the lowest interval record to be printed.
Highest Record (65535)
Selects the highest interval record to be printed.
Hist Report [No]
You can customize the time history report by choosing the long or short
report.
Lowest Record (00000)
Selects the lowest time history record to be printed.
Highest Record (>99999)
Selects the highest time history record to be printed.
SPL Histogram [No]
You can customize the SPL Histogram report by choosing the long or
short report.
System 814 User Manual
1/23/98
None Enabled Report
Lowest Level (045)
Selects the lowest SPL histogram level to be printed.
Highest Level (095)
Selects the highest SPL histogram level to be printed.
Resolution (5.0)
Selects the SPL histogram resolution
Pk-1 Histogram [No]
You can customize the Peak1 Histogram report by choosing the long or
short report.
Lowest Level (110)
Selects the lowest Peak1 histogram level to be printed.
Highest Level (160)
Selects the highest Peak1 histogram level to be printed.
Resolution (5.0)
Selects the Peak1 histogram resolution
Pk-2 Histogram [No]
You can customize the Peak2 Histogram report by choosing the long or
short report.
Lowest Level (070)
Selects the lowest Peak2 histogram level to be printed.
Highest Level (120)
Selects the highest Peak2 histogram level to be printed.
Resolution (5.0)
Selects the Peak2 histogram resolution
Printing a Custom Report
In addition to being able to print your own pre-established reports for data taken with you instruments,
you can also further customize your report deÞnitions
at print time with the Print menuÕs Customize option.
The following provides an example of printing a customized report:
Step 1 Press P key to bring up the Print menu.
1/23/98
Printing Reports from the 814
6-15
Step 2 Use the u and d arrow keys to highlight
the Customize item, then select it using the
r arrow key or the c Check key. The following screen appears:
Step 3 Use the u and d arrow keys to scroll
through available report settings. Use the c
Check key to select the settings that you want
to modify, then make the modiÞcations.
For your report to print properly
your printer must be properly connected and conÞgured as discussed
in the ÒPrinting Normal SLM
ReportsÓsection.
Step 4 Use the l arrow key to completely back
out of the Customize menu screen, then use
the u and d arrow keys highlight the
Print t item, then select it using the r
arrow key or the c Check key. Your Customized report will now print.
Printing Simple SSM Reports
Step 1 Press the D Data key and use the Data Files
menu to recall the Simple SSM measurement
record that you want to print.
Depending on whether you have
selected Normal SLM, Simple SSM,
or Octave OBA from the Setup
menu you will have a different Print
menu available.
6-16
Step 2 To print the data Þle press the P Print key.
The following screen appears:
System 814 User Manual
1/23/98
The following table shows the options for the
Simple SSM Report menu:
Status
Options
Settings
Printer Type
Printer Baud
Flow Control
SPL Report
[Prints the Simple SLM report
which includes Lmin, Lmax, Pk1, Pk-2, Leq, SEL, time, date, and
the runtime.]
Snapshots
[Prints the Leq, SEL, Lmin,
Lmax, Pk-1, Pk-2 at the speciÞc
point in time.]
Printing Octave OBA Reports
Depending on whether you have
selected Normal SLM, Simple SSM,
or Octave OBA from the Setup
menu you will have a different Print
menu available.
1/23/98
Step 1 Press the D Data key and use the Data Files
menu to recall the Octave OBA measurement
record that you want to print.
Step 2 To print the data Þle press the P Print key.
The following screen appears:
Printing Reports from the 814
6-17
The following table shows the options for the Simple
SSM Report menu:
6-18
Status
Options
Settings
Printer Type
Printer Baud
Flow Control
OBA Summary
[Prints the overall and current
spectra for the amount of time
the instrument was run. A level
and a bargraph is displayed for
each Þlter frequency. It also
shows the Run/Stop log.]
OBA Report
[Prints a Summary report and
the Interval report.]
System 814 User Manual
1/23/98
CHAPTER
7
Using the 814 Utility Software
You use the 814 utility software that comes with the
System 814 to create and edit 814 setups, download
measurements from the 814 and store the measurement to a Þle. You can then translate and export the
downloaded measurement Þles to either a text Þle, or a
Þle that can be used and analyzed using a spreadsheet
program.
814 Utility software requires 814 Þrmware version
1.011 or greater. The 814 must be set to communicate at
9600 baud.
Connecting the 814 to Your Computer
To connect the 814 to a computer, use the CBL006
cable. The round 8-pin connector connects into the
Serial port of the 814 and the 9-pin connector connects
to the serial port of your computer.
1/21/98
Using the 814 Utility Software
7-1
814 Utility Installation
To install the 814 Utility software package place the
disk labeled Òdisk 1Ó into the ßoppy drive. From
Windows 95 press START and then select the RUN
menu item. A prompt will appear to enter the program
name. Enter ÒA:\SETUP.EXEÓ.
The 814 utility software will automatically begin the
installation process. The installer program will prompt
you through the installation. A prompt will appear
asking to place disk 2 into the ßoppy drive. Place the
Òdisk 2Ó into the ßoppy drive. A message will appear
indicating that the software was successfully installed.
Starting the 814 Utility Software
To start the 814 Utility software in Windows 95, press
START and then select the Programs/Larson-Davis/
814Util submenu item.
7-2
System 814 User Manual
1/21/98
814 Setups
Setups stored in the 814 can be retrieved by clicking on
the Get Setup button on the tool bar or by selecting Get
Setups From 814 from the File Menu.
Setups will be retrieved from the 814 and will be displayed in the Select Setup listbox.
1/21/98
Using the 814 Utility Software
7-3
Selecting the Setup tab displays the Connect window
to establish communication with the 814, so that setups
can be retrieved from the 814.
In the list of setup Þles, the system setup is the Þrst
setup followed by all of the permanent and userdeÞned setups. Highlighting one of the setups in the
list, displays all of the available settings on the right
side of the window. The setups are organized and
grouped similar to the 814 menu structure in the
instrument.
Modifying and Uploading Setups to the 814
With the 814 Utility software you can make modiÞcations to any the setup settings. For example, in the System screen shown above, you could change any of the
parameters for the Title, Calib, Power, Date/Time or
Controls and then send the modiÞed setup to the 814.
7-4
System 814 User Manual
1/21/98
To upload the modiÞed setup, you select the Save
Setup to 814 menu item from the File menu or click on
the Upload button on the tool bar.
Saving Setups to Disk Files
You can also store the setup to a disk Þle by selecting
the Save Setup to a File menu item from the File menu
or by clicking on the Save to File button on the tool bar.
Note that the system setup can be modiÞed and stored
back into the 814, but cannot be saved to a disk Þle.
When saving a setup to a disk Þle, each setup requires
a different Þlename. There is one Þle per saved setup.
Sound Level Meter setup names should be followed by
the .slm extension. Simple Sound Level Meter setup
names should be followed by the .ssm extension.
Octave Band Analyzer setup names should be followed by the .oba extension.
1/21/98
Using the 814 Utility Software
7-5
Opening Setup Disk Files
To open a setup disk Þle select the Open Setup File
menu item from the File menu or click on the Open
File button on the tool bar.
The setup appears in the Select Setup list. You can then
select (highlight) the setup in the list. The highlighted
setup can then be sent to the 814 by selecting the Save
Setup to 814 menu item from the File menu.
Other menu items available in the Setup Menu,
include renaming, locking, unlocking, deleting, or
making the selected setup the active setup(?). You can
also access these menu items by pressing the right
mouse button while within the Select Setup list box.
The Setup Menu items will appear enabled or disabled
depending on the setup selected. For example, it isnÕt
possible to delete a permanent 814 setup, so the Delete
Setup menu item will be disabled if a permanent 814
setup is selected.
7-6
System 814 User Manual
1/21/98
Creating a New Setup
You create new setups by selecting the New Setup
menu item from the File menu or by selecting the New
Setup button on the tool bar.
A dialog box will be displayed to allow the type of the
new setup to be selected, (SLM, SSM, OBA). After creating a new setup, you can store it to a disk Þle, or send
it to the 814.
Downloading Measurement Data
To display measurement data stored in the 814, select
Download View from the View menu or hit the Download View button from the tool bar. All stored measurement information is retrieved from the 814 and
displayed in the Download View window.
1/21/98
Using the 814 Utility Software
7-7
The Þrst entry in the Measurement list box displays
information about the current 814 measurement. Following the current measure is a list of all other measurements stored in the 814. To download a
measurement, highlight the measurement in the Measurement list box and click the Download button. The
data is saved to a binary Þle.
The resulting binary download Þle must be translated
by the 814 utility software to be viewable. A download
Þle should be stored with the Þle extension slmdl
(Sound Level Meter Down-load). The Download window displays 3 note Þelds associated with the measurement.
The default directory and Þlename show the location
and Þlename that the measurement data will be saved
to. This directory and Þlename can be changed before
the Download button is pressed. If the directory and
Þlename already exist, and the Download button is
pressed, you will be prompted asking whether to overwrite the Þle or cancel. At that point you could select a
different Þlename that is not in use.
7-8
System 814 User Manual
1/21/98
Translating Measurement Data from a Downloaded File
Selecting ÒTranslate ViewÓ from the View Menu or
pressing the Translate button on the tool bar will display the Translation View.
You use the Translate view to select a downloaded Þle
with the Þle extension .slmdl to translate and view the
Þle on the screen, or to print the Þle. The default path
for the downloaded Þles is
C:\program Þles\LarsonDavis\814Utility.
1/21/98
Using the 814 Utility Software
7-9
Viewing a Translated File Within a Spreadsheet Program
To view the translated data with a spreadsheet program, select the View Data in Spreadsheet menu item
from the File menu or the Translate button on the tool
bar.
When you select the View Data in Spreadsheet menu
item, the 814 utility program will attempt to launch the
program associated with the Ò.csvÓ Þle extension. If
you have installed a spreadsheet program, your Window¨ system will most likely have this Þle type linked
to a spreadsheet program.
You can export and/or save the translated data to a
Þle, by selecting the Export Data menu item from the
File menu.
7-10
System 814 User Manual
1/21/98
APPENDIX
A
System Layout
The System 814 is a complex instrument containing
many settings and displays, which allows you to take
full advantage of the instrument in many different situations. The purpose of this appendix is to help you
quickly navigate through these settings and displays
by laying out a diagram that is quick and easy to read.
The following two sections will be covered:
¥ System Menus
¥ System Displays
System Menus
This section lays-out the sections, menu items, and settings of the following instruments:
¥ Octave Band Analyzer
¥ Simple Sound Level Meter
¥ Logging Sound Level System Menus
2/27/98
A-1
Octave Band Analyzer
A-2
Menu Item
Setting
Title
Title
OBA ScanMode
Manual
Auto
Timed
OBA ProÞle
Normal
Short
Long
Custom
OBA Bandwidth
1/1
1/3
Range
Normal
Transducer
Condnsr
Electret
Direct
Intv Enable
No
Yes
Intv Period
(hh:mm:ss)
Intv Time Sync
(Time Sync)
No
Yes
Intv Auto Stop
(Auto Stop)
No
Yes
AC Out Weight
Flat
Wght
System 814 User Manual
2/27/98
Simple Sound Level Meter
2/27/98
Section
Menu Items
Available Settings Options
SLM
Detector
Slow
Fast
Impl
Weighting
A
C
FLT
OCT
1/3
Range
Normal
Low
High
Transducer
Condnsr
Elctret
Direct
Pk-1 Weighting
Flat
C
Current
Exchange
3dB
4dB
5dB
6dB
Current Threshold
(0)dB - (255) dB
A -3
Simple Sound Level Meter (cont.)
Controls
A-4
AC Out Filter
Flat
Wght
Logic-In Mode
None
Pause
Toggle
Level
Alarm
Output 1 Logic
Off
RMS
Peak
R+P
Intv
R+I
P+I
R+P+I
A:D
R+A
P+A
R+P+A
I+A
R+I+A
P+I+A
R+P+I+A
R/S
Excd
Output 1 Timer
0 ~ 255 sec
System 814 User Manual
2/27/98
Logging SLM System Menus
Section
Menu Items
Title
SLM
Available Settings Options
Title
Detector
Slow
Fast
Impl
Weighting
A
C
FLT
OCT
1/3
Range
Normal
Low
High
Transducer
Condnsr
Elctret
Direct
Pk-1 Weighting
Flat
C
OBA Filter
Filter #
(Logging Sound Level Meter continued on next page)
2/27/98
A -5
Logging SLM System Menus (cont.)
TWA
Ln
Triggering
Ovll Exchange
3dB
4dB
5dB
6dB
Ovll Threshold
0 to 255 dB
Ovll Criterion
0 to 255 dB
Criterion Time
0 to 99 hours
Crnt Exchange
3dB
4dB
5dB
6dB
Crnt Threshold
0 to 255 dB
Crnt Criterion
0 to 255 dB
Lnn 1 Percent
.01 to 99.9
Lnn 2 Percent
.01 to 99.9
Lnn 3 Percent
.01 to 99.9
Lnn 4 Percent
.01 to 99.9
Lnn 5 Percent
.01 to 99.9
Lnn 6 Percent
.01 to 99.9
SPL Excd Lvl 1
0.0 to 255.9 dB
SPL Excd Lvl 2
0.0 to 255.9 dB
Pk-1 Excd Lvl
0.0 to 255.9 dB
Pk-2 Excd Lvl
0.0 to 255.9 dB
Hysteresis
0 to 9 dB
(Logging Sound Level Meter continued on next page)
A-6
System 814 User Manual
2/27/98
Logging SLM System Menus (cont.)
Time History
Intervals
Hist Enable
No
Yes
Hist Period
1 to 255
Period Units
1/32s
1.0s
10.0s
60.0s
Other Level
No
Pk-II
Pk-I
Lmax
Resolution
0.1dB
1.0dB
Intv Enable
No
Yes
Intv Period
hh:mm:ss
Intv Time Sync
No
Yes
Intv Save LnÕs
No
Yes
Intv Auto Stop
No
Yes
Intv Threshold
0 to 255
Intv Exchange
3dB
4dB
5dB
6dB
(Logging Sound Level Meter continued on next page)
2/27/98
A -7
Logging SLM System Menus (cont.)
DeÞne Report
Data Report
No
Yes
SPL Histogram
No
Yes
Pk-1 Histogram
No
Yes
Pk-2 Histogram
No
Yes
Intv Report
No
Short
Long
Hist Report
No
Yes
(Logging Sound Level Meter continued on next page)
A-8
System 814 User Manual
2/27/98
Logging SLM System Menus (cont.)
Controls
2/27/98
AC Out Filter
Flat
Wght
Logic-In Mode
None
Pause
Toggle
Level
Alarm
Output 1 Logic
Off
RMS
Peak
R+P
Intv
R+I
P+I
R+P+I
A:D
R+A
P+A
R+P+A
I+A
R+I+A
P+I+A
R+P+I+A
R/S
Excd
Output 1 Timer
0 sec ~ 255 sec
A -9
System Displays
The System 814 has many displays that allows you to
take full advantage of the instrument. This section covers the following displays:
¥ Octave Band Analyzer
¥ Simple Sound Level Meter
¥ Logging Sound Level Meter
The following displays are setup in a manner that is
similar to that of the instrument. Displays can be
change from one to another by using the arrow keys
(u,d,l,r).
Octave Band Analyzer
The Octave Band Analyses contains the following
three screens:
A-10
System 814 User Manual
2/27/98
Simple Sound Level Meter
The Simple Sound Level Meter contains the following
screen:
Logging Sound Level Meter
The Logging Sound Level Meter contains 18 screens.
The following 2 charts show how to access each of the
available screens. You use the l and d keys to
change to screens shown along rows and u and d
to change to screens shown on the rows above or
below the one being displayed.
2/27/98
A -11
A-12
System 814 User Manual
2/27/98
Statistics
Ln Data
Exposure
Overall Data
Current Data
2/27/98
A -13
Run Log
Interval Data; u and d move between Intervals
Time History; s, r, u, and d move cursor
LDL Function
A-14
System 814 User Manual
2/27/98
APPENDIX
B
Integrated Level Calculations
Basic Integrated Level Calculations
The Larson¥Davis System 814 calculates all of its integrated levels based on equations of IEC standard 804.
IEC-804 Section 3.3 deÞnes Leq as follows:
Equivalent continuous A-weighted sound pressure level
(also average A-weighted sound pressure level) is
deÞned as follows
L Aeq,T
t2
1 2
2
= 10lg --- ∫ p A ( t )dt ÷ p 0 dB
T
t
1
where:
LAeq,T is the equivalent continuous A-weighted sound
pressure level re 20 µPa, determined over a time interval T=t2-t1
pA(t) is the instantaneous A-weighted sound pressure
of the sound signal
p0 is the reference sound pressure of 20 µPa
When, optionally, a frequency weighting other than A
is used, the frequency weighting used shall be
included explicitly in the title and the formula of the
quantity, for example equivalent continuous Cweighted sound pressure level:
1/21/98
B-1
L Ceq,T
t2
1 2
2
= 10lg --- p C ( t )dt ÷ p 0 dB
T t
1
∫
If no frequency weighting is used, the quantity is simply called equivalent continuous sound pressure level.
The Larson¥Davis System 814 calculates many timeintegrated levels or time-weighted averages (TWA)
based on different parameters and time intervals. They
are all designed and programmed to perform the equation speciÞed in IEC 804 (above) with allowances for
the following:
A, C and Flat frequency weighting characteristics
Various interval times, both Þxed interval TWAs and
variable interval event TWAs
Exchange-rates, or Òdoubling ratesÓ can be entered
that effect certain TWA measurements
Certain TWA measurements include a programmable
threshold with only levels above this threshold contributing to the measurement
The titles for the measurements are designed to indicate the current exchange rate in force: ÒLeqÓ is used to
designate TWAs based upon a 3dB exchange rate,
ÒLDODÓ (for United States Department of Defence) is
used to designate TWAs based upon a 4dB exchange
rate, ÒLOSHAÓ (for the United States Occupational
Safety and Health Association) is used to designate
TWAs based upon a 5dB exchange rate, ÒLAvgÓ (for
average) is used to designate TWAs based upon a 6dB
exchange rate.
No attempt is made to meet the IEC-804 requirement
to title the TWA by frequency weighting and time
interval within the analyzerÕs display or report system.
It is represented though, by placing the weighting desB-2
System 814 User Manual
1/21/98
ignation following the ÒdBÓ units indication associated with the numerical output. The actual
measurement time is also provided for each TWA
value to fulÞl the time interval description requirements.
For example, the System 814Õs ∫SLM Overall-a display
shows the current SPL (Sound Pressure Level) in 1/
10th decibel (dB) resolution. The actual real-time resolution is 1/32nd dB. The displayed SPL It is followed
by the text ÒdBÓ and then the frequency weighting in
effectÑset to A in this example.
Scrolling SPL history
Current SPL while running or at the time a
stop occurred
The currently-selected frequency weighting for SPL
The currently-selected detector
Elapsed measurement time, shown as
mm:ss.ss, hh:mm:ss or hhhhh:mm
The System 814Õs ∫SLM Overall-e display shows the
overall measurement period and TWA. In this case the
measurement is Leq (because of the 3dB exchange
rate). The quantity is A-weighted and has a measurement elapsed time of 599:43:25.4 (599 hours, 43 minutes, and 25.4 seconds).
Overall time weighted average (Leq in this
case)
Time-weighted average (TWA) descriptor
for the overall measurement
Overall exchange rate
Overall sound exposure level (SEL)
Elapsed measurement time, shown as
mm:ss.ss, hh:mm:ss or hhhhh:mm
1/21/98
B -3
The actual equations used within the analyzers are
based on that for IEC-804 and are implemented according to this equation:
n
L TWA
L( s )
-------k
= L cal + k • log
10 – log ( n )
s = 1
∑
where:
L(s) is the current SPL at sample s (for measurements
that include a threshold, L(s) is set to -∞ if L(s) is less
than the Threshold Level Lt)
k is the exchange rate constant which is equal to:
10.00 for an exchange rate of 3dB (Leq, or ≈ 3dB/log(2))
13.29 for an exchange rate of 4dB (LDOD, or = 4dB/
log(2))
16.61 for an exchange rate of 5dB (LOSHA, or = 5dB/
log(2)
20.00 for an exchange rate of 6dB (LAvg, or ≈ 6dB/
log(2)),
n is the total number of samples taken in the measurement; the sample rate is 32 samples per second, and
Lcal is the calibration offset that corrects for various
sensitivities of microphones
Accuracy is maintained by having large Þxed point
variables for the number of samples and the summation accumulator. The limit of s is 4,294,967,295 samples and is stored in a 32 bit integer variable within the
System 814. This limit is greater than 1553 days or
greater than 4 years and 4 months. The value that can
be stored in the summation accumulator, a 96 bit integer, can be the overload level (maximum allowable signal amplitude into the System 814) for the maximum
B-4
System 814 User Manual
1/21/98
number of samples. Using large Þxed point variables
prevents the inaccuracies obtained in systems based
upon ßoating point variables.
The following data indicates which settings are associated with which TWA data variables:
1/21/98
B -5
Variable Name
Locationa
Settings
OverAll Lint or TWA (Lint =
Integrated Level)
SLM-a, SLM-b, DOSE-a (TWA)
Data Report: Overall
IO Command: R9
Overall Runtime: R5
Title Text: R10
#48, Overall Exchange Rate
#49, Overall Threshold
Overall TWA is reset only by a RES-ALL key or the S1,1 IO Command.
Current Lint or TWA
SLM-a, SLM-b, DOSE-a (SLM win- #45, Current Exchange Rate
#46, Current Threshold
dow #3)
Data Report: Current
IO Command: R11
Current Runtime: R7
Title Text: R12
Current TWA is reset by the RESET key or the M7 IO Command.
Overall Leq
NOISE-a (LEQ)
Data Report: Overall Leq IO Command: R57
Overall Runtime: R5
Always 3dB Exchange Rate
No Threshold
Overall Leq is reset only by a RES-ALL key or the S1,1 IO Command.
Daily Leq
NOISE-a (not displayed on LCD)
Data Report: Daily Leq
IO Command: R58
Daily Runtime: unavailable
Always 3dB Exchange Rate
No Threshold
Reset when a new day begins or the RES-ALL key or the S1,1 IO Command.
Hourly Leq
NOISE-a (not displayed on LCD)
See Daily History HNL
IO Command: R59
Daily Runtime: unavailable
Always 3dB Exchange Rate
No Threshold
Reset at the end of the current hour or a RES-ALL.
Exceedance History TWA
EXCD-a (EXCD-c)
Exceedance Report
IO Command: E3
Event Duration: E2
#67, EXCD Exchange Rate
#61, RMS Excd Level 1
Exceedance Leq
NOISE-b (LDN-b)
Data Report: Excd Leq
IO Command: R68
Total Excd Time: R69
#67, EXCD Exchange Rate
#61, RMS Excd Level 1
Reset by RES-ALL key or S1,1 IO Command. Includes only qualiÞed Exceedances for which an EXCD
record is stored in the EXCD history.
Background Leq
NOISE-b (LDN-b)
Data Report: BkGnd Leq
IO Command: R70
Background Time: R156
#67, EXCD Exchange Rate
Reset by RES-ALL key or S1,1 IO Command. This value is the Overall Leq less Exceedance Leq. It will be
incorrect if setting 67 is not set to 3dB.
Interval Leq
INTV-a (INTV-c)
INTV Report
IO Command: I3
Interval Duration: I2
#73, INTV Exchange Rate
#74, INTV Threshold
#75, INTV Period (hh:mm)
Logged into interval history record at end of measurement interval (can be programmed from 1 second to
99 hours 59 minutes).
History Leq
B-6
History Report (HIST)
IO Command: H1
Time as set by #83 & 84
System 814 User Manual
Always 3dB Exchange Rate
No Threshold
#83, History Period
#84, History Period Units
1/21/98
Variable Name
Locationa
Settings
Logged into time history record at end of measurement interval (can be programmed for periods from 1/
32nd of a second to 255 minutes).
a. The display title within parenthesis () indicates the Model 820 display location.
SEL Calculations
SEL is available for both the overall and current measurements and is calculated using this formula:
n
L TWA
L( s )
-------k
= L cal + k • log
10 – log ( 32 )
s = 1
∑
Since the sample rate is 32 samples per second and SEL
is based on time in seconds, the log(32) is subtracted
from the log of the accumulation to perform a division
by 32. All of the SEL energy values in the analyzers utilize the Threshold and Exchange Rate settings. Care
should be taken when modifying these settings since
some standards or governments require SEL to be
taken without a Threshold (set it to zero) and with an
Exchange Rate of 3dB.
Dose and Projected Dose Calculations
Dose is a measure of Sound Exposure and is deÞned in
ANSI S1.25 Section 4.7 as:
T
L – Lc
-------------q -
100
D ( Q ) = --------- ⋅ 10
dt
Tc
∫
0
where:
D(Q) is the percentage criterion exposure for exchange
rate Q
TC is the criterion sound duration = 8 hours
1/21/98
B -7
T is the measurement duration in hours
t is the time in hours
L is the SLOW, (or FAST) A-weighted sound level, a
function of time, when the sound level is greater than
or equal to L, or equals -∞ when the A-weighted sound
level is less than Lt
Lt is the threshold sound level speciÞed by the manufacturer
LC is the criterion sound level speciÞed by the manufacturer
Q is the exchange rate in dB, and q = the parameter
that determines the exchange rate, where:
q = 10 for a 3dB exchange rate
q = 5/log(2) for a 5dB exchange rate
q = 4/log(2) for a 4dB exchange rate
The factor of 100 in the equation produces a result that
is a percentage.
Dose is obtained from the accumulations made for
TWA and SEL using the formula:
where,
L(s) is the current SPL at sample s; for measurements
that include a threshold L(s) is set to ∞ if L(s) is less
than the Threshold Level Lt
n
∑
DOSE = 10
L
(s)
L
---------k
log
10 – -----c – log ( T c 115200 ) + log ( 100 )
k
s = 1
%
k is the exchange rate constant which is equal to:
B-8
System 814 User Manual
1/21/98
10.00 for an exchange rate of 3dB (Leq, or ≈ 3dB/log(2))
13.29 for an exchange rate of 4dB (LDOD, or = 4dB/
log(2))
16.61 for an exchange rate of 5dB (LOSHA, or = 5dB/
log(2))
20.00 for an exchange rate of 6dB (LAvg, or ≈ 6dB/
log(2)),
n is the total number of samples taken in the measurement; the sample rate is 32 samples per second,
TC is the criterion sound duration as set by the System
814Õs ÒCriterion Time HoursÓ setting which by default
is set to 8 hours (since the time base for the instrument
is 1/32nd samples per second, the number of hours is
multiplied by 115200 to make samples per hourÑ60
minutes/hour times 60 seconds/minute times 32 samples/sec equals 115200 samples/second)
LC is the criterion sound level as set by the System
814Õs ÒOverall CriterionÓ or ÒCurrent CriterionÓ settings
Addition of the term Òlog(100)Ó was used to implement the 100 multiplier of the ANSI equation that creates the percentage. Subtracting the log of the Criterion
Time was used to implement the division of Criterion
Time of the ANSI equation.
Projected Dose in the analyzers is obtained with an
equation similar to that of Dose except that the actual
duration (time) of the measurement is used rather than
a Criterion Time, as thus:
n
PROJDOSE = 10
L
( s )
L
---------k
log
10 – -----C- – log ( n ) + log ( 100 )
k
s = 1
∑
%
where the log(n) is the actual time factor, n being the
total number of samples taken.
1/21/98
B -9
B-10
System 814 User Manual
1/21/98
APPENDIX
C
Serial Port Interface Remote
Control
The Model 814 is fully controllable remotely via Serial
Port interface. Settings and operational mode can be
altered. Data can also be downloaded to and settings
queried and set by the controlling computer.
The Model 814 may be connected to the computer
directly or through a modem. A network of many
instruments can be formed, all controlled by one computer by using the address-ability mode.
This chapter will describe the Serial Port interfacing of
the Model 814 and the various interface commands
with their syntax. Modem control is also covered.
These commands are similar to the Larson¥Davis
Model 870 commands. Those familiar with the Model
870 or 820 family sound level meters will Þnd the 814
commands very similar.
1/23/98
C-1
Interface Cables
Serial Port communications are made through the 8pin connector at the base of the Model 814. The instrumentÕs signals conform to the RS-422 standard and are
compatible with RS-232C. The cables use the same pin
out and connectors as Apple¨ Macintosh¨ computers.
CBL006
Computer cable
CBL002
CBL003
CBL00?
HP LaserJet 9 pin cable
Step 1 With the instrument turned off, insert the
cable connector in the 5-pin port.
Step 2 Connect the cable to the of the computer,
using the supplied 9-25 pin adapter if necessary.
Baud rate, Serial Port address and
handshaking protocol are selected
using settings 9, 10 and 12.
Signal 5-Pin conÞgurations for the INT002 follow:
Type
814 8-pin Connector End
HSO Pin 1 Handshake Out
O
RS-232
HSI
Pin 2 Handshake In
O
RS-232
Pin 3 Transmitted Data (-)
Pin 4 Ground
Pin 5 Received Data (-)
Pin 6 Transmitted Data (+)
Pin 7 Com. Extra Input
Pin 8 Received Data (+)
O
X
I
O
I
I
RS-422
RS-422
RS-422
RS-422
RS-232
RS-422
TXDGND
RXDTXD+
CXI
RXD+
C-2
Computer 9-pin RS-232C
Type
Connector End
DSR Pin 6 DataSet Ready
I
CTS Pin 8 Clear to Send
I
CD
Pin 1 Carrier Detect
I
DTR Pin 4 Data Terminal Ready O
RD
Pin 2 Receive Data
I
GND Pin 5 Ground
X
SD
Pin 3 Send Data
O
No connection
No connection
GND Pin 5 Ground
X
System 814 User Manual
1/23/98
Daisy Chain Addressing
The following instruments are compatible on a common network: Models 712, 720, 812, 814, 824, 870, and
TAC100. Future instruments may
also be compatible with this network.
A network of instruments may be interconnected to
one computer using the appropriate cabling, such as
the CBL040, and each may be controlled individually.
Each is given a unique address (setting or item 10). By
default, all 814s are given an address based on their
serial number from 1 to 100. Serial numbers that end
with two zeros will be addressed as 100. The addresses
are sent as a single byte ranging in value from 128 to
228 representing address 1 to 100 respectively (address
plus 128), while addresses 101 through 127 are
reserved. At power-on all 814s are address enabled (as
if they had received 127).Whenever an address byte is
received only the corresponding instrument is enabled
to receive and respond to commands.
A broadcast command can be sent. By sending an
address of zero, CHR$(128), all units on the chain will
become addressed and accept the commands that follow. Only the device with an address of 1 will respond
to the commands if data transfer is required. This will
allow all units to be started at the same moment, or to
have the same setting sent to all devices with one command, i.e. set all clocks to the same time.
These devices cannot be just paralleled together. That
would short outputs together and damage the instruments. Use the designated cables.
814 Network, Addressing Commands
The addressing of multiple 814s on a RS-422 network
has been enhanced so as to allow binary data blocks to
be sent to the 814 (and not be interpreted as an
address), to automatically identify all 814s on the network, and to control the baud rate from the computer
more easily. The command details follow:
1/23/98
C -3
Command
Description
0
Address 0 ($80) will enable addressing of all 814s on the net in a broadcast receive mode.
Only the 814 with address 1 will respond; all will receive the command.
127
Address 127 ($FF) will enable all 814s to receive and respond to commands; in other words it
will disable the addressing feature of all 814s on the net. Useful when only one device is connected.
126
Address 126 ($FE) will disable all 814s and none will respond to commands received. This is
useful when trying to communicate with one device on the net that has addressing disabled
by having its address set to zero.
125
Address 125 ($FD) will lock the current addressing of all 814s on the net so that binary setting
data may be sent to the currently addressed 814. To cancel the lock so that addressing may be
changed a <break> is sent.
124
Address 124 ($FC) will initiate an Auto-IdentiÞcation of all 814s on the net using a timing
scheme based on each unit's address. The data received will be the address byte from every
device on the net delayed by 10mS times the address; thus it will take a maximum of 1 second
to receive the byte from unit 100.
<break>
A short break will cancel the addressing lock initiated with the 125 address command, so that
addressing may be changed.
<break><break
>
Two breaks in a row will re-initialize the I/O and Printer tasks and the clear the data and command buffers. It will also address all instruments (Þrst command should be an address).
<break><break
><break>
Three breaks in a row will cause all 814s on the network to temporarily change to 9600 baud to
ensure that all devices on the net can be communicated with. Note: The baud rate is not
changed if in modem mode and connected. These should be ÒLongÓ breaks to accommodate a
unit set at 300 bps.
Commands
The commands are a series of ASCII characters with an
alpha command and one or two numeric operands followed by a charge return, ASCII 13. The commands
may be spelled out though only the Þrst character is
signiÞcant. i.e. READ 123 may be abbreviated to R123.
Every command has a response to acknowledge that it
was received correctly and to provide data requested.
For high reliability systems there is an error-checking
protocol that is added to ensure proper command data
transferal. See Error Checking Protocol on page 34.
C-4
System 814 User Manual
1/23/98
The following tables summarize all of the commands
and are listed in this order: mode control commands
Þrst, setting commands next, data extraction command
and report/data download command last.
[.] Square brackets indicate optional characters or operands.
Syntax
Response
R[ead] variable_number 0, operand_2]
variable_value
S[et] setting_number, setting_value
acknowledge
S[et] setting_number, Þxed_setting_option
acknowledge
S[et] setting_number; Þxed_setting_prompt
acknowledge i.e. ÒSet 8; [Thu]Ó will set day of week to
Thursday
Q[uery] setting_number 0, option_ßags]
setting_value
Option ßags may be added for combined effect.
32-Option Number
8-Tab over response
2-print in braces
1-Print setting name
K[ey] key_simulation_string
acknowledge
M[ode] mode_number
acknowledge
History Oriented Commands
Histories are records of stored data for a sampling
based on time or a particular event. One record is
available at a time. The current record number is
selected by using the Advance, Backup, and Find commands (see below) or the settings???? Each history is
assigned a number (history_number) so that it can be
identiÞed explicitly with the Advance, Backup, and
Find commands and it is shown in the Þrst column in
the section below.
1/23/98
C -5
1
E[xceedance] variable_number [,relative_rec#]
variable_value
Env Option Only
1
E[xceedance] variable_number [,time_hist_num]
variable_value
Env Option Only
2
I[nterval] variable_number [,relative_rec#]
variable_value
3
D[aily] variable_number [,hour_num]
variable_value
4
L[og] variable_number [,relative_rec0,
variable_value
5
C[alibration] variable_number
variable_value
6
&F[iles] variable number [,relative_rec#]
variable_value
7
H[istory] variable_number [,relative_rec#]
variable_value
SLM, ENV instruments only
8
T[ables] variable_number [, table]
variable_value
SLM, ENV instruments only
A[dvance] range [,history_number]
acknowledge
advances one record in the
history
B[ackup] range [,history_number]
acknowledge
backups one record in the history
F[ind] record_number [,history_number]
acknowledge
Þnd the indicated history
number
Locating History Records
C-6
Env Option Only
The Find command is the primary method of locating
a history record for random (non-sequential) access.
For example, to Þnd the one hundred twenty-Þfth
Exceedance record send the command F125,1 the [,1]
speciÞes that it is an exceedance record to be found as
deÞned in the Òhistory_numberÓ column above. The
Advance and Backup commands are generally used
next to extract data after the initial Þnd command. The
Þnd command takes longer to execute as the record
number increases in size, therefore, for sequential data
extraction locate the Þrst desired record with the Find
command and then use the Advance command. The
[,relative_rec#] option can be used to retrieve data forward or back from the current record number without
changing that record number; it is a signed 8-bit value,
i.e. 1 to 127 is positive while 128 to 255 is -128 to -1
respectively. Refer to the settings 211 through 216 to
query the current record number. Setting these settings
to a desired record number is an alternate form of the
Þnd command.
System 814 User Manual
1/23/98
Control Oriented Commands
K[ey] <key_simulation_string
acknowledge
M[ode] mode_number
acknowledge
P[rint] report_number
acknowledge
X operand_1
acknowledge
initiate XMODEM download,
or 814 Xfer
Remote Control Commands (Detailed)
Mode Commands
Format for the Mode Commands is:
Command
Description
M1
Power On (clear error message list and reset display functions to ÒÐaÓ windows)
M2
Power Off (cease sending further commands or the 814 will power back on)
M3
Run (begin to accumulating data)
M4
Stop (stop accumulating data)
M5
View (view the current Sound Pressure Level without accumulating data)
M6
Mark (place a marker in the Time History to indicate some event occurred
M 7,0
Current Reset (Resets only the current SLM function)
M 7,1
Overall Reset (Resets only the Current and Overall SLM function and histories [synonym of S1,1
Reset-All command])
M 7,2
Purge All (Resets ALL data and erases ALL data Þles [To purge, error checking must be on; the
checksum for M7,2 is ÒbÓ; therefore, the complete purge command is M7,2b (watch the case!)])
M7
Reset Current Data (instantly resets the current data set)
M8
Reset Histories Only (clears all histories and places a RESET (to I/O channel only))
M 9,1
Enable High Resolution Levels (nnn.nn for all sound level data (to I/O channel only))
1/23/98
C -7
M 10
Lock 814 (leaves 814Õs power on)
M 11
Lock 814 and Power Off (cease sending further commands)
M 12
Disconnect Modem (terminate connection and hang up)
M 13
Extend Modem Connect Time-out (can be set up to 255 seconds and allows time for modem
diagnostics)
M1000
Test RAM (non-destructive walking bit test; data left intact)
M1001
Test RAM (destructive pattern Þll & test, setup recalled from EEPROM)
M2222
Store current setup to EEPROM (Response (ÒStored!Ó) takes ~20 seconds)
@
Enable I/O Error Check Scheme (documentation available on request. S205,0F or 2 to 3 <CR> in
a row will disable Error Checking)
.
Scan for Filter options (use M2222 afterward to make it permanent. See R1,1 command to read
current options.)
“Read” Command (Reads out data variables)
The various read commands are detailed in the following tables. The tables list the variable number, the variable name, a description, data format, variableÕs label,
routine to display variable and instrument types for
which it is valid. Some of the Read commands also utilize a second operand.
Syntax
Variable
Description
Response
R1
_DEVTYPE
Device manf. and model (30 characters)
String
C-8
System 814 User Manual
1/23/98
R1, 1
_DEVTYPE
Option feature identiÞcation. (8 characters)
Used to determine optional features of the
system. The returned string will show the
availability of a Þlter card, the ENV. Þrmware option and the memory options like
this: ÒF1 E0 M0Ó. The Þlter has 3 options:
None (F0), 1/1 octave Þlters (F1) and 1/1
plus 1/3 octave Þlters (F3). The Environmental noise analyzer option is either present
(E1) or not (E0).
There are 4 conÞgurations of memory on the
814.
Standard 1/4 megabyte (M0), 1/2 megabyte
(M1), 1.25 megabyte (M2) and 2 megabyte
(M3).
Example: ÒF1 E0 M0Ó means there is a 1/1
octave Þlter installed, there is no ENV
option, and the memory is the standard 1/4
megabyte.
R1,2
_DEVTYPE
Read Filter Model string 814" or Ò824Ó
R1,3
_DEVTYPE
Read Flash IdentiÞcation ÒhhhhÓ Manf/
Device Code
R1,128
_DEVTYPE
Read ConÞgFlag ÒhhÓ (in hex)
R1,256
_DEVTYPE
Read AnalogConÞg ÒhhÓ (in hex)
R1,129255
_DEVTYPE
Test selected bits in ConÞgßag.
R1,257511
_DEVTYPE
Test selected bits in AnalogConÞg.
Selected bits in ConÞgFlag and AnalogConÞg can also
be tested. If any of the speciÞed bits are set = 1, then
the response will be ÒYesÓ otherwise the response is
ÒNoÓ. The following examples show how bits in ConÞgFlag and AnalogConÞg can be tested. (The binary
number shown is the binary value of the decimal operand of the R1 command.)
1/23/98
Command
Binary Value
ConÞgFlag Bits Tested
R1,129
10000001
0
R1,130
10000010
1
R1,132
10000100
2
C -9
R1,192
11000000
6
R1,170
10101010
1,3,5
NOTE: the 7th bit of ConÞgFlag cannot be tested. The
MSB of the operand is set to indicate that ConÞgFlag is
to be tested.
Command
Binary Value
AnalogConÞg Bits
Tested
R1,257
100000001
0
R1,258
100000010
1
R1,260
100000100
2
R1,384
110000000
7
R1,426
110101010
1,3,5,7
NOTE: This bit is set to indicate that, AnalogConÞg is
being tested.
Syntax
Variable
Description
Response
R2
_DT.TM
Current Date and Time
ddd ddmmmyyyy hh:mm:ss
R3
_STAT
Status
RUN/PAUSE/STOP/RESETC/RESET-O, LOCKED
R 3,1
_STAT
Short status string
Stabilize-Ru, Locked
R 3,1
_STAT
Short status string and reset alarm tripped
status
A short status string for R3,1 and R3,2 has a 5 character
response (cccccc).
¥ The Þrst is an ÒsÓ when stabilizing or a space when
stable.
¥ The second is the current mode: ÒSÓ for Stopped,
ÒRÓ for Running, ÒPÓ for Paused, ÒCÓ for Calibrating, ÒVÓ for View mode, ÒOÓ for stopped with overall data reset and ÒCÓ for stopped with Current
data set reset.
C-10
System 814 User Manual
1/23/98
¥ The third character is the instrument Lock Status
and is either an ÒLÓ or a ÒUÓ.
¥ The fourth character is the Logic Input Status and is
a Ò1Ó if high and a Ò0Ó if low.
¥ The Þfth character will be an ÒaÓ if an Alarm has
been detected.
¥ The sixth character is the modiÞed status of the
active setup (ID), a space for unmodiÞed and ÒAÓ
for archive.
R4
_C.SPL
Current SPL
nnn.nn dB
R5
_O.RTIME
OverAll Runtime
hhhhh:mm:ss.s
R6
_O.STIME
OverAll Start Date and Time
ddmmmyy hh:mm:ss
R7
_C.RTIME
Current Runtime
hhhhh:mm:ss.s
R8
_C.STIME
Current Start Date and Time
ddmmmyy hh:mm:ss
R9
_O.TWA
Overall TWA (Time Wght Avg)
nnn.n dB
R 10
_O.XR
Overall Exchange Rate Text
ccccc
R 11
_C.TWA
Current TWA (Time Wght Avg)
nnn.n dB
R 12
_C.XR
Current Exchange Rate Text
ccccc
R 13
_O.SEL
Overall SEL
nnn.n dB
R 14
_C.SEL
Current SEL
nnn.n dB
R 15
_O.LMIN
OverAll Minimum Level
nnn.n dB
R 16
_O.TMIN
OverAll Lmin Date and Time
ddmmmyy hh:mm:ss
R 17
_C.LMIN
Current Minimum Level
nnn.n dB
R 18
_C.TMIN
Current Lmin Date and Time
ddmmmyy hh:mm:ss
R 19
_O.LMAX
OverAll Maximum Level
nnn.n dB
R 20
_O.TMAX
OverAll Lmax Date and Time
ddmmmyy hh:mm:ss
R 21
_C.LMAX
Current Maximum Level
nnn.n dB
R 22
_C.TMAX
Current Lmax Date and Time
ddmmmyy hh:mm:ss
1/23/98
C -11
R 23
_O.LPEAK
OverAll Peak Level
nnn.n dB
R 24
_O.TPEAK
OverAll Lpeak Date and Time
ddmmmyy hh:mm:ss
R 25
_C.LPEAK
Current Peak Level
nnn.n dB
R 26
_C.TPEAK
Current Lpeak Date and Time
ddmmmyy hh:mm:ss
R 27
_O.LUWPK
OverAll UWPk Level
nnn.n dB
R 28
_O.TUWPK
OverAll Luwpk Date and Time
ddmmmyy hh:mm:ss
R 29
_C.LUWPK
Current UWPk Level
nnn.n dB
R 30
_C.TUWPK
Current Luwpk Date and Time
ddmmmyy hh:mm:ss
R 31
_RMSCNT
OverAll RMS Exceedances #1
nnnnn
R 32
_RMSCNT2
OverAll RMS Exceedances #2
nnnnn
R 33
_PEAKCNT
OverAll Peak Exceedances
nnnnn
R 34
_UWPKCNT
OverAll UWPk Exceedances
nnnnn
R 35
_OVLDCNT
Overloads
nnnnn
R 36
_PSECNT
Number of PAUSES
nnnnn
R 37
_PTIME
PAUSE Time (OFF not inc.)
hhhhh:mm:ss
R 38
_LN1
Ln 1
nnn.n dB
R 39
_LN2
Ln 2
nnn.n dB
R 40
_LN3
Ln 3
nnn.n dB
R 41
_LN4
Ln 4
nnn.n dB
R 42
_LN5
Ln 5
nnn.n dB
R 43
_LN6
Ln 6
nnn.n dB
R 44
_O.DOSE
Overall Dose
nnnnn.n%
R 45
_C.DOSE
Current Dose
nnnnn.n%
R 46
_O.PROJ
Overall Projected Dose
nnnnn.n%
R 47
_C.PROJ
Current Projected Dose
nnnnn.n%
R 48
_LDLDOSE
LDL Dose
nnnnn.n%
R 49
_LDLPROJ
LDL Projected Dose
nnnnn.n%
C-12
System 814 User Manual
1/23/98
R 50
_LDLLITWA
LDL Time Weighted Average
nnn.n dB
R 51
_LDLSEL
LDL SEL
nnn.n dB
R 52
_LDLXR
LDL Exchange Rate Text
ccccc
R 53
_LDLVALID
LDL Valid display (see note below)
cccccc
R 54
_RELLVL
Last Level Relative to REFLVL
-nnn.n
R 55
_TABLE
Display Histogram Selected
ccc
R 56
_COUNT
Display Overall Count
nnnnnk
R 57
_O.LEQ
Overall Leq
nnn.n dB
R 58
_D.LEQ
Daily Leq
nnn.n dB
R 59
_H.LEQ
Hourly Leq
nnn.n dB
R 60,h
_HNL
Hourly Leq 0-23
nnn.n dB
R 61,h
_HNLPART
Hourly Leq partial indicator nnn.n dB
R 62
_O.LDN
Overall LDN
nnn.n dB
R 63
_D.LDN
Daily LDN
nnn.n dB
R 64
_H.LDN
Hourly LDN
nnn.n dB
R 65
_O.CNEL
Overall CNEL
nnn.n dB
R 66
_D.CNEL
Daily CNEL
nnn.n dB
R 67
_H.CNEL
Hourly CNEL
nnn.n dB
R 68
_EXLEQ
Total EXCD Leq
nnn.n dB
R 69
_EXTIM
Total EXCD Time
hhhhh:mm:ss.s
NOTE: An LDL (Logged Data Logic) recalculation can be started
with a _LDLVALID I/O Read Command. When the Model 814 is
RUNNING the Valid condition will remain in effect for 1 second.
The _LDLVALID Read Command provides three responses, LDL
Valid, Calculating, and LDL Invalid.
NOTE: The exceedance Leq, R68, and exceedance time, R69,
include data from qualiÞed events that are stored in the EXCD History. If an event is discarded because it was shorter than the minimum duration then it will not be included in these values.
1/23/98
C -13
R 70
_BGLEQ
Background Leq
nnn.n dB
R 71
_C.AD1
A:D(1) Current Value
-nnnnn.
R 72
_O.AD1
A:D(1) Average Value
-nnnnn.
R 73
_AD1MAX
A:D(1) Max Value
-nnnnn.
R 74
_AD1MIN
A:D(1) Min Value
-nnnnn.
R 75
_AD1EX
A:D(1) Exceedances
nnnnn.
R 76
_C.AD2
A:D(2) Current Value
-nnnnn.
R 77
_O.AD2
A:D(2) Average Value
-nnnnn.
R 78
_AD2MAX
A:D(2) Max Value
-nnnnn.
R 79
_AD2MIN
A:D(2) Min Value
-nnnnn.
R 80
_AD2EX
A:D(2) Exceedances
nnnnn.
R 81
_C.AD3
A:D(3) Current Value
-nnnnn.
R 82
_O.AD3
A:D(3) Average Value
-nnnnn.
R 83
_AD3MAX
A:D(3) Max Value
-nnnnn.
R 84
_AD3MIN
A:D(3) Min Value
-nnnnn.
R 85
_AD3EX
A:D(3) Exceedances
nnnnn.
R 86
_BATT
Battery Level
nnn%
R 87
_BATTSRC
Battery Source (INT/EXT)
ccc
R 88
_TEMP
Temperature
-nnn.n
R 89
_SERNUM
Serial Number
ccccc
R 90
_REVNUM
Software Rev. & Rev. Date
n.nnn ddmmmyyyy
R 91
_FREEMEM
Free Memory
nnnnnnn
R 92
_RECLOG
Number of RUN/STOP Records
nnnnn
R 93
_RECEXCD
Number of EXCD Records
nnnnn
R 94
_RECINTV
Number of INTV Records
nnnnn
R 95
_RECHIST
Number of HIST Records
nnnnn
R 96
_RECDALY
Number of Daily Records
nnnnn
C-14
System 814 User Manual
1/23/98
R 97
_RECCAL
Number of Daily Records
nnnnn
R 98,n
_ERRMSG
Error Message List
cccccccccccccccccccccc(n) is the
error list number, 1-8, 1 being
latest error, or nnn, nnn...nnn if
n=0 or omitted then the 8 error
codes are output as number.
R 99
_LOGIC1
Logic Output 1 State
{On/Off} unused
R 100
_LOGIC2
Logic Output 2 State
{On/Off} unused
R 101
_REPORT
Report Number
nnnnn
R 102
_PAGE
Page Number
nnnnn
R 103
_PRNLINE
Printer Line Number
nnn
R 104
_CALTIME
Calibration Date/Time
ddmmmyy hh:mm:ss
R 105
_CHKTIME
Cal Check Date/Time
ddmmmyy hh:mm:ss
R 106
_OFFSET
Cal Offset
nnn.n
R 107
_CHKLVL
Cal check Level
nnn.n + OFFSET
R 108
_RMSEX
RMS Exceedance Flag 1
*
R 109
_RMSEX2
RMS Exceedance Flag 2
*
R 110
_PKEX
PEAK Exceedance Flag
*
R 111
_UWPKEX
UWPK Exceedance Flag
*
R 112
_OVLD
System Overload Flag
*
R 113
_EXXR
Excd Exchange Rate Text
ccccc
R 114
_IVXR
Intv Exchange Rate Text
ccccc
R 115
_AUTOADV
Auto-Advance History Ind.
+
R 116
_WINDSPD
Current Wind Speed
nnn.n
R 117
_WDIRCUR
Current Wind Direction
ccc (i.e. ENE, NNW)
R 118
_WINDAV
Overall Average Wind Speed
nnn.n
R 119
_WINDMAX
Overall Maximum Wind Speed
nnn.n
R 120
_WDIRMAX
Wind Direction at Overall Max Gust
ccc
R 121
_WMAXTIME
Time at Overall Max Gust
ddmmmyyyy hh:mm:ss
1/23/98
C -15
R 122
_WINDEX
Number of Overall Wind Exceedances
nnnnn
R 123
_WINDY
Overall Windy Percentage
nnn
R 124
_WDIRPCT
Wind Direction Percent (OPR2=1 to 8)
cccnnn (ccc=dir, nnn=%:
ESE 25)
R 125
_DYWINDAV
TodayÕs DAILY Average Wind Speed
nnn.n
R 126
_DYWINDMX
TodayÕs DAILY Maximum Wind Speed
nnn.n
R 127
_DYWINDDR
TodayÕs DAILY Wind Dir at Max Gust
ccc
R 128
_DYWINDTM
TodayÕs DAILY Time at Max Wind Gust
ddmmmyyyy hh:mm:ss
R 129
_DYWINDEX
TodayÕs Number of DAILY Wind ExcdÕs
nnnnn
R 130
_DYWINDY
TodayÕs Windy Percentage
nnn
R 131
_DYWDIRPCT
TodayÕs Wind Direction Percent (OPR2)
cccnnn
R 132
_DYMIN
TodayÕs Minimum Level
nnn.n dB
R 133
_DYMAX
TodayÕs Maximum Level
nnn.n dB
R 134
_DYPEAK
TodayÕs Peak Level
nnn.n dB
R 135
_DYUWPK
TodayÕs UWPk Level
nnn.n dB
R 136
_DYRNTIM
TodayÕs Runtime
hh:mm:ss | mm:ss.ss
R 137
_ALMTIM
Next Alarm Time
hh:mm
R 138
_IVTIME
Interval Date and Time of Occurrence
ddmmmyy hh:mm:ss
R 139
_IVDUR
Interval Duration
hh:mm:ss / mm:ss.ss
R 140
_IVLINT
Interval Lint
nnn.n dB
R 141
_IVSEL
Interval SEL
nnn.n dB
R 142
_IVMAX
Interval Lmin
nnn.n dB
R 143
_IVMIN
Interval Lmax
nnn.n dB
R 144
_IVPEAK
Interval Lpeak
nnn.n dB
R 145
_IVUWPK
Interval UnWeighted Peak
nnn.n dB
R 146
_HISTLEQ
AUTO-SEND HISTORY LEQ
nnn.n dB
R 147
AD1EXF
AD1 Exceedance Flag
*
C-16
System 814 User Manual
1/23/98
R 148
AD2EXF
AD2 Exceedance Flag
*
R 149
AD3EXF
AD3 Exceedance Flag
*
R 150
_RUNCNT
Number of RUNS & CONTINUES
nnnnn
R 151
_POFAULT
Power On Fault Cause Character
c
D Data Checksum Corrupt
E EEPROM Checksum Corrupt
K Key Reset (R+ l+ v)
P setting Checksum Corrupt
O Opcode Error
R RAM Setup Register Corrupt
T Test Memory Corrupt
W Watchdog Reset
An indicator has been added to the ON display on the top
line of the 814Õs display to show faults that were detected by
the power on test procedure. The R151 command will display the fault character to a computer. The indicators are:
R 152
_INRMS
Internal RMS detector level
nnn.nn dB
R 153
_INPEAK
Internal PEAK detector level
nnn.nn dB
R 154
_INUWPK
Internal UwPk detector level
nnn.nn dB
R 155
_KEYCNT
Free Bytes in Keyboard Stack
nnn
The number of keys in the keyboard stack is available
with the R155 command. This is used with keyboard
simulation to prevent the loss of keys.
R 156
_BGTIM
Background Leq Time
hhhhh:mm:ss.ss
R 157
_CALSTAT
Calibration Status
<<UnStable>>
R 158
_MEMSIZ
Total number of bytes for histories
nnnnnnn
R 159
_MEMUSE
Memory Available in percent
nnn.nn
R 160
_O.OVLD
OVERALL OVERLOAD FLAG
c
R 161
_RECRTA
Number of RTA Records
nnnnn
R 162
_O.SE
Overall Sound Exposure
nnnnn.n P2H
1/23/98
C -17
Sound Exposure (E) is calculated and displayed in pascal squared hours as needed in some of the European
Countries. This value is read with the R162 command
and is available in the top line of the DOSE-a display.
The formula used is:
E = T ¥ (10^(Leq/10)) ¥ 20µPa2,
where E is the Exposure, T is the elapsed time in hours, and
20µPa2 is the reference sound pressure 20 micro pascal
squared.
R 163
_TAKT3
TAKT 3
nnn.n dB
R 164
_TAKT5
TAKT 5
nnn.n dB
R 165
_PsByTim
PassBy Time of Occurrence
ddmmmyy hh:mm:ss
R 166
_PsByDur
PassBy Event Duration
hh:mm:ss / mm:ss.ss
R 167
_PsByMax
PassBy Lmax
nnn.n
R 168
_PsByLeq
PassBy Leq
nnn.n
R 169
_PsBySel
PassBy SEL
nnn.n
R 170
_BATT_EXT
External Battery Level in Volts
nn.n
R 171
_OBA_LIVE
OBA Þlter - LIVE Leq
nnn.n dB
R 172
_OBA_CURRENT
OBA Þlter - CURRENT Leq
nnn.n dB
R 173
_OBA_OVERALL
OBA Þlter - OVERALL Leq
nnn.n dB
R 174
_OBA_FREQ
OBA Þlter selected frequency
31.5
R 175
_O.ETIME
OverAll End Date and Time
ddmmmyy hh:mm:ss
R 176
_C.ETIME
Current End Date and Time
ddmmmyy hh:mm:ss
R 177
_O.ResetBegan
OverAll Reset/Began Text
ÒResetÓ or ÒBeganÓ
R 178
_C.ResetBegan
Current Reset/Began Text
ÒResetÓ or ÒBeganÓ
R 179
_Total_RAM
Total bytes of RAM installed in the
SLM
nnnnnnn
R 180
_InstType
Current Instrument Type
nnnnnnn
R 181
_RecFile
Number of Data File Records
nnn
C-18
System 814 User Manual
1/23/98
R 182
_Marker1Level
OBA Marker Level #1
nnn.n
R 183
_Marker2Level
OBA Marker Level #2
nnn.n
R 184
_Marker1Filter
OBA Marker #1 Filter
nnnnn
R 185
_Marker2Filter
OBA Marker #2 Filter
nnnnn
R 186
_RevNumSLM
SLM Firmware Rev. Number & Revision Date
n.nnn ddmmmyyyy
Other Read Commands
Other read commands are macro commands that send
multiple ÒRÓ variables, so multiple data can be
retrieved from the 814 with one command. Other commands O 1, O 2, and O 4 are preprogrammed macros
while O 3 is a user-deÞned macro which is programmed by the Group command.
Code
Description
Response
O1
Read SLM data
nnn.n, nnn.n, nnn.n, nnn.n<CR><LF> R 4 (SPL), (R 11 (TWA), R 17,
(Lmin), R 21 (Lmax)<CR><LF>)
O2
Read Wind Data
nnn.n, ccc, nnn.n, nnn.n, ccc<CR><LF>
O3
Read Group of ÒRÓ variables
programmed by the group
programming command G n,r
<as programmed>
O4
Read 814Õs LCD Display, bit
mapped in a binary format
• <SOH><HIGH_COUNT><LOW_COUNT><...data...><CHKSM><CR><LF>
• There are 1024 bytes of screen data (8 lines of 128 bytes each)
• Bits in each byte represent a vertical column of 8 pixels with the lsb on top
Group Read Programming
The group command permits the programming of a
user-deÞned macro with up to eight (8) Read variables.
The macro is executed with the G0 or O[ther] 3 commands which returns the list of deÞned read variables.
Use the following command syntax to program each
desired read variable and its position in the macro.
1/23/98
C -19
Syntax
Response
G[roup]n, var_no
<cr><lf>
Example: G1, 4 <cr>
assigns the current SPL to the first group option
Example: G2, 15 <cr>
assigns Lmin to the second option
Example: G3, 19 <cr>
assigns Lmax to the third option
Example: G4, 0 <cr>
terminates group command programming
Where n is from 1 to 8, indicating the macro position
and var_no is the number of the ÒRÓ variable associated with the position. Use a var_no of Ò0Ó to deÞne
the last position when less than eight are desired.
After programming this group read list, the response
to G0 is 59.5, 38.6, 102.2, the SPL, Lmin and Lmax.
The Group command can be programmed to automatically send the group data at a periodic rate as set by
the Auto-Send Leq function. If the Þrst variable of the
group is programmed to be R 146, the AUTO-SEND
HISTORY LEQ, with a G1,146 command then the
entire group will be sent out automatically when the
Auto-Send functions sends itÕs Leq. This function is
enabled with setting #151, AUTO-SEND HISTORY
[No|Yes] or the S151,1 command.
Settings
The Settings select what functions are enabled and
determine how the measurements are performed. Settings can be both set (S) and queried (Q). The settings
numbers provided below in the ÒSettings ListÓ section
are for both the Set (S) and Query (Q) commands.
Settings are entered with the Set command. The syntax
for the Set command is S[ET ]setting_number,
setting_value or S[ET ]setting_number;option_text
where setting_number is the setting number,
setting_value is the desired setting, and option_text is
C-20
System 814 User Manual
1/23/98
the textual setting for the option settings (those that
have one setting from a list of possible settings).
The current setting is retrieved with the Query (Q)
command. The syntax for the query command is
Q[uery ]setting_number[,options]
where
setting_number is the number of the desired setting
and options is a number to select the appearance of the
response.
All commands begin with S. See Chapter 8 for a list of
all the settings and their options. There are four types
of settings:
¥ Option e.g. [Sun|Mon|TuesÉ|Sat]
¥ Numeric e.g. (123.45)
¥ Character e.g. (Gas Flare, Test 1); can be up to 30
characters
¥ Template e.g. (hh:mm:ss)
Brackets indicate optional characters and operands.
<cr> = carriage return; <lf> = line feed; _ = space
Querying Settings
When querying a setting begin the query commands
with Q. Brackets indicate optional characters and operands. <cr> = carriage return; <lf> = line feed; _ = space
Syntax
Response
Q[uery]item_number[,ßag]
Depends on ßag
Option ßags elicit the following responses:
Flag
Response
none
Current setting
1
Setting name and current setting
1/23/98
C -21
2
Current setting (including spaces) in brackets or parentheses
3
Setting name and current setting (including spaces) in brackets or parentheses
32
Option number for option setting
Flag values may be added together for desired combinations:
Example:
Response
1.Q66
No
2.Q66, 1
Excd History Enable=No
3.Q66, 2
[_No]
4.Q66, 32
0
5.Q66, 3
Excd History Enable=[_No]
Responses are denoted by (x) if Yes/No or (n) if
numerical.
Entering Settings
Option Settings
Option settings can be set in two ways: a. option number and b. actual option settings value.
a.Option Number
Syntax
Response
S[et]item_number,option_number
<cr><lf>
Example: S9, 3
sets setting 9:Baud Rate to option 3 which sets the
baud rate to 9600
Example: S66, 1
sets Excd History Enable to Yes.
Example: S84, 0
sets Hist Period Units to _1/32s
Example: S84, 1
sets Hist Period Units to _1.0s
b.Option Setting Text
C-22
System 814 User Manual
1/23/98
Querying an option with a ßag of 2
will return the settingÕs value
enclosed in brackets as needed when
using the option text syntax.
Option settings texts is preceded by a semicolon and
enclosed by brackets. Option settings text must include
the same number of characters that are given when
queried, including spaces, which are indicated below
with Ò__Ó.
Syntax
Response
S[et]item_number; [option_text]
<cr><lf>
Example: S9; [_9600]
sets Baud Rate to 9600.
Example: S66; [Yes]
sets Excd History Enable to Yes.
Example: S84; [_1/32s]
sets Hist Period Units to 1/32s
Example: S84; [_1.0s]
sets Hist Period Units to 1.0s
Numeric Settings
Syntax
Response
S[et]item_number, setting_value
<cr><lf>
Example: S62, 120
sets RMS Excd Level 2 to 120.
Character String Settings
To include leading spaces in a character string setting,
precede the character string with a Ò`Ó (leading single
quote or grave accent, ASCII 96 or hexadecimal 60).
Syntax
Response
S[et]item_number;`character_string
<cr><lf>
Example: S2; `
sets Name to ABC Acoustics.
ABC Acoustics
Template Settings
_Date
The month, day, and year are entered in that order and
are separated by Ò/Ó. The display shows day,
month(abbreviated), and year in that order.
Syntax
Response
S[et]item_number; mm/dd/yy
<cr><lf>
1/23/98
C -23
S22, 05/23/89
sets Timer Run Date to 23May1989.
_Time
The hour, minutes, and seconds are entered in that
order and are separated by Ò:Ó. Military (24 hour clock)
time is used: i.e. add 12 to afternoon hours.
Syntax
Response
S[et]item_number; hh:mm:ss
<cr><lf>
Example: S24, 14:25:33
sets Timer Run Time 1 to 14:25:33.
C-24
System 814 User Manual
1/23/98
Setting List
Command
Variable
Description
1
Q.RESALL
RESET-ALL
2
Q.HDG1
HEADING LINE #1
3
Q.HDG2
HEADING LINE #2
4
Q.HDG3
HEADING LINE #3
5
Q.TITLE
MEASUREMENT TITLE
6
Q.TIME
CURRENT TIME
7
Q.DATE
CURRENT DATE
8
Q.DAY
DAY OF WEEK
9
Q.BAUD
Serial Communications Baud Rate
10
Q.SADDR
Serial Communications Address
11
Q.C1SWHS
Serial Communications Output Flow Control
12
Q.PrnBaud
Printer Serial Bit Rate
13
Q.PrnHsk
Printer Serial Output Flow Control
14
Q.LOGIC1
Logic-Output, Activation Mode
15
Q.OUT1TIM
Logic-Output Line Timer
16
Q.LOGIC2
Logic-Output Line #2, Activation Mode
{Heater control line}
17 M
Q.OUT2TIM
Logic-Output Line #2 Timer
1/23/98
Comment
C -25
18
Q.HALT
LOGIC-IN LINE MODE
LOGIC-IN LINE Mode Q18 has
a [None] state available. This
allows systems with intrusion
alarm hardware to be disabled
during servicing. The choices
are: [None | Pause | Toggle |
Level | Alarm].
The Model 814 dials out when
in the Modem Mode and
remaining memory gets below
5000 bytes. It now uses RMS
Threshold #2 to dial out on
EXCD events.
19
Q.PWRMD
External Power Type [AC Pwr|Battery|Battery]
Protects External Battery
20
Q.PwrExtVolt
External Power-Off Voltage
21
Q.PWRSV
POWER SAVE OPTIONS [Blank LCD /
Auto Off / Manual Off]
22
Q.PwrStbyTim
Standby Time (LCD Blank & Comm Off)
(nn)
minutes
23
Q.PwrOffTime
Auto-Off Time (nn)
minutes
24
Q.PwrBkltTim
Backlight Power Off Time (nn)
seconds
25
Q.BkLite
Backlight On/Off
26
Q.Contrast
LCD Contrast 0 to 99% (nn)
27
Q.TIMMD
TIMER MODE
28
Q.RUND
TIMER RUN DATE
29
Q.STOPD
TIMER STOP DATE
30
Q.RUNT1
TIMER RUN TIME1
31
Q.STOPT1
TIMER STOP TIME 1
32
Q.RUNT2
TIMER RUN TIME 2
33
Q.STOPT2
TIMER STOP TIME 2
C-26
System 814 User Manual
1/23/98
34
Q.LKCOMB
LOCK COMBINATION
35
Q.LKRS
LOCK R/S KEY
36
Q.LKSU
LOCK SETUP
37
Q.LKFN
LOCK FUNCTION
38
Q.LKRES
LOCK RESET
39
Q.LKPWR
LOCK THE ÔONÕ KEY
40
Q.LKIO
LOCK I/O
41
Q.CALLVL
CAL LEVEL
42
Q.CALSN
CALIBRATOR S/N
43
Q.AUTOCAL
AUTO-CALIBRATION MODE
44
Q.CALTIM
AUTO CAL TIME
45
Q.DETC
DETECTOR
46
Q.WGHT
FREQUENCY WEIGHTING
47
Q.FILTER
FILTER NUMBER (14-43)
48
Q.ACOUT
Ac Out Weighting (Flat | Wght)
49
Q.PkWght
UwPk Detector Weighting [Flat | C]
50
Q.RANGE
RANGE [Normal | Low | High]
51
Q.TRANSDUCER
Transducer Type [Air Condenser| Electret |
Direct}
52
Q.DispVal
Simple SLM Displayed Value
53
Q.CXRATE
CURRENT EXCHANGE RATE
54
Q.CTHOLD
CURRENT THRESHOLD
55
Q.CCRIT
CURRENT CRITERION
56
Q.OXRATE
OVERALL EXCHANGE RATE
57
Q.OTHOLD
OVERALL THRESHOLD
58
Q.OCRIT
OVERALL CRITERION
59
Q.DOSET
CRITERION TIME (HOURS)
1/23/98
C -27
60
Q.LDLXRAT
E
LDL EXCHANGE RATE
Q61
Q.LDLTHOL
D
LDL THRESHOLD
62
Q.LDLCRIT
LDL CRITERION
63
Q.LNN1
Lnn 1 PERCENT
64
Q.LNN2
Lnn 2 PERCENT
65
Q.LNN3
Lnn 3 PERCENT
66
Q.LNN4
Lnn 4 PERCENT
67
Q.LNN5
Lnn 5 PERCENT
68
Q.LNN6
Lnn 6 PERCENT
69
Q.RMSTH1
SPL Exceedance Level 1
70
Q.RMSTH2
SPL Exceedance Level 2
71
Q.PKTH
Peak-II Exceedance Level
72
Q.UWTH
Peak-I Exceedance Level
73
Q.HYST
EXCD HYSTERESIS
74
Q.EXENB
ENABLE EXCD HISTORY
75
Q.EXXRT
EXCD EXCHANGE RATE
76
Q.EXMIN
EXCD MINIMUM DURATION
77
Q.EXHENB
EXCD TIME-HIST ENABLE
78
Q.EXPER
EXCD TIME-HIST PERIOD
79 Reserved setting
80
Q.EXTrig
EXCD Passby Trigger Mode
81
Q.ExTime
EXCD Occurrence Time [Start | Max]
82
Q.IVENB
TIMED EXCD PERIOD
83
Q.IVXRT
ENABLE INTV HISTORY
84
Q.IVTHOLD
INTV EXCHANGE RATE
85
Q.IVPER
INTV THRESHOLD
C-28
System 814 User Manual
1/23/98
86
Q.IVSYNC
INTV PERIOD
87
Q.IVLN
INTV TIME SYNC
88
Q.IVSYNC
INTV SAVE LnÕS
89
Q.NI??
RESERVED setting
90
Q.IVSTOP
INTV AUTO STOP
91
Q.HSTENB
ENABLE TIME HIST
92
Q.HSTRES
HIST RESOLUTION
93
Q.HSTPK
HIST SAVE Another Level
94
Q.HSTPER
HIST PERIOD
95
Q.HSTUNIT
HIST PERIOD UNITS
96
Q.HSTBASE
HIST BASE
97
Q.HSTMODE
HIST BASE MODE
98
Q.HGRES
HISTOGRAM TABLE RESOLUTION
99
Q.DYENB
ENABLE DAILY LDN HISTORY
100
Q.DYLNENB
SAVE 6 DAILY Ln VALUES
101
Q.RPT_Data
DATA REPORT
102
Q.RPT_Log
R/S AND CAL LOG
103
Q.RPT_Setup
SETUP REPORT
Histogram Reports
The RMS, Peak and UWPk histogram reports have
been implemented with this revision. The unformatted
reports have also been developed and the format is the
level of the Þrst bin followed by the number of samples
in each bin (in hex, 0-9 & aÐ). There are 1024 RMS bins
and 128 Peak and UWPk bins, this corresponds to 1/
8th dB resolution for RMS and 1dB resolution for the
peak tables.
104
1/23/98
Q.RPT_Htgm
SPL HISTOGRAM TABLE
(x)
C -29
105
Q.RPT...
SPL HISTOGRAM TABLE LOW VALUE
(n)
106
Q.RPT...
SPL HISTOGRAM TABLE HI VALUE
(n)
107
Q.RPT...
SPL HISTOGRAM TABLE RESOLUTION
(x)
108
Q.RPT_Pk2Hg
PEAK-II HISTOGRAM TABLE
(x)
109
Q.RPT...
PEAK-II HISTOGRAM TABLE LOW
VALUE
(n)
110
Q.RPT...
PEAK-II HISTOGRAM TABLE HI VALUE
(n)
111
Q.RPT...
PEAK-II HISTOGRAM TABLE RESOL
(x)
112
Q.RPTPk1Hg
PEAK-I HISTOGRAM TABLE
(x)
113
Q.RPT...
PEAK-I HISTOGRAM TABLE LOW
VALUE
(n)
114
Q.RPT...
PEAK-I HISTOGRAM TABLE HI VALUE
(n)
115
Q.RPT...
PEAK-I HISTOGRAM TABLE RESOL
(x)
Tailored Report
116
Q.RPT_Excd
EXCD REPORT
117
Q.RPT_Intv
INTV REPORT
118
Q.PRN...
HIST REPORT
119
Q.PRN...
DAILY NOISE REPORT
120-147 Reserved settings
Miscellaneous
C-30
148
Q.SCAN
OBA SCANMODE [Manual | Auto |
Timed]
149
Q.PROF
OBA PROFILE [Normal | Short | Long |
Custom]
150
Q.BAND
OBA BANDWIDTH [1/1 | 1/3]
151
Q.ALLOCATED
Number of Allocated RAM Slots
152
Q.EAON
ELECTROSTATIC ACTUATOR OFF/ON
System 814 User Manual
1/23/98
153
Q.HEATER
HEATER LINE OFF/ON
154
Q.MDMMD
MODEM MODE
155
Q.DIAL
MODEM DIAL OUT MODE
156
Q.PHONE
MODEM PHONE NUMBER
157
Q.MONNUM
Monitor Number
158
Q.MDMI
MODEM INIT STRING
Special Functions - Advanced use only. Remaining commands are not available on SETUP menu.
159-166 Reserved settings
167
Q.REFLVL
RELATIVE LEVEL REFERENCE
168
Q.RTEXCD
REAL-TIME EXCD REPORT
(x)
169
Q.RTINTV
REAL-TIME INTV REPORT
(x)
170
Q.RTHIST
REAL-TIME HIST REPORT
(x)
171
Q.RTLOG
REAL-TIME RUN-LOG RPT
(x)
172
Q.RTDAY
REAL-TIME DAILY REPORT
(x)
173
Q.RTCAL
REAL-TIME CAL REPORT
(x)
174
Q.RTFRMT
UNFORMATTED REPORTS
(x)
175 Reserved setting
176
Q.PTYPE
PRINTER TYPE
(x)
177
Q.Prn_Data
DATA REPORT
(x)
178
Q.Prn_ Log
R/S AND CAL LOG
(x)
179
Q.Prn_Setup
SETUP REPORT
(x)
180
Q.Prn_
SPL_Hs
RMS HISTOGRAM TABLE
(x)
181
Q.SPL_Low
RMS HISTOGRAM TABLE LOWEST
VALUE
(n)
182
Q.SPL_Hi
RMS HISTOGRAM TABLE HIGHEST
VALUE
(n)
1/23/98
C -31
C-32
183
Q.SPL_Res
RMS HISTOGRAM TABLE RESOLUTION
(x)
184
Q.Prn_Pk2_Hs
PEAK-II HISTOGRAM TABLE
(x)
185
Q.Pk2_Low
PEAK-II HISTOGRAM TABLE LOWEST
VALUE
(n)
186
Q.Pk2_Hi
PEAK-II HISTOGRAM TABLE HIGHEST
VALUE
(n)
187
Q.Pk2_Res
PEAK-II HISTOGRAM TABLE RESOL
(x)
188
Q.Prn_Pk1_Hs
PEAK-I HISTOGRAM TABLE
(x)
189
Q.Pk1_Low
PEAK-I HISTOGRAM TABLE LOW
VALUE
(n)
190
Q.Pk1_Hi
PEAK-I HISTOGRAM TABLE HI VALUE
(n)
191
Q.Pk1_Res
PEAK-I HISTOGRAM TABLE RESOL
(x)
192
Q.Prn_Excd
EXCD REPORT
(x)
193
Q.Excd_Low
EXCD REPORT LOWEST RECORD
(n)
194
Q.Excd_Hi
EXCD REPORT HIGHEST RECORD
(n)
195
Q.Prn_Intv
INTV REPORT
(x)
196
Q.Intv_Low
INTV REPORT LOWEST RECORD
(n)
197
Q.Intv_Hi
INTV REPORT HIGHEST RECORD
(n)
198
Q.Prn_Hist
HIST REPORT
(x)
199
Q.Hist_Low
HIST REPORT LOWEST RECORD
(n)
200
Q.Hist_Hi
HIST REPORT HIGHEST RECORD
(n)
201
Q.Prn_Daily
DAILY NOISE REPORT
(x)
202
Q.CALMODE
CALIBRATION MODE [Off | Check |
Change | Chk NF]
203
Q.ULCOMB
UNLOCK PASSWORD
204
Q.IONAME
SETUP FILENAME
205
Q.ERCHK
ENABLE ERROR CHECKING I/O
System 814 User Manual
1/23/98
Error Checking I/O
The error checking I/O protocol veriÞes that commands and data are transferred without errors.
¥ To enable error checking the @ command or S205,1
command is used.
¥ To disable error checking two <CR> characters in a
row may be sent (if not in the Modem Mode) or the
S205, 0F command is sent.
The ÒFÓ is the check character for the S205, 0 command. A detailed description of the protocol is available from Larson¥Davis and the latest revisions of
software utilize the protocol.
206 Reserved setting
207
Q.NFLVL
NOISE FLOOR LEVEL
This setting is set to the noise ßoor of the instrument so
that it can properly indicate ÒNear Noise FloorÓ messages when within 10dB of the noise ßoor. It is also
used with NF Compensate, Q208, which will place the
Model 814 in an extended Linearity Range Mode. The
true noise ßoor of the entire system must be measured
and entered in Q207. This will vary with the selected
input weighting or microphone sensitivity. An equivalent microphone capacitance can be used after calibration to determine the noise ßoor. It may also be
possible to remove the microphone bias to obtain this
value. When properly set up the linearity range can be
increased by 10dB.
NOTE: The mode is always turned off with a CAL Change.
208
Q.NFMODE
NOISE FLOOR COMP MODE
209 Reserved setting
210
Q.CNTLREG
AUX CONTROL REG
211
Q.EXREC
EXCD RECORD NUMBER
1/23/98
C -33
212
Q.IVREC
INTV RECORD NUMBER
213
Q.HSTREC
HIST RECORD NUMBER
214
Q.LOGREC
RUN-LOG RECORD NUMBER
215
Q.DYREC
DAILY RECORD NUMBER
216
Q.CALREC
CALIBRATION RECORD NUMBER
217
Q.TBLLVL
HISTOGRAM TABLE LEVEL
218
Q.FileRec
Data File Record Number
219
Q.GphScl
Graph Vertical Scale, dB per pixel
220
Q.GphBase
Graph Base Level (range from -99 to +999)
221
Q.RTS_Mode
Request to send Output Control Mode
222
Q.RMS_Scale
SPL SCALE (uses 225.48 lock)
223
Q.PK2_Scale
PEAK2 SCALE (uses 225.48 lock)
224
Q.PK1_Scale
PEAK1 SCALE (uses 225.48 lock)
225
Q.TSCL
TEMPERATURE SCALE FACTOR
226 Reserved setting
227
Q.RMSOS
OVERALL CALIBRATION OFFSET (uses
225.48 lock)
228
Q.PKOS
Peak-II To RMS CAL OFFSET (uses 225.48
lock)
229
Q.UWPKOS
Peak-I To RMS CAL OFFSET (uses 225.48
lock)
230
Q.BIAS
BIAS OFFSET - For High Range Calibration
(uses 225.48 lock)
231 Reserved setting
232
Q.TempCal
Temperature Calibration (Cal level must be
225.48)
233
Q.SERNUM
SERIAL NUMBER Entry (secured setting)
234
Q.MODEL
Model Number Entry (secured setting)
235
NoPrm
Invalid SettingÕs data block
C-34
System 814 User Manual
1/23/98
History Records
The various histories of the Model 814 are each
accessed in a similar fashion. The Find command is the
primary method of locating a history record for random (nonsequential) access. For example, to Þnd the
one hundred twenty-Þfth Exceedance record you send
the command F125,1 <cr> where the [,1] speciÞes that
it is an Exceedance record to be found (as deÞned in
the Òhistory_numberÓ column above). The Advance
and Backup commands are generally used next. They
extract data after the initial Þnd command.
The Find command takes longer to execute as the
record number increases in size, therefore, for sequential data extraction locate the Þrst desired record with
the Find command and then use the Advance command. The [,relative_rec] option can be used to retrieve
data forward or backward from the current record
number without changing that record number; it is a
signed 8-bit value, i.e. 1 to 127 is positive 1 to 127 while
128 to 255 is -128 to -1 respectively. Refer to settings 211
through 214 to query the current record number. Setting these settings to a desired record number is an
alternate form of the Find command.
Brackets in the syntax indicate optional characters and
operands.
<cr> = carriage return; <lf> = line feed
Types of History
Denoted in syntax by history_no:
1=Exceedance (E)
2=Interval (I)
3=Daily (D)
4=Run Log (L)
5=Calibration (C)
6=Time (H)
7=Histogram Table (T)
Advance
Advance a number of records from present record
number. If no num_record (number of records) is provided, 1 is assumed.
1/23/98
C -35
Syntax
Response
A[dvance][num_record][, history_no]
<cr><lf>
Example: A9,5
Advances calibration history by 9 records
Backup a number of records from present record number. If no num_record (number of records) is provided, 1 is assumed.
Backup
Syntax
Response
[Backup][num_record][, history_no]
<cr><lf>
Example: B9,5
Backs up the calibration history by 9 records from the
current calibration history
Find record number directly.
Find
Syntax
Response
F[ind]rec_no[, history_no]
<cr><lf>
Example: F9,5
Locates calibration history record 9
Generally you use the Find command to get to the Þrst
record (F1,2) and the Advance command (A) to move
up through the records.
History Data Variables
Exceedance History Variables
Brackets in the syntax indicate optional characters and
operands.
Syntax
Response
E[xceedance]var_no
Excd_var
Example: E9
__2 (Overload count from current record)
C-36
System 814 User Manual
1/23/98
1/23/98
E1
Date and Time of Occurrence
ddmmmyy hh:mm:ss
E2
Duration
hh:mm:ss / mm:ss.ss
E3
TWA
nnn.n dB
E4
SEL
nnn.n dB
E5
Lmax
nnn.n dB
E6
Lpeak
nnn.n dB
E7
UnWeighted Peak
nnn.n dB
E8
Peak Exceedance Count
nnn
E9
Overload Counts
nnn
E 10
Illegal Indication
BEEP$+ÓILLEGALÓ
E 11
A:D(1) Max (Reserved for future ENV
use)
-nnnnn.
E 11
A:D(1) Min (Reserved for future ENV
use)
-nnnnn.
E 11
A:D(2) Max (Reserved for future ENV
use)
-nnnnn.
E 11
A:D(2) Min (Reserved for future ENV
use)
-nnnnn.
E 11
A:D(3) Max (Reserved for future ENV
use)
-nnnnn.
E 11
A:D(1) Min (Reserved for future ENV
use)
-nnnnn.
E 17
Excd Time-Hist Samples
nnn
E 18<,n>
Excd Time-History
nnn.n dB
E 19<,n>
Excd T.H. Time
-sss.ss
E 20<,n>
Excd T.H. Number
-nnn
E 21<,n>
Excd T.H. Bargraph
**********************
E 22
AVG WIND SPEED
nnn.n
C -37
E 23
MAX WIND SPEED
nnn.n
E 24
WIND DIRECTION @ MAX
ccc
E 25
EXCD SYMETRY
nnn.nn%
E 101
Excd Macro Variables 1-10, 25
Macro
E 102
Excd Macro Time-Hist 17, 18...
Macro
E 103
Excd Macro Wind
22-24
Interval History Variables
The Interval History is a long-duration time history of
statistical data. It is enabled by Setting 83, Interval
Enable [No|Yes] (see Settings 83 through 90). The
period of the interval is selectable from one second up
to 99 hours, 59 minutes, and 59 seconds (99:59:59).
Brackets in the syntax indicate optional characters and
operands.
Syntax
Response
I[nterval]var_no
Intv_var
Examples:
I1
I 1,-5
I1,5
01Jan1997 01:25:00
01Jan1997 01:20:00 (from 5 previous)
01Jan1997 01:30:00 (from 5 after)
The time syncing feature can be used to synchronize
the interval history records to the instruments realtime clock. If the Interval Period is set to the time
shown in the Þrst column below, the Þrst interval of
each new measurement will end at the real time indicated in the second column (the hh means any hour
and the hh:m means any hour and tens of minutes).
All subsequent intervals will now be synchronized to
the real-time clock:
C-38
System 814 User Manual
1/23/98
1/23/98
Intv
Period
Sync On
Sync to nearest
01:00
hh:00
hour
00:30
hh:00, hh:30
half hour (30 minutes)
00:20
hh:00, hh:20, hh:40
one-third hour (20 minutes)
00:15
hh:00, hh:15, hh:30, hh:45
one-fourth hour (15 minutes)
00:10
hh:m0
one-sixth hour (10 minutes)
00:05
hh:m0, hh:m5
one-twelfth hour (5 minutes)
00:0x
hh:mm
minute
I1
Date and Time of Occurrence
ddmmmyy hh:mm:ss
I2
Duration
hh:mm:ss / mm:ss.ss
I3
TWA
nnn.n dB
I4
SEL
nnn.n dB
I5
Lmin
nnn.n dB
I6
Lmax
nnn.n dB
I7
Lpeak
nnn.n dB
I8
UnWeighted Peak
nnn.n dB
I9
RMS Exceedance Count
nnn
I 10
Peak Exceedance Count
nnn
I 11
UnWeighted Peak Excd Count
nnn
I 12
Overload Counts
nnn
I 13
Intv Ln 1 Percent
nn
I 14
Intv Ln 1 Level (dB)
nnn.n
I 15
Intv Ln 2 Percent
nn
I 16
Intv Ln 2 Level (dB)
nnn.n
C -39
C-40
I 17
Intv Ln 3 Percent
nn
I 18
Intv Ln 3 Level (dB)
nnn.n
I 19
Intv Ln 4 Percent
nn
I 20
Intv Ln 4 Level (dB)
nnn.n
I 21
Intv Ln 5 Percent
nn
I 22
Intv Ln 5 Level (dB)
nnn.n
I 23
Intv Ln 6 Percent
nn
I 24
Intv Ln 6 Level (dB)
nnn.n
I 25
A:D(1) Average Value
(Reserved for future ENV use)
-nnnnn.
I 26
A:D(1) Max Value (Reserved for
future ENV use)
-nnnnn.
I 27
A:D(1) Min Value (Reserved
for future ENV use)
-nnnnn.
I 28
A:D(2) Average Value
(Reserved for future ENV use)
-nnnnn.
I 29
A:D(2) Max Value (Reserved for
future ENV use)
-nnnnn.
I 30
A:D(2) Min Value (Reserved
for future ENV use)
-nnnnn.
I 31
A:D(3) Average Value
(Reserved for future ENV use)
-nnnnn.
I 32
A:D(3) Max Value (Reserved for
future ENV use)
-nnnnn.
I 33
A:D(3) Min Value (Reserved
for future ENV use)
-nnnnn.
I 34
Average Wind Speed
nnn.n
I 35
Max Wind Speed
nnn.n
I 36
Wind Direction @ Max
ccc
I 101
Intv Macro Variables 1-24
1-24
I 102
Intv Macro Wind
34-36
System 814 User Manual
1/23/98
Daily History Variables - (D1-D102)
Brackets in the syntax indicate optional characters and
operands.
Syntax
Response
D[aily]var_no[,hour]
daily_var
Example: D5, 5
hourly noise level for hour 5 to 5:59:59 a.m.
D1
Date
ddd
D2
Daily Leq
nnn.n dB
D3
Daily LDN
nnn.n dB
D4
Daily CNEL
nnn.n dB
D 5,hn
HNL
(for hour 0-23)
D 6,hn
HNL partial hour indicator
c
D7
Daily Lmin
nnn.n dB
D8
Daily Lmax
nnn.n dB
D9
Daily Lpeak
nnn.n dB
D 10
Daily Luwpk
nnn.n dB
D 11
Daily Run Time
hh:mm:ss | mm:ss.ss
D 12
Daily Avg Wind Speed
nnn.n or nnnnn
unused
D 13
Daily Gust
nnn.n or nnnnn
unused
D 14
Daily Gust Direction
ccc
unused
D 15
Daily Gust Time
hh:mm:ss
unused
D 16
Daily Wind Excd Count
nnnnn
unused
D 17
Daily Windy Percentage
nnn
unused
D 18,n
Daily Direction% (n=1-8)
cccnnn
unused
1/23/98
ddmmmyyyy
nnn.n dB
C -41
D 19
Daily Ln Table in hexadecimal
hhhhhh, hhhhhh,...hhhhhh
<ih>
D 101
Daily Variables 1-4, 7-11
Macro
D 102
Daily HNLs 5(0-23),6(023)
Macro
D 103
Daily Wind 12-17, 18(1-8)
Macro
unused
Run Log Variables
Brackets in the syntax indicate optional characters and
operands.
Syntax
Response
L[og]var_nolog_var
Example: L1
Run/Stop number
L1
Run/Stop Number
nnnnn
L2
Run/Stop Type
(RUN/STOP/CONT/PAUSE/MARK)
L3
Cause
(TIMER/KEY/A:D-n/HALT/INTV/BATT)
L4
Day, Date and Time
ddd ddmmmyyyy hh:mm:ss
L 101
Run-Log Macro Variables L1-L5
Macro
Calibration History Variables
Brackets in the syntax indicate optional characters.
Syntax
Response
C[alibration]var_no
cal_var
Example: C1
114.0 (checked level)
C-42
System 814 User Manual
1/23/98
C1
Checked Level
nnn.n
C2
Day, Date and Time
ddd ddmmmyyyy hh:mm:ss
C3
Calibration Mode
[Manual/Auto]
C4
Cal Status
[OK/Bad]
C 101
Cal Variables 1-4
Macro
Time History Variables (Logging SLM)
Brackets in the syntax indicate optional characters and
operands.
Syntax
Response
H[istory]var_no
time_var
H2
123.4 (Peak level in current record)
H1
Leq (RMS Level)
nnn.n dB
H2
Peak Level
nnn.n dB
H3
Run Time of Sample (calc)
hhhhh:mm/hh:mm:ss/mm:ss.ss
H4
HISTORY BARGRAPH
==========-----
Histogram Table Variables
Brackets in the syntax indicate optional characters and
operands.
Table:
¥ 1=RMS,
¥ 2=Peak,
¥ 3=Unweighted Peak.
Default is last used table or RMS.
1/23/98
C -43
Syntax
Response
T[able]var_no[, table]
table_var
Example: T1,1
-75.0 (RMS current bin level)
T 1,na
Level of current bin
nnn.n dB
T 2,n
Count of samples
nnnnnc (c= K or M for Kilo or Mega)
T 3,n
Percent of total
nnn.nn%
T 5 [, n]
Prints the accumulated timer for the current
level/bin. The table number is optional.
hhhhh:mm:ss.s
a. Where n equals the table number: 1-RMS, 2-Peak, & 3-UnWeighted Peak.
Print Commands
Brackets in the syntax indicate optional characters.
<cr> = carriage return; <lf> = line feed
Syntax
Response
P[rint]print_no
<cr><lf>
Example: P1
Data Report is printed to computer.
P9
S177,1
S178,1
S192,1
P100
(1) sets all report enables in setup to [No]
(2) sets the Data report, Run-log, and EXCD report enables (short) to [Yes] and
(3) begins printing to the computer
Syntax
Description
P0
Standard Report (Formatted from normal setup settings 89-113)
P1
Data Report
P2
Data & Histograms
P3
Short Full Report (Histories with SHORT option)
P4
Long Full Report (Histories with LONG option)
C-44
System 814 User Manual
1/23/98
P9
All Report Enables Turned OFF
P 10
Select All except Histograms in Unformatted Style
P 11
Select All including Histograms in Unformatted Style
P 100
Begin Printing through current I/O command channel (See X100 Command)
P 101
Begin Printing through channel selected by ÒPrint CommandÓ
P 999
Abort Printing
X 100
XMODEM Begin Printing (same as P100 except through the XMODEM communication protocol) Use with UnFormatted Reports to download a Þle to be viewed in a spreadsheet program.
Also use this to download reports for printing on a computerÕs printer, rather than directly from
the 814; this lets reports to be printed on a nice laser printer connected to a computer without
having to disconnect it from the computer.
^X^X
CANcel transfer mode, 2 in a row (ASCII <CAN> or CHR$(24))
Error Messages and Warnings
The code listed is the number provided by R98.
All error messages begin with: CHR$(7), ÒERROR - Ó
Error Code
Message
1
ÒCOUNT OVERFLOWÓ
2
ÒEXPONENTIAL OVERFLOWÓ
3
ÒRTX TASK SELECTÓ
4
ÒILLEGAL EXCHANGE RATEÓ
5
ÒUNKNOWN INTERRUPTÓ
6
ÒWATCHDOG RESETÓ
7
ÒOPCODE ERRORÓ
All warning messages begin with: CHR$(7), ÒWARNING - Ò
Add 128 to these numbers to get the actual warning
number.
1/23/98
C -45
Warning
Code
Message
128
ÒOut of MemoryÓ
129
ÒBattery LowÓ
130
ÒPOWER FAILUREÓ
131
ÒDIVISION BY ZEROÓ
132
ÒOperand-1 RangeÓ
133
ÒOperand-2 RangeÓ
134
ÒDPC FormatÓ
135
ÒKey Has No EffectÓ
136
ÒStop RequiredÓ
137
ÒKey Has No Effect In ÒVIEWÓÓ
138
ÒSetting Entered WrongÓ
139
ÒRESET-ALL RequiredÓ
140
ÒUse ARROWS, (ON) to ExitÓ
141
ÒUse NEXT/PREV or ENTERÓ
142
ÒInvalid Numeric EntryÓ
143
ÒOPEN #Ó
144
ÒAlready OpenÓ
145
ÒNo History YetÓ
146
ÒAt End of HistoryÓ
147
ÒAt Start of HistoryÓ
148
ÒHistory Format ErrorÓ
149
ÒUnknown I/O CommandÓ
150
ÒI/O Operand InvalidÓ
151
ÒUnable to CalibrateÓ
152
ÒEEPROM Write ErrorÓ
C-46
System 814 User Manual
1/23/98
153
ÒMemory was Lost, Data Reset!Ó
154
ÒRECALL- Not FoundÓ
155
ÒFunction Not ImplementedÓ
156
ÒSystem LockedÓ
157
ÒA:D Stack FullÓ
158
ÒA:D Over-RunÓ
159
ÒSerial Port FramingÓ
160
ÒSerial Port Line NoisyÓ
161
ÒSerial Port Over-RunÓ
162
ÒWait for StabilizationÓ
163
ÒPower Turned OffÓ
164
ÒTime/Date Not Set!Ó
165
ÒPrinter Already BUSYÓ
166
ÒLithium Battery LowÓ
167
ÒTimer ON PendingÓ
Modem Control Mode
The modem control mode enables the Model 814 to
automatically dial out upon an exceedance or a low
memory condition. This mode also enables the Model
814 to answer the phone so that instructions can be
received. The modem must be Hayes (TM) compatible
and set to respond to commands using numeric codes
(non-verboses). Setup settings 154 to 157 control this
feature.
1/23/98
C -47
Modem Mode (154)
If the Modem Mode is [Yes], the Model 814 will dial
the Phone# on the events selected by the Dial Out
Mode deÞned below.
Dial Out Mode (155)
¥ None: The Model 814 will not dial a computer for
any reason.
¥ Excd: The Model 814 will dial a computer to report
when an illegal exceedance is logged into memory.
An illegal exceedance is when Excd Lmax > RMS
Excd Level 2 (setting 62).The phone will also be
dialed if the memory is low.
¥ Phone#: The valid characters in Phone# are those
recognized by the modem to which the Model 814
is attached and generally include:
W
will wait for another dial tone
P
selects pulse dialing
T
selects tone dialing
,
will pause dialing for 2 s
space or -
used to make the number more readable.
T9W 1-412-555-1212
indicates to use tone dialing, dial 9 for an
outside line, wait until the dial tone is
detected, and then dial the number.
Monitor Number
The monitor number is used to speciÞcally address the
monitor.
C-48
System 814 User Manual
1/23/98
814 Phone Dialing Procedure
The Model 814 dialing process is as follows:
Step 1 The Model 814 recognizes an exceedance or
low memory condition.
Step 2 The Model 814 asks the modem to dial the
phone number.
Example: 814:
1234(Enter)
Modem: 10(Enter)
ATDT
1-555-
Step 3 The modem informs the Model 814 that a
connection has been made. The Model 814
modiÞes its baud rate to that of the connected
modem. If the connection is unsuccessful, the
procedure is retried in 4 min.
Step 4 The Model 814 sends the following
announcement: Ò814: 814A0123:001:2Ó (enter),
where (0123) is the Model 814Õs serial number, (001) is the monitor number entered, and
(2) is a ßag: 1-Alarm 2-Exceedance 4-Low
Memory. More than one of these can be set at
a time, in which case x is the sum of all set
ßags.
Step 5 The Model 814 awaits a response code, which
should be: Ò814 A0123:11111111Ó (enter),
where (0123) is the Model 814Õs serial number
and (11111111) is the Lock Combination (setting 28) which is required whether or not the
Model 814 is currently locked. If the response
is incorrect, the announcement is resent. Four
chances are given to respond correctly. A Ò3
crÓ sequence will cause the Model 814 to hang
up.
Step 6 When a correct response is received, the
Model 814 indicates it is ready to send data
when requested with Ò814:ReadyÓ(enter).
1/23/98
C -49
Model 814 Answering Procedure
Step 1 The modem informs the Model 814 that a
connection has been requested; that is, the
phone is ringing.
Modem:2 (enter)
Step 2 The Model 814 answers the phone.
814: ATA (enter)
Step 3 The modem informs the Model 814 that a
connection has been made. The Model 814
modiÞes its baud rate to that of the connected
modem. If the connection is unsuccessful, the
procedure is retried in 4 min.
Modem: 10 (enter)
Step 4 The Model 814 sends the following
announcement: Ò814:814A0123:001:0Ó
(enter), where (0123) is the Model 814Õs serial
number, (001) is the monitor number entered,
and (0) is a ßag: 1-Alarm 2-Exceedance 4-Low
Memory. More than one of these can be set at
a time, in which case x is the sum of all set
ßags.
Step 5 The Model 814 awaits a response code, which
should be: Ò814A0123:11111111Ó (enter),
where (0123) is the Model 814Õs serial number
and (11111111) is the Lock Combination (setting 28) which is required whether or not the
Model 814 is currently locked. If the response
is incorrect, the announcement is resent. Four
chances are given to respond correctly. A Ò3
crÓ sequence will cause the Model 814 to hang
up.
Step 6 When a correct response is received, the
Model 814 indicates it is ready to send data
when requested with Ò814: ReadyÓ (enter).
Unsupported Miscellaneous Commands
NOTE: Use of these commands is up to the discretion of the programmer, they are considered undocumented and unsupported.
Larson¥Davis makes NO warranties for their proper operation
C-50
System 814 User Manual
1/23/98
and is unable to support them with further documentation or
through customer support. They are used by proprietary Larson¥Davis software and are documented here on an as-is basis for
those who may desire to explore, unaided, these advanced features.
The operation of these commands is subject to change
without notice of any kind.
X 16x
XMODEM binary data dump, x = bit ßags;
Add 1 to 'x' to automatically reset histories at completion of transfer
Add 2 to 'x' to inhibit the pause just before sending
OverAll data (the pause provides for cohesive data)
Add 4 to 'x' to begin where last download ended (always starts at the beginning of stored data if not
set)
Add 8 to 'x' to disable waiting for acknowledgment at the end of each block transfer (used with
error checking modems, i.e. MNP 4 or V.42)
Add 16 to enable the Xmodem download at 57.6 kilobaud (Comm. Port 1 ONLY). The resulting
binary Þle structure is undocumented and unsupported.
The advantages of the binary features can be obtained by utilizing Larson¥Davis software (turnkey
application, data translators or function library support is available).
^X^X
CANcel transfer mode, 2 in a row (ASCII <CAN> or CHR$(24)).
>a,b
Read 814's memory from address (a) and bank (b)
^
Read Excd T.H. Buffer. This command is used to create an SPL vs. Time plot that is time cohesive.
Resolution is, by default, 1 dB with one byte/sample being sent. Each byte has 32 added to it to
avoid confusion with ASCII control codes, subtract 32 to use. Only the samples taken since the last
read are sent, up to the buffer size of 128 samples. The time of day is appended to the end of the
string to permit time stamping of the SPL graph. A delimiter byte (ASCII 212 in decimal, which is
the letter ÒTÓ with 128 added to it) precedes the time string.
Full resolution including the fractional part of the level is sent if enabled by the M9,1 command.
With full resolution, 2 bytes per level are sent. The Þrst byte being the integer portion, which is the
same as described above. The second byte is the fractional portion. it is converted by subtracting
32 from the byte and then dividing it by 128 to make it a fraction. The fractional part is then added
to the integer part to form the level.
@
Enable IO Error Check Scheme. S205,0F or 2 <CR> in a row to disable.
Data File Commands
The &F I/O command reads out information about
stored data or FILES and has facilities to store and
recall Þles. These work in conjunction with Advance,
Backup and Find to navigate through the File records
of this history (just like Intervals).
1/23/98
C -51
&F1
FILE NAME
cccccccc
&F2
FILE EXTENSION (InstType)
ccc
&F3
FILE DESCRIPTION
cccccccccccccccccccccccccccccc
&F4
CURRENT START TIME
ddmmyy hh:mm:ss
&F5
CURRENT END TIME
ddmmyy hh:mm:ss
&F6
OVERALL START TIME
ddmmyy hh:mm:ss
&F7
OVERALL END TIME
ddmmyy hh:mm:ss
&F8
SIZE OF FILE
nnnnnnn
&F101
Read all &F variables in one macro
&F102
Recall a FILE into active memory
&F103
Store the current data (in active memory) to a FILE
Name restrictions & conventions for IDs (Instrument Definitions)
WARNING!
The commands documented below are for internal
use, programming support/assistance is unavailable
Name format: Òcccccccc.cccÓ The Þrst 8 characters form
the name and the last three are the extension that indicate the instrument type and can be
OBA, SSM, SLM, or ENV for the 814 or SSA, SSM,
SLM, ENV, RTA, FFT, AUD, and INT for the 824. The
name does not have to be a full 8 characters long. The
extension is optional; if it is not provided the Þrst
occurrence of the name will be used -- this may not be
the desired instrument deÞnition if there is a naming
ambiguity.
Leading spaces and symbols will be removed from a
name. Case is preserved but ignored when Þnding
names. Embedded spaces will be converted to underscore. The name should start with a letter or number.
The characters generally used in a name are A to Z, 0 to
9, and _ - (underscore, and dash). The name ends
when a dot (.) or <CR> is encountered.
C-52
System 814 User Manual
1/23/98
The allowed characters in names for IDs is compatible
with DOS. The following characters are NOT allowed:
Ò* + , . / : ; < = > ? [ \ ] |
Directory Listing requests can have the Ò*Ó wild card
for either the end of the name or as the extension, i.e.
Òde*.*Ó, Òdemo.*Ó, Ò*.obaÓ.
Instrument Definition (ID) commands
I/O error checking is required!
Syntax: &In,Þlename
where n is the number from 1 to 8
where Þlename is as described above
&I1 Directory of IDs
Will send a listing of ID(s) as speciÞed by the name given, ambiguous Þle names
are allowed.
&I2 Recall ID
Will take a stored ID (speciÞed by the name given) and copy it to the ÒactiveÓ settings.
&I3 Store ID
Will send speciÞed ID(s) to the computer. Ambiguous Þle names are allowed.
&I4 Download ID
Will take the ÒactiveÓ settings a copy (store) them to the ID named.
&I5 Upload ID
Will receive the speciÞed ID from computer and overwrite an existing ID by that
name or create a new one. If an ID Type extension is not provided or the ID Type
in the Uploaded data is not the same it is possible to create two IDs with the same
name; care in the programming of the software is needed to avoid this conßict.
&I6 Delete ID
Will delete the speciÞed ID. The only ambiguous name allowed is Ò*.*Ó to delete
all IDs.
&I7 Make ID Read Only
Will mark the speciÞed ID as read-only (cannot be over-written or deleted),
ambiguous Þle names are allowed.
&I8 Make ID Read/Write
Will mark the speciÞed ID as read-write (can be over-written or deleted), ambiguous Þle names are allowed.
1/23/98
C -53
Sending Binary Data to the 814
When sending binary data to the 814, it is sent in a speciÞc format and protocol: Computer sends command
(such as upload ID, the ÔcÕ represents the check character):
&I5c<CR>The 814 sends notiÞcation that the command was received and understood:
Send Binary!c<CR><LF>
814 Sends Not Acknowledge to request a block:
<NAK><Block><not Block><$ff>
Computer sends data block (one of many):
<STX><length><block><...data
bytes...><CRC><CR>
814 Sends acknowledge if the block was received OK:
<ACK><Block><not Block><0>
to request the next block or the 814 Sends Not
Acknowledge if there was an error:
<NAK><Block><not Block><$ff>
to request the block be resent.
When all that are needed have been received then a
concluding acknowledge or a concluding Not
Acknowledge block is sent; these do not have a block
number but rather a null or an error number respectively:
<ACK><0><0><0>
or
<NAK><ErrNum><ErrNum><$ff>
C-54
System 814 User Manual
1/23/98
please note that if the block number and not block
number bytes of the NAK block are the same then this
is a concluding NAK block indicating that there was an
error. These errors are command dependent:
#1
;Revision Num Wrong for all commands &I5, & &S1 to 3
#2
;Block length error for all commands &I5, & &S1 to 3
#3
;setting error for command &I5
#3
;Cal. Block CRC error for command &S1
Once a concluding ACK block is received the command is done, once a concluding NAK block is
received the process is restarted at the top by NAKing
the zero block again. The number of retries is 5.
If the 814 receives <CAN> (ascii 24) instead of <STX>
it will abort the command and restart IOP Task.
Data Block format
<STX><1 byte length><block #><...data
bytes...><2 byte CRC><CR>
<STX> is ASCII 2, or chr$(2)
<length>
is one byte indicating the number of bytes in this record,
which includes all byte from <STX> to <CR>.
<block>
is a one byte block number starting at 0 and incrementing
with each acknowledged block.
<CRC>
is the 16 bit (2 byte) CRC using XMODEM's standard calculation
<CR>
is Enter, carriage return, ascii 13 or chr$(13) (whatever)
<NAK>
is Not Acknowledge or ascii 21
<ACK>
is Acknowledge or ascii 6
<$ff>
is character 255, chr(255)
There is a limit on the length of data that can be
received by the instrument of 64 bytes total (which is
the receive buffer length). 32 bytes is the recommended
record length for data sent to the 814.
1/23/98
C -55
ID upload
The structure for each directory entry is:
<STX><length>nnnnnnnn.eee
dddddddddddddddddddddddddddddd
pra<crc><cr>
where:
nnnnnnnn
is the 8 character name (padded on right with spaces)
eee
is the instrument type Extension (i.e. OBA)
dddddddddddddddddddddddddddddd
is the 30 character description of the ID
p
is the Permanent ROM ID ßag (space or ÒPÓ)
r
is the read-only ßag (space or ÒRÓ)
a
is the Reachieve ßag (space or ÒAÓ) meaning that it
needs to be uploaded into the computer.
followed by the number of directory entries sent:
<STX><length>b<crc><cr>
NOTE: If there is a name error, a name error is reported and the
receive binary mode is never entered. If there are no empty ID slots
and error is reported and command aborts. If after the data is
received and more data is received than is needed or if the revision
number is wrong, a setting error is reported.
ID Structures
C-56
For the structure deÞnition refer to ÒMeasurement SettingsÓ (Section C) in Ò814_doc.adÓ (internal documentation only). The ID is 512 bytes long (The Setting
Structure Revision Number is not a part to the 512 byte
ID but precedes it in the Upload data structure). The
structure deÞnition mentioned Þlls up the Þrst 130
bytes. The remaining bytes are RESERVED (much will
be for a full screen instruction sheet to describe how to
use the setup). The last two bytes (511 and 512) are a
CRC of the ID.
System 814 User Manual
1/23/98
Receiving binary data from the 814
To allow faster and more robust setting options from
the computer, a binary I/O format has been established. There are 2 forms, one for short strings (less
than 256 bytes) and one for long strings (256 bytes or
more). The short format is used for 814 output and
input, the long format is only used by the 814 to output
data.
When receiving binary data from the 814, it is sent in a
speciÞc format (the ID directory command is an example of one that sends binary data):
The computer sends the command (such as ID directory command, the ÔcÕ represents the check character):
&I1c<CR>
The 814 sends notiÞcation that the command was
received and understood:
Recv Binary!c<CR><LF>
Then the 814 send the binary data blocks (1 or more):
<STX><length><block><...data
bytes...><CRC><CR>
<STX><length><block><...data
bytes...><CRC><CR>
<STX><length><block><...data
bytes...><CRC><CR>
For long blocks of data the record structure is varied:
<SOH><length><block><...data
bytes...><CRC><CR>
<SOH> is Start of Header (ascii 1) and the length is
now 2 bytes long.
Followed by the termination block:
1/23/98
C -57
<STX><length><block><number of blocks
sent><CRC><CR>
The data portion is a structure dependent upon the
particular type of data being transferred. See the Þle
Ò814equ_p.aiÓ for details.
The Binary Query and Set commands (&Q and &S)
allow the downloading and uploading of binary setting data.
The &Qx command will Query various binary data
blocks in the form described above. The 3 Query commands (&Q1 to &Q3) pair directly to 3 Set commands
(&S1 to &S3) and are:
&Q1
Query Calibration Block command
&Q2
Query System Settings Block command
&Q3
Query Measurement Settings Block
&S1 – Set Calibration Block command
The Calibration block is 128 bytes long. The last 2
bytes are a 16-bit CRC calculated from the Þrst 126
bytes using the same algorithm as XMODEM except
that it has an initial seed of $CA53. This is to provide
security against accidental calibration changes and to
detect further communications and software errors.
For the structure deÞnition refer to ÒCalibration SettingsÓ in Ò814_doc.adÓ
&S2– Set System Settings Block command
The System Settings can be controlled with this command. This would include the 3 lines of Name that
appear on reports, the baud rate and other system settings.
C-58
System 814 User Manual
1/23/98
For the structure deÞnition refer to ÒSystem SettingsÓ
in Ò814_doc.adÓ
&S3 – Set Measurement Settings Block
The Measurement Settings, for each instrument type,
can be set with this command.
For the structure deÞnition refer to ÒMeasurement SettingsÓ in Ò814_doc.adÓ
Keyboard Simulation
The keys on the 814's keyboard may be simulated with
the ÔKÕ I/O command.
Each key is given an ASCII character as shown in the
table below. To simulate the repeat value that is generated by varying the force on the keys:
Send the tilde character Ô~Õ followed by the number of
key steps to move in the form of one ASCII character
starting at space (Ò Ó or ASCII 32). For example if steps
of 4 are desired for the left arrow, send ÒK ~$7Ó. The
dollar sign #Ó is the space character plus 4 and the 7
key is the left arrow.
ASCII Character:
Key that is simulated:
1/23/98
0
CHECK KEY
1
POWER KEY
2
RESET KEY
3
PAUSE KEY
4
RUN/STOP KEY
5
UP ARROW
6
DOWN ARROW
C -59
7
LEFT ARROW
8
RIGHT ARROW
9
FUNCTION KEY #1 (VIEW)
:
FUNCTION KEY #2 (DATA)
;
FUNCTION KEY #3 (SETUP)
<
FUNCTION KEY #4 (TOOLS)
=
FUNCTION KEY #5 (PRINT)
Creating Bitmap of 814 Screen
The 814Õs LCD screen can be extracted by I/O command ÒO4Ó.
The data comes out as a binary string with the format
of:
<SOH><HIGH_COUNT><LOW_COUNT><type><...
1024_data_bytes...><CHKSM><CR>
The 1024_data_bytes are the pixels of the screen with 8
pixels per byte organized in 8 rows of 128 bytes. The
byte is vertically oriented with the lsb (least signiÞcant
bit) as the top pixel. The Þrst byte is the top left corner
of the screen and proceeds from left to right for each
row successively.
Operation Notes
Step 1 When using the Logic Input line in the
ÔLEVELÕ mode both I/O and keyboard Runs
and Stops are inhibited. If the line is High the
814 takes data and if the line is Low no data is
taken. The ÔPauseÕ mode will pause the data
taking process while the line is high; this may
be triggered by high wind speed. In the ÔTogC-60
System 814 User Manual
1/23/98
gleÕ mode when the Logic Input line goes
high the 814 toggles between RUN and STOP
modes.
Step 2 An LDL (Logged Data Logic) recalculation
can be started with an _LDLVALID I/O Read
Command. When the 814 is RUNNING the
Valid condition will remain in effect for 1 second. The _LDLVALID Read Command provides three responses:
ÒLDL Valid Ò, ÒCalculatingÓ, and ÒLDL
InvalidÓ.
1/23/98
C -61
C-62
System 814 User Manual
1/23/98
APPENDIX
D
Technical SpeciÞcations
SpeciÞcations are subject to change without notice.
Numerical values given are typical. Refer to speciÞc
calibration or test results for accurate data on a speciÞc
unit.
System 814 Main Characteristics:
¥ Type 1 Precision Integrating Sound Level Meter with integrated, autoscanned
1/1 and 1/3 Octave Filters (optional)
¥ 256KB standard memory (512KB, 1.25MB and 2MB optionally available)
¥ Large backlit graphic display (64 X 128 pixels)
¥ Icon-driven graphic user interface
¥ Soft rubber backlit keys
¥ Large dynamic range
¥ RMS Detectors: Slow, Fast, Impulse
¥ Dual Peak Detectors: weighted/(ßat or C-weighted)
¥ Interval History (statistical)
¥ Time History
¥ Ln statistics (L0.01 through L99.9 available)
¥ Histogram tables
¥ Direct report printouts to laser printer
¥ WindowsTM-based software for setup, control, and high speed data download
and reporting
¥ Advanced WindowsTM-based software packages (optional) provide remote
operation via modem, secured modem access, data archiving/search
capabilities, post-measurement analysis features, and advanced sorting and
graphics/report generation tools.
¥ Multi-tasking processor allows measuring while viewing data, transferring
data, or printing
¥ Programmable Run/Stop timer for automatic measurements
¥ AC/DC outputs to recorder
¥ Field-upgradable Þrmware: keeps instrument current with the latest features
via ROM disk upgrades
¥ Two-year limited warranty
Analog Filters (Optional)
1/20/98
OPT 30: 1/3 Octave Filters
31.5Hz - 8kHz (9 Þlters)
OPT 31: 1/1 and 1/3 Octave Filters:
1/1 Octaves 31.5Hz - 16kHz (10
Þlters)
1/3 Octaves 2Hz - 20kHz (30 Þlters)
D-1
Time Weighting
Response:
Slow, Fast, Impulse
Frequency Weighting
RMS:
A, C, Flat (20Hz - 20kHz)
Peak-I:
C, Flat (20Hz - 20kHz)
Peak-II:
same as RMS
FLAT Frequency Response
Nominal
Frequency
Hz
FLAT
Nominal
Weighting Frequency
dB
Hz
FLAT
Nominal
Weighting Frequency
dB
Hz
FLAT
Weighting dB
10
-11.6
250
0.0
6300
0.0
12.5
-7.8
315
0.0
8000
0.0
16
-4.3
400
0.0
10000
0.0
20
-1.7
500
0.0
12500
0
25
-0.5
630
0.0
16000
-0.2
31.5
-0.1
800
0.0
20000
-1.0
40
0.0
1000
0.0
25000
-4.1
50
0.0
1250
0.0
31500
-7.4
63
0.0
1600
0.0
80
0.0
2000
0.0
100
0.0
2500
0.0
125
0.0
3150
0.0
160
0.0
4000
0.0
200
0.0
5000
0.0
Measuring Ranges
The measurement range extends from the level corresponding to
overload down to the level at which the differential linearity is no
longer within IEC and ANSI Type 1 tolerances. These data are typical for use with the Model 2541 or 2560 high sensitivity microphone
(47.5 mV/Pa).
Measuring Range, RMS detection
Frequency Weighting High Range
D-2
Normal
Range
Low Range
Noise Floora
9dB
A-weight broadband
44Ð149dB
24 Ð129dB
18Ð109dB
C-weight broadband
44Ð149dB
24 Ð129dB
25Ð109dB
13dB
Flat (20HzÐ20kHz)
47Ð149dB
27 Ð129dB
25Ð109dB
15dB
31.5Hz octave band
60Ð148dB
40 Ð128dB
23Ð108dB
10dB
63Hz octave band
53Ð148dB
33 Ð128dB
20Ð108dB
8dB
125Hz octave band
53Ð148dB
33 Ð128dB
21Ð108dB
7dB
250Hz octave band
54Ð148dB
34 Ð128dB
20Ð108dB
7dB
500Hz octave band
54Ð148dB
34 Ð128dB
18Ð108dB
6dB
1Hz octave band
55Ð148dB
35 Ð128dB
19Ð108dB
6dB
2Hz octave band
58Ð148dB
38 Ð128dB
19Ð108dB
7dB
4Hz octave band
60Ð148dB
40 Ð128dB
20Ð108dB
8dB
8Hz octave band
61Ð148dB
41 Ð128dB
22Ð108dB
10dB
System 814 User Manual
1/20/98
a. Electrical Noise ßoor for Low Range
Dynamic Range > 110 dB
The dynamic range extends from the level corresponding to overload down to the A-Weighting electrical
noise ßoor of the instrument. Test is performed in normal range.
Peak Measuring Range (General)
The peak measurement ranges extend from the level corresponding to overload
down to the level at which the linearity error exceeds ±0.7dB.
Rise Time:
< 25 microseconds
Peak-I Measuring Range
(Peak-I detector frequency weighting is selected independent from
the RMS weighting.)
Frequency Weighting
High Range
Normal Range Low Range
C-weighted; 1kHz
73Ð152dB
53 Ð132dB
C-weighted; 8kHz
95Ð152dB
75 Ð132dB
54 Ð 112dB
Flat (20HzÐ20kHz); 1kHz
71Ð152dB
51 Ð132dB
46 Ð 112dB
Flat (20HzÐ20kHz); 8kHz
94Ð152dB
72 Ð132dB
50 Ð 112dB
41 Ð 112dB
NOTE: Data are presented for both 1kHz and 8kHz because the linearity range
for this detector decreases with increasing frequency.
Peak-II Measuring Range
(Peak-II detector frequency weighting is the same as the RMS
weighting.)
Frequency Weighting
High Range
Normal Range Low Range
A-weighted
68Ð152dB
48 Ð132dB
41 Ð 112dB
C-weighted
67Ð152dB
47 Ð132dB
41 Ð 112dB
Flat (20HzÐ20kHz)
67Ð152dB
47 Ð132dB
44 Ð 112dB
Broadband Data Acquisition Features
Interval History (automatic logging)
Logged values:
Lmax, Lmin, Lpk-I, Lpk-II, SEL
Leq (q=3dB) or TWA (q=4, 5, or 6dB)
Other logged quantities:
Six Ln values with 0.1dB resolution (as
per user-entered percentiles with
0.01% resolution)
Time duration of interval
Logging time intervals:
1/20/98
1 second to 99 hours (hh:mm:ss)Ñuser
selected
D -3
Time History (automatic logging)
Logged Parameters:
Leq and either Lmax, Lpk-I or Lpk-II
Logging time intervals:
1/32 seconds to 255 minutesÑuser
selected
Histograms
Bin resolutions (user selectable):
RMS level, Lpk-I and Lpk-II
Statistical Measurements:
Number of samples, Percent of total,
and Elapsed time for each bin*.
*Each of these measurements are also available for all levels greater
than or less than the current bin.
Noise Exposure
Methods:
Sound exposure (E) in Pa2Hr or dose
and projected dose in %
Exchange rates:
3, 4, 5 or 6dB
Spectral Measurement Features
(Available only with optional 1/1 and 1/3 analog octave band Þlters
¥ Automatic scanning through Þlters using constant conÞdence averaging times.
¥ Scan using complete or limited set of contiguous Þlters.
¥ Minimum Scan time through octave bands: 20s.
¥ Scan repeats until stopped manually.
¥ Timed automatic scan, stops after user-programmed time interval.
¥ Manual scanning through Þlters, dwell time in each Þlter user-controlled.
¥ Interval Time History mode.
¥ Similar to automatic scan mode, averaged spectra are stored sequentially at
regular time intervals (1 minute - 99 hours).
¥ Interval History can be displayed as a sequence of spectra or by frequency
band in a level versus time format.
¥ Full spectrum presentation on graphic LCD display, each band updated as new
spectral data are obtained.
¥ Digital indication of level and frequency in either a selected frequency band or
the frequency band being scanned.
¥ A second digital indication of the level and frequency of a marked frequency
band.
Outputs
The output impedance is 600 Ω for both the Analog AC output and
the Analog DC output of the System 814. For minimal error use
instruments with $ 100 kΩ input impedance when making AC or
DC output measurements.
D-4
System 814 User Manual
1/20/98
Analog AC Output
Frequency weighting:
Flat or same as RMS detector
weightingÑuser selected
Gain:
Ð6dB to +20dBÑmanual adjustment
(see speciÞcations below)
Output Impedance
600
Lower limit:
The input level for which the total
harmonic distortion of the AC output
exceeds 1% over the frequency range
31.5Hz - 8kHz
Upper limit:
The input level corresponding to
overload.
Ω
Analog AC Output Range
Gain Settings
High Range
Normal Range
Low Range
-6dB
64 Ð 149dB
44 Ð129dB
30 Ð 110dB
+20dB
68 Ð 128dB
48 Ð108dB
33 Ð 88dB
Analog DC output
Generated digitally from the CPU to be proportional to SPL or Leq
(user-selected)
Ω
Output Impedance:
600
Voltage Range:
0 to 3 volts
Serial Digital Output
Type:
RS-422 (RS-485 and RS-232
compatible) multi-drop interface for
computer, modem, and printer
communication
Baud Rate:
Up to 115.2KB
Modem capabilities:
Security feature and autodial out
available with optional Þrmware
package
Computer Interface Cable:
Use LD part #CBL006
Standards
Sound Level Meter
Conforms to ANSI S1.4-1983 Type 1
Conforms to IEC 651-1979 Type 1
Conforms to IEC 804-1985 Type 1
1/20/98
D -5
Electromagnetic Compatibility
Pursuant to the standards route to compliance of the Electromagnetic
Compatibility Regulations 1992, as amended by the Electromagnetic
Compatibility (Amendment) Regulations 1994, Larson Davis, Inc.
certiÞes that the following relevant apparatus:
Model 814 Sound Level Meter
has been tested in representative conÞguration with:
PRM904 preampliÞer and 2560 microphone
in relation with the following applicable EMC standards:
BS EN 50081-1:1992 Electromagnetic compatibility - Generic emission
standard, Part 1. Residential, commercial and light industry
BS EN 50082-1:1992 Electromagnetic compatibility - Generic immunity
standard, Part 1. Residential, commercial and light industry
and when used in accordance with the intended purpose as contained in its
instruction manual, including: a) measurements may be performed with
connection to PC, b) for battery operation only and c) no exposure to
electromagnetic Þelds exceeding those speciÞed in listed immunity
standard(s) as may for example occur within 1m of hand held radio
transmitting equipment, or near other RF generating equipment such as
RF sealers, welders, etc.
has been found to conform with the general protection requirements of
Council Directive 89/336/EEC on the approximation of the laws of the
Member States relating to electromagnetic compatibility. Issued in the
United Kingdom.
ManufacturerÕs SpeciÞcation for Acceptable Level of Performance
The Model 814 Sound Level Meter equivalent SPL deviation limits under
the above immunity test conditions would be within (0.5 dB of nominal
level for Lavg greater than 25, Lmax greater than 25 and Lpeak greater than
40 dB A-weighted (fast detector).
Reference Data
Reference Level and Frequency
Reference Level:
114.0 dB SPL
Reference Frequency
1000 Hz
Reference Direction
Free Field Microphone in Free Field:
The microphone should be pointed
directly at the source.
Random Incidence Microphone in a
Free Field:
The microphone should be pointed 80
degrees off axis of the source of the
sound.
Random Incidence Microphone in a
Random Field:
The microphone may be pointed in any
direction.
Positioning of Instrument and Observer for Best
Measurements
Measurements can be made with the System 814 held in one hand,
with the arm extended away from the body; however, better measurements can be made with the System 814 placed on a tripod.
Microphone Polarization Voltage
The microphone polarization voltage can be set to 0, 20, or 200 volts.
The voltage is controlled using the Transducer and Range settings.
D-6
System 814 User Manual
1/20/98
Stabilization Time
The System 814 will not proceed to a running condition until it is
allowed to stabilize. At power-on, with a condenser microphone, the
stabilization time is approximately 45 seconds. With an electret
microphone or with a direct input, the stabilization time is required
when changing to and from the High range.
A short stabilization time (less than 10 seconds) is also invoked
when certain settings (Weighting, Detector, etc.) are changed.
Microphone Electrical Impedance
The following adapters should be substituted for the microphones
listed, when performing electrical tests on the System 814
LD
Condenser
Microphone
Microphone Capacitance
LD Microphone Adapter
1/2Ó
18 pf
ADP005
1/4Ó
6.8 pf
ADP002
1Ó
47 pf
ADP006
Mechanical Specification
Dimensions
Dimension
Without preamp & mic
With preamp & mic
Length
9.9 inch (25.1 cm)
14.6 inch (37 cm)
Width
3.4 inch (8.6 cm)
3.4 inch (8.6 cm)
Depth
1.6 inch (4.0 cm)
1.6 inch (4.0 cm)
Power
Internal
Internal Batteries:
Three AA cells, Alkaline
Operating Time:
> 24 hours
External
1/20/98
Voltage Range:
8 to 15 Vdc
Reference Frequency:
Without backlight < 80 mA
With backlight < 200 mA
Connector:
5.5 mm x 2.5 mm coaxial power plug
Fuse:
0.5 A internal (not user serviceable)
AC Power Adapter:
For 115 Vac use LD part# PSA017
For 220 Vac use LD part# PSA002
D -7
Resolution
Levels:
0.1 dB (0.01 dB via I/O)
Dose:
0.01%
Elapsed Time:
0.1 seconds
Elapsed Time Format:
hhhhh:mm:ss.s
Real Time Clock Resolution:
1 second
Real Time Clock Format
hh:mm:ss (24 hour, midnight is
00:00:00)
100 year calendar
01Jan1996 through 31Dec2095
Environmental
o
o
o
Effect of temperature:
<±0.5 dB
o error, -10 C to 50 C (14 F
to122 F)
Effect of humidity:
<± 0.5odB error, 30 to 90% RH at 40 C
(104 F)
Operating:
-10 C to 50 C (14 F to 122 F)
Storage:
o
o
o
o
o
o
o
o
o
-10 C to 60 C (14 F to 140 F)
Included Accessories
Larson-Davis 1/2Ó microphone (one of: 2540, 2541, 2559, or 2560)
PRM904 1/2Ó microphone preampliÞer
CBL002 serial printer cable; 6 foot with 25-pin D connector
CBL006 serial interface cable; 10 foot with 9-pin D connector
CBL042 AC/DC output cable; 5 foot with 2 x BNC connectors
WS001 3 1/2Ó windscreen
PSA017 DC power supply; 9Vdc/500 mA from 115 Vac/60 Hz (US only)
Hand strap
3 x AA batteries, Alkaline
Hard shell carrying case, CCS001, 32 cm x 39 cm x 18 cm (12 1/2Ó x LLL 15 1/
4Ó x 7Ó)
Available Options
Larson-Davis 1Ó air condenser microphone; ADP008 adapter required.
Larson-Davis 1/4Ó air condenser microphone; ADP011 adapter required.
EXLXXX microphone extension cable; 5-pin LEMO connectors (maximum
cable length, for Type 1 response to maximum signal levels, is 20 feet)
CAL200 sound level calibrator
CAL250 sound level calibrator
D-8
System 814 User Manual
1/20/98
APPENDIX
E
Glossary
This appendix contains technical deÞnitions of key
acoustical and vibration terms commonly used with
Larson¥Davis instruments. The reader is referred to
American National Standards Institute document S1.11994 for additional deÞnitions. SpeciÞc use of the
terms deÞned are in the main body of the text.
Allowed Exposure Time (Ti)
It is the allowed time of exposure to sound of a constant A-weighted sound level given a chosen Criterion
Level, Criterion Duration, and Exchange Rate. The
equation for it is
Tc
Tc
T i = ----------------------------------------- = ------------------------(L
– Lc ) ⁄ Q
(L
–
2 avg
10 avg
where Lc is the Criterion Level, Tc is the Criterion
Duration, Q is the Exchange Rate, K is the Exchange
Rate Factor and Lavg is the Average Sound Level.
Example: If Lc = 90, Tc = 8, Q = 3 and Li = 95 then
8
8
= -------------------------- = 5.656 = 5 hours and 39 minutes
-----------------------------( 95 – 90 ) ⁄ 10( 95 – 90 ) ⁄ 3
2
10
This means that if a person is in this area for 5 hours
and 39 minutes he will have accumulated a Noise Dose
of 100%.
Standard: ANSI S12.19
Average Sound Level (Lavg)
1/23/98
It is the logarithmic average of the sound during a
Measurement Duration (speciÞc time period), using
the chosen Exchange Rate Factor. Exposure to this
sound level over the period would result in the same
noise dose and the actual (unsteady) sound levels. If
E-1
the Measurement Duration is the same as the Criterion
Duration, then Lavg=LTWA(LC)
L avg
T2
( L (t)) ⁄ q
1
d
= qLog 10 --- 10 p
T
T1
∫
where the Measurement Duration (speciÞed time
period) is T=T2-T1 and q is the Exchange Rate Factor.
Only sound levels above the Threshold Level are
included in the integral. Standard: ANSI S12.19
Calibration
Adjustment of a sound or vibration measurement system so that it agrees with a reference sound or vibration source. It should be done before each set of
measurements.
Community Noise Equivalent
Level (CNEL, Lden)
A rating of community noise exposure to all sources of
sound that differentiates between daytime, evening
and nighttime noise exposure. The equation for it is
1900
10
( L + 10 ) ⁄ 10
i
+
∑
2200
10
L ⁄ 10
i
0700
+
∑
1900
2400
10
( L + 5 ) ⁄ 10
i
+
∑
10
( L + 10 ) ⁄ 10
i
2200
The continuous equivalent sound level is generally calculated on an hourly basis and is shown in the equation as L. The levels for the hourly periods from
midnight to 7 a.m. have 10 added to them to represent
less tolerance for noise during sleeping hours. The
same occurs from 10 p.m. to midnight. The levels for
the hourly periods between 7 p.m. and 10 p.m. have 5
added to them to represent a lessened tolerance for
noise during evening activities. They are energy
summed and converted to an average noise exposure
rating.
Criterion Duration (Tc)
E-2
It is the time required for a constant sound level equal
to the Criterion Level to produce a Noise Dose of
100%. Criterion Duration is typically 8 hours.
Example: If the Criterion Level = 90 dB and the Criterion Duration is 8 hours, then a sound level of 90 dB
for 8 hours, will produce a 100% Noise Dose. See Noise
Dose. Standard: ANSI S12.19
System 814 User Manual
1/23/98
Criterion Sound Exposure
(CSE)
The product of the Criterion Duration and the mean
square sound pressure associated with the Criterion
Sound Level when adjusted for the Exchange Rate. It is
expressed in Pascals-squared seconds when the
exchange rate is 3 dB.
where q is the Exchange Rate Factor. See Exchange
Rate.
CSE = T c 10
Lc ⁄ q
Standard: ANSI S1.25
Criterion Sound Level (Lc)
It is the sound level which if continually applied for
the Criterion Duration will produce a Noise Dose of
100%. The current OSHA Criterion Level is 90 dB.
Standard: ANSI S12.19
Daily Personal Noise Exposure
(LEP,d)
It is the level of a constant sound over the Criterion
Duration that contains the same sound energy as the
actual, unsteady sound over a speciÞc period. The
period is generally shorter, so the sound energy is
spread out over the Criterion Duration period.
Example: If the Criterion Duration = 8 hours and the
speciÞc period is 4 hours and the average level during
the 4 hours is 86 dB, then the LEP,d = 83 dB.
Day-Night Average Sound
Level (DNL, Ldn)
A rating of community noise exposure to all sources of
sound that differentiates between daytime and nighttime noise exposure. The equation for it is
0700
= 10 Log
10
∑
0000
2200
10
( L + 10 ) ⁄ 10
i
+
∑
0700
2400
10
L ⁄ 10
i
+
∑
10
( L + 10 ) ⁄ 10
i
2200
The continuous equivalent sound level (See deÞnition)
is generally calculated on an hourly basis and is shown
in the equation as L. The values for the hourly periods
from midnight to 7 a.m. have 10 added to them to represent less tolerance for noise during sleeping hours.
The same occurs from 10 p.m. to midnight. They are
energy summed and converted to an average noise
exposure rating.
1/23/98
E -3
Decibel (dB)
A logarithmic form of any measured physical quantity,
typically used in sound and vibration measurements.
Whenever the word level is used it implies this logarithmic form. The relationship is relatively simple, but
the mathematics can become complex. It is widely
used and was developed so that the very wide range of
any quantity could be represented more simply. It is
not possible to directly add or subtract physical quantities when expressed in decibel form. The word level
is always attached to a physical quantity when it is
expressed in decibels; for example Lp represents the
sound pressure level. The table below shows the actual
value of a speciÞc item, such as sound pressure, for
which the level is to be determined. First the value is
put into exponential form in powers of ten; the exponent is the Bel. The exponent is then multiplied by ten
to yield the decibel. This procedure converts multiplication into addition; every time 10 is added to the level,
the value is multiplied by 10. When the value is not a
even multiple of ten the exponent is more complicated
as shown in the table. Every time the level increases by
3 dB, the value is multiplied by 2 (doubled). These
two rules are worth remembering.
Linear form
Ration of Value to Reference
1
10
100
200
1000
10000
100000
1000000
Exponential Form
of Ratio
100
101
102
102.3
103
104
105
106
Level form
10¥Exponent
0
10
20
23
30
40
50
60
The deÞnition of decibel is intended for power-like
quantities (W). Sometimes power is represented by the
square of a measured quantity and this results in a different form of the equation (See Sound Pressure Level).
W
L = 10Log 10 ------W0
E-4
System 814 User Manual
W = W 0 10
L ⁄ 10
1/23/98
The value of the item in the table is not the value of the
quantity itself but the ratio of that quantity to a reference quantity. So for every level in decibels there must
be a reference quantity. When the quantity equals the
reference quantity the level is zero. To keep the values
above zero, the reference is generally set to be the lowest value of the quantity.
Department of Defense Level
(LDOD)
The Average Sound Level calculated in accordance
with Department of Defense Exchange Rate and
Threshold Level. See Average Sound Level
Dose
(See Noise Dose)
Detector
The part of a sound level meter that converts the actual
ßuctuating sound or vibration signal from the microphone to one that indicates its amplitude. It Þrst
squares the signal, then averages it in accordance with
the time-weighting characteristic, and then takes the
square root. This results in an amplitude described as
rms (root-mean-square).
Eight Hour Time-Weighted
Average Sound Level (L TWA(8))
It is the constant sound level that would expose a person to the same Noise Dose as the actual (unsteady)
sound levels. The equation for it is
D
L TWA ( 8 ) = L c + qLog 10 ---------
100
NOTE: This deÞnition applies only for a Criterion
Duration of 8 hours.
Standard: ANSI S12.19
Energy Equivalent Sound Level
(Leq)
The level of a constant sound over a speciÞc time
period that has the same sound energy as the actual
(unsteady) sound over the same period.
∫
T2 2
p ( t ) dt
T1
L eq = 10Log 10 --------------------------2
po T
1/23/98
E -5
where p is the sound pressure and the Measurement
Duration (speciÞc time period) T=T2-T1. See Sound
Exposure Level.
Exchange Rate (Q), Exchange
Rate Factor (q), Exposure
Factor (k)
It is deÞned in ANSI S1.25 as Òthe change in sound
level corresponding to a doubling or halving of the
duration of a sound level while a constant percentage
of criterion exposure is maintained.Ó The rate and the
factors are given in the table below.
Standard: ANSI S12.19
Exchange Rate, Q
3.01
4
5
6.02
Far Field
Exchange Rate
Factor, q
10
13.333
16.667
20
Exposure Factor, k
1
.75
.60
.50
There are two types of far Þelds: the acoustic far Þeld
and the geometric far Þeld.
Acoustic Far Field: The distance from a source of sound
is greater than an acoustic wavelength. In the far Þeld,
the effect of the type of sound source is negligible.
Since the wavelength varies with frequency (See the
deÞnition of Wavelength), the distance will vary with
frequency. To be in the far Þeld for all frequencies measured, the lowest frequency should be chosen for
determining the distance. For example, if the lowest
frequency is 20 Hz, the wavelength at normal temperatures is near 56 ft. (17 m); at 1000 Hz, the wavelength is
near 1.1 ft. (1/3 m). See the deÞnition of Acoustic Near
Field for the advantages of in the acoustic far Þeld.
Geometric Far Field: The distance from a source of
sound is greater than the largest dimension of the
sound source. In the far Þeld, the effect of source
geometry is negligible. Sound sources often have a
variety of speciÞc sources within them, such as
exhaust and intake noise. When in the far Þeld, the
sources have all merged into one, so that measurements made even further away will be no different. See
the deÞnition of Geometric Near Field for the advantages of being in the geometric far Þeld.
E-6
System 814 User Manual
1/23/98
Free Field
A sound Þeld that is free of reßections. This does not
mean that the sound is all coming from one direction
as is often assumed, since the source of sound may be
spatially extensive. See the deÞnitions of near and far
Þelds for more detail. This deÞnition is often used in
conjunction with reverberant Þeld.
Frequency (Hz, rad/sec)
The rate at which an oscillating signal completes a
complete cycle by returning to the original value. It can
be expressed in cycles per second and the value has the
unit symbol Hz (Hertz) added and the letter f is used
for a universal descriptor. It can also be expressed in
radians per second, which has no symbol, and the
greek letter ω is used for a universal descriptor. The
two expressions are related through the expression
ω=2πf.
Frequency Band Pass Filter
The part of certain sound level meters that divides the
frequency spectrum on the sound or vibration into a
part that is unchanged and a part that is Þltered out. It
can be composed of one or more of the following
types:
Low Pass: A frequency Þlter that permits signals to pass
through that have frequencies below a certain Þxed
frequency, called a cutoff frequency. It is used to discriminate against higher frequencies.
High Pass: A frequency Þlter that permits signals to
pass through that have frequencies above a certain
Þxed frequency, called a cutoff frequency. It is used to
discriminate against lower frequencies.
Bandpass: A frequency Þlter that permits signals to pass
through that have frequencies above a certain Þxed frequency, called a lower cutoff frequency, and below a
certain Þxed frequency, called an upper cutoff frequency.
The difference between the two cutoff frequencies is
called the bandwidth. It is used to discriminate against
both lower and higher frequencies so it passes only a
band of frequencies.
Octave band: A bandpass frequency Þlter that permits
signals to pass through that have a bandwidth based
on octaves. An octave is a doubling of frequency so the
1/23/98
E -7
upper cutoff frequency is twice the lower cutoff frequency. This Þlter is often further subdivided in 1/3
and 1/12 octaves (3 and 12 bands per octave) for Þner
frequency resolution. Instruments with these Þlters
have a sufÞcient number of them to cover the usual
range of frequencies encountered in sound and vibration measurements.The frequency chosen to describe
the band is that of the center frequency. Note table in
Frequency Filter - Frequency Weighting.
Frequency Filter - Weighted
A special frequency Þlter that adjusts the amplitude of
all parts of the frequency spectrum of the sound or
vibration unlike band pass Þlters. It can be composed
of one or more of the following types:
A-Weighting: A Þlter that adjusts the levels of a frequency spectrum in the same way the human ear does
when exposed to low levels of sound. This weighting
is most often used for evaluation of environmental
sounds. See table below.
B-Weighting: A Þlter that adjusts the levels of a frequency spectrum in the same way the human ear does
when exposed to higher levels of sound. This weighting is seldom used. See table below.
C-Weighting: A Þlter that adjusts the levels of a frequency spectrum in the same way the human ear does
when exposed to high levels of sound. This weighting
is most often used for evaluation of equipment sounds.
See table below.
Flat-Weighting: A Þlter that does not adjust the levels of
a frequency spectrum. It is usually an alternative selection for the frequency-weighting selection.
E-8
System 814 User Manual
1/23/98
Center Frequencies, Hz
1/3 Octave 1 Octave
20
25
31.5
31.5
40
50
63
63
80
100
125
125
160
200
250
250
315
400
500
500
630
800
1000
1000
1250
1600
2000
2000
2500
3150
4000
4000
5000
6300
8000
8000
10000
12500
16000
16000
20000
Weighting Network Frequency
Response
A
B
C
-50.4
-24.2
-6.2
-44.7
-20.4
-4.4
-39.4
-17.1
-3.0
-34.6
-14.2
-2.0
-30.2
-11.6
-1.3
-26.2
-9.3
-0.8
-22.5
-7.4
-0.5
-19.1
-5.6
-0.3
-16.1
-4.2
-0.2
-13.4
-3.0
-0.1
-10.9
-2.0
0
-8.6
-1.3
0
-6.6
-0.8
0
-4.8
-0.5
0
-3.2
-0.3
0
-1.9
-0.1
0
-0.8
0
0
0
0
0
0.6
0
0
1.0
0
-0.1
1.2
-0.1
-0.2
1.3
-0.2
-0.3
1.2
-0.4
-0.5
1.0
-0.7
-0.8
0.5
-1.2
-1.3
-0.1
-1.9
-2.0
-1.1
-2.9
-3.0
-2.5
-4.3
-4.4
-4.3
-6.1
-6.2
-6.6
-8.4
-8.5
-9.3
-11.1
-11.2
Leq
See ÒEnergy Equivalent Sound LevelÓ, ÒSound LevelÓ,
Energy AverageÓ, and ÒTime Weighted AverageÓ
Level (dB)
A descriptor of a measured physical quantity, typically
used in sound and vibration measurements. It is
attached to the name of the physical quantity to denote
that it is a logarithmic measure of the quantity and not
the quantity itself. The word decibel is often added after
the number to express the same thing. When frequency
1/23/98
E -9
weighting is used the annotation is often expressed as
dB(A) or dB(B).
Measurement Duration (T)
The time period of measurement. It applies to hearing
damage risk and is generally expressed in hours.
Standard: ANSI S12.19
Microphone Guidelines
Microphone - Types: A device for detecting the presence of sound. Most often it converts the changing
pressure associated with sound into an electrical voltage that duplicates the changes. It can be composed of
one of the following types:
Capacitor (Condenser): A microphone that uses the
motion of a thin diaphragm caused by the sound to
change the capacitance of an electrical circuit and
thereby to create a signal. For high sensitivity, this
device has a voltage applied across the diaphragm
from an internal source.
Electret: A microphone that uses the motion of a thin
diaphragm caused by the sound to change the capacitance of an electrical circuit and thereby to create a signal. The voltage across the diaphragm is caused by the
charge embedded in the electret material so no internal
source is needed.
Microphone - Uses: The frequency response of microphones can be adjusted to be used in speciÞc applications. Among those used are:
Frontal incidence (Free Field): The microphone has been
adjusted to have an essentially ßat frequency response
when in a space relatively free of reßections and when
pointed at the source of the sound.
Random incidence: The microphone has been adjusted
to have an essentially ßat frequency response for
sound waves impinging on the microphone from all
directions.
Pressure: The microphone has not been adjusted to
have an essentially ßat frequency response for sound
waves impinging on the microphone from all directions.
E-10
System 814 User Manual
1/23/98
What a microphone measures: A microphone detects
more than just sound. The motion of a microphone diaphragm is in
Microphone Guidelines, cont.response to a force acting on it. The force can be caused by a number of
sources only one of which are we interested: sound.
Non-sound forces are: (1) direct physical contact such
as that with a Þnger or a raindrop; (2) those caused by
the movement of air over the diaphragm such as environmental wind or blowing; (3) those caused by vibration of the microphone housing; and (4) those caused
by strong electrostatic Þelds.
Rules:
1. Do not permit any solid or liquid to touch the microphone diaphragm. Keep a protective grid over the diaphragm.
2. Do not blow on a microphone and use a wind screen
over the microphone to reduce the effect of wind noise.
3. Mount microphones so their body is not subject to
vibration, particularly in direction at right angles to the
plane of the diaphragm.
4. Keep microphones away from strong electrical
Þelds.
A microphone measures forces not pressures. We would
like the microphone to measure sound pressure (force
per unit area) instead of sound force. If the pressure is
applied uniformly over the microphone diaphragm a
simple constant (the diaphragm area) relates the two,
but if the pressure varies across the diaphragm the
relationship is more complex. For example, if a negative pressure is applied on one-half the diaphragm and
an equal positive pressure is applied to the other half,
the net force is zero and essentially no motion of the
diaphragm occurs. This occurs at high frequencies and
for speciÞc orientations of the microphone.
Rules:
1. Do not use a microphone at frequencies higher than
speciÞed by the manufacturer; to increase the frequency response choose smaller microphones.
2. Choose a microphone for free Þeld or random incidence
to minimize the inßuence of orientation.
A microphone inßuences the sound being measured. The
microphone measures very small forces, low level
sound can run about one-billionth of a PSI! Every mea1/23/98
E -11
surement instrument changes the thing being measured, and for very small forces that effect can be
signiÞcant. When sound impinges directly on a microphone the incident wave must be reßected since it cannot pass through the microphone. This results in the
extra force required to reßect the sound and a microphone output that is higher than would exist if the
microphone were not there. This is more important at
high frequencies and when the microphone is facing
the sound source.
Rules:
1. Do not use a microphone at frequencies higher than
speciÞed by the manufacturer; to increase the frequency response choose smaller microphones.
2. Choose a microphone for free Þeld or random incidence
to minimize the inßuence of orientation.
A microphone measures what is there from any direction:
Most measurements are intended to measure the
sound level of a speciÞc source, but most microphones
are not directional so they measure whatever is there,
regardless of source.
Rules:
1. When making hand-held measurements, keep your
body at right angles to the direction of the sound you
are interested in and hold the meter as far from your
body as possible. Use a tripod whenever possible.
2. Measure the inßuence of other sources by measuring
the background sound level without the source of
interest. You may have to correct for the background.
Near Field
There are two types of near Þelds: the acoustic near Þeld
and the geometric near Þeld.
Acoustic Near Field: The distance from a source of
sound is less than an acoustic wavelength. In the near
Þeld, the effect of the type of sound source is signiÞcant. Since the wavelength varies with frequency (See
the deÞnition of Wavelength), the distance will vary
with frequency. The most common example of a near
Þeld is driving an automobile with an open window.
As you move your ear to the plane of the window, the
sound pressure level builds up rapidly (wind noise)
since most of the pressure changes are to move the air
and very little of it compresses the air to create sound.
Persons not far way, can hardly hear what you hear.
E-12
System 814 User Manual
1/23/98
The acoustic near Þeld is characterized by pressures
that do not create sound that can be measured in the
far Þeld. Therefore measurements made here are not
useful in predicting the sound levels far way or the
sound power of the source.
Geometric Near Field: The distance from a source of
sound is less than the largest dimension of the sound
source. In the near Þeld, effect of source geometry is
signiÞcant. Sound sources often have a variety of speciÞc sources within them, such as exhaust and intake
noise. When in the near Þeld, the sound of a weaker,
but close, source can be louder than that of a more distant, but stronger, source. Therefore measurements
made here can be used to separate the various sources
of sound, but are not useful in predicting the sound
levels and sound spectrum far from the source.
Noise
Typically it is unwanted sound. This word adds the
response of humans to the physical phenomenon of
sound. The descriptor should be used only when negative effects on people are known to occur. Unfortunately, this word is used also to describe sounds with
no tonal content (random):
Ambient: The all encompassing sound at a given location caused by all sources of sound. It is generally random, but need not be.
Background: The all encompassing sound at a given
location caused by all sources of sound, but excluding
the source to be measured. It is essentially the sound
that interferes with a measurement.
Pink: It is a random sound that maintains constant
energy per octave. Pink light is similar to pink noise in
that it has a higher level at the lower frequencies (red
end of the spectrum).
White: It is a random sound that contains equal energy
at each frequency. In this respect, it is similar to white
light.
Noise Dose (D)
1/23/98
It is the percentage of time a person is exposed to noise
that is potentially damaging to hearing. Zero represents no exposure and 100 or more represents complete
exposure. It is calculated by dividing the actual time of
exposure by the allowed time of exposure. The
E -13
allowed time of exposure is determined by the Criterion Duration and by the sound level (the higher the
level, the shorter the allowed time). The sound levels
must be measured with A-frequency weighting and
slow exponential time weighting. See Projected Noise
Dose.
T
100T ( L – L ) ⁄ Q
D = 100 ----- = ------------ 10 i c
Ti
Tc
where T is the Measurement Duration and Ti is the
Allowed Exposure Time.
Standard: ANSI S12.19
Noise Exposure
(See Sound Exposure)
OSHA Level (LOSHA)
The Average Sound Level calculated in accordance
with the Occupational Safety and Health Administration Exchange Rate and Threshold Level.
Preamplifier
A part of the sound level meter that matches a particular model of microphone to the meter. It must be chosen in conjunction with a microphone and a cable that
connects them.
Projected Noise Dose
It is the Noise Dose expected if the current rate of noise
exposure continues for the full Criterion Duration
period.
Single Event Noise Exposure
Level (SENEL, LAX)
The total sound energy over a speciÞc period. It is a
special form of the Sound Exposure Level where the
time period is deÞned as the start and end times of a
noise event such as an aircraft or automobile passby.
Sound
The rapid oscillatory compressional changes in a
medium (solid, liquid or gas) that propagate to distant
points. It is characterized by changes in density, pressure, motion, and temperature as well as other physical quantities. Not all rapid changes in the medium are
sound (wind noise) since they do not propagate.
The auditory sensation evoked by the oscillatory
changes.
Difference between sound and noise: Sound is the physical
phenomenon associated with acoustic (small) pressure
E-14
System 814 User Manual
1/23/98
waves. Use of the word sound provides a neutral
description of some acoustic event. Generally, noise is
deÞned as unwanted sound. It can also be deÞned as
sound that causes adverse effects on people such as
hearing loss or annoyance. It can also be deÞned as the
sound made by other people. In every case, noise
involves the judgment of someone and puts noise in
the realm of psychology not physics.
Rules:
1. Use word sound to describe measurements to
remove the emotional overtones associated with the
word noise. Some sound metrics use noise in their
name and it is proper to use the name as it is.
Sound Exposure (SE)
It is the total sound energy of the actual sound during
a speciÞc time period. It is expressed in Pascalssquared seconds.
T2
SE =
∫ p A ( t ) dt
2
T1
where pA is the sound pressure and T2 - T1 is the Measurement Duration (speciÞc time period).
When applied to hearing damage potential, the equation is changed to
T2
SE =
∫ [p
k
2
A ( t ) ] dt
T1
where k is the Exposure Factor. See Exchange Rate.
Standard: ANSI S1.25
Sound Exposure Level (SEL,
LET)
The total sound energy in a speciÞc time period. The
equation for it is
T2
∫
2
p ( t ) dt
T
1
SEL = 10Log 10 ------------------------2
p0 T
The sound pressure is squared and integrated over a
speciÞc period of time (T2-T1) this is called the sound
exposure and has the units Pascal squared- seconds or
1/23/98
E -15
Pascal squared- hours. P0 is the reference pressure of
20 µPa and T is the reference time of 1 second. It is then
put into logarithmic form. It is important to note that it
is not an average since the reference time is not the
same as the integration time.
Sound Pressure
The physical characteristic of sound that can be
detected by microphones. Not all pressure signals
detected by a microphone are sound (e.g., wind noise).
It is the amplitude of the oscillating sound pressure
and is measured in Pascals (Pa), Newtons per square
meter, which is a metric equivalent of pounds per
square inch. To measure sound, the oscillating pressure
must be separated from the steady (barometric) pressure with a detector. The detector takes out the steady
pressure so only the oscillating pressure remains. It
then squares the pressure, takes the time average, and
then takes the square root (this is called rms for rootmean square). There are several ways this can be done.
Moving Average: The averaging process is continually
accepting new data so it is similar to an exponential
moving average. The equation for it is
t
p rms =
–( t – ξ ) ⁄ T
1 2
dξ
--T- p ( ξ )e
∫
ts
The sound pressure is squared and multiplied by a
exponential decay factor so that when the time of integration is near the current time (t) it is essentially undiminished. For times older (less) than the current time,
the value is diminished and so becomes less important.
The rate at which older data are made less inßuential is
expressed by the constant T. The larger is it the slower
the decay factor reduces and the slower the response of
the system to rapid changes. These are standardized
into three values called Time Weighting. See the values
below.
Fixed Average: The averaging process is over a Þxed
time period. The equation for it is
E-16
System 814 User Manual
1/23/98
T2
p rms =
1
---------------------( T 2 – T 1 -)
∫
2
p ( t ) dt
T1
The sound pressure is squared and averaged over a
Þxed time period. Unlike the moving average, the
sound pressures in all time intervals are equally
weighted.
Sound Pressure Level (SPL, Lp)
The logarithmic form of sound pressure. It is also
expressed by attachment of the word decibel to the
number. The logarithm is taken of the ratio of the
actual sound pressure to a reference sound pressure
which is 20 MicroPascals (µ Pa). There are various
descriptors attached to this level depending on how
the actual sound pressure is processed in the meter:
Instantaneous: The time varying reading on a meter
face on in a meter output due to changes in the sound
pressure. The reading will depend on the time-weighting applied.
The fundamental relationship between the two is logarithmic
p rms
L p = 20log 10 ---------p0
p rms = p 0 10
L p ⁄ 20
where p0 is the reference sound pressure of 20 µPa. The
square of the sound pressure is a power-like quantity
that can be expressed in the original form of the level
deÞnition
2
p rms
L p = 10log 10 --------2p0
2
2
p rms = p 0 10
L p ⁄ 10
Sound Pressure Level can be converted to sound pressure as follows. If the sound pressure is 1 Pascal, then
the sound pressure level is
1/23/98
E -17
1
g 10 --------------------= 20log 10 [ 50000 ] = 20 [ 4.699 ] = 94.0dB
– 620 • 10
Calibrators often use a level of 94 dB so they generate a
sound pressure of 1 Pascal.
If the sound pressure level = 76.3 dB, then the sound
pressure is
76.3 ⁄ 20
= 20 • 10
3.815 – 6
= 20 • 10
– 2.185
= 20 [ 0.0065 ] = 0.13
Energy Average (Leq): The value of a steady sound measured over a Þxed time period that has the same sound
energy as the actual time varying sound over the same
period. This descriptor is widely used. It is a Þxed
average (See Sound Pressure).
Impulse: The value of an impulsive sound. The reading
will depend on the time-weighting applied.
Unweighted Peak: The peak value of a sound with a
meter that has ßat frequency weighting and a peak
detector.
Weighted Peak: The peak value of a sound with a meter
that has a frequency weighting other than ßat and a
peak detector.
Sound Power(W)
The sound power emitted by a sound source. It is measured in Watts.
Sound Power Level (PWL, Lw)
The logarithmic form of sound power. It is also
expressed by attachment of the word decibel to the
number. The logarithm is taken of the ratio of the
actual sound power to a reference sound power, which
is 1 pico-watt. Sound power level cannot be measured
directly, but can only be deduced through measurements of sound intensity or sound pressure around the
source. The equation for it is
W
L w = 10log 10 ------W0
E-18
System 814 User Manual
W = W 0 10
L w ⁄ 10
1/23/98
Sound Speed, (c,)
The speed at which sound waves propagate. It is measured in meters per second. It should not be confused
with sound or particle velocity which relates to the
physical motion of the medium itself.
m⁄s
c = 20.05 degC + 273
c = 49.03 degF + 460
ft ⁄ sec
Spectrum (Frequency
Spectrum)
The amplitude of sound or vibration at various frequencies. It is given by a set of numbers that describe
the amplitude at each frequency or band of frequencies. It is often preÞxed with a descriptor that identiÞes
it such as sound pressure spectrum. It is generally
expressed as a spectrum level.
Threshold Sound Level (Lt)
The A-weighted sound level below which the sound
produces little or no Noise Dose accumulation and
may be disregarded. It is used for hearing damage risk
assessment.
Standard: ANSI S1.25
Time Weighted Average Sound
Level (TWA, LTWA(TC))
It is the level of a constant sound over the Criterion
Duration, that would expose a person to the same
Noise Dose as the actual (unsteady) sound over the
same period. If the Exchange Rate is 3 dB then the
TWA is equal to the Leq.
T2 ( L (t)) ⁄ K
1 10 p
Klog
dt
=
TWA ( TC )
10 -
T
T1
∫
where Tc=T2-T1 and K is the Exchange Rate Factor. It is
used for hearing damage risk assessment.
Standard: ANSI S12.19
Time Weighting
The response speed of the detector in a sound level
meter. There are several speeds used.
Slow: The time constant is 1 second (1000 ms). This is
the slowest and is commonly used in environmental
1/23/98
E -19
noise measurements.
Fast: The time constant is 1/8 second (125 ms). This is a
less commonly used weighting but will detect changes
in sound level more rapidly.
Impulse: The time constant is 35ms for the rise and 1.5
seconds (1500 ms) for the decay. The reason for the
double constant is to allow the very short signal to be
captured and displayed.
Vibration
The oscillatory movement of a mechanical system
(generally taken to be solid). It is used as a broad
descriptor of oscillations.
Wavelength (l)
The distance between peaks of a propagating wave
with a well deÞned frequency. It is related to the frequency through the following equation
c
λ = --f
where c is the sound speed and f is the frequency in
Hz. It has the dimensions of length.
Wavenumber (k)
A number that is related to the wavelength of sound
and is used to compare the size of objects relative to
the wavelength or the time delay in sound propagation. It is related to wavelength through the following
equation
ω
2πf
2π
k = ------ = --------- = ---c
c
λ
where λ is the wavelength, c is the sound speed, f is the
frequency in Hz, and ω is the radian frequency. It has
the dimensions of inverse length.
Yearly Average Sound Level
(YDNL, Lydn)
The Day-Night Average Sound Level for each day is
averaged over the entire year. It is calculated as follows
365
1
L ydn = 10 log --------365
∑ 10
Ldn 1 ⁄ 10
i=1
E-20
System 814 User Manual
1/23/98
Index
Numerics
814
Accessories and Optional Equipment 112
Components 1-6
Features 1-3
General Features 1-3
Logging SLM Features 1-5
OBA Features 1-5
optional equipment 1-12
Simple SLM Features 1-5
System Diagram 1-9
A
About 2-18
AC Out Filter Setting 4-14, 5-24
AC Out Weight Setting 3-10
Answering Procedure C-50
B
Bandwidth Setting 3-6
C
Calibration 2-19, E-1
glossary E-2
Calibrator
CAL200 1-13
CAL250 1-13
Character Parameters C-23
Clock/Timer 2-21
Commands
status C-10
Communication 2-26
Connector
AC/DC Output connector 1-9
Control Connector 1-8
Serial Connector 1-8
Controls Settings Menu 4-14
Conventions
Formatting 1-2
2/27/98
Criterion E-2
sound level E-3
Current Criterion Level Setting 5-11
Current Exchange Setting 4-12, 5-10
Current Threshold Setting 4-13, 5-10
D
Daily History
variables C-41
Data Report Setting 5-22
Decibel E-4
Department of Defense
level E-5
Detector E-5
Detector Setting 4-10, 5-5
Dial Out Mode C-48
Dialing Procedure C-49
Displays Logging SLM
Current / Overall - e SLM Displays 5-38
Current / Overall -a SLM Displays 5-34
Current / Overall -b SLM Displays 5-35
Current / Overall -d SLM Displays 5-37
Current /Overall -c SLM Displays 5-36
Exposure-b Display 5-40
LDL Display 5-46
Ln-a Display 5-41
Ln-b Display 5-42
Stats-a Display 5-43
Stats-b Display 5-44
Stats-c Display 5-45
Displays OBA
Current 3-16
Live 3-14
OverAll 3-18
Displays sSLM
SLM 4-23
Duration
measurement E-10
E
Error C-45
Index-1
messages and warnings C-45
Error Checking
I/O C-33
Exchange Rate
glossary E-6
Exchange Rate Factor
glossary E-6
Exposure Factor
glossary E-6
Interval Threshold Setting 5-20
Interval Variables C-38
Intervals Menu 5-17
Intrusion alarm C-26
Intv Auto Stop Setting 3-10
Intv Enable Setting 3-8
Intv Period Setting 3-9
Intv Report Setting 5-22
Intv Time Sync Setting 3-9
F
K
Far Field E-6
acoustic E-6
geometric E-6
Format
Conventions 1-2
Formatting Conventions 1-2
Free field E-6
Frequency
band pass filter E-7
glossary E-7
Hz, rad/sec E-7
Key
Arrow Keys 2-10
Check Key 2-11
Data Key 2-12
Pause Key 2-9
power 2-3
Print Key 2-27
Reset Key 2-8
Run|Stop 2-8
Setup Key 2-13
Tools Key 2-16
View Key 2-11
H
L
Hist Report Setting 5-23
Histogram
variables C-43
Histogram Reports C-29
History
commands C-5
records C-35
History Enable Setting 5-15
History Period Setting 5-16
Hysteresis Setting 5-14
Leq
glossary E-5
Level E-9
Dept of Defense E-5
LN Menu 5-11
Lock 2-25
Logic Input Setting 4-15, 5-24
Logic Output Setting 5-25
Logic Output Time Setting 4-18
Logic Output Timer Setting 5-27
I
I/O Error Checking C-33
Interval Auto-Stop Enable Setting 5-20
Interval Enable Setting 5-18
Interval Exchange Rate Setting 5-20
Interval LN Enable Setting 5-19
Interval Period Setting 5-19
Interval Sync Enable Setting 5-19
Index-2
M
Memory 2-23
Messages
error messages and warnings C-45
Microphone
guidelines E-10
what it measures E-11
System 814 User Manual
2/27/98
microphone reference number 1-12
Microphones
capacitor E-10
electrit E-10
uses E-10
Mode
commands C-7
Model 820
Glossary, App C E-1
Modem
answering procedure C-50
control mode C-47
dial out mode C-48
monitor numbers C-48
phone dialing procedure C-49
N
Near Field
acoustic E-12
geometric E-13
glossary E-12
Noise
ambient E-13
Background E-13
compensate C-33
daily personal exposure E-3
dose(D) E-13
exposure E-14
floor C-33
glossary E-2, E-13
pink E-13
projected noise dose E-14
single event exposure
level(SENEL,Lax) E-14
white E-13
Numeric Parameters C-23
O
OBA Profile Setting 3-6
OBA ScanMode Setting 3-5
OSHA
level E-14
Other Level Setting 5-17
Overall & Current measurements 1-5
2/27/98
Overall Criterion Level Setting 5-9
Overall Exchange Setting 5-8
Overall Threshold Setting 5-9
P
Parameter C-23
character C-23
character strings C-20
indexed C-20
numeric C-20, C-23
query C-21
setting C-20
template C-20
Peak I Trigger Level Setting 5-14
Peak II Trigger Level Setting 5-14
Period Units Setting 5-16
Phone Dialing C-49
Pin C-2
Pin configurations C-2
Pk-I Histogram Setting 5-22
Pk-I Weighting Setting 4-12, 5-7
Pk-II Histogram Setting 5-22
Power
display 2-4
key 2-3
power conservation 2-7
settings 2-6
Power Monitor 2-25
power source
external 1-14
Preamplifier E-14
Print
commands C-44
Q
Quick Start 1-14
R
R 2-8
Range Setting 4-11, 5-6
Resolution Setting 5-17
RS-232 interface C-1
Run Log Variables C-42
Index-3
S
serial number 1-12
Setting up the Logging SLM 5-2
Setting up the OBA 3-2
Settings
power 2-6
Sound
average level (lavg) E-1
day-night average level E-3
energy average(Leq) E-18
exposure E-15
exposure level E-15
fixed average E-16
glossary E-14
impulse E-18
instantaneous E-17
intensity(l) E-18
moving average E-16
pressure E-16
sound pressure level(SPL,Lp) E-17
unweighted peak E-18
weighted peak E-18
yearly average level(YDNL, Lydn) E-20
Sound Level
threshold(Lt) E-19
Sound Power E-18
level(PWL,Lw) E-18
Sound Pressure Level (see Sound) E-17
Sound Speed E-19
Spectrum
frequency E-19
SPL Histogram Report Setting 5-22
SPL Trigger Level 1 Setting 5-13
Status
command C-10
System 1-6
T
template C-23
Template Parameters C-23
Time
allowed Exposure time(Ti) E-1
weighting E-19
Title Setting 5-4
Index-4
Transducer Setting 3-8, 4-11, 5-6
TWA
time weighted average sound
level(TWA, LTWA(TC) E-19
U
Understanding Logging SLM Displays 5-30
Understanding OBA Displays 3-11
Understanding sSLM Displays 4-20
Understanding òSLM Displays 5-30
Unpacking and Inspection 1-11
Using the Logging SLM 5-48
Using the sSLM 4-26
V
Variables
calibration history C-42
daily history C-41
exceedance history C-36
histogram C-43
histogram table C-43
interval C-38
interval history C-38
run log C-42
time history C-43
Vibration E-20
W
Warnings error messages C-45
Wavelength(l)
glossary E-20
Wavenumber
glossary E-20
Weighted
8-hour time weighted average sound
level E-5
Weighting
frequency E-8
time E-19
Weighting Setting 4-10, 5-5
System 814 User Manual
2/27/98