1
User Manual
Overview
Idevio Maps for QlikView is an extension for
QlikView version 10 and later. The extension
enables advanced visualizations of business
objects such as symbols, regions and
tracks. This document describes how to use
and configure the map extension. The main
user interfaces are the map window and the
map window properties.
Contents
3.7.3 Rotate................................................15
1 Overview.................................................................3
1.1 Map window...................................................4
1.2 Map Window Properties.................................4
3.7.4 Pitch...................................................15
3.7.6 Mouse over details.............................15
3.7.7 Scale/Map window width...................15
3.7.8 Page control......................................15
2 Installation..............................................................5
2.1 Quick start.....................................................5
2.2 Quick start own data......................................5
2.2 Server installation..........................................6
2.3 Requirements................................................6
3.7.9 Background map................................15
3.7.10 WMS image as map background.....15
3.7.11 External tile sets...............................16
3.7.12 Legends...........................................16
4. Scatter chart support..........................................16
2.4 Permanent install the map license key..........6
2.5 Locally installed map server..........................6
2.6 Troubleshooting.............................................6
5. Heatmaps.............................................................17
3. Usage.....................................................................7
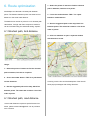
6. Route optimization..............................................18
3.1 Points.............................................................7
6.1 Shortest path, bird distance.........................18
3.1.1 Labels..................................................8
6.1 Shortest path, road distance........................18
3.1.2 Bubble chart........................................8
3.1.3 Pie chart .............................................8
7. Animation............................................................19
3.1.4 Bar chart..............................................8
3.1.5 Arbitrary image....................................8
8. Map modes..........................................................19
3.2 Regions.........................................................8
3.2.1 Drill down regions................................9
3.3 Lines............................................................10
8. Examples.............................................................19
3.3.1 Line arrows........................................11
3.3.2 Track lines..........................................11
9. Idevio Maps extension details...........................20
3.4 Select...........................................................11
9.1 Architecture..................................................20
3.4.1 Select with mouse click......................11
9.2 File structure................................................20
3.4.2 Select visible objects..........................11
3.4.3 Select with zoom................................11
10. Hints on extension development.....................21
3.4.4 Select with radius select....................11
3.4.5 Select with isoline select....................12
3.4.6 Select with polygon select.................12
11. Links to further documentation.......................21
3.5 Drill-down.....................................................12
11.1 Idevio RaveGeo WebMap..........................21
3.6 Advanced settings........................................12
11.2 jQuery........................................................21
3.7 Map control..................................................14
11.3 QlikView JS API.........................................21
3.7.1 Zoom.................................................14
3.7.2 Pan....................................................15
12. Change log........................................................21
1 Overview
Idevio Maps for QlikView is an extension for QlikView
version 10 and later. The extension enables advanced
visualizations of business objects such as symbols,
regions and tracks. This document describes how to use
and configure the map extension. The main user
interfaces are the map window and the map window
properties.
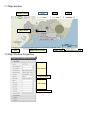
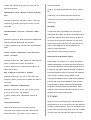
1.1 Map window
Zoom
Symbol controls
Object details
Pitch
Advanced
Map
Region
Point
Linelicense
controls
controls
controls
settings
key
Object count
Scale
Rotate
Object count, info text
1.2 Map Window Properties
Point settings
Region settings
Line settings
Map license key
Page control
Coordinates at pointer
2 Installation
The extension requires a valid key, please contact
Idevio by web: www.idevio.com and use the web-based
contact form or by phone +46 31 779 09 60 to order.
Partners of Idevio may download a 30-day evaluation
license from www.idevio.com/qlikview.
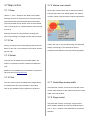
2.1 Quick start
This applies to QlikView desktop. See section 2.2 on
Illustration 1: How to enter the license key.
2.2 Quick start own data
how to perform a server installation.
1 – Install the extension: double click on the qar
files: IdevioMaps.qar and the IdevioAnimator.qar.
The qar file is a zip archive, QlikView will unpack and
place the files in the extension folder:
Windows XP:
C:\Documents and Settings\user\Local settings\Application Data\QlikTech\QlikView\Extensions\Objects\Idevio\IdevioMaps
Windows 7:
1 – Read in data with a unique Id field and X, Y
coordinates in WGS84.
2 – Turn on View → “Web View”.
3 – Add map window to workspace: Right mouse
click on background → New sheet object →
Extension Objects → Drag the icon“ IdevioMaps” to
workspace background.
C:\Users\
[UserName]\AppData\Local\QlikTech\QlikView\Extensio
ns\Objects\Idevio\IdevioMaps
4 – Set Id, X and Y in map window properties: Right
mouse click on map window title bar → Properties...
2 – Open the provided examples and verify that
5 – Insert the provided map license key into the
installation was successful.
field "License key:". Save the application and press
F5 (refresh).
3 – For each example insert the map license key.
Right click on map window title bar and open
properties, paste the key into the field "License
key". Save the example and press F5 (refresh).
The map license key can be permanently installed in
the extension, see section 2.4 Permanent install the
map license key.
2.2 Server installation
2.4 Permanent install the map
license key
This applies to QlikView server. See section 2.1 on how
to perform a desktop installation.
Rename the IdevioMaps.qar to IdevioMaps.zip,
unpack files and copy them manually to the
Extension folder.
The folder varies per operating systems.
Ex: Windows XP, Server 2003:
C:\Documents and Settings\All Users\Application
The map license key is normally entered in the
properties of each map window created. The license can
be permanently installed by entering the license key in
the Script.js file in the extension folder.
1 – Search the Script.js in the extension folder for:
"Enter license key"
2 – Enter the provided license between the quotes.
Data\QlikTech\QlikViewServer\Extensions\Objects\Idevi
o\IdevioMaps
Note 1: Be careful when entering the key, the file is
Windows 7, Server 2008:
compressed for speed and not easy to read.
C:\ProgramData\QlikTech\QlikViewServer\Extensions\O
Note 2: If the extension is updated the map license key
bjects\Idevio\IdevioMaps
must be entered again.
Please note:
The extension should reside on C: even if the
2.5 Locally installed map server
Qlikview Server is installed on D:
Normally the IdevioMaps for Qlikview runs towards the
hosted map server at www.idevio.com. This can be
Make sure that the latest Java version is
installed if documents are opened on the server.
2.3 Requirements
changed for clients who run their own instance of Idevio
RaveGeo Server WebMap. Switch map host by editing
the Script.js file in the extension folder.
1 – Search the Script.js in the extension folder for:
QlikView v10 SR3 or later, v11 or later.
Internet Explorer 8,9 when used together with
QlikView Desktop. When the extension is
deployed on the QlikViewServer the maps will
work on most modern browsers including:
Chrome, Firefox, Opera and Safari.
com.idevio.qlikview.ServerUrl="hosted.idevio.com"
2 – Enter the local hostname url (without protocol)
between the quotes.
Note 1: Be careful when entering the url, the file is
compressed for speed and not easy to read.
Latest version of Java is recommended for best
Note 2: If the extension is updated the url must be
performance, with streaming maps. Java is free
entered again.
and available from www.java.com. Use IE 64-bit
2.6 Troubleshooting
to download java if you are using Qlikview 64bit.
Web view
QlikView needs to be set in “Web View”, extensions are
using the advanced settings.
only available in the QlikView Ajax client.
Administrator rights at install
Qlikview must have been installed with admin rights prior
to extension installation. If not extensions might not be
installed properly, it can help to copy the files manually.
See section for server installation.
64-bit
3. Usage
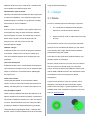
3.1 Points
In order to visualize points the following are required:
If 64-bit versions of software is used, please make sure
X,Y coordinates in WGS84 decimal degrees.
Same as a normal GPS device delivers.
that all parts are using the same bit version: Qlikview,
Internet Explorer and Java. The easiest way to get the
64-bit version of java is to use IE 64-bit and visit
Unique Id field (in order to make select from map
to work)
www.java.com, then the correct version will
automatically be installed.
The dimensions are set in the map window properties.
Qlikview "hangs"
Symbols can be visualized with bubble, pie, bar charts
If Qlikview should “hang” and show progress indicators
or an arbitrary URL image. Switch between different
in list boxes, it helps most of the time to refresh (F5).
presentations using the toolbar.
This can sometimes happen when changing the map
Point data can also generate a gradient heatmap, see
properties.
separate section 5. Heatmaps.
Can't save workspace
Numeric values are shown as a color ramp from blue to
If Qlikview should come in a state where the workspace
red. Text values are colored using a fix color table.
cannot be saved, it helps most of time to reload the data.
Colors can also be defined using Qlikview function that
When an extension is removed and then added again
returns RGB or ARGB functions. Non-transparent colors
this might occur.
are treated as solid colors and given a default
Latest Java version
transparency.
Unless otherwise stated we recommend the latest
If symbols are placed too close, the symbols can be
version of Java on client side for best performance and
separated. Lead lines will then indicate the original
stability, visit www.java.com to obtain Java without cost.
position when zooming in. Symbol separation is only
Only 40 objects loaded
available when Java is present on the device. Get Java
There is a bug in QlikView that limits the selection to 40
objects sometimes for extension at startup. Workaround:
F5 refresh or update the selection. Or if the max objects
is known, edit the Definition.xml in the extension folder,
by adding a attribute to ExtensionObject tag, example:
<ExtensionObject PageHeight="3000">, however after
that the number of objects loaded cannot be customized
free from www.java.com
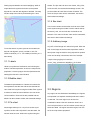
Plotting beyond dateline and world wrapping. When in
toolbar. The pie chart can show two values, using color
mapmode=html5 symbols and lines can be plotted
as the second, see the advanced settings section. The
beyond the -180 and 180 degrees in WGS84. The map
pie chart starts at north and increase clockwise. The
will also wrap around when panned along the x axis.
colors of the pie chart can be customized, see section
about advanced settings.
3.1.4 Bar chart
Two numeric values can be shown as a bar chart. Shift
to this symbol using the toolbar. The two values shares
the same y axis, min and max are combined for the
selection. The colors of the bar chart can be customized,
see section about advanced settings.
3.1.5 Arbitrary image
To use the feature: to place symbols and render lines
beyond 180 degrees, specify x as180+x+180. For
instance Honolulu (-21.3, -157.816667) becomes (-21.3,
202.18333)
3.1.1 Labels
Any GIF or PNG image can used as a symbol. Enter the
URL to the image as the first value expression. Shift to
this symbol using the toolbar. Using expression dynamic
icons can be easily constructed, here is an example:
='https://chart.googleapis.com/chart?
chst=d_map_spin&chld=0.35|0|fff|10|_|' & Position
Labels on symbols are switched on and off using the
toolbar. The label expression is set in the map window
properties. If custom popups are used (see advanced
settings) the first line is used as label.
3.1.2 Bubble chart
The default representation is a bubble icon where the
first expression sets the size and the second sets the
color. Shift to this symbol using the toolbar. Each symbol
is resized to show the value relative to the max of the
current selection. Pixel size is also possible and the
bubble can also contain a label, see advanced settings.
3.1.3 Pie chart
3.2 Regions
Any region can be visualized in IdevioMaps, the regions
are specified in a separate JavaScript file that is read in
on demand. The color regions can be used for
visualization values. Numeric values are shown as a
color ramp from blue to red. Text values colored using a
Percentage values (0.0 to 1.0) can be shown as pie
fixed color table. The region Id and the region color are
symbols, the first value expression sets the share, the
set in the map window properties.
second value the color. Shift to this symbol using the
Regions and symbols can be combined and create a
4. Start QlikView and add ®ions_js=<file with
powerful presentation.
polygons, ex: us_states.js> in the Advanced settings
Here's a step-by-step guide, the JavaScript file is located
section of properties for map window.
in the same directory as Script.js.
See the example us_doctors.qvw, us_states.js and
WorldRegionExample.qvw, world.js for full examples.
Regions can be stored in hierarchy of js files and
accessed from a region server, see next section.
Idevio provides a tool to convert from GML to region js
file format: www.idevio.com/php/gml2webmap/
3.2.1 Drill down regions
1 – Get the geometry of the regions: id, polygons
with x,y in WGS84. The id will become the key.
Regions can be organized in a hierarchy to support drilldown. The js files containing the geometry for the
regions can either be stored in local js files or served as
2 – Convert the regions to the following format, any
a web service. By using index keys with '-' as the
custom regions can be used, syntax:
separator the correct region is read in. Idevio provides a
web service with common regions hierarchies, set the
polys[i] = new ravegeo.Polygon('i', [ list of x
coordinates ], [ list of y coordinates], 'color in hex format
advanced setting regions_js=http://geobrokeridevio.rhcloud.com/zipcodes.php? to enable it.
use #00000000'); polys[i].regid = 'set to region id';
USA -> state -> county
Example:
Example of region key: USA, USA-CA, USA-CA-033.
polys[0] = new ravegeo.Polygon('0', [
-75.273744634000025, -75.273043610000002 ], [
See example us_counties.qvw for complete list of codes
for all states and counties.
-14.04381441999999, -14.041436233000013 ],
'#00000000'); polys[0].regid = 'A';
polys[1] = new ravegeo.Polygon('1', [
-74.259776095000007, -74.234770982999976 ], [
-14.441769765999993, -14.474387057 ], '#00000000');
Russia -> district - territory
Example of region key: RU, RU-Y, RU-Y-AD. See
example us_ru_districts.qvw for complete list of codes
for all districts and territories.
polys[1].regid = 'B';
One region can consist of several polygons, it's
important to specify the region id, otherwise the
matching won't be correct.
3. Save the JavaScript file in the same directory as
Germany -> 2 digit zip code -> 5 digit zip code area.
Example of region key: DE, DE-01, DE-01-01067. See
example de_plz.qvw on how to use German PLZ codes.
Germany -> Bundesland -> Kreise.
the extension and Script.js.
Example of region key: de_bld_krs-15', de_bld_krs-15-
15086'. See example de_bld_krs.qvw on how to use
German PLZ codes.
Great Britain -> Area -> District -> Sector postcode
area
Here's an example:
world.js : all country geometries with country code as
key.
world-US.js : all US states with state code as key
world-US-CA.js: all counties for California with county
Example of region key: GB, GB-LL, GB-LL-LL99. See
code as key
example gb_postcode_areas.qvw on how to use UK
postcodes.
GeoJSON
The Netherlands -> Provincie -> Gemeente -> Wijk ->
In mapmode "html5" IdevioMaps can read regions
Buurt.
defined with GeoJSON. The region geometries should
be stored in WGS84, epsg code 4326. Each object in
Example of region key: NLD, NLD-DR, NLD-DR-M0106,
NLD-DR-GM0106-WK010600. See example
nl_admin_areas.qvw on how use Dutch administrative
areas.
the region file should have a attribute "id" with value
which serves as the index key. The region server can
serve in GeoJSON format, use the following key:
regions_js=http://geobroker-
France -> Region -> Departement -> Arrondissement ->
idevio.rhcloud.com/zipcodes.php?geojson
Canton -> Commune
Data sources for drill-down regions
Example of region key: FRA, FRA-93-04, FRA, FRA-93-
Natural Earth, US Census, PLZ - Seven, Geonames,
04-041, FRA-93-04-041-0404. See example
Statistics Netherlands, European Environment Agency,
fr_admin_areas.qvw for complete list of codes for all
IGN (Institut national de l’Information Géographique et
states and counties.
Forestière), Istat (Italian National Institute of Statistics).
Italy -> Regiona -> Provincia -> Comune
Postal Boundaries © GeoLytix copyright and database
Example of region key: ITA, ITA-14, ITA-14-94. See
example it_admin_areas.qvw for complete list codes of
all regions.
right. Contains Ordnance Survey data © Crown
copyright and database right. Contains Royal Mail data
© Royal Mail copyright and database right. Contains
National Statistics data © Geobasis-DE / BKG (Das
Japan -> Prefecture -> Municipality
Bundesamt für Kartographie und Geodäsie). Japan
Example of region key: jp_pre_mun, jp_pre_mun-01,
National Land numerical information, Ministry of Land,
jp_pre_mun-01-01101. See example
Infrastructure, Transport and Tourism.
jp_admin_areas.qvw for complete list codes of all
regions.
Local js file hierarchy
Regions can be stored in a hierarchy of js files,
connected by the naming of the files. Heres the file
name convention: <root name>-<key1>-<key2>.js.
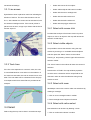
3.3 Lines
Symbols can be connected by lines, and the lines are
segmented by an id. Line id and line color are settings in
the map properties dialogue. Lines can visualized in two
modes: track lines and centric lines. Lines can be drawn
as great circle arcs that follow the shape of the earth,
see advanced settings.
•
Select with mouse click on object
3.3.1 Line arrows
•
Select visible objects with button in toolbar
•
Select with the zoom rectangle tool.
•
Select with the radius select tool.
line 1, with a darker tint. Arrows can be switched off, see
•
Select with the isoline select tool.
the advanced settings section. If the mouse pointer is
•
Select with the polygon select tool.
By default an arrow is placed on each line indicating the
direction of the line. The arrow has the same color as
placed over an arrow, an pop up is shown with the line id
and the object id.
3.4.1 Select with mouse click
Provided that a unique id has been chosen for points
objects, a click on an object in the map will narrow the
selection to that object.
3.4.2 Select visible objects
It is possible to narrow the selection using the map
window by zooming in on a suitable area and objects
and then press the “Select” button on the toolbar.
Zooming in and pressing “Select” again will narrow the
selection further.
3.3.2 Track lines
The “Clear” button in the toolbar will clear the current Id
selection.
If the line color expression is a numeric value, the color
is normalized based on max and min in the selection. If
the value is a text value, the color is chosen from a color
table. The color table can be customized in the Script.js.
A workspace with Volvo Ocean Race is provided as an
example.
Note that the “Id” field in the map window properties
must be set to a dimension with a unique field for the
data set in order to make the selection through map
window to work.
3.4.3 Select with zoom
IdevioMaps comes with a tool to make new selections by
drawing a rectangle.
1. Click on zoom rectangle button in toolbar.
2. Draw rectangle around objects of interest.
3.4.4 Select with radius select
3.4 Select
Select using the map can be done in several was ways:
New selections can be done by drawing a circle.
1. Click on radius select button in toolbar.
2. Click to set the center of the circle.
The default radius of the circle is 6000 meters. This can
be changed using the advanced setting “selectradius”.
coordinates. How to:
1 – Create a drill-down group: Document properties
→ Groups → New.
3.4.5 Select with isoline select
2 – Set the newly created drill-down group as “Point
IdevioMaps supports selections using an isoline. An
Id” in map window properties
isoline describing how far a car can travel in all
directions given a maximum road distance or a driving
time in minutes. Isoline requires a separate license,
please contact Idevio to acquire one.
1. Click on isoline select button in toolbar.
2. Click to set the center of the isoline.
The default road length is 6000 meters. This can be
changed using the advanced setting “selectradius”,
driving time is set with the setting “isolinetime”.
3 – Insert average of longitude and latitude, that will
3.4.6 Select with polygon select
Another method for selection is using a polygon.
1. Click on polygon select button in toolbar.
2. Click to set points of the selection polygon. Place
points so that the polygon contains the points of
insterest.
place the symbol in the right lace on aggregated
levels. For example X: =avg(X) and Y: =avg(Y).
3.6 Advanced settings
The map state and advanced settings are kept in a
special variable, visible in the properties dialog. Normally
the map state is saved automatically and there is no
3. Double-click to end the selection.
need to change this variable manually. The advanced
3.5 Drill-down
user can can edit and change settings that controls the
map. The syntax is: key=value&key2=value2, same as
arguments in a url, using '&' and '=' as separators. It's
also possible to use '&&' and '==' as separators, if for
instance an url with & and = including should be added
as a value. The order of keys and values are not
significant. The following keys and values are valid:
value=default | options
arrangescale=2000 // Zoom level to start arranging
For large datasets that can be grouped, either hierarchic
or cyclic, it's useful to use drill-down. The map supports
drill down, use the group for “Point Id” and make
expressions that calculate the average of the
overlapping symbols in a grid.
autocaption=true|false| // Controls if the title should be
updated automatically or not
barcol1=A2C180 // Sets color of bar chart, value1, hex
heatmapcolors=["#000000cc","#0000cc","#0000ff","#
code: rrggbb.
00ffff","#ffff00","#ff0000"] // The default color ramp for
barcol2=3D7930 // Sets color of bar chart, value2, hex
code: rrggbb.
heatmaps from low value to high value. Hex color
notation #rrggbb or #aarrggbb. It's good to start with a
transparent color for a nice transition.
c_x=11.7 // Default start center coordinate. The map will
however zoom to the cover the area with the current
selection.
c_y=57.9 // Default start center coordinate. The map will
however zoom to the cover the area with the current
selection.
charttype=0|1|2|3 // Specifies symbol type, 0:Bubble,
1:Pie, 2:Bar and 3:URL image.
citylabels=true | false // Switch on and off city labels.
Only available if java is present on the device.
heatmapradius=25 // The radius in pixels or meters of
one point in the heatmap.
heatmapopacity=0.8 // 0-1, decides the transparency, 0
is completely transparent.
heatmapunit=Meters | Pixels // Whether the heatmaps
should have geographic size in meters or in pixels.
individuallinesegments=true | true // Whether track
line segments should be drawn with individual width and
color or the same for the whole line. Lines with one color
are faster to draw.
countrylabels=true | false // Switch on and off country
labels. Only available if java is present on the device.
Get Java free from www.java.com.
initscale=3500000 // Default start scale. The map will
however zoom to the cover the area with the current
selection.
crs=4326|3006|3857 // Default coordinate system for
background map is WGS84 EPSG code 4326.,
SWEREF99 (3006) is supported if custom map data in
isolinetime=5 // Isoline select defined by driving time in
minutes instead of meters.
SWEREF99 is used. Web Mercator (3857) can be used
keepMapstate=false | true // Controls if the map state
in mapmode=html5 for external tile services.
should be read-only
custompopup=false | true // For customizing the popup
labelonsymbol= false | true // Whether the bubble
window. Only the string from Point label is shown the
symbol should have the label printed inside the symbol
pop up. Valid html tags: <b><br><font size=2
or not.
face="arial"></font><img src="http://.."/>
greatcirclearcs=false | true // Whether centric lines
should be straight lines or great circle arcs that follow
the earth approximate curveness.
gridheight=32 // Specifies the grid spacing when
arranging symbols.
gridwidth=32 // Specifies the grid spacing when
arranging symbols.
heatmap=false | true // Whether symbols on the map
should generate a multi color gradient heatmap.
leadlinesvisible= true | false // Whether arranged
symbols should have a lead line or not.
linedirectionarrow= true | false // Whether lines should
have and direction arrow or not.
mapmode=auto|tiled|applet|html5 // Force the map to
be rendered with java or as tiled images or using html5.
maptheme=default|tiledraster|empty // Options for
html5 mode, tiledraster is suitable for slow computers,
empty is no background map at all.
maxrows=800 // Max number of objects per page in
selection.
minisymbolscale=30000000 // Zoom level to switch on
mini symbols.
piecol1=ffffff // Sets color of pie chart, value1, hex
symboldefault=10 // Default bubble symbol size in
pixels
symbolmax=80 // Maximum bubble symbol size in
pixels
code: rrggbb.
symbolmin=5 // Minimum bubble symbol size in pixels
piecol2=A2C180 // Sets color of pie chart, value1, hex
tabletmode=false | true // Gui optimized for ipad and
code: rrggbb.
tablets with bigger buttons etc.
piecolfg=3D7930 // Sets foreground color of pie chart,
toolbar=true | false // Switch on/off the toolbar.
hex code: rrggbb.
tmsurl="" // Available in mapmode html5, url to external
piescale=false | true // Scales the size of the pie chart
tile services. Example:
symbol using Point val1.
http://otile1.mqcdn.com/tiles/1.0.0/sat/{z}/{x}/{y}.jpg
piescale=50 // Size in pixels of pie chart if not scaled.
tmsurl2="" // Available in mapmode html5, an optional
pixelsize=false|true // Size for bubble symbols is set in
pixels.
point_crs=4326|3006|3857 // Default coordinate system
for the data points.
regionAsLineEnd=false | true // If fields for regions id
and color should be used as line end point x, y in centric
line mode.
regions_js=<js file with region polygons> // Specifies
which file to open and read any region polygons.
roadlabels=true | false // Switch on and off road labels.
Only available if java is present on the device.
selectonclick=true|false // If select should be done
object has been clicked.
selectonzoomrect=true|false // If select should be done
after zoom rectangle operation.
selectradius=6000 // Sets the radius in meters of the
select by radius and select by isoline tool.
showlabels=false|true // If labels should be visible or
not
2nd tilelayer, see tmsurl.
tmstilesided="152.874053955078" // The width of the
smallest tile. Only in mapmode html5.
tmstop="-20037508.3428" // Top position of the
smallest tile in tile ref system. Default for a global web
mercator tile set. Only in mapmode html5.
tmsleft="20037508.3428" // Left position of the smallest
tile in tile ref system. Default for a global web mercator
tile set. Only in mapmode html5.
tspmax=12 // Sets the maximum number of points that
can be used for TSP shortest path calculations.
twopievalues=false | true // If a second value should be
used instead of color for pie chart image
zoomrect=true | false // If zoom by rectangle shuld be
enabled.
zoominscale=1000 // Zoom level to zoom to when
clicking on an object.
wmsurl="" // URL to WMS (Web Map Service) image
that will be loaded as a map backdrop when interaction
is ended.
statusbar=true | false // Switch on/off the statusbar.
symbolcontrols=true|false // If controls for symbol
selection should be in toolbar or not.
3.7 Map control
3.7.6 Mouse over details
3.7.1 Zoom
Moving the mouse pointer over an object will make a
popup window with more details appear. The window
Use the “+” and “-” buttons or the slider in the toolbar.
contains values of the dimensions and the expressions
Zooming can also be performed by moving the mouse
up and down while press and hold right mouse button.
The mouse wheel can be used to zoom as well. Double
click on the map (not on a object) will also make the map
to zoom in.
Zooming can also be using the Zoom rectangle tool,
point click and drag a rectangle over the area of interest.
3.7.2 Pan
Pan by moving the mouse while pressing the left mouse
used in the map, or only the label string, see advanced
button on the map. Arrow buttons in the toolbar can also
setting custompopup. The dimensions and the
pan the map
expressions are defined in the map window properties.
3.7.3 Rotate
The map can be rotated using the rotate slider in the
toolbar. Convenient to make the selection fit better the
map.
Rotation is only available if java is present on the device.
Get Java free from www.java.com.
3.7.4 Pitch
The view of the map can be shifted from straight above
3.7.7 Scale/Map window width
to a perspective view using the slider in the toolbar.
Pitch is only available if java is present on the device.
The status bar contains, to the left, an indication of the
current scale. Clicking on the scale will show the current
width of the map window.
3.7.8 Page control
The status bar contains, to the right, a page control
which makes it possible to scroll very large selections.
Use “<” and “>” buttons in the status bar to browse the
selection.
3.7.9 Background map
The default background map is based on
OpenStreetMap data, © OpenStreetMap contributors,
CC-BY-SA.
Other map data is available on request. Idevio can
Example of providers:
MapQuest aerial tiles:
http://otile1.mqcdn.com/tiles/1.0.0/sat/{z}/{x}/{y}.jpg
MapQuest map tiles:
http://otile1.mqcdn.com/tiles/1.0.0/map/{z}/{x}/{y}.jpg
supply maps from Tom Tom, Here, Lantmäteriet and
Stamen watercolor: http://tile.stamen.com/watercolor/{z}/
many others sources.
{x}/{y}.jpg
3.7.10 WMS image as map background
The external source must be defined in Web Mercator,
IdevioMaps can show images from WMS (OGC Web
zoom level z, x, y in url. See example
Map Service) as an alternative map background. The
IdevioMaps_different_map_backgrounds.qvw for usage.
WMS will be loaded as an image when the zooming and
WMTS sources can also be specified, currently EPSG
panning of the map has ended. The URL to the WMS
code 3010, 3011 and 3006 is supported. Use advanced
source is specified in the advanced setting "wmsurl".
setting tmstilesized, tmstop and tmsleft to specify tile
The URL should be complete but without the BBOX,
size and origin.
WIDTH and HEIGHT argument. Example:
EPSG code 3857 and follow the TMS url convention with
3.7.12 Legends
&&wmsurl==http://test.idevio.com/ravegeo/map2/WMS?
LAYERS=_All_&FORMAT=image/png&NAME=WorldEx
There is no internal legend object map, however it's
ample&REQUEST=GetMap&VERSION=1.1.0&BGCOL
easy to create a chart in QlikView that can serve as a
OR=0xFFFFFF&TRANSPARENT=T&SERVICE=WMS&
legend, see for example see it_admin_areas.qvw.
STYLES=&SRS=EPSG:3395
Choosing consistent colors, a.k.a “Silent legend” in the
Recommended (supported) SRS's are EPSG:3395,
QlikView document is an excellent best practice.
EPSG:3857, EPSG:900913. EPSG:4326 works in larger
scales but will distort when zooming out.
Note 1, WMS as a map background is only available in
the non-java version of IdevioMaps, mapmode=tiled.
Note 2, the WMS URLs often contains '&' and '=', please
use the alternative separators in advanced settings: '&&'
and '=='.
Note 3, WMS cannot be combined with gradient
4. Scatter chart support
heatmaps.
For clients that are restricted to older versions (v8, v9) of
3.7.11 External tile sets
Qlikview we provide a way to embed a map as
background to scatter charts. The interaction in a scatter
External tile set providers can be used in IdevioMaps
when in mapmode html5. Use the advanced setting
tmsurl, tmsurl2 to specify source.
charts is more limited compared to the extension, as to
zooming, panning and symbol options. This map service
does not rely on the Qlikview extension API and can be
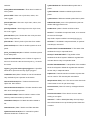
2 – Set Point Size to a numeric value. Higher values
used for OEM solutions and for the IE plugin.
will have stronger impact on the heatmap.
Usage:
Variables for the axis: var_xscale_min, var_xscale_max,
var_yscale_min, var_yscale_max
3 – Press the heatmap button in the toolbar.
The heatmap is normalized based on max and min in
Variables for the backgrund: var_mapurl
the selection and of the points visible in the map window.
1 – Acquire a license and example code from Idevio,
The point radius, heatmap opacity and the heatmap
use web form at www.idevio.com.
units can be customized, see advanced settings.
Please also see the example
2 – Add scatterplot.
Volcanoes_heatmap_example.qvw for demo of the
functionality.
3 – Copy from example workspace load script,
section "IdevioMaps" start to end.
Heatmaps are only available in mapmode auto, tiled and
java, ie not in html5 yet.
4 – In load script:
– Replace x,y with your longitude and latitude.
–
Set scatterplot window width and height.
5 – In scatterplot:
– Set background to =var_mapurl.
– x,y axis max and min to var_xscale_min,
var_xscale_max, var_yscale_min, var_yscale_max.
– Unselect 'force 0'.
–
Set expressions for x,y and z.
6 – Done!
5. Heatmaps
IdevioMaps offers an optional visualization for point
datasets. Based on the value of Point value1/size a multi
color linear gradient layer can be displayed.
1 – Add point data set, set Point Id, X and Y .
6. Route optimization
1 – Select the points of interest to find the shortest
path in between, limit this to 12 points.
IdevioMaps can calculate a shortest path between
points. The distance between points can either be bird
2 – Press the toolbar button “TSP r” for a path
distance or the actual road distance.
based on road distances.
The default max number of points is 12 for shortest path
calculations, if a high end client computer is used this
3 – See the suggested path on the map, black line
can be increased using the advanced setting “tspmax”.
between points. The status bar contains a list of the
6.1 Shortest path, bird distance
order of points.
4 – Click on statusbar to open a separate window
with directions in text.
Usage:
1 – Select the points of interest to find the shortest
path in between, limit this to 12 points.
2 – Press the toolbar button “TSP” for a path based
on bird distances.
Hovering over the line and the breakpoints of the line will
show popup messages with driving directions.
3 – See the suggested path on the map, black line
between points. The status bar contains a list of the
order of points.
6.1 Shortest path, road distance
Actual road distances requires a special license from
Idevio, please contact [email protected] to purchase
such a license.
7. Animation
IdevioMaps is capable of showing maps using different
technologies. Map mode is controlled using the
advanced setting 'mapmode'. The current map modes
are: auto, tiled, java,html5, default mode is auto.
auto, tiled, java
Sometimes it can be useful to animate data in QlikView.
For instance show how a model varies over time, the
hours of the day, the months of the year or just stepping
through data types.
IdevioMaps can render maps on client side, this gives
streaming map with smooth zoom and pan. Another
option is to render maps as tiles of images, the tiled
mode.
Idevio provides a way to do that through a separate
extension the 'IdevioAnimator'. The IdevioAnimator is not
linked explicitly to the map extension, it operates
independently and steps through a selection.
With auto mode IdevioMaps detects if Java is installed
and then starts in java (streaming maps) mode and in
tiled mode if not. Tiled and java mode forces the map to
start with images and with the streaming maps.
Usage:
html5
1 – Install the extension by double-clicking on the
IdevioAnimator.qar file located in the base directory.
This mode renders streaming maps using html5. A
modern browser is required, ie the latest version that
Qlik supports of Chrome, Firefox and Internet Explorer.
2 – Turn on View → “Web View”.
The benefits of using this mode is faster startup time,
printing is better, same appearance on phones and
3 – Add IdevioAnimator to workspace: Right mouse
tablets.
click on background → New sheet object →
Extension Objects → Drag “IdevioAnimator” to
workspace background.
8. Examples
Some of the examples provided with the extension are
4 – Set dimension to iterate over in extension object
also available as web demos at www.idevio.com/demo.
properties: Right mouse click on extension object
title bar → Properties...
Eu.qvw, City statistics from Eurostat
This demo visualizes urban living in a number of
5 – Optional, set “Period” the time in ms to pause,
set “Steps” number of steps to animate.
European cities. The statistical data from Eurostat 20072010. The example demonstrates how point data can be
visualized using bubble, pie, bar and arbitrary images.
Please see examples for usage of IdevioAnimator:
VolvoOceanRace2005.qvw,
se_drilldown_houseprices_scb.qvw and
IdevioMaps_CrimeStats_Chicago.qvw.
8. Map modes
Us_doctors.qvw, US state statistics
The example shows region coloring with data from the
National Center for Educational Statistics 2011. The
regions are defined as US state polygons, with the state
abbreviation as the key.
VolvoOceanRace2005.qvw, Tracks from Volvo Ocean
streamed from a remote server and rendered by the
Race 2005
client.
This example shows line coloring using data and tracks
QlikView calls the extension if the selection has
from Volvo Ocean Race 2005, leg 8 and leg 9. The lines
changed. The call contains an object that holds all
are visualized as tracks, connecting observations of
objects in the current selection. At the first call the map
boats to lines to colored.
window, the toolbar and the status bar is instantiated.
FlightStats.qvw, Ryanair flight from UK statistics
Objects can be shown as bubbles, pies or bar diagrams
during 2010
or an arbitrary image. Regions can be visualized if
The example shows the second line mode, centric lines,
with lines for each object is drawn from a center point.
The data is sourced from www.flightontime.info and
shows delay statistics for RyanAir flights from UK during
2010. Each link is drawn with two lines, width depends
on expressions. Note: start airport must be in selection
to show lines.
Earthquakes.qvw, scatter chart maps example.
geometries and id keys is provided. Lines can be
displayed between symbols if a line id is provided. The
size and the color of symbols, regions and lines are
normalized based on max and min in the selection. If the
values are not numeric but text values, the color values
are picked from a color table. The Qlikview color
functions can also be used to set the color.
The map window will automatically zoom out so that the
whole selection is visible in the map window.
This demo shows IdevioMaps as a background for
scatter charts. Suitable for very large datasets with little
need for interaction and for solutions based on Qlikview
8 and 9. Data from USGS Centennial Earthquake
Catalog.
The map component has a JavaScript interface with
dual implementation. If Java is present on the client,
maps are rendered on the client, otherwise the maps are
shown as server side rendered images.
WorldPostcodes.qvw, drill-down example.
9.2 File structure
This demo shows how to use IdevioMaps for drill-down
The extension consist of the following files:
datasets. Suitable for very large datasets that can be
Definition.xml // Defines the number of dimensions and
grouped, either hiercal or cyclic. The data, approx 900
expressions used by the extension.
000 zip codes, comes from geonames.org.
Properties.qvpp // Defines the look of the property
More examples are provided in the evaluation kit.
dialogue.
Script.js // Main file, defines the behavior of the
9. Idevio Maps extension
details
extension.
jquery-ui-1.8.9.custom.min.js // jQuery UI
jquery-ui-1.8.9.custom.css // jQuery UI, toolbar and
statusbar
9.1 Architecture
jquery-1.4.4.min.js // jQuery, toolbar and statusbar
The IdevioMaps extension is built as a connection
Icon.png // Icon used by New sheet object... dialogue
between the web based map engine from Idevio:
RaveGeo WebMap and QlikView. The map data is
us_states.js // Example file for region coloring
The javascript files are compressed for higher
performance.
www.jquery.com
10. Hints on extension
development
www.jqueryui.com
11.3 QlikView JS API
The documentation for QlikView extension JavaScript
QlikView returns first all dimensions then all
API is available from the start menu when the Qlikview
expressions in this.Data.
server is installed.
F5 in QlikView Desktop will reload the extension,
handy when editing Script.js
If the Definition.xml has changed, the map
extensions:
window must be removed and added again.
http://qliktips.blogspot.com/2011/01/beginners-gui de-to-
Qlikview can't handle extensions in multiple
qlikview-extension.html
versions.
http://qliktips.blogspot.com/2011/01/beginners-guide-to-
Select on several dimensions simultaneously
qlikview-extension_09.html
don't work.
Stephen Redmond has written a nice intro to QlikView
Any resources (CSS, JavaScript, images etc) in
http://qliktips.blogspot.com/2011/01/beginners-guide-toqlikview-extension_4612.html
the extension folder Idevio/IdevioMaps must be
in root, QlikView web server can't address subfolders.
qlikview-extension.html
The map window properties dialog in version
v10 has a fixed size and cannot be resized.
http://qliktips.blogspot.se/2011/04/beginners-guide-to-
Qlikview v11 has new set of gui components and
needs custom made qvpp file and uses jQuery.
11. Links to further
documentation
12. Change log
Ver 4.1.24797: Option to hide/show toolbar and
statusbar.
Ver 4.1.24663: WMTS support through TMS, with tile
side, top left. World wrapping of symbols and lines,
plotting beyond dateline.
Ver 4.1.24344: First version with a new map mode
html5. Heatmap custom color ramp. Default settings for
center and scale. Swedish postal code areas and
Japanese administrative boundaries included.
11.1 Idevio RaveGeo WebMap
Ver 3.1.23778: Route optimization: shortest path
between points, bird and road distance. New selection
tools with radius, isoline, polygon. Max rows bug fixed.
The extension is based on Idevio's web based map
Ver 2.3.23342: Animation control of dimension, label
inside bubble symbols, scalable pie chart symbols.
engine: RaveGeo WebMap2 and WebMap5:
Ver 2.3.23235: Gradient heatmaps now in streaming
version. Fixed qv bug at exit/switching tabs. Sweref99
support.
http://developer.idevio.com.
11.2 jQuery
jQuery is used for customize the map extension with a
toolbar and a status bar.
Ver 2.3.22968: Multicolor linear gradient heatmaps and
WMS backdrops. Alternative separators in advanced
settings. New examples.
Ver 2.3.22851: New drill down region examples, Italian
and French municpalities. Bug fixes and improved error
handling for regions.
Ver 2.3.22806: Popup windows can be customized with
html tags. First line as label.
Ver 2.3.22778: City and road labels can be switched off.
Leadlines in symbol arranging can be switched off. Grid
size in symbol arranging can be customized. Bubble
symbols can be specified in pixels. Transparency can be
set for regions, lines and symbols. Edges on regions are
now white. Bug fix for resize problem in Internet
Explorer. No rezoom after symbol change. No rezoom
after label on/off
with expressions.
Ver 2.3.22617: Hierarchical region files, local or from
web service.
Ver 2.3: Demo design updated.
Ver: 1.20819: Added error handling on dirty x,y. Select
on zoom.
Ver 2.22518: New design of IdevioMaps, toolbar, demos
and manual.
Ver 2.22471: Qlikview v11 specific prop page. Select on
click and zoom rect. Bar and pie chart custom colors.
Bugfix for IE9.
Ver 2.22193: Bugfix for IE7, toolbar not visible, sliders
now v11 look.
Ver 2.22066: New example, countries of the world as
regions. Semitransparent labels. Country labels on/off.
Popup dialogs on click.
Ver 2.21920: License key now in properties dialog
Ver 2.21830: Verified on Qlikview v11, regions specified
in advanced settings.
Ver 2.21773: Fix for invalid characters in region id.
Ver 2.21749: Great circle arcs and width and color on
line segments.
Ver: 1.21173: Added support for Qlikview ARGB
functions.
Ver: 1.20928: Added arrows on lines.
Ver: 1.20832: Improved region handling
Ver: 1.20574: Zoom rectangle tool, more settings,
default rows and scales.
Ver: 1.20519: Added centric line mode with end point in
column.
Ver: 1.20353: mapstate: saves map state in qv doc,
keepMapstate: makes map state readonly, autocaption:
custom title on/off, tabletmode: bigger buttons etc for
ipads, linemode star: lines originating from center points.
RGB function enabled in expressions. Version number
on load and about. Same scale for bar and line widths.
Ver: 1.19731: Expressions for region color, local js files
for regions.
Ver: 1.19662: Line support.
Ver: 1.19563: Multiregion coloring, opt map license key
in properties.
Ver: 1.19520: Area coloring.
Ver: 1.19504: Expressions for value and label.
Ver: 2.21744: Upgraded to jQuery 1.7, jQuery UI 1.8.9,
Fixed IE7 bug, Removed pitch and skew slider in tablet
mode, Nicer error messages.
Ver: 1.19349: Added page control
Ver: 2.21622: Enabled drill-down, replaced dimensions
Ver: 1.18392: Added jquery, jquery ui
Ver: 1.19083: Statusbar added.