1
Sales Analysis
User Manual
Copyright© 2014 by Samco Software Inc.
PROPRIETARY RIGHTS NOTICE: All rights reserved. No part of this material may be reproduced or transmitted
in any form or by any means, electronic, mechanical, or otherwise, including photocopying and recording or in
connection with any information storage or retrieval system, without the permission in writing from SAMCO Software
Inc.
SAMCO Software Inc. ("SAMCO") has taken reasonable preventative measure to ensure the accuracy of the
information contained in this manual. However, SAMCO makes no warranties or representations with respect to
the information contained herein; and SAMCO shall not be liable for damages resulting from any errors or omissions
herein or from the use of the information contained in this manual.
SAMCO is a registered trademark of SAMCO Software Inc., Unit 61 - Building 6, 7789 - 134th Street, Surrey,
British Columbia V3W 9E9, Canada. Telephone (604) 597-4211. http://www.samco.com
Other product and company names are trademarks of their respective corporations.
Table of Contents
Introduction ..................................................................................... 1.1
A/R and I/C Reports ............................................................................ 1
P/S, Billing (O/E), and P/I Reports ........................................................... 2
Sales Analysis Menu ............................................................................. 2
Getting Started ................................................................................. 2.1
Regular Use ...................................................................................... 1
To Start Sales Analysis.......................................................................... 2
Customer ........................................................................................ 3.1
Customer Profit ................................................................................ 4.1
Customer Sales Volume ....................................................................... 5.1
Customer Type ................................................................................. 6.1
Customers for an Item ........................................................................ 7.1
Item ............................................................................................... 8.1
Item Category................................................................................... 9.1
Item Sales Volume ........................................................................... 10.1
Items for a Customer ........................................................................ 11.1
Province / State .............................................................................. 12.1
Postal / Zip Code ............................................................................. 13.1
Sales Rep - Actual ............................................................................ 14.1
Sales Rep - Responsible ..................................................................... 15.1
User Defined .................................................................................. 16.1
Loading previously save reports............................................................... 2
Entering Report Criteria ....................................................................... 2
Saving a Report .................................................................................. 7
Services for a Customer .................................................................... 17.1
Customers for a Service .................................................................... 18.1
Customer Product............................................................................ 19.1
Monthly Activity Analysis ................................................................... 20.1
Loading previously save reports............................................................... 1
Sorting options .................................................................................. 1
Sales Analysis
Samco Power Accounting
Table of Contents
1
Cat / Sub-Cat for a Customer .............................................................. 21.1
Five Year Item History ...................................................................... 22.1
X. Export Printer Reports .................................................................. 23.1
Available Reports ............................................................................... 1
Printing reports to an export file ............................................................. 1
How to set the default for opening a SAMCO .tab file in Windows XP .................... 4
How to set the default for opening a SAMCO .tab file in Windows 7 ..................... 8
____________________
Sales Analysis
Samco Power Accounting
Table of Contents
2
Chapter 1
Introduction
Sales Analysis includes most of the features asked for by thousands of users whose
experience over the years with earlier versions of this package have helped refine it to
its current mature level.
Sales Analysis (aka S/A) runs together with the Accounts Receivable (A/R), Inventory
(I/C), Billing (O/E), Point of Sale (P/S), and Professional Invoicing (P/I) packages. You
can use S/A with:
A/R only
I/C only
I/C and P/S
A/R, I/C, and P/S
A/R, I/C, and Billing (O/E),
A/R and P/I
A/R, I/C, and P/I
Any reports can be stored on disk to save computer time, then printed later at your
convenience. Sales Analysis also allows use of multiple printers.
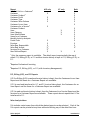
A/R and I/C Reports
The following table shows the reports which are available when using A/R only, when
using I/C only, or when both A/R and I/C are in use:
Sales Analysis
Samco Power Accounting
Introduction
1-1
Report
Cat/Sub Cat for a Customer3
Customer
Customer Product3
Customer Profit
Customer Type
Customer Sales Volume
Customer for an Item
Customers for a Service2
Customer Product
Item
Item Category
Item Sales Volume
Items for a Customer
Monthly Activity Analysis3
Postal Code
Province
Sales Rep, Responsible
Sales Rep, Actual
Services for a Customer
User Defined Report
A/R only
I/C only
X
X
X
X
Both
X
X
X
X
X
X
X
X
X
X
X
X
X
X
X1
X2
X
X
X
X
X
X
X
X
X
X
X
X*
X
1
Only the summary report is available. The detail report requires both the use of
either P/S, Billing (O/E), or P/I and that invoice history is kept in P/S, Billing (O/E), or
P/I.
2
Requires Professional Invoicing.
3
Requires P/S, Billing (O/E), or P/I (with Inventory Management).
P/S, Billing (O/E), and P/I Reports
If P/S or Billing (O/E) is used and invoice history is kept, then the Customers for an Item
Report and the Items for a Customer Report are available.
If P/I is used and interfaced to I/C, and P/I invoice history kept, the Customers for an
Item Report and the Items for a Customer Report are available.
If P/I is used and invoice history is kept, then the Customers for a Service Report and the
Services for a Customer Report are available. These reports do not require that I/C be
interfaced to P/I.
Sales Analysis Menu
S/A includes a mini-menu from which the desired reports can be selected. Each of the
S/A reports can be printed at any time without affecting any of the data files from
Sales Analysis
Samco Power Accounting
Introduction
1-2
which they draw their information.
Customer Report
This report shows period-to-date, year-to-date, and last year sales, cost of sales, gross
profit figures, and margin percent for each customer in Accounts Receivable. Each
customer's percent of total sales and percent of total gross profit is also shown.
Customer Type Report
This report shows the same information as the Sales Analysis by Customer, but
customers are grouped and subtotalled by customer type. ("Customer type" is a
user-defined, 3-character code that can be assigned to each customer in Accounts
Receivable or Professional Invoicing.)
A summary is printed for this report, showing each customer type's total sales, total cost
of sales, total gross profit, percent of total sales, and percent of total gross profit.
Customer Sales Volume Report
This report lists customers in order by sales volume. It shows sales, costs of sales, gross
profit figures, and margin percent, as well as each customer's percent of total sales and
percent of total gross profit. These amounts are shown for period-to-date,
year-to-date, and last year.
Customers can be printed in order by either period-to-date, year-to-date, or last year
sales dollar volume.
Optionally, you can specify a minimum dollar volume, or you can specify to print only
the top "n" customers (where "n" is any number from 1 to 9,999).
Sales Rep, Responsible, Report
This report shows the period-to-date, year-to-date, and last year sales, cost of sales,
and gross profit, and margin percent for each customer. These figures are grouped by
responsible sales rep with subtotals by sales rep.
The report includes a summary which shows each sales rep's percent of total sales and
percent of total gross profit.
Sales Rep, Actual, Report
Two formats are available for this report: summary and detail. For each sales rep,
the summary format shows the sales amount, percent of total company sales, cost of
sales, profit, percent margin, percent commission amount, and commission percent of
sales. The detail format shows the above information for each customer for each sales
rep.
Sales Analysis
Samco Power Accounting
Introduction
1-3
Province Report
Customers are printed grouped by province on this report. Sales, cost of sales, gross
profit figures, and margin percent are shown for each customer. Subtotals are shown
by province.
A summary is produced which shows each province's percent of total sales and percent
of total gross profit.
Postal Code Report
Customers are printed grouped by postal code on this report.
A summary shows individual postal code percent of total sales, cost of sales, profits, and
margin percent for the period-to-date and year-to-date.
Item Report
This report shows basic sales information for each item in Inventory Management.
The information printed includes quantity sold, quantity returned, sales amount, costs,
gross profit, margin percent, and each item's percent of total sales and percent of total
gross profit, by both period-to-date and year-to-date. Prior period figures can also be
shown.
Item Category Report
This report shows the same information as the Item Report, but items are grouped and
subtotalled by item category or item sub-category. ("Item category" and
"sub-category" are user-defined, 5-character codes that can be assigned to each item.)
A summary is printed for this report which shows each item category's or sub-category's
total sales, total cost of sales, total gross profit, percent of total sales, and percent of
total gross profit.
Item Sales Volume Report
This report lists items in order by sales volume. It shows sales, costs of sales, gross
profit, and margin percent figures, as well as each item's percent of total sales and
percent of total gross profit.
Items can be printed in order by either period-to-date or year-to-date sales dollar
volume. You can also specify a minimum dollar volume or specify to print only the top
"n" items ("n" is any number from 1 to 9,999).
Items for a Customer Report
This report shows quantity sold, sales, percent of sales, cost of sales, profit, and margin
Sales Analysis
Samco Power Accounting
Introduction
1-4
percent for a selected range of items within up to four selected reporting periods,
showing the items purchased by each customer.
Customers for an Item Report
This report shows the same information as the preceding report, arranged by item,
showing the customers who purchased each item.
Services for a Customer Report
This report shows quantity sold, sales, percent of sales, cost of sales, profit, and margin
percent for a selected range of services within up to four selected reporting periods,
showing the services purchased by each customer.
Customers for a Service Report
This report shows the same information as the preceding report, arranged by service,
showing the customers who purchased each service.
User Defined Report
This report allows you to create your own analysis report. You determine what
information is printed, how it is sorted, and what reporting periods to analyse.
Monthly Activity Analysis
With plenty of selection criteria and variations, this is a 13 month columnar report for
product sales.
Customer Product
Sorted by customer, this report provides a quarterly and periodic analysis summarized
by item category.
Cat / Sub-Cat for a Customer
Available in a detail or brief format, this report, sorted by customer, shows the unit and
dollar sales for each item category and sub-category for the specified date ranges.
SAM (Samco's Automated Manuals)
A revised edition of this and all Samco user manuals is available on-line from within any
function of Samco's business applications. Simply press [F10] ([F11] for the Windows
version) and SAM will guide you to whatever information you need, or contact
[email protected] for further assistance.
____________________
Sales Analysis
Samco Power Accounting
Introduction
1-5
Chapter 2
Getting Started
We assume at this point that you have installed Sales Analysis on your computer
according to the Installation Guide. If you have not done so, refer to that manual and
install the S/A package before proceeding.
We also assume that you have familiarized yourself with the main features of this
package by reading the chapter titled Introduction. If you have not done so, read that
chapter now, then, return to this chapter.
Your Accountant
We advise you to consult with your accountant before using Samco software. Your
accountant should be familiar with your accounting software in order to serve you well,
and may have good advice on converting from your existing S/A system.
The Sales Analysis Data Files
Unlike other Samco packages, you don't have to create any data files for Sales Analysis.
The information used in the S/A reports comes from the data files of Accounts
Receivable, Inventory Management, Point of Sale, Billing (O/E), and Professional
Invoicing.
Regular Use
S/A is ready for use as soon as it's installed. Refer to the System Functions manual for
instructions on turning it on in each company ID you want to use it in.
Sales Analysis
Samco Power Accounting
Getting Started
2-1
The remaining chapters explain the S/A reports. The reports show sales, cost, and
profit information that will help you spot such things as the best-selling items or item
categories, the most profitable sales region, the most productive sales personnel, or
your best customers.
Note: The “grand totals” printed on a Sales Analysis Report often reflect the total
quantity and / or value of all sales. “Grand totals” are often misinterpreted as “column
totals”.
Samco Support
This manual, in combination with your System Functions manual, is designed to allow
you to use Sales Analysis without additional help.
However, if you encounter problems you cannot resolve by referring to these manuals,
you may want to get additional assistance. Your supplier may be able to provide such
assistance, or he may be able to recommend an independent source.
If all else fails, contact:
Samco Help Desk
61 - 7789 - 134th Street
Surrey, B.C. V3W 9E9
Tel: (604) 597-4211
Fax: (604) 597-7320
E-mail: [email protected] or [email protected]
Web: http://www.samco.com
There will be a fee for support service from Samco.
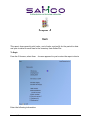
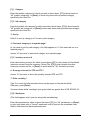
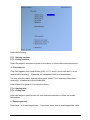
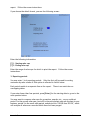
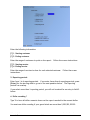
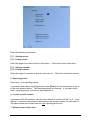
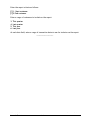
To Start Sales Analysis
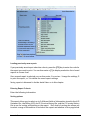
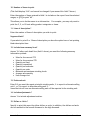
From your company ID's main menu select Sales Analysis. (If Sales Analysis does not
appear on the main menu refer to the chapter titled Company Data in the Systems
Function manual for details.)
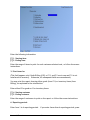
All of the reports available for printing are displayed on this screen. A second screen is
available for less commonly used functions. To get to page 2 of the menu, press [F2]
from page 1. Make selections from page 2 the same way as from page 1.
To return to page 1 of the menu, press [Tab].
To Exit the S/A Package
To exit the S/A package, press [Tab] from the S/A menu. The main menu reappears for
you to select another module to work with.
____________________
Sales Analysis
Samco Power Accounting
Getting Started
2-2
Chapter 3
Customer
This report shows sales, cost of sales, and profit figures for the period-to-date,
year-to-date, and last year for each customer in the Customer file.
To Begin
From the S/A menu select Customer.
____________________
Sales Analysis
Samco Software Inc.
Customer
3.1
Chapter 4
Customer Profit
As the title implies, this report provides a summary analysis of customer profitability.
To Begin
From the S/A menu select Customer profit.
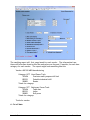
On the screen displayed, enter the following information:
1. Period-to-date or year-to-date ?
Enter P to base the report on period-to-date sales, or Y for year-to-date sales. This
information comes straight from the customer record. If you have recently run the
period end processing in A/R then your numbers may be quite low.
2. Minimum profit level
Enter the customer’s minimum profit amount to include on the report or press F1 for no
minimum. For example, if you enter 5,000 then only those customers who have reached
5,000 in profit will be included on the report.
3. Number of customers to print
This field allows you to limit the number of clients printed on the report.
____________________
Sales Analysis
Samco Power Accounting
Customer Profit
4.1
Chapter 5
Customer Sales Volume
This report lists customers in order by sales volume. It shows sales, cost of sales, and
profit figures for the period-to-date, the year-to-date, and last year for each customer.
It is based on the A/R Customer File.
To Begin
From the S/A menu, select Customer sales volume.
On the screen displayed, enter the following information:
1. Print customers in order by
Enter one of the following:
P To show customers in order by their period-to-date sales volume
Y To show them in order by their year-to-date sales volume.
L To show them in order by their last-year's sales volume.
2. Minimum sales volume level
Enter the minimum sales volume (either PTD or YTD as specified above) that will qualify
a customer to appear on the report.
Entering zero means that there is no minimum sales volume level. In this case, all
Sales Analysis
Samco Software Inc.
Customer Sales Volume
5.1
customers will be printed on the report. You can also press [F1] for "None", meaning
no sales volume cut-off.
3. Number of customers to print
Enter the number of customers you want to show on the report, or press [F1] to show
"All" customers.
The report will print customers in order by sales volume, from greatest to least, but will
stop after the number of customers entered here has been printed. This way you can
look at your top 10, 20, or 100 customers.
____________________
Sales Analysis
Samco Software Inc.
Customer Sales Volume
5.2
Chapter 6
Customer Type
This report shows sales, cost of sales, and profit figures for the period-to-date, the
year-to-date, and last year for each customer. Customers are grouped according to
their customer type, followed by a summary showing grand totals for all customers and
for each type of customer.
To Begin
From the S/A menu, select Customer type. A screen appears for you to answer the
following questions:
1. Print each customer type on a separate page ?
Answer Y to insert a page break between each customer type group; otherwise answer
N.
2. Detail or summary ?
Enter D to print both detailed information for each customer, and the summary totals
for each customer type. Enter S to print the summarized totals for each customer type
only.
____________________
Sales Analysis
Samco Software Inc.
Customer Type
6.1
Chapter 7
Customers for an Item
This report shows quantity sold, sales amount, percent of sales, cost of sales, profit,
percent of profit, and margin percent for a selected range of items and the customers
those items were sold to, within up to four selected reporting periods.
Percentages are based on sales and profits within the selected reporting period.
You can print this report in order by sales volume based on sales in the first selected
reporting period.
If you are using Billing (O/E) or P/S, the amounts shown for items are obtained from the
Invoice History File (if you keep invoice history).
If you are using P/I, the amounts shown for items are obtained from the P/I Invoice
History File (if you keep invoice history).
If you are using Billing (O/E) or P/S, and P/I (with P/I interfaced with Inventory), you
may choose to print either goods (from P/I) or inventory items (from Inventory) on a
particular print run.
To Begin
From the S/A menu, select Customers for an item.
This is the screen you see:
Sales Analysis
Samco Software Inc
Customers for an Item
7.1
Enter the following information:
[?] 1. Starting item
[?] 2. Ending item
Enter the range of items to print for each customer selected next, or follow the screen
instructions.
3. Print items for
(This field appears only if both Billing (O/E) or P/S, and P/I are in use and P/I is not
interfaced to Inventory. Otherwise, all subsequent fields are renumbered.)
You may print the report showing either goods (from P/I) or inventory items (from
Billing), as explained in the introduction.
Enter either G for goods or I for inventory items.
[?] 4. Starting customer
[?] 5. Ending customer
Enter the range of customers to print on the report or follow the screen instructions.
6. Reporting periods
Enter from 1 to 4 reporting periods. If you enter fewer than 4 reporting periods, press
Sales Analysis
Samco Software Inc
Customers for an Item
7.2
[Enter] for the starting date to go on to the next question below. The reporting
periods can overlap. If you select more than 1 reporting period, you will not be asked
question 10 below.
7. In order by sales volume ?
If you answer N to this question, you are not asked for an entry in field 8 or 9. If you
answer Y, items are printed in descending order of sales volume for each customer.
The sales volume used is that from the first reporting period only.
8. Minimum sales volume level
Enter a minimum sales volume level or press [F1] for "None" (show all items). If you
enter a sales volume level, only items with a sales volume equal to or greater than this
level will be shown on the report.
9. Number of items to print
Enter the number of items you wish to print for each customer or press [F1] to print "All"
items.
10. Brief format ?
Answer Y or N. You will not be asked this question if you entered more than one
reporting period in field 6 above.
[?] 11. Warehouse
(You are asked for this information if you use multi-warehousing in Inventory.)
Enter a warehouse code or press [F1] for “All” warehouses. A blank warehouse code
represents “Central”.
____________________
Sales Analysis
Samco Software Inc
Customers for an Item
7.3
Chapter 8
Item
This report shows quantity sold, sales, cost of sales, and profit for the period-to-date
and year-to-date for each item in the Inventory Item Status File.
To Begin
From the S/A menu, select Item. A screen appears for you to enter the report criteria:
Enter the following information:
Sales Analysis
Samco Software Inc.
Item
8.1
[?] 1. Warehouse
(This field appears only if you are using multi-warehousing in Inventory Management.
Otherwise, all subsequent fields are renumbered.)
Enter a warehouse code, press [F1] for “All” warehouses, press [Enter] to show only
items with a "Central" warehouse code (if you defined a Central warehouse code in the
InventoryWarehouses selection).
[?] 2. Starting item #
[?] 3. Ending item #
Enter the range of items to show on the report.
[?] 4. Inventory account #
Enter the Inventory account for which to show items, [F1] for the default Inventory
account from the Inventory Control File, [F2] to scan through the other Inventory
accounts on file, or [Enter] for "All" Inventory accounts.
[?] 5. Product category
Enter the product category for which you wish to show items on the report, [F1] to show
items for "All" product categories, or [Enter] to show only items with no product
category specified in the Item File
[?] 6. Product sub-category
Enter the product sub-category for which you wish to show items, [F1] to show items for
"All" product sub-categories, or [Enter] to show only items with no product sub-category
specified in the Item File.
7. ABC category
Enter an ABC category (see the Inventory User Manual for a definition of ABC category)
or use press [F1] for "All" ABC categories
8. Show qty-returned for PTD and YTD ?
Answer Y to show the quantity returned PTD (period-to-date) and YTD (year-to-date).
9. Dollar rounding ?
Type Y to round all dollar amounts shown on the report to the nearest dollar.
You must choose dollar rounding if your grand totals are greater than 9,999,999,999.99.
Sales Analysis
Samco Software Inc.
Item
8.2
10. Show prior periods ?
Answer Y to show prior periods as defined in the INVENTORY Control File, or N to show
the current period only.
Include qty-returned ?
(This field displays only if you chose to show quantity returned for PTD and YTD in field
8 and chose to show prior periods in field 10.)
Answer Y to show quantity returned figures for prior periods.
11. Starting period
12. Ending period
Enter a range of item tracking periods (1 - 999) to include on the report.
____________________
Sales Analysis
Samco Software Inc.
Item
8.3
Chapter 9
Item Category
This report shows quantity sold, sales, cost of sales, and profit figures for the
period-to-date and the year-to-date for each inventory item in the Item Status File,
grouped according to the item's category or sub-category.
A summary showing category or sub-category totals is printed at the end of the report.
To Begin
From the S/A menu, select Item category. The following screen appears:
Enter the following information:
Sales Analysis
Samco Software Inc.
Item Category
9.1
[?] 1. Category
Enter the product category for which you wish to show items, [F1] to show items for
"All" product categories, or [Enter] to show only items with no product category
specified in the Item File.
[?] 2. Sub-category
Enter the product sub-category for which you wish to show items, [F1] to show items for
"All" product sub-categories, or [Enter] to show only items with no product sub-category
specified in the Item File.
3. Sort by
Enter C to sort by category or S to sort by sub-category.
4. Print each category on a separate page ?
(If you chose to sort by sub-category, this field appears as "4. Print each sub-cat on a
separate page ?")
Answer Y if you want to print each category on a separate page.
[?] 5. Inventory account #
Enter the inventory account for which to print items, [F1] to print items for the default
inventory account from the Inventory Control File, [F2] to scan through the other
inventory accounts on file, or [Enter] to print items for "All" inventory accounts.
6. Show qty-returned for PTD and YTD ?
Answer Y if you want to show the quantity returned PTD and YTD.
7. Dollar rounding ?
Type Y to round all dollar amounts shown on the report to the nearest dollar.
Otherwise, press [Enter].
You must choose dollar rounding if your grand totals are greater than 9,999,999,999.99.
[?] 8. Warehouse
(This field appears only if you are using multi-warehousing.)
Enter the warehouse for which to print the report, [F1] for "All" warehouses, or [Enter]
to print only items with a "Central" warehouse code (if you left the warehouse code
blank in the Inventory Warehouses selection).
Sales Analysis
Samco Software Inc.
Item Category
9.2
9. Detail or summary ?
Enter D to print both detailed information for each item, and the summary totals for
each item category.
Enter S to print the summarized totals for each item category only.
____________________
Sales Analysis
Samco Software Inc.
Item Category
9.3
Chapter 10
Item Sales Volume
This report lists inventory items in order by dollar sales volume, from greatest to least.
It shows quantity sold, sales, cost of sales, and profit figures for the period-to-date and
the year-to-date.
It is based on information from the Inventory Item Status File.
To Begin
From the S/A menu, select Item sales volume. This is the screen you see:
Sales Analysis
Samco Software Inc.
Item Sales Volume
10.1
Enter the information as follows:
1. Period-to-date or year-to-date ?
Enter P to print items in order by period-to-date sales volume. Enter Y to print them in
order by year-to-date sales volume.
2. Minimum sales volume level
This field allows you to examine the sales statistics for items whose sales equal or
exceed a specified volume, and to ignore those items with sales volume below this
level.
Enter the minimum sales volume (either PTD or YTD as specified above) that will qualify
an item to appear on this report, or [F1] for "None" (no minimum sales volume cut-off).
In this case, all items will print on the report.
[?] 3. Inventory account #
Enter the inventory account for which to print items, [F1] to print items for the default
inventory account from the Inventory Control File, [F2] to scan through the other
inventory accounts on file, or [Enter] to print items for "All" inventory accounts.
[?] 4. Product category
Enter the product category for which you wish to show items, [F1] to show items for
"All" product categories, or [Enter] to show only items with no product category
specified in the Item File.
[?] 5. Product sub-category
Enter the product sub-category for which you wish to show items, [F1] to show items for
"All" product sub-categories, or [Enter] to show only items with no product
sub- category specified in the Item File.
6. Show qty-returned for PTD and YTD ?
Answer Y to show the quantity returned PTD (period-to-date) and YTD (year-to-date).
7. Number of items to print
Enter the number of items to print on the report or [F1] to print "All" item.
The report prints items in order by sales volume, from greatest to least, but stops after
the number of items entered here is printed. In this way, you can look at your 10, 20,
or 100 top-selling items.
Sales Analysis
Samco Software Inc.
Item Sales Volume
10.2
8. Dollar rounding ?
Type Y to have all dollar amounts shown on the report rounded to the nearest dollar.
You must use dollar rounding if your grand totals are more than 9,999,999,999.99.
[?] 9. Warehouse
(This field appears only if you are using multi-warehousing.)
Enter the warehouse for which to print the report, [F1] for "All" warehouses, or [Enter]
to print only items with a "Central" warehouse code (if you left the warehouse code
blank in the Inventory Warehouses selection).
____________________
Sales Analysis
Samco Software Inc.
Item Sales Volume
10.3
Chapter 11
Items for a Customer
This report shows quantity sold, sales, percent of sales, cost of sales, profit, and margin
percent for a selected range of customers and the items sold to these customers, within
up to four selected reporting periods.
Percentages are based on sales and profits within selected reporting ranges.
You can print this report in order by sales volume based on sales in the first selected
reporting period.
If you are using Billing (O/E) or P/S, the amounts shown for items are obtained from the
Invoice History File (if you keep invoice history).
If you are using P/I, the amounts shown for items are obtained from the P/I Invoice
History File (if you keep invoice history).
If you are using a combination of Billing (O/E) or P/S, and P/I (with P/I interfaced with
Inventory), the amounts shown for items will include information obtained from both
history files.
If you are using a combination of Billing (O/E) or P/S, and P/I (with P/I not interfaced
with Inventory), you may choose to print either goods (from P/I) or inventory items
(from IC) on a particular print run.
To Begin
From the S/A menu, select Items for a customer. This is the screen you see:
Sales Analysis
Samco Software Inc.
Items for a Customer
11.1
Enter the following:
[?] 1. Starting customer
[?] 2. Ending customer
Enter the range of customers to print on the report or follow the screen instructions.
3. Print items for
(This field appears only if both Billing (O/E) or P/S, and P/I are in use and P/I is not
interfaced to Inventory. Otherwise, all subsequent fields are renumbered.)
You may print the report showing either goods (from P/I) or inventory items (from
Inventory), as explained in the introduction.
Enter either G for goods or I for inventory items.
[?] 4. Starting item
[?] 5. Ending item
Enter the range of items to show for each selected customer or follow the screen
instructions.
6. Reporting periods
Enter from 1 to 4 reporting periods. If you enter fewer than 4 reporting periods, press
Sales Analysis
Samco Software Inc.
Items for a Customer
11.2
[Enter] for the starting date to go on to the next question below. The reporting
periods can overlap.
If you select more than 1 reporting period, you will not be asked for an entry in field 11
below.
7. Dollar rounding ?
Type Y to have all dollar amounts shown on the report rounded to the nearest dollar.
You must use dollar rounding if your grand totals are more than 9,999,999,999.99.
8. In order by sales volume ?
If you answer N to this question, you are not asked for an entry in field 9 or 10. If you
answer Y, items are printed in descending order of sales volume for each customer.
The sales volume used is that from the first reporting period only.
9. Minimum sales volume level
Enter a minimum sales volume level, or [F1] for "None" (show all items).
If you enter a sales volume level, only items with a sales volume equal to or greater than
this level will be shown on the report.
10. Number of items to print
Enter the number of items you wish to print for each customer or [F1] to print "All"
items.
11. Brief format ?
Answer Y or N. You will not be asked this question if you entered more than one
reporting period in field 6 above.
___________________
Sales Analysis
Samco Software Inc.
Items for a Customer
11.3
Chapter 12
Province / State
This report shows sales, cost of sales, and profit figures for the period-to-date, the
year-to-date, and the last year for each customer, with the customers in order by
province / state.
A summary of individual province / state totals is printed at the end of the detailed
report, or can be printed separately as a summary version of the report.
The information is obtained from the A/R Customer file.
To Begin
From the S/A menu select Province (Canadian companies) or State (U.S. companies)
A screen appears for you to answer the following questions:
1. Print each prov. on a separate page ?
Answer Y to insert a page break between each province; otherwise answer N.
2. Detail or summary ?
Enter D to print both detailed information for each customer, and the summary totals
for each province / state. Enter S to print the summarized totals for each province /
state only.
____________________
Sales Analysis
Samco Software Inc.
Province/State
12.1
Chapter 13
Postal / Zip Code
This report shows sales, cost of sales, and profit figures for the period-to-date , the
year-to-date, and last year for each customer, with the customers in order by the postal
code.
A summary of individual postal code totals is printed at the end of the detailed version
of the report. Optionally, you can print the summary portion of the report only.
To Begin
From the S/A menu, select Postal code. A screen appears for you to answer the
following questions:
1. Print each postal code on a separate page ?
Answer Y to insert a page break between each postal code group; otherwise answer N.
2. Detail or Summary ?
Enter D to print both detailed information for each customer, and the summary totals
for each postal code group.
Enter S to print the summarized totals for each postal code group only.
3. Characters to sort on
Enter the number of characters (1 - 10) of the postal code to group by for reporting. For
example, if you want to sort and group the report by the first 2 characters of the postal
code enter 2.
____________________
Sales Analysis
Samco Software Inc.
Postal/Zip Code
13.1
Chapter 14
Sales Rep - Actual
This report prints information about the actual sales made by a sales rep, versus the
responsible sales made by a sales rep. A sales rep is responsible for a customer because
the customer is assigned to him in the Customer File.
To print the detail format of this report requires that both Inventory and Accounts
Receivable, and either Billing (O/E), Point of Sale, or Professional Invoicing be in use.
The summary report prints PTD and YTD summary information for each sales rep. The
data for this report is obtained from the A/R Sales Rep File.
The detail report, which you can also sort by decreasing sales volume, shows the sales,
cost of sales, profits, and margins for a specified number of customers for each sales
rep. If you are using Billing or P/S , the information shown is obtained from the Invoice
History File (if you keep invoice history). If you are using P/I, the information shown is
obtained from the P/I Invoice History File (if you keep invoice history). If you are using
a combination of either Billing or P/S, and P/I, the information shown is obtained from
both packages.
NOTE: Billing and P/S share the same Invoice History file.
To Begin
From the Sales Analysis menu, select Sales rep, actual.
A screen appears and you are asked to select either 1 for summary format or 2 for detail
format.
If you choose the summary format, a menu appears for you to select how to print the
Sales Analysis
Samco Software Inc.
Sales Rep - Actual
14.1
report. Follow the screen instructions.
If you choose the detail format, you see the following screen:
Enter the following information:
[?] 1. Starting sales rep
[?] 2. Ending sales rep
Enter the range of sales reps for which to print the report. Follow the screen
instructions.
3. Reporting periods
You may enter 1 to 4 reporting periods. Only the first will be used for sorting
customers by sales volume if that option is selected in field 4 below.
Each period results in a separate line on the report. There is no restriction on
overlapping dates.
If you enter fewer than four periods, press [Enter] for the starting date to go on to the
next question below.
You may want to compare sales reps for promotion, awards, etc., so you could set
period 1 to the current sales year, period 2 to the period when sales are the best in your
business, period 3 to the worst sales period, and period 4 to "010100 thru 123120", which
will analyze all sales ever recorded which have not been purged.
Sales Analysis
Samco Software Inc.
Sales Rep - Actual
14.2
4. In order by sales volume ?
Answer Y to sort customers by sales volume, in descending order based on their sales
volume in period 1. Answer N to sort customers in customer number order. If you
answer N, you are not asked for an answer in the fields 5 and 6 below.
5. Minimum sales volume level
This field allows you to examine the sales statistics for customers whose invoices equal
or exceed a specified volume, and to ignore those customers with sales volume below
this level. Enter a minimum sales volume, or use press [F1] for no minimum.
6. Number of customers to print
Enter the number of customers to print or press [F1] for all customers. This is the
number of customers for each sales rep on the report, not the total number of
customers on the entire report.
7. New page for each sales rep ?
Answer Y to start each new sales rep on a new page. If a sales rep has many customers,
choosing Y makes the report easier to read.
___________________
Sales Analysis
Samco Software Inc.
Sales Rep - Actual
14.3
Chapter 15
Sales Rep - Responsible
This report shows sales, cost of sales, and profit figures for the period-to-date, the
year-to-date, and the last year for each customer, with customers categorized by the
customer's assigned sales representative. A summary lists sales rep totals only.
Customers are listed by responsible sales rep. This is the sales rep assigned to the
customer on the customer record. This is not necessarily the actual sales rep that
made each sale to that customer. (For the actual sales for a sales rep, see the next
chapter.)
The report is based on the A/R Customer file.
To Begin
From the S/A menu, select Responsible sales rep.
A screen appears for you to answer the following questions:
1. Print each sales rep on a separate page ?
Answer Y to insert a page break for each new sales rep.
2. Detail or Summary ?
Enter D to print both detailed information for each customer, and the summary totals
for each sales rep. Enter S to print the summarized totals for each sales rep only.
____________________
Sales Analysis
Samco Software Inc.
Sales Rep - Responsible
15.1
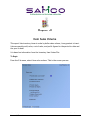
Chapter 16
User Defined
This function allows you to define your own sales analysis report. You select the order
the information is sorted by (for up to 5 levels), a range of information to include for
each sorting selection, plus various reporting criteria to include/exclude such as detail,
costs/profit etc.
Up to 5 levels of sorting can be made from a long list of choices.
One of the benefits of using this function is that it allows you to zoom in on specific
information. For example, if you wanted to see how sales were doing for a particular
category of items in a city, you could do so.
To Begin
Select User defined from the S/A main menu.
A screen similar to the following appears:
Sales Analysis
Samco Software Inc.
User Defined
16.1
Loading previously save reports
If you previously saved report selection criteria, press the [F5] key to enter the code for
the report you want to print. You can then enter a [?] to display a selection list of saved
reports to choose from.
Once a saved report is selected you can then enter 1 to review / change the settings, 2
to print the report, or 3 to delete the saved report settings.
Saving reports is discussed in further detail later on in this chapter.
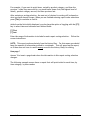
Entering Report Criteria
Enter the following information:
Sorting options
This report allows you to select up to 5 different fields of information stored in the A/R
Customer file, the Billing (O/E) and P/S Invoice History file, and the P/I Invoice History
file to use for sorting and printing on the report. Each level of sorting also allows you
to select a range of information to include in the report and whether to do a page break
Sales Analysis
Samco Software Inc.
User Defined
16.2
when the detail changes.
Report order selections
From the window displayed, select the field to sort on from most detail to least detail.
For example, if you want to print items, sorted by product category, and then the
province they were sold in, you would enter items first (the highest level of detail),
product category second, and then province last.
After entering a sorting selection, the next set of choices for sorting will be based on
what you have already chosen.
When you are finished entering report order selections press [Tab] to continue to field
6.
[?] First
[?] Last
Enter the range of information to include for each report sorting selection. Follow the
screen instructions.
NOTE: This report works exclusively from the history files. For this reason you should
keep the amount of information printed to a minimum. This will speed up the report,
Sales Analysis
Samco Software Inc.
User Defined
16.3
as it then does not have to read in every record in the history file(s) for sorting,
New page ?
Answer Y to insert a page break when the information in this report sorting selection
changes.
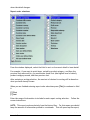
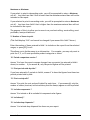
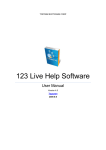
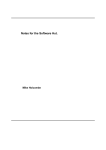
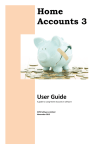
The following example screen shows a report that will print totals for each item
category, by city, by province:
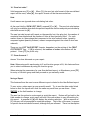
The resulting report will, first, page break for each province. The information from
there will be broken down to show the sales, cost of sales, and profit for each item
category by city. The report might look something like this:
Province: BC
City: Vancouver
TOOLS
INDEQ
HOBBY
Totals for city:
City: Victoria
TOOLS
INDEQ
HOBBY
Sales Analysis
Samco Software Inc.
User Defined
16.4
Totals for city:
Totals for province:
6. Reporting periods
Enter from 1 to 6 reporting periods. If you enter fewer than 6 reporting periods, press
[Enter] for the starting date to go on to the next question below. The reporting
periods can overlap.
After entering each reporting period you will be prompted to enter a description of up
to 5 characters which will be printed on the report.
If you are entering fewer than 4 periods, press [Enter] to continue to the next field.
7. Also sort detail by
Enter the order to further sort the entry in field 1. Valid answers include:
N
Q
S
C
P
O
No further sorting
Quantity
Sales
Costs
Profit
# of orders
Using the above screen example, by entering P for profit, the item categories for each
city will be sorted in order of profitability. Whether to print in ascending or
descending order of profitability is determined by the next field.
8. Descending or ascending ?
(This field is skipped if N is selected in the previous field.)
Your entry in this field works in conjunction with your entry in the previous field,
allowing you to print in either ascending or descending order.
Enter D to sort the entry in field 1 in descending order by your entry in the previous
field, or use press [Enter] for none.
For example, if you entered to sort by profit in the previous field, entering D will sort by
most profitable.
Enter A to sort the entry in field 1 in ascending order by your entry in the previous field
or press [Enter] for none.
For example, if you entered to sort by profit in the previous field, entering A will sort by
least profitable.
Sales Analysis
Samco Software Inc.
User Defined
16.5
Maximum or Minimum
If you select to print in descending order, you will be prompted to enter a Minimum
cut-off. Any item from field 1 that is lower than the minimum entered here will not be
included on the report.
If you selected to print in ascending order, you will be prompted to enter a Maximum
cut-off. Any item from field 1 that is higher than the maximum entered here will not
be included on the report.
The purpose of this is to allow you to zoom in on your best selling, worst selling, most
profitable, least profitable etc.
9. Number of items to print
(This field displays "N/A" and cannot be changed if you answer N in field 7 above.)
Enter the number of items entered in field 1 to include on the report from the selected
ranges, or press [F1] for all.
This allows you to further zoom in on information. For example, you may only want to
print the 2, 5, or 10 most profitable product categories or items.
10. Period comparison version ?
Answer Y to have the report compare changes from one period (as entered in field 6
above) to another. If you answer N, only the period figures will be printed.
11. Print periods side-by-side ?
If you have entered in 2 periods in field 6, answer Y to have the figures from these two
periods printed side by side.
12. Print costs/profit ?
Answer Y to print the cost and profit detail for each item. If you answer N, only the
number of orders (invoices) in invoice history that the item(s) appear on will be printed.
13. Include components ?
Answer Y to include or N to exclude kit component sales figures.
14. Include adj ?
15. Include drop shipments ?
Answer Y to include drop shipment line items on your report.
Sales Analysis
Samco Software Inc.
User Defined
16.6
16. Show lost sales ?
Valid responses are [Y] or [N]. When [Y], the new lost sale format of the user defined
report will be used, when [N], the report format will be the same as before.
Note
Credit memos are ignored when calculating lost sales.
At the new field for SHOW LOST SALES, respond [Y] or [N]. The new lost-sale feature
will only be available when both the period comparison version and print periods side by
side fields are set to [N].
The new lost-sale layouts will report on the quantity lost, the sales lost, the number of
complete lines shipped and the number of lines at least partially filled. For each
amount there is a percentage that compares to the total ordered value, (quantity
compared against quantity ordered, amount compared against the value of what was
ordered)
There are two LOST SALE REPORT formats, dependant on the setting of the PRINT
COSTS/PROFIT flag. If [N] is selected, the number of orders information will be
printed. Press [F1] for profit only.
17. Show discounts ?
Answer Y to show discounts on your report.
Note: When using multi-warehousing in IC and location groups in PA, this feature allows
you to select warehouses by using the location group.
When entering the parameters for your User defined report, at Warehouse, press [F2]
for entry of location group and then proceed as you normally would.
Saving a Report
This feature allows the user to save different report criteria for the User Defined report.
To use, enter a sales report as you normally would. Try to use the date codes listed
below so that the layouts will work the same way each time you use them. Press
[ENTER] at the field number to change.
The user has the option to review again or print the report. Review will go back to the
field number to change, print report will ask if the user wishes to save the setting for
this report. A response of [N] will display the window selection. With a response of
[Y] the user will be prompted to name the settings. This is like a file name, no spaces
or special characters should be used, although they are allowed. There is a description
Sales Analysis
Samco Software Inc.
User Defined
16.7
field for more complete classification. The printer selection window will be displayed
and the report will be printed.
For subsequent printings, use [F5] to display the saved settings window. Either enter
in the saved setting name or [?] for the saved report window. When the window is
displayed use the standard [F1], [F2] to move forward and back, [F3] to search and [F4]
to copy from the window to the screen. Once copied the setting is available to be
reviewed and changed, printed or deleted. If the setting is changed, then it can be
saved under the same name or a different name.
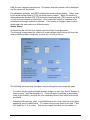
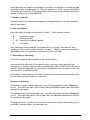
Sample Report
In this section we will look at a sample report and how it was generated.
The following screen shows the criteria for a user defined report which will show the
most profitable product categories, in each city, in each province:
The following are some ways this report may be changed to meet a specific need:
• To look at only the most profitable product category in each city, field 9 "Number of
items to print" could be changed to 1. Since the report is printing in descending
order of profitability, and only the first would be printed, that would be the most
profitable.
• Sometimes the quantity, sales, or profitability are not a true reflection of an item's
popularity due to windfall sales. To counter this you may want to set field 7 "Also
sort detail by" to # of orders. This way the report will show you the number of
Sales Analysis
Samco Software Inc.
User Defined
16.8
invoices this item appeared on.
• An alternative to the above is to select "N" to "Print costs profit". Instead of printing
the costing and selling price information, the number of orders (invoices) will be
printed instead.
• If you have a large amount of invoice history, you may want to make your reporting
more concise. To further narrow the range of information, you could reduce the
product categories or provinces to include a specific range.
____________________
Sales Analysis
Samco Software Inc.
User Defined
16.9
Chapter 17
Services for a Customer
This report shows quantity sold, sales, percent of sales, cost of sales, profit, and margin
percent for a selected range of customers and the services sold to these customers,
within up to four selected reporting periods.
Percentages are based on sales and profits within selected reporting ranges.
You can print this report in order by sales volume based on sales in the first selected
reporting period.
The amounts shown for services are obtained from the P/I Invoice History File.
To Begin
From the S/A menu, select Services for a customer. This is the screen you see:
Sales Analysis
Samco Software Inc.
Services for a Customer
17.1
Enter the following information:
[?] 1. Starting customer
[?] 2. Ending customer
Enter the range of customers to print on the report. Follow the screen instructions.
[?] 3. Starting service
[?] 4. Ending service
Enter the range of services to show for each selected customer. Follow the screen
instructions.
5. Reporting periods
Enter from 1 to 4 reporting periods. If you enter fewer than 4 reporting periods, press
[Enter] for the starting date to go on to the next question below. The reporting
periods can overlap.
If you select more than 1 reporting period, you will not be asked for an entry in field 9
below.
6. Dollar rounding ?
Type Y to have all dollar amounts shown on the report rounded to the nearest dollar.
You must use dollar rounding if your grand totals are more than 9,999,999,999.99.
Sales Analysis
Samco Software Inc.
Services for a Customer
17.2
7. In order by sales volume ?
If you answer N to this question, you are not asked to make an entry in field 8 or 9. If
you answer Y, services are printed in descending order of sales volume for each
customer.
The sales volume used is that from the first reporting period only.
8. Minimum sales volume level
Enter a minimum sales volume level or press [F1] for none (show all services). If you
enter a sales volume level, only services with a sales volume equal to or greater than
this level will be shown on the report.
9. Number of services to print
Enter the number of services you wish to print for each customer or press [F1] for all
services.
10. Brief format ?
Answer Y or N. You will not be asked this question if you entered more than one
reporting period in question 5 above.
____________________
Sales Analysis
Samco Software Inc.
Services for a Customer
17.3
Chapter 18
Customers for a Service
This report shows quantity sold, sales amount, percent of sales, cost of sales, profit,
percent of profit, and margin percent for a selected range of services and the customers
those services were sold to, within up to four selected reporting periods.
Percentages are based on sales and profits within the selected reporting period.
You can print this report in order by sales volume, based on sales in the first selected
reporting period.
The amounts shown for services are obtained from the P/I Invoice History File.
To Begin
From the S/A menu, select Customers for a service. This is the screen you see:
Sales Analysis
Samco Software Inc.
Customers for a Service
18.1
Enter the following information:
[?] 1. Starting service
[?] 2. Ending service
Enter the range of services to print on the report. Follow the screen instructions.
[?] 3. Starting customer
[?] 4. Ending customer
Enter the range of customers to print for each service. Follow the screen instructions.
5. Reporting periods
Enter from 1 to 4 reporting periods.
If you enter fewer than 4 reporting periods, press [Enter] for the starting date to go on
to the next question below. The reporting periods can overlap. If you select more
than 1 reporting period, you are not asked question 9.
6. In order by sales volume ?
If you answer N to this question, you will not be asked for an entry in field 7 or 8. If you
answer Y, customers are printed in descending order by sales volume for each service.
The sales volume used is that from the first reporting period only.
7. Minimum sales volume level
Sales Analysis
Samco Software Inc.
Customers for a Service
18.2
Enter a minimum sales volume level or press [F1] for none (print all services). If you
enter a non-zero sales volume level, only services with a sales volume equal to or
exceeding this level are printed.
8. Number of services to print
Enter the number of services you wish to print or press [F1] print all services. Only this
number of services will print for each selected customer.
9. Brief format ?
Answer Y or N. You will not be asked this question if you entered more than one
reporting period in field 5 above.
____________________
Sales Analysis
Samco Software Inc.
Customers for a Service
18.3
Chapter 19
Customer Product
This report provides a purchasing analysis for each customer (on a separate page) by
product category. The analysis shows sales for the quarter, the year, last year’s quarter
and last year along with changes and percentages.
To Begin
From the S/A menu, select Customer product. The following screen appears:
Sales Analysis
Samco Software Inc.
Customer Product
19.1
Enter the report criteria as follows:
[?] 1. Start customer
[?]2. End customer
Enter a range of customers to include on the report.
3.
4.
5.
6.
This quarter
Last quarter
This year
Last year
At each date field, enter a range of transaction dates to use for inclusion on the report.
__________________
Sales Analysis
Samco Software Inc.
Customer Product
19.2
Chapter 20
Monthly Activity Analysis
This report is designed to provide the user a summary of units sold over a 13 month
period in either stocking or one of 2 alternate units of measure. Flexible selection
criteria, allows the user to zoom in or out on the information they require.
To Begin
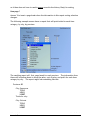
Select Monthly activity analysis from the S/A main menu. From the screen displayed
Loading previously save reports
If you previously saved report selection criteria, press the [F5] key to enter the code for
the report you want to print. You can then enter a [?] to display a selection list of saved
reports to choose from.
Once a saved report is selected you can then enter [F1] to review / change the settings,
2 to print the report, or 3 to delete the saved report settings.
Sorting options
This report allows you to select up to 5 different fields of information stored in the A/R
Customer file, the Billing (O/E) and P/S Invoice History file, and the P/I Invoice History
file to use for sorting and printing on the report. Each level of sorting also allows you
to select a range of information to include in the report and whether to do a page break
when the detail changes.
Report order selections
From the window displayed, select the field to sort on from most detail to least detail.
Sales Analysis
Samco Software Inc.
Monthly Activity Analysis
20.1
For example, if you want to print items, sorted by product category, and then the
province / state they were sold in, you would enter items first (the highest level of
detail), product category second, and then province last.
After entering a sorting selection, the next set of choices for sorting will be based on
what you have already chosen. When you are finished entering report order selections
press [Tab] to continue to field 6.
Aside from the list initially displayed, you also have the option of toggling with the [F2]
key to select item and customer user defined fields.
[?] First
[?] Last
Enter the range of information to include for each report sorting selection. Follow the
screen instructions.
NOTE: This report works exclusively from the history files. For this reason you should
keep the amount of information printed to a minimum. This will speed up the report,
as it then does not have to read in every record in the history file(s) for sorting,
New page ?
Answer Y to insert a page break when the information in this report sorting selection
changes.
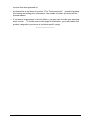
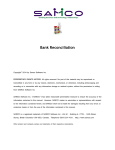
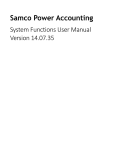
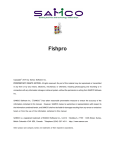
The following example screen shows a report that will print totals for each item, by
item category, by item vendor:
Sales Analysis
Samco Software Inc.
Monthly Activity Analysis
20.2
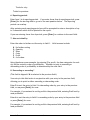
The resulting report will, first, page break for each vendor. The information from
there will be broken down to show the unit sales over the past 13 months, for each item
category for each vendor. The report might look something like this:
Vendor: ABC100 ABC Manufacturing
Category: HPT Hand Power Tools
123456
Precision multi-purpose drill tool
893331
Portable industrial drill
900821
Router
Totals for category:
Category: SPT Stationary Power Tools
123456
Table saw
893331
Lathe
900821
Drill press
Totals for category:
Totals for vendor:
6. Cut off date
Sales Analysis
Samco Software Inc.
Monthly Activity Analysis
20.3
Enter the sales cut off date for information to include. For example, to include the past
13 months of data from December 31, 2001 you would enter 123101 as your cut off date.
The system will include all of December sales in the current month and then show the 12
months of sales prior to December 2001.
7. Number of Months
This will control how many columns appear in the report and how far back the initial
value is calculated.
8. Also sort detail by
Enter the order to further sort the entry in field 1. Valid answers include:
N
C
1 - 12
O
No further sorting
Current quantity
Quantity for a specific period
# of orders
Using the above screen example, by entering O for # of orders, the items for each
category will be sorted in order of number of orders. Whether to print in ascending or
descending order of profitability is determined by the next field.
9. Descending or ascending ?
(This field is skipped if N is selected in the previous field.)
Your entry in this field works in conjunction with your entry in the previous field,
allowing you to print in either ascending or descending order. Enter D to sort the entry
in field 1 in descending order by your entry in the previous field, or enter A to sort the
entry in field 1 in ascending order.
For example, if you entered to sort by # of orders in the previous field, entering A will
sort the items by least number of orders first.
Maximum or Minimum
If you select to print in descending order, you will be prompted to enter a Minimum
cut-off. Any item from field 1 that is lower than the minimum entered here will not be
included on the report.
If you selected to print in ascending order, you will be prompted to enter a Maximum
cut-off. Any item from field 1 that is higher than the maximum entered here will not
be included on the report.
The purpose of this is to allow you to zoom in on your best selling, worst selling, most
profitable, least profitable, one shot items etc..
Sales Analysis
Samco Software Inc.
Monthly Activity Analysis
20.4
10. Number of items to print
(This field displays "N/A" and cannot be changed if you answer N in field 7 above.)
Enter the number of items entered in field 1 to include on the report from the selected
ranges, or [F1] to print "All".
This allows you to further zoom in on information. For example, you may only want to
print the 2, 5, or 10 best selling product categories or items.
11. Lines of description ?
Enter the number of lines of description you wish to print.
Suppress blank?
If you select to print 2 or 3 lines of description you have the option here of not printing
blank description lines.
12. Include item summary lines?
Answer Y if after each detail line (field 1 above) you want the following summary
information printed:
Sales for the current YTD
Sales for the previous YTD
Quantity on-hand
Quantity committed
Quantity on backorder
Quantity on-order
Minimum and maximum stocking levels
Average sale quantity
Unit average cost
13. Preferred unit
Enter 0 if you want the report printed in stocking units, 1 to report in alternate selling
unit 1, or 2 to report in alternate selling unit 2.
Items that do not have an alternate selling unit will be reported in the stocking unit.
14. Include adjustments ?
Answer Y to include adjustment entries.
15. Dollars or Units ?
Specify to print this report by either dollars or units. In addition, the dollars and units
can be rounded to the nearest thousand or the high thousand.
Sales Analysis
Samco Software Inc.
Monthly Activity Analysis
20.5
16. Print grand totals ?
Note that the “grand totals” printed on a Sales Analysis Report often reflect the total
quantity and / or value of all sales. “Grand totals” are often misinterpreted as “column
totals”.
17. Include drop shipments ?
Answer Y to include drop shipped invoice line items.
____________________
Sales Analysis
Samco Software Inc.
Monthly Activity Analysis
20.6
Chapter 21
Cat / Sub-Cat for a Customer
This report is available in a brief and detailed version, with the detailed version
including item detail. Each shows the quantity sold, and sales amount sorted by
customer.
If you are using Billing (O/E) or P/S, the amounts shown for items are obtained from the
Invoice History File (if you keep invoice history).
If you are using P/I, the amounts shown for items are obtained from the P/I Invoice
History File (if you keep invoice history).
If you are using a combination of Billing (O/E) or P/S, and P/I (with P/I interfaced with
Inventory), the amounts shown for items will include information obtained from both
history files.
If you are using a combination of Billing (O/E) or P/S, and P/I (with P/I not interfaced
with Inventory), you may choose to print either goods (from P/I) or inventory items
(from Inventory) on a particular print run.
To Begin
From the S/A menu, select Cat / sub-cat for a customer. From the screen displayed
enter the following:
[?] 1. Starting customer
[?] 2. Ending customer
Enter the range of customers to print on the report or follow the screen instructions.
[?] 3. Starting item
[?] 4. Ending item
Sales Analysis
Samco Software Inc.
Cat/Sub-Cat for a Customer
21.1
Enter the range of items to show for each selected customer or follow the screen
instructions.
[?] 5. Starting category
[?] 6. Ending category
Enter the range of item categories to show for each selected customer or follow the
screen instructions.
[?] 7. Starting sub-category
[?] 8. Ending sub-category
Enter the range of item sub-categories to show for each selected customer or follow the
screen instructions.
9. Reporting periods
Enter up to 2 reporting periods. If you enter fewer than 2 reporting periods, press
[Enter] for the starting date to go on to the next question below. The reporting
periods can overlap.
10. Dollar rounding ?
Type Y to have all dollar amounts shown on the report rounded to the nearest dollar.
You must use dollar rounding if your grand totals are more than 9,999,999,999.99.
11. Brief format ?
Answer Y if you do not want to include item detail.
___________________
Sales Analysis
Samco Software Inc.
Cat/Sub-Cat for a Customer
21.2
Chapter 22
Five Year Item History
To begin
Select the 5 Year Item History from the Sales Analysis menu.
You see:
Enter the following information
[?] item #
Sales Analysis
Samco Software Inc.
Five Year Item History
22.1
Enter the item # or use one of the options:
Options:
[F1]
to select the first item
[Enter]
to select by entering a description
[?] Whse
If using multi-warehousing enter the warehouse number or use one of the options:
Options:
[F1]
to select the first
[Enter]
to select all warehouses
The whole year from January to December is now on one line, each month is totalled
and the average is provided.
Press [F5] to display the 5 year totals.
Press [Tab] to exit.
_____________
Sales Analysis
Samco Software Inc.
Five Year Item History
22.2
Chapter 23
X. Export Printer Reports
Available Reports
User Defined Report
Printing reports to an export file
Due to popular demand, there are now a number of reports that you can print to the ‘X’
Export printer and we keep adding more.
In order to open reports printed to the ‘X’ printer, the user must have access to their
local directory. If you are a Thin Client® user, you must identify the directory in SYSTEM
FUNCTIONS COMPANY DATA. The default is C:\SSIDOCS\.
Each report printed to the ‘X’ printer is assigned a default file name. After you select
the ‘X’ printer, a pop-up window will prompt [F1] to accept the default filename
displayed or enter your own filename. Remember to assign a unique filename to each
report that you wish to keep as filenames can be reused and the data over-written.
Note: A report printed to disk cannot be later printed to the ‘X’ printer.
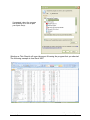
The first time that you select the ‘X’ Export “printer” from the pop-up Printer Selection
window, the system may prompt you to identify which program should be used to open
the file. The export files are designed to be opened with Excel. However, they can be
opened with any software that can access tab delimited files (e.g. Windows, Thin
Client®).
Please note that there may be a delay between the time the report has ‘finished
printing’ and the time the Excel worksheet opens. This delay is dependent upon your
system activity levels.
Sales Analysis
Samco Software Inc.
X Export Printer Reports
23.1
Enter the parameters for your
report as you normally do.
When the Printer selection popup
window is displayed, select the ‘X’
printer.
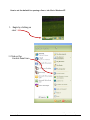
Follow the system prompts to
cancel the report request or
accept the default file name
OR
Type a new file name.
Sales Analysis
Samco Software Inc.
X Export Printer Reports
23.2
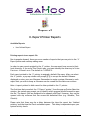
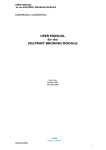
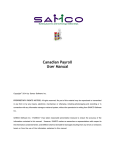
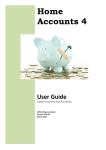
If prompted, select the program
that Windows is to use to open
your Xport file(s).
Windows or Thin Client® will open the export file using the program that you selected.
The following example is from Excel 2007.
Sales Analysis
Samco Software Inc.
X Export Printer Reports
23.3
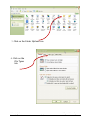
How to set the default for opening a SAMCO .tab file in Windows XP
1. Begin by clicking on
start
2. Click on the
Control Panel icon
Sales Analysis
Samco Software Inc.
X Export Printer Reports
23.4
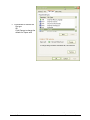
3. Click on the Folder Options icon
4. Click on the
File Types
tab
Sales Analysis
Samco Software Inc.
X Export Printer Reports
23.5
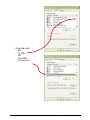
5. Drag the scroll
bar
To TAB
OR
Type TAB
to jump to it.
Sales Analysis
Samco Software Inc.
X Export Printer Reports
23.6
6. Click Delete to remove the
file type
OR
Click Change to change the
default for Opens with
Sales Analysis
Samco Software Inc.
X Export Printer Reports
23.7
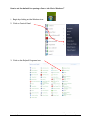
How to set the default for opening a SAMCO .tab file in Windows 7
1. Begin by clicking on the Windows icon
2. Click on Control Panel
3. Click on the Default Programs icon
Sales Analysis
Samco Software Inc.
X Export Printer Reports
23.8
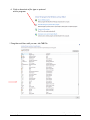
4. Click on Associate a file type or protocol
with a program
5. Drag the scroll bar until you see .tab TAB File
Sales Analysis
Samco Software Inc.
X Export Printer Reports
23.9
4.
Click on the .tab line and then choose the program you want to use to open .tab
files.
Sales Analysis
Samco Software Inc.
X Export Printer Reports
23.10