1
User's Manual
CubeSuite+ V2.02.00
Integrated Development Environment
User's Manual: RL78 Debug
Target Device
RL78 Family
All information contained in these materials, including products and product specifications,
represents information on the product at the time of publication and is subject to change by
Renesas Electronics Corp. without notice. Please review the latest information published by
Renesas Electronics Corp. through various means, including the Renesas Electronics Corp.
website (http://www.renesas.com).
www.renesas.com
Rev.1.00 Feb 2014
Notice
1.
Descriptions of circuits, software and other related information in this document are provided only to illustrate the operation of
semiconductor products and application examples. You are fully responsible for the incorporation of these circuits, software,
and information in the design of your equipment. Renesas Electronics assumes no responsibility for any losses incurred by you
or third parties arising from the use of these circuits, software, or information.
2.
Renesas Electronics has used reasonable care in preparing the information included in this document, but Renesas Electronics
does not warrant that such information is error free. Renesas Electronics assumes no liability whatsoever for any damages
incurred by you resulting from errors in or omissions from the information included herein.
3.
Renesas Electronics does not assume any liability for infringement of patents, copyrights, or other intellectual property rights of
third parties by or arising from the use of Renesas Electronics products or technical information described in this document. No
license, express, implied or otherwise, is granted hereby under any patents, copyrights or other intellectual property rights of
Renesas Electronics or others.
4.
You should not alter, modify, copy, or otherwise misappropriate any Renesas Electronics product, whether in whole or in part.
Renesas Electronics assumes no responsibility for any losses incurred by you or third parties arising from such alteration,
modification, copy or otherwise misappropriation of Renesas Electronics product.
5.
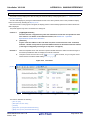
Renesas Electronics products are classified according to the following two quality grades: “Standard” and “High Quality”. The
recommended applications for each Renesas Electronics product depends on the product’s quality grade, as indicated below.
“Standard”:
Computers; office equipment; communications equipment; test and measurement equipment; audio and visual
equipment; home electronic appliances; machine tools; personal electronic equipment; and industrial robots etc.
“High Quality”: Transportation equipment (automobiles, trains, ships, etc.); traffic control systems; anti-disaster systems; anticrime systems; and safety equipment etc.
Renesas Electronics products are neither intended nor authorized for use in products or systems that may pose a direct threat to
human life or bodily injury (artificial life support devices or systems, surgical implantations etc.), or may cause serious property
damages (nuclear reactor control systems, military equipment etc.). You must check the quality grade of each Renesas
Electronics product before using it in a particular application. You may not use any Renesas Electronics product for any
application for which it is not intended. Renesas Electronics shall not be in any way liable for any damages or losses incurred
by you or third parties arising from the use of any Renesas Electronics product for which the product is not intended by Renesas
Electronics.
6.
You should use the Renesas Electronics products described in this document within the range specified by Renesas Electronics,
especially with respect to the maximum rating, operating supply voltage range, movement power voltage range, heat radiation
characteristics, installation and other product characteristics. Renesas Electronics shall have no liability for malfunctions or
damages arising out of the use of Renesas Electronics products beyond such specified ranges.
7.
Although Renesas Electronics endeavors to improve the quality and reliability of its products, semiconductor products have
specific characteristics such as the occurrence of failure at a certain rate and malfunctions under certain use conditions. Further,
Renesas Electronics products are not subject to radiation resistance design. Please be sure to implement safety measures to
guard them against the possibility of physical injury, and injury or damage caused by fire in the event of the failure of a Renesas
Electronics product, such as safety design for hardware and software including but not limited to redundancy, fire control and
malfunction prevention, appropriate treatment for aging degradation or any other appropriate measures. Because the evaluation
of microcomputer software alone is very difficult, please evaluate the safety of the final products or systems manufactured by
you.
8.
Please contact a Renesas Electronics sales office for details as to environmental matters such as the environmental compatibility
of each Renesas Electronics product. Please use Renesas Electronics products in compliance with all applicable laws and
regulations that regulate the inclusion or use of controlled substances, including without limitation, the EU RoHS Directive.
Renesas Electronics assumes no liability for damages or losses occurring as a result of your noncompliance with applicable laws
and regulations.
9.
Renesas Electronics products and technology may not be used for or incorporated into any products or systems whose
manufacture, use, or sale is prohibited under any applicable domestic or foreign laws or regulations. You should not use
Renesas Electronics products or technology described in this document for any purpose relating to military applications or use
by the military, including but not limited to the development of weapons of mass destruction. When exporting the Renesas
Electronics products or technology described in this document, you should comply with the applicable export control laws and
regulations and follow the procedures required by such laws and regulations.
10. It is the responsibility of the buyer or distributor of Renesas Electronics products, who distributes, disposes of, or otherwise
places the product with a third party, to notify such third party in advance of the contents and conditions set forth in this
document, Renesas Electronics assumes no responsibility for any losses incurred by you or third parties as a result of
unauthorized use of Renesas Electronics products.
11. This document may not be reproduced or duplicated in any form, in whole or in part, without prior written consent of Renesas
Electronics.
12. Please contact a Renesas Electronics sales office if you have any questions regarding the information contained in this document
or Renesas Electronics products, or if you have any other inquiries.
(Note 1) “Renesas Electronics” as used in this document means Renesas Electronics Corporation and also includes its majorityowned subsidiaries.
(Note 2) “Renesas Electronics product(s)” means any product developed or manufactured by or for Renesas Electronics.
(2012.4)
How to Use This Manual
This manual describes the role of the CubeSuite+ integrated development environment for developing applications and
systems for RL78 family, and provides an outline of its features.
CubeSuite+ is an integrated development environment (IDE) for RL78 family, integrating the necessary tools for the
development phase of software (e.g. design, implementation, and debugging) into a single platform.
By providing an integrated environment, it is possible to perform all development using just this product, without the
need to use many different tools separately.
Readers
This manual is intended for users who wish to understand the functions of the
CubeSuite+ and design software and hardware application systems.
Purpose
This manual is intended to give users an understanding of the functions of the
CubeSuite+ to use for reference in developing the hardware or software of systems
using these devices.
Organization
This manual can be broadly divided into the following units.
CHAPTER 1 GENERAL
CHAPTER 2 FUNCTIONS
APPENDIX A WINDOW REFERENCE
APPENDIX B USER OPEN INTERFACE
APPENDIX C INDEX
How to Read This Manual
It is assumed that the readers of this manual have general knowledge of electricity,
logic circuits, and microcontrollers.
Conventions
Data significance:
Higher digits on the left and lower digits on the right
Active low representation:
XXX (overscore over pin or signal name)
Note:
Footnote for item marked with Note in the text
Caution:
Information requiring particular attention
Remark:
Supplementary information
Numeric representation:
Decimal ... XXXX
Hexadecimal ... 0xXXXX
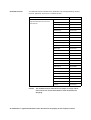
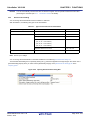
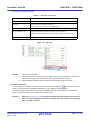
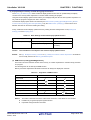
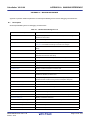
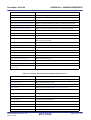
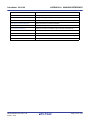
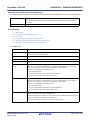
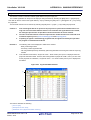
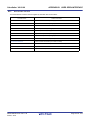
Related Documents
The related documents indicated in this publication may include preliminary versions.
However, preliminary versions are not marked as such.
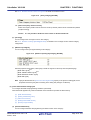
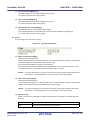
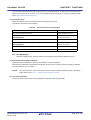
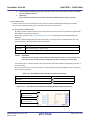
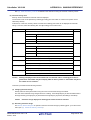
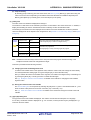
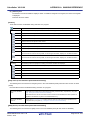
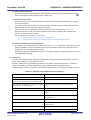
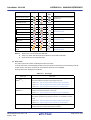
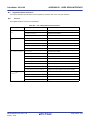
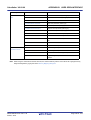
Document Name
CubeSuite+
Integrated Development Environment
Document No.
Start
R20UT2865E
RX Design
R20UT2862E
V850 Design
R20UT2134E
RL78 Design
R20UT2684E
78K0R Design
R20UT2137E
78K0 Design
R20UT2138E
RH850 Coding
R20UT2584E
RX Coding
R20UT2470E
V850 Coding
R20UT0553E
Coding for CX Compiler
R20UT2659E
RL78,78K0R Coding
R20UT2774E
78K0 Coding
R20UT2141E
RH850 Build
R20UT2585E
RX Build
R20UT2472E
V850 Build
R20UT0557E
Build for CX Compiler
R20UT2142E
RL78,78K0R Build
R20UT2623E
78K0 Build
R20UT0783E
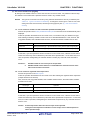
RH850 Debug
R20UT2866E
RX Debug
R20UT2875E
V850 Debug
R20UT2446E
RL78 Debug
This manual
78K0R Debug
R20UT0732E
78K0 Debug
R20UT0731E
Analysis
R20UT2868E
Message
R20UT2871E
User's Manual
Caution
The related documents listed above are subject to change without
notice. Be sure to use the latest edition of each document when
designing.
All trademarks or registered trademarks in this document are the property of their respective owners.
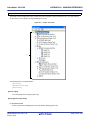
TABLE OF CONTENTS
CHAPTER 1 GENERAL ... 8
1.1 Summary ... 8
1.2 Features ... 8
CHAPTER 2 FUNCTIONS ... 9
2.1 Overview ... 9
2.2 Preparation before Debugging ... 12
2.2.1 Confirm the connection to a host machine ... 12
2.3 Configuration of Operating Environment of the Debug Tool ... 14
2.3.1 Select the debug tool to use ... 14
2.3.2 [IECUBE] ... 15
2.3.3 [E1] ... 27
2.3.4 [E20] ... 34
2.3.5 [EZ Emulator] ... 40
2.3.6 [Simulator] ... 46
2.4 Connect to/Disconnect from the Debug Tool ... 52
2.4.1 Connect to the debug tool ... 52
2.4.2 Disconnect from the debug tool ... 52
2.4.3 Connect to the debug tool using hot plug-in [E1][E20] ... 53
2.5 Download/Upload Programs ... 55
2.5.1 Execute downloading ... 55
2.5.2 Advanced downloading ... 58
2.5.3 Execute uploading ... 62
2.6 Display/Change Programs ... 64
2.6.1 Display source files ... 64
2.6.2 Display the result of disassembling ... 72
2.6.3 Run a build in parallel with other operations ... 75
2.6.4 Perform line assembly ... 76
2.7 Execute Programs ... 78
2.7.1 Reset microcontroller (CPU) ... 78
2.7.2 Execute programs ... 78
2.7.3 Execute programs in steps ... 80
2.8 Stop Programs (Break) ... 83
2.8.1 Configure the break function ... 84
2.8.2 Stop the program manually ... 86
2.8.3 Stop the program at the arbitrary position (breakpoint) ... 86
2.8.4 Stop the program at the arbitrary position (break event) ... 88
2.8.5 Stop the program with the access to variables/SFRs ... 90
2.8.6 Stop the program when an invalid execution is detected [IECUBE] ... 95
2.8.7 Other break causes ... 96
2.9 Display/Change the Memory, Register and Variable ... 97
2.9.1 Display/change the memory ... 97
2.9.2 Display/change the CPU register ... 107
2.9.3 Display/change the SFR ... 109
2.9.4 Display/change global variables/static variables ... 112
2.9.5 Display/change local variables ... 112
2.9.6 Display/change watch-expressions ... 114
2.10 Display Information on Function Call from Stack ... 121
2.10.1 Display call stack information ... 121
2.11 Collect Execution History of Programs ... 123
2.11.1 Configure the trace operation ... 123
2.11.2 Collect execution history until stop of the execution ... 126
2.11.3 Collect execution history in the arbitrary section ... 126
2.11.4 Collect execution history only when the condition is met [IECUBE][Simulator] ... 130
2.11.5 Stop/restart collection of execution history [IECUBE][Simulator] ... 133
2.11.6 Display the collected execution history ... 133
2.11.7 Clear the trace memory ... 135
2.11.8 Search the trace data ... 135
2.11.9 Save the contents of execution history ... 140
2.12 Measure Execution Time of Programs ... 142
2.12.1 Measure execution time until stop of the execution ... 142
2.12.2 Measure execution time in the arbitrary section [IECUBE][Simulator] ... 142
2.12.3 Measurable time ranges ... 145
2.13 Measure Coverage [IECUBE][Simulator] ... 146
2.13.1 Configure the coverage measurement ... 146
2.13.2 Display the coverage measurement result ... 147
2.14 Set an Action into Programs ... 149
2.14.1 Inset printf ... 149
2.15 Manage Events ... 151
2.15.1 Change the state of set events (valid/invalid) ... 151
2.15.2 Display only particular event types ... 152
2.15.3 Jump to the event address ... 152
2.15.4 Edit detailed settings of events ... 153
2.15.5 Delete events ... 159
2.15.6 Write comment to events ... 159
2.15.7 Notes for setting events ... 159
2.16 Use Smart Analog Function [E1][E20] ... 163
2.17 Use Hook Function ... 165
2.18 Use the Simulator GUI [Simulator] ... 167
2.18.1 Check the I/O waveform of the microcontroller ... 168
2.18.2 Input signals to the pins ... 168
2.18.3 Perform serial communication ... 169
2.18.4 Use buttons, LEDs, level gauges, and other components ... 169
2.19 About Input Value ... 170
2.19.1 Input rule ... 170
2.19.2 Symbol name completion function ... 171
2.19.3 Icons for invalid input ... 172
APPENDIX A WINDOW REFERENCE ... 173
A.1 Description ... 173
APPENDIX B USER OPEN INTERFACE ... 477
B.1 Overview ... 477
B.1.1 Types of interface functions ... 478
B.1.2 Interface methods ... 478
B.1.3 Development environment ... 479
B.2 Creating User Model ... 480
B.2.1 Program configuration ... 480
B.2.2 Outline of programming ... 481
B.2.3 Example of program file (UserModel.c) ... 483
B.2.4 Compilation and linking ... 484
B.3 Embedding User Model ... 485
B.3.1 Description in simulator configuration file ... 485
B.3.2 Example of simulator configuration file ... 487
B.4 Supplied Interface Functions ... 489
B.4.1 Overview ... 489
B.4.2 Basic interface functions ... 491
B.4.3 Time interface functions ... 495
B.4.4 Pin interface functions ... 502
B.4.5 External bus interface functions ... 511
B.4.6 Serial interface functions ... 518
B.4.7 Signal output unit interface functions ... 537
B.4.8 Error numbers ... 543
B.5 User-Defined Functions ... 544
B.6 Sample Program (Timer Model) ... 558
B.6.1 Overview ... 558
B.6.2 Configuration ... 558
B.6.3 Operation ... 558
B.6.4 Project file ... 558
B.6.5 Details of program ... 559
APPENDIX C INDEX ... 563
CubeSuite+ V2.02.00
CHAPTER 1 GENERAL
CHAPTER 1 GENERAL
CubeSuite+ is a platform of an integrated developing environment for RH850 family, RX family, V850 family, RL78 family, 78K0R microcontrollers, 78K0 microcontrollers.
CubeSuite+ can run all the operations needed for developing the programs such as designing, cording, building,
debugging, and flash programming.
In this manual, the debugging is explained out of those operations needed for the program development.
In this chapter, an overview of debugging products that CubeSuite+ provides is explained.
1.1
Summary
You can effectively debug/simulate the program developed for the RL78 family, using the debugger which CubeSuite+
provides.
1.2
Features
The following are the features of the debugger provided by CubeSuite+.
- Connecting to the various debug tools
A pleasant debugging environment for target systems is provided by connecting to the full-spec emulator
(IECUBE), the on-chip debugging emulator (E1/E20/EZ Emulator) and Simulator.
- C source text and disassembled text are shown mixed
The C source text and the disassembled text are shown mixed on the same panel.
- Source level debugging and instruction level debugging
The source level debugging and the instruction level debugging for a C source program can be done.
- Support of flash self programming emulation (Code flash)
Flash self programming emulation can be performed with IECUBE.
- Data flash memory writing function
When the selected microcontroller incorporates the data flash memory, the contents of data flash memory can be
displayed and modified by the same access method as an ordinary memory operation (except for Simulator).
- Real-time display update function
The contents of memory, registers and variables are automatically updated not only when the program execution
is stopped, but also in execution.
- Save/restore the debugging environment
The debugging environment such as breakpoints, event configuration information, file download information, display condition/position of the panel, etc. can be saved.
R20UT2867EJ0100 Rev.1.00
Feb 01, 2014
Page 8 of 572
CubeSuite+ V2.02.00
CHAPTER 2 FUNCTIONS
CHAPTER 2 FUNCTIONS
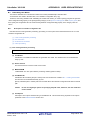
This chapter describes a debugging process of CubeSuite+ and main functions for debugging.
2.1
Overview
The basic debugging sequence for programs using CubeSuite+ is as follows:
(1) Start CubeSuite+
Launch CubeSuite+ from the [Start] menu of Windows.
Remark
For details on "Start CubeSuite+", see "CubeSuite+ Integrated Development Environment User's
Manual: Start".
(2) Set a project
Create a new project, or load an existing one.
Remark
For details on "Set a project", see "CubeSuite+ Integrated Development Environment User's Manual:
Start".
(3) Create a load module
Create a load module by running a build after setting of the active project and the build tool to be used.
Remark
For details on "Create a load module" with CA78K0R, see "CubeSuite+ Integrated Development
Environment User's Manual: Build".
(4) Confirm the connection to a host machine
Connect the debug tool (IECUBE, E1, E20, EZ Emulator or Simulator) to be used to a host machine.
(5) Select the debug tool to use
Select the debug tool to be used in a project.
(6) Configure operating environment of the debug tool
Configure the operating environment of the debug tool selected in steps (5).
- [IECUBE]
- [E1]
- [E20]
- [EZ Emulator]
- [Simulator]
(7) Connect to the debug tool
Connect the debug tool to CubeSuite+ to start communication.
(8) Execute downloading
Download the load module created in steps (3) to the debug tool.
(9) Display source files
Display the contents of the downloaded load module (source files) on the Editor panel or Disassemble panel.
R20UT2867EJ0100 Rev.1.00
Feb 01, 2014
Page 9 of 572
CubeSuite+ V2.02.00
CHAPTER 2 FUNCTIONS
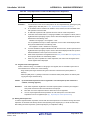
(10) Execute programs
Execute the program by using the operation method corresponding to a purpose.
If you wish to stop the program at the arbitrary position, set a breakpoint/break eventNote before executing the
program (see "2.8.3 Stop the program at the arbitrary position (breakpoint)", "2.8.4 Stop the program at the
arbitrary position (break event)", or "2.8.5 Stop the program with the access to variables/SFRs").
Note These functions are implemented by setting events to the debug tool used.
See "2.15.7 Notes for setting events", when you use events.
(11) Stop the program manually
Stop the program currently being executed.
Note that if a breakpoint or a break event has been set in steps (10), the program execution will be stopped
automatically when the set break condition is met.
(12) Check the result of the program execution
Check the following information that the debug tool acquired by the program execution.
- Display/Change the Memory, Register and Variable
- Display Information on Function Call from Stack
- Collect Execution History of ProgramsNote
- Measure Execution Time of ProgramsNote
- Measure Coverage [IECUBE][Simulator]
Note These functions are implemented by setting events to the debug tool used.
See "2.15.7 Notes for setting events", when you use events.
Debug the program, repeating steps (9) to (12) as required.
Note that if the program is modified during debugging, steps (3) and (8) also should be repeated.
Remarks 1.
Other than the above, you can also check the result of the program execution by using the
following functions.
- Set an Action into Programs
- Use Hook Function
- Use the Simulator GUI [Simulator]
2.
The acquired information can be saved to a file.
- Save the disassembled text contents
- Save the memory contents
- Save the CPU register contents
- Save the SFR contents
- Save the contents of local variables
- Save the contents of watch-expressions
- Save the contents of call stack information
- Save the contents of execution history
(13) Execute uploading
Save the program (the memory contents) to a file in the arbitrary format (e.g. Intel hex format, binary format, and
etc.), as required.
(14) Disconnect from the debug tool
Disconnect the debug tool from CubeSuite+ to terminate communication.
R20UT2867EJ0100 Rev.1.00
Feb 01, 2014
Page 10 of 572
CubeSuite+ V2.02.00
CHAPTER 2 FUNCTIONS
(15) Save the project file
Save the setting information of the project to the project file.
Remark
For details on "Save the project file", see "CubeSuite+ Integrated Development Environment User's
Manual: Start".
R20UT2867EJ0100 Rev.1.00
Feb 01, 2014
Page 11 of 572
CubeSuite+ V2.02.00
2.2
CHAPTER 2 FUNCTIONS
Preparation before Debugging
This section describes the preparation to start debugging the created program.
2.2.1
Confirm the connection to a host machine
Connection examples for each debug tool are shown.
(1) [IECUBE]
(2) [E1]
(3) [E20]
(4) [EZ Emulator]
(5) [Simulator]
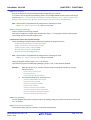
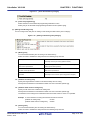
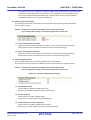
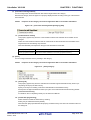
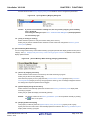
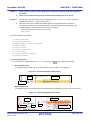
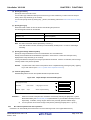
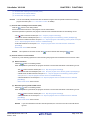
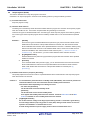
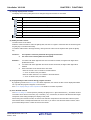
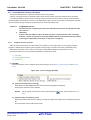
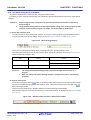
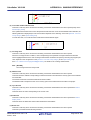
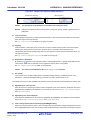
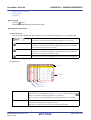
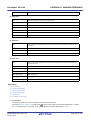
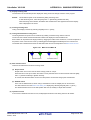
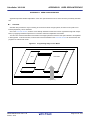
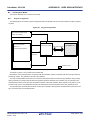
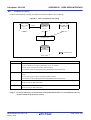
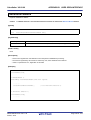
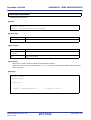
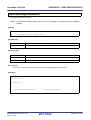
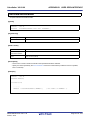
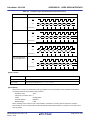
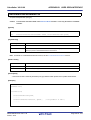
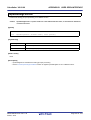
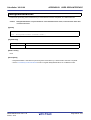
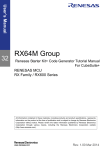
(1) [IECUBE]
Connect a host machine and IECUBE. If required, connect a target board, too.
See IECUBE User's Manual for details on the connection method.
Figure 2-1. Connection Example [IECUBE]
Dedicated adapter
USB interface cable
Host machine
CubeSuite+
Dedicated probe
IECUBE
Target board
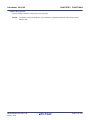
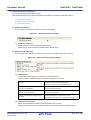
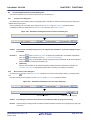
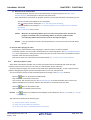
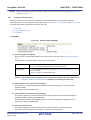
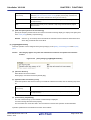
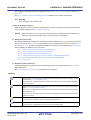
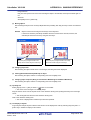
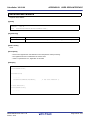
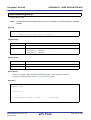
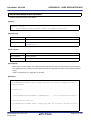
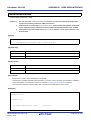
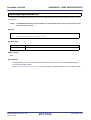
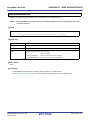
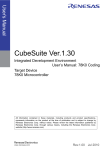
(2) [E1]
Connect a host machine and E1. If required, connect a target board, too.
See E1 User's Manual for details on the connection method.
Figure 2-2. Connection Example [E1]
USB interface cable
Dedicated probe
Host machine
E1
CubeSuite+
Target board
Caution
Only serial communications are supported as the communication method with the target board
(JTAG communications is not available).
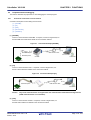
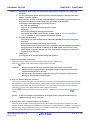
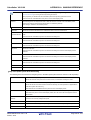
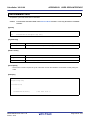
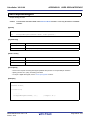
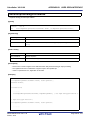
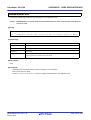
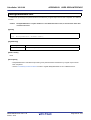
(3) [E20]
Connect a host machine and E20. If required, connect a target board, too.
See E20 User's Manual for details on the connection method.
R20UT2867EJ0100 Rev.1.00
Feb 01, 2014
Page 12 of 572
CubeSuite+ V2.02.00
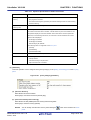
CHAPTER 2 FUNCTIONS
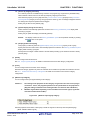
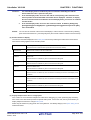
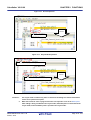
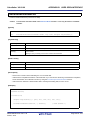
Figure 2-3. Connection Example [E20]
USB interface cable
Dedicated probe
Host machine
E20
CubeSuite+
Target board
Caution
Only serial communications are supported as the communication method with the target board
(JTAG communications is not available).
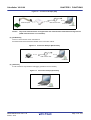
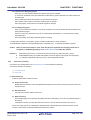
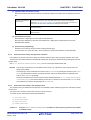
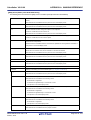
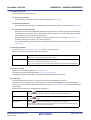
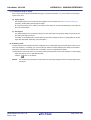
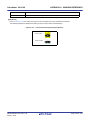
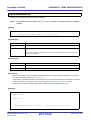
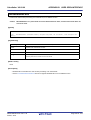
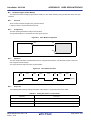
(4) [EZ Emulator]
Connect a host machine and an evaluation kit
See EZ Emulator User's Manual for details on the connection method.
Figure 2-4. Connection Example [EZ Emulator]
USB interface cable
Host machine
Evaluation kit
CubeSuite+
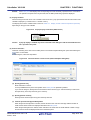
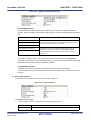
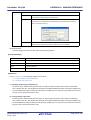
(5) [Simulator]
A host machine is only needed for debugging (emulators are not needed).
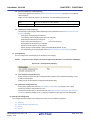
Figure 2-5. Connection Example [Simulator]
Host machine
CubeSuite+
R20UT2867EJ0100 Rev.1.00
Feb 01, 2014
Page 13 of 572
CubeSuite+ V2.02.00
2.3
CHAPTER 2 FUNCTIONS
Configuration of Operating Environment of the Debug Tool
This section describes the configuration of the operating environment for each debug tool.
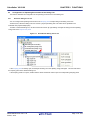
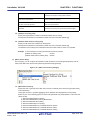
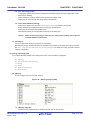
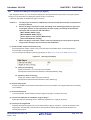
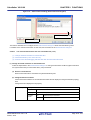
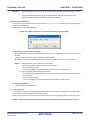
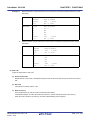
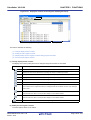
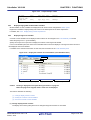
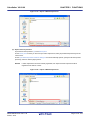
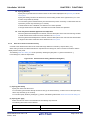
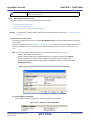
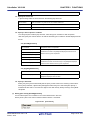
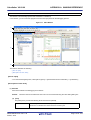
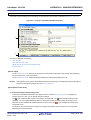
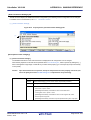
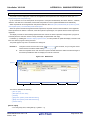
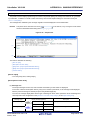
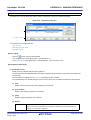
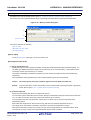
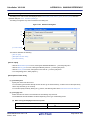
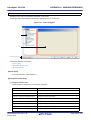
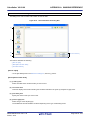
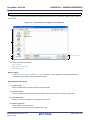
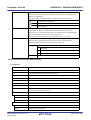
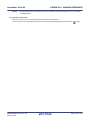
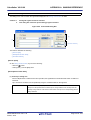
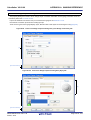
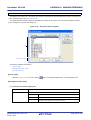
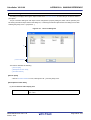
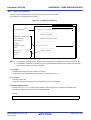
2.3.1
Select the debug tool to use
You can configure the operating environment in the Property panel corresponding to the debug tool to use.
Therefore, first, select the debug tool to be used in a project (the debug tool to be used can be specified in the
individual main projects/subprojects).
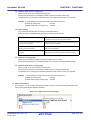
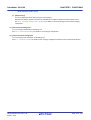
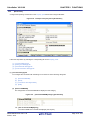
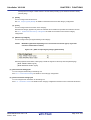
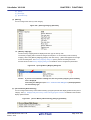
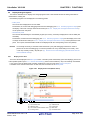
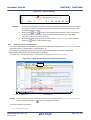
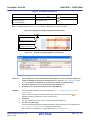
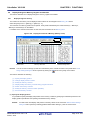
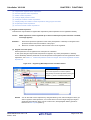
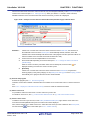
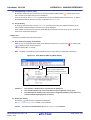
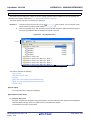
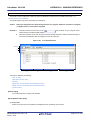
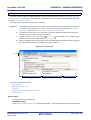
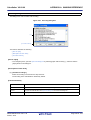
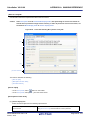
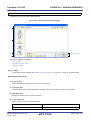
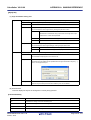
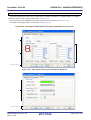
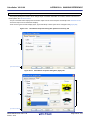
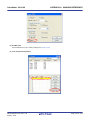
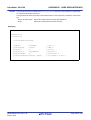
To select or switch the debug tool, use the context menu shown by right clicking on the [RL78 Debug tool name (Debug
Tool)] node on the Project Tree panel.
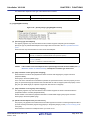
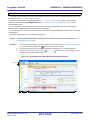
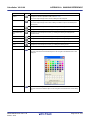
Figure 2-6. Select/Switch Debug Tool to Use
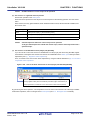
If the Property panel is already open, click the [RL78 Debug tool name (Debug Tool)] node again. The view switches to
the Property panel of the selected debug tool.
If the Property panel is not open, double-click the above mentioned node to open the corresponding Property panel.
R20UT2867EJ0100 Rev.1.00
Feb 01, 2014
Page 14 of 572
CubeSuite+ V2.02.00
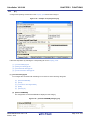
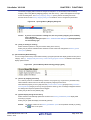
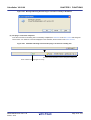
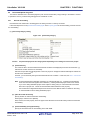
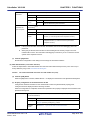
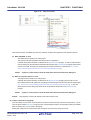
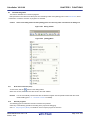
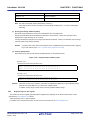
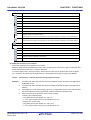
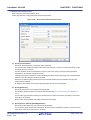
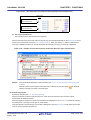
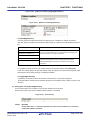
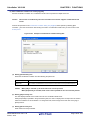
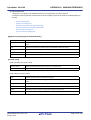
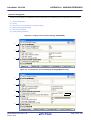
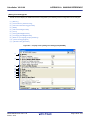
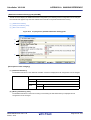
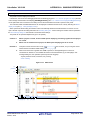
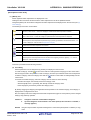
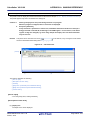
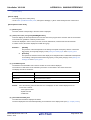
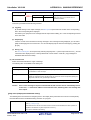
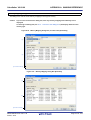
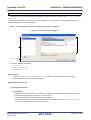
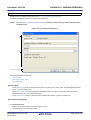
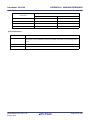
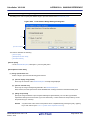
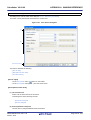
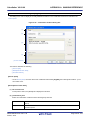
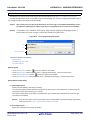
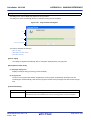
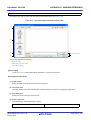
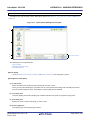
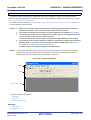
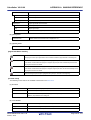
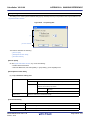
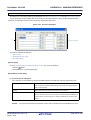
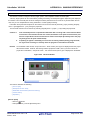
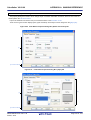
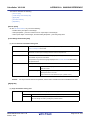
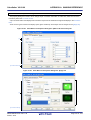
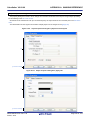
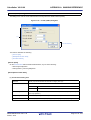
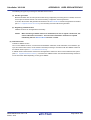
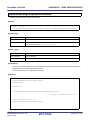
2.3.2
CHAPTER 2 FUNCTIONS
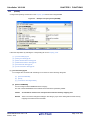
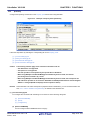
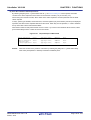
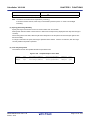
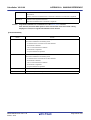
[IECUBE]
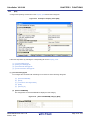
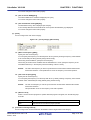
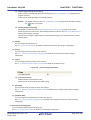
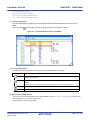
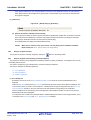
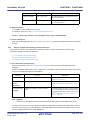
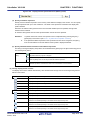
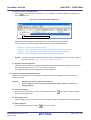
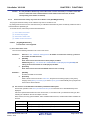
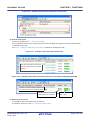
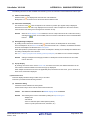
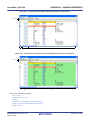
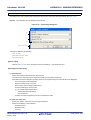
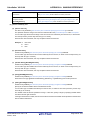
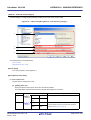
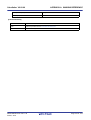
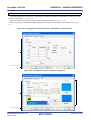
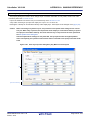
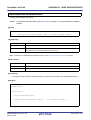
Configure the operating environment on the Property panel below when using IECUBE.
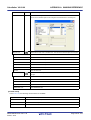
Figure 2-7. Example of Property Panel [IECUBE]
Follow the steps below by selecting the corresponding tab on the Property panel.
(1) [Connect Settings] tab
(2) [Debug Tool Settings] tab
(3) [Flash Self Emulation Settings] tab
(4) [DataFlash Emulation Settings] tab
(5) [Download File Settings] tab
(6) [Hook Transaction Settings] tab
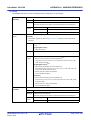
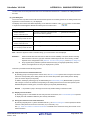
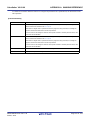
(1) [Connect Settings] tab
You configure the connection with the debug tool for each one of the following categories.
(a) [Internal ROM/RAM]
(b) [Clock]
(c) [Connection with Target Board]
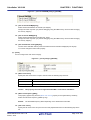
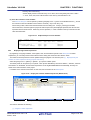
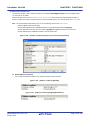
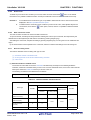
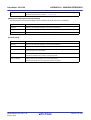
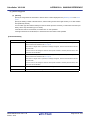
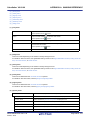
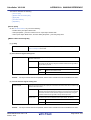
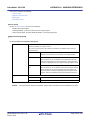
(a) [Internal ROM/RAM]
You can configure internal ROM/RAM in this category.
The size of internal ROM/RAM of the selected microcontroller is specified by default.
Caution
You should be careful not to overlap the area with other memory mapping area.
Remark
There is no need to change the settings in this category if you wish to debug with the same memory
mapping of the selected microcontroller.
R20UT2867EJ0100 Rev.1.00
Feb 01, 2014
Page 15 of 572
CubeSuite+ V2.02.00
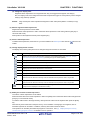
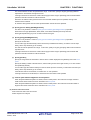
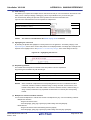
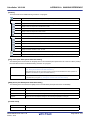
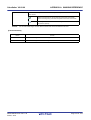
CHAPTER 2 FUNCTIONS
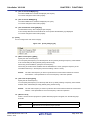
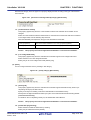
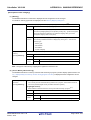
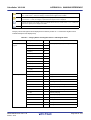
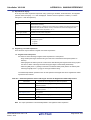
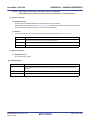
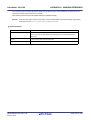
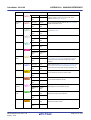
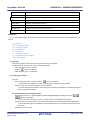
Figure 2-8. [Internal ROM/RAM] Category [IECUBE]
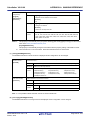
<1> [Size of internal ROM[KBytes]]
Select the internal ROM size to emulate (unit: Kbytes).
Change the value only when you perform debugging using IECUBE memory resources after changing
the memory mapping.
<2> [Size of internal RAM[Bytes]]
Select the internal RAM size to emulate (unit: bytes).
Change the value only when you perform debugging using IECUBE memory resources after changing
the memory mapping.
<3> [Size of DataFlash memory[KBytes]]
The size of the data flash memory area of the selected microcontroller is displayed (unit: Kbytes).
You cannot change the value of this property.
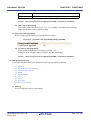
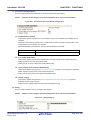
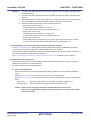
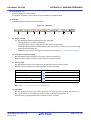
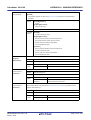
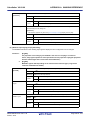
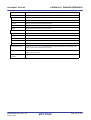
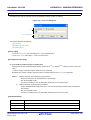
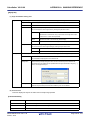
(b) [Clock]
You can configure the clock in this category.
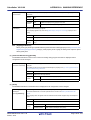
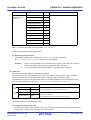
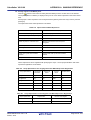
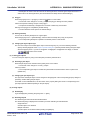
Figure 2-9. [Clock] Category [IECUBE]
<1> [Main clock source]
Specify the main clock source to input to the CPU from the following drop-down list.
Clock socket
Uses a clock of the transmitter on the clock socket.
External
Uses a main clock (square wave) on the target board.
Generate by emulator
Uses a clock generated inside IECUBE (default).
Caution
This property cannot be changed when IECUBE is connected to CubeSuite+.
<2> [Main clock frequency [MHz]]
This property appears only when the [Main clock source] property is set to [Generate by emulator].
Select the main clock frequency (default: [4.00]).
Remark
The selectable frequency differs depending on the selected microcontroller.
<3> [Sub clock source]
Specify the sub clock source to input to the CPU and peripheral devices from the following drop-down
list.
R20UT2867EJ0100 Rev.1.00
Feb 01, 2014
Page 16 of 572
CubeSuite+ V2.02.00
CHAPTER 2 FUNCTIONS
External
Uses a main clock (square wave) on the target board.
Generate by emulator
Uses a clock generated inside IECUBE (default).
Caution
This property cannot be changed when IECUBE is connected to CubeSuite+.
<4> [Sub clock frequency[kHz]]
This property appears only when the [Sub clock source] property is set to [Generate by emulator].
Select the sub clock frequency (default: [32.768]).
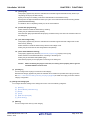
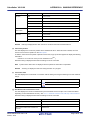
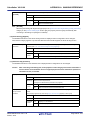
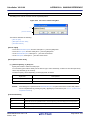
(c) [Connection with Target Board]
You can configure the connection to the target board in this category.
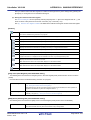
Figure 2-10. [Connection with Target Board] Category [IECUBE]
<1> [Connecting with target board]
Select whether the target board is connected to IECUBE or not.
Select [Yes] when the target board is connected to IECUBE (default: [No]).
Caution
This property cannot be changed when IECUBE is connected to CubeSuite+.
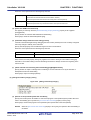
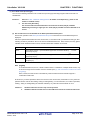
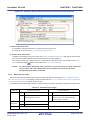
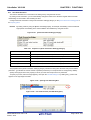
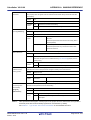
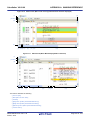
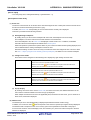
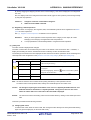
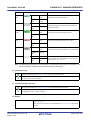
(2) [Debug Tool Settings] tab
You configure the basic settings of the debug tool for each one of the following categories.
(a) [Memory]
(b) [Access Memory While Running]
(c) [Set Event While Running]
(d) [Break]
(e) [Fail-safe Break]
(f) [Trace]
(g) [Timer]
(h) [Coverage]
(i) [Mask for Input Signal]
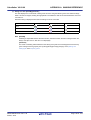
(a) [Memory]
You can configure the memory in this category.
R20UT2867EJ0100 Rev.1.00
Feb 01, 2014
Page 17 of 572
CubeSuite+ V2.02.00
CHAPTER 2 FUNCTIONS
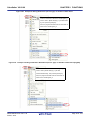
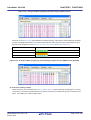
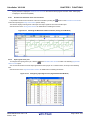
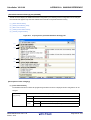
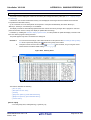
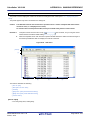
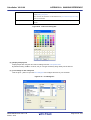
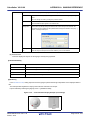
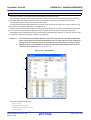
Figure 2-11. [Memory] Category [IECUBE]
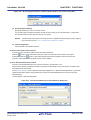
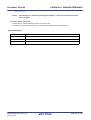
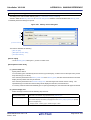
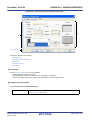
<1> [Memory mappings]
Current memory mapping status is displayed for each type of memory area.
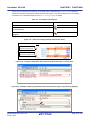
The memory mapping status cannot be changed on this panel. If it is necessary to add a memory
mapping, click on the [Memory Mapping] property, and click on the [...] button that appears on the right
end of the setting field. The Memory Mapping dialog box opens; perform the setting from there.
See the section for the Memory Mapping dialog box for details on how to configure the parameters.
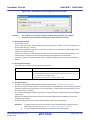
Figure 2-12. Opening Memory Mapping Dialog Box
Caution
If you are not connected to a debug tool, then only memory mapping areas added by
user is displayed.
Connecting to a debug tool (see "2.4.1 Connect to the debug tool") will display details
for each memory type.
<2> [Verify on writing to memory]
Select whether to perform a verify check when writing to the memory.
Select [Yes] to perform verification after download or when values are changed in the Memory panel/
Watch panel (default).
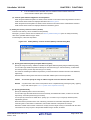
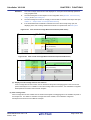
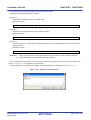
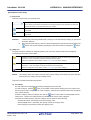
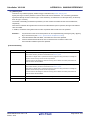
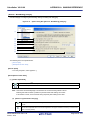
(b) [Access Memory While Running]
You can configure the memory access while executing a program (the real-time display update function) in this
category. See "(4) Display/modify the memory contents during program execution" for details on the real-time
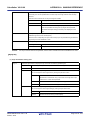
display update function.
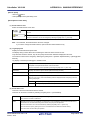
Figure 2-13. [Access Memory While Running] Category [IECUBE]
R20UT2867EJ0100 Rev.1.00
Feb 01, 2014
Page 18 of 572
CubeSuite+ V2.02.00
CHAPTER 2 FUNCTIONS
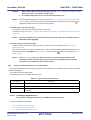
<1> [Access by stopping execution]
For a memory area not accessible during execution of a program (e.g. target memory area/SFR area),
select whether to allow access to the area by temporary stopping the execution.
Select [Yes] to allow access (default: [No]).
<2> [Update display during the execution]
Select whether to automatically update the contents in the Memory panel/Watch panel display during
execution of a program.
Select [Yes] to update the display automatically (default).
Remark
The display contents of the Memory panel/Watch panel can be updated manually by clicking
the
button on the panel.
<3> [Display update interval[ms]]
This property appears only when the [Update display during the execution] property is set to [Yes].
Specify the interval in 100 ms unit to automatically update the contents in the Memory panel/Watch panel
display during execution of a program.
Directly enter the Integer number between 100 and 65500 (rounding up the fractions less than 100ms)
(default: [500]).
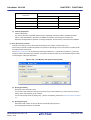
(c) [Set Event While Running]
You can configure the setting of events while executing a program in this category.
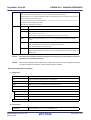
Figure 2-14. [Set Event While Running] Category
<1> [Set event by stopping execution momentarily]
Select whether to forcibly pause the execution for events that cannot be set while executing a program.
For details on the event types that are affected by this property, see "(2) Event types that can be set and
deleted during execution".
Select [Yes] to set events above while execution (default: [No]).
(d) [Break]
You can configure the break function.
See "2.8 Stop Programs (Break)" for details on the break function and this category configuration.
(e) [Fail-safe Break]
You can configure the fail-safe break function in this category.
See "2.8.6 Stop the program when an invalid execution is detected [IECUBE]" for details on the fail-safe
break function and this category configuration.
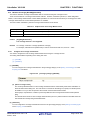
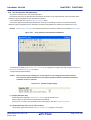
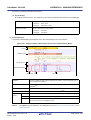
(f) [Trace]
You can configure the trace function in this category.
See "2.11 Collect Execution History of Programs" for details on the trace function and this category
configuration.
(g) [Timer]
You can configure the timer function in this category.
R20UT2867EJ0100 Rev.1.00
Feb 01, 2014
Page 19 of 572
CubeSuite+ V2.02.00
CHAPTER 2 FUNCTIONS
See "2.12 Measure Execution Time of Programs" for details on the timer function.
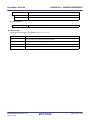
Figure 2-15. [Timer] Category [IECUBE]
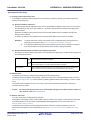
<1> [Rate of frequency division of timer]
Select the frequency division ratio of the timer counter (120 MHz) used for timer measurement (default:
[1/1(8ns/0.6min)]).
Caution
It is not possible to divide the timer counter for the Run-Break time.
(h) [Coverage]
You can configure the coverage function in this category.
See "2.13 Measure Coverage [IECUBE][Simulator]" for details on the coverage function and this category
configuration.
(i) [Mask for Input Signal]
You can configure the input signal masking in this category.
Figure 2-16. [Mask for Input Signal] Category [IECUBE]
With the properties shown below, select [Yes] to mask the signal from the drop-down list (default: [No]).
- [Mask WAIT signal]Note
- [Mask TARGET RESET signal]Note
- [Mask INTERNAL RESET signal]
- [Mask NMI signal]
Note If [No] is selected with the [Connection with Target Board] property in the [Connect Setting] tab, these
properties are fixed to [Yes] after connecting to the debug tool (changes not allowed).
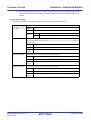
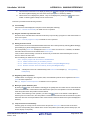
(3) [Flash Self Emulation Settings] tab
You configure the flash self programming emulation (Code flash).
Note that this tab appears only when the selected microcontroller incorporates the flash memory.
(a) [Flash Self Emulation]
(b) [Writing Time/Erasing Time]
(c) [Macro Service Error]
(d) [Setting Flash shield window]
(e) [Security Flag Emulation]
(a) [Flash Self Emulation]
You can configure the flash self programming emulation function in this category.
R20UT2867EJ0100 Rev.1.00
Feb 01, 2014
Page 20 of 572
CubeSuite+ V2.02.00
CHAPTER 2 FUNCTIONS
Figure 2-17. [Flash Self Emulation] Category
<1> [Flash self-programming]
Select whether to use the flash self programming emulation function.
Select [Yes] to use the flash self programming emulation function (default: [No]).
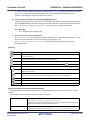
(b) [Writing Time/Erasing Time]
You can configure the delay time for writing to and erasing the flash memory in this category.
Figure 2-18. [Writing Time/Erasing Time] Category
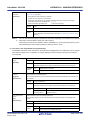
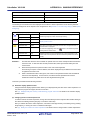
<1> [Writing time]
You can simulate the delay time for writing to the flash memory.
Select the value to simulate the delay time from the following drop-down list.
No retry
Specifies "0" as the number of times of retry.
The delay time is 0 (the writing speed is fastest).
Typical number of times that is assumed by
Specifies the typical number of times that is assumed by flash
flash macro specifications
macro specifications (default).
Maximum number of times that is assumed
Specifies the maximum number of times that is assumed by
by flash macro specifications
flash macro specifications.
Retries for the maximum number of times
Specifies the maximum number of times of retry.
specified
The delay time is maximum (the writing speed is longest).
<2> [Address for writing time]
Specify the target address at which to simulate the delay time for writing.
Directly enter the address in hexadecimal number from 0x0 to 0xFFFFF (default: [0]).
<3> [Address mask value for writing time]
Specify a mask value for the address for writing time.
Directly enter the address in hexadecimal number from 0x0 to 0xFFFFF (default: [0]).
The address for the writing time is masked bit-wise with a mask value for which "0" is specified.
Example To set an address for writing time between 0x1000 and 0x1FFF
[Address for writing time]:
0x1000
[Address mask value for writing time]:
0xF000
<4> [Erasing time]
You can simulate the delay time for erasing the flash memory.
Select the value to simulate the delay time from the following drop-down list.
R20UT2867EJ0100 Rev.1.00
Feb 01, 2014
Page 21 of 572
CubeSuite+ V2.02.00
CHAPTER 2 FUNCTIONS
.
No retry
Specifies "0" as the number of times of retry.
The delay time is 0 (the erasing speed is fastest).
Typical number of times that is assumed by
Specifies the typical number of times that is assumed by flash
flash macro specifications
macro specifications (default).
Maximum number of times that is assumed
Specifies the maximum number of times that is assumed by
by flash macro specifications
flash macro specifications.
Retries for the maximum number of times
Specifies the maximum number of times of retry.
specified
The delay time is maximum (the erasing speed is longest).
<5> [Address for erasing time]
Specify the target address at which to simulate the delay time for erasing.
Directly enter the address in hexadecimal number from 0x0 to 0xFFFFF (default: [0]).
<6> [Address mask value for erasing time]
Specify a mask value for the address for erasing time.
Directly enter the address in hexadecimal number from 0x0 to 0xFFFFF (default: [0]).
The address for the writing time is masked bit-wise with a mask value for which "0" is specified.
Example To set an address for writing time between 0x1000 and 0x1FFF
[Address for erasing time]:
0x1000
[Address mask value for erasing time]:
0xF000
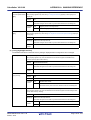
(c) [Macro Service Error]
In this category, you can configure the operation of flash functions in the self programming library, that are
used for the flash macro service when performing the flash self programming.
Figure 2-19. [Macro Service Error] Category
<1> [Macro Service Errors]
Specify the error to generate in the flash macro service to emulate (errors will not be generated during
normal emulation).
Three types of errors to generate ([0]/[1]/[2]) can be specified with subproperties for this property.
Select any one of the following types from each of the [Generate error] subproperties to return the error
values forcibly.
1) Generate FlashErase Error (Erase)
2) Generate FlashBlankCheck Error (BlankCheck)
3) Generate FlashWrite Error (Write)
4) Generate FlashIVerify Error (IVerify)
5) Generate FlashSetSecurity / FlashSetFSW Error (Erase)
6) Generate FlashSetSecurity / FlashSetFSW Error (Write)
7) Generate FlashSetSecurity / FlashSetFSW Error (IVerify)
R20UT2867EJ0100 Rev.1.00
Feb 01, 2014
Page 22 of 572
CubeSuite+ V2.02.00
CHAPTER 2 FUNCTIONS
If you select one of 1) to 4), furthermore, specify the address within the flash memory and its mask value
at which the corresponding error is to be generated, with the [Address for error] and [Address mask
value for error] subproperties that are listed newly in the lower area. Directly enter the address in
hexadecimal number from 0x0 to 0xFFFFF (default: [0]).
(d) [Setting Flash shield window]
You can specify the area that can be written or erased by flash self programming (Flash shield window
function), in this category.
Caution
Settings of this category are applied after CPU reset is generated.
If you changed these settings, execute the program after reset the CPU.
<1> [Flash shield window start block]
Specify the start block of the area that can be written to and erased by flash self programming.
Directly enter the value in hexadecimal number from 0x0 to 0xFFFF (default: [0]).
<2> [Flash shield window end block]
Specify the end block of the area that can be written to and erased by flash self programming.
Directly enter the value in hexadecimal number from 0x0 to 0xFFFF (default: [FFFF]).
(e) [Security Flag Emulation]
You can configure the function on the security flag emulation in this category.
The initial value of the security flag is emulated when the security has been set to the flash memory.
Caution
Settings of this category are applied after CPU reset is generated.
If you changed these settings, execute the program after reset the CPU.
Figure 2-20. [Security Flag Emulation] Category
<1> [Disable block erase]
Specify whether to emulate to disable block erase.
Select [Yes] to emulate to disable block erase (default: [No]).
<2> [Disable program]
Select whether to emulate to disable writing.
Select [Yes] to emulate to disable writing (default: [No]).
<3> [Disable boot block cluster reprogram]
Select whether to emulate to disable rewrite boot area.
Select [Yes] to emulate to disable rewrite boot area (default: [No]).
R20UT2867EJ0100 Rev.1.00
Feb 01, 2014
Page 23 of 572
CubeSuite+ V2.02.00
CHAPTER 2 FUNCTIONS
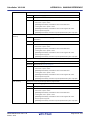
(4) [DataFlash Emulation Settings] tab
You configure the data flash emulation function.
Note that this tab appears only when the selected microcontroller incorporates the data flash memory.
(a) [DataFlash Emulation]
(b) [Writing Time/Erasing Time]
(c) [Macro Service Error]
(a) [DataFlash Emulation]
You can configure the data flash emulation function in this category.
Figure 2-21. [DataFlash Emulation] Category
<1> [DataFlash emulation]
Select whether to use the data flash emulation function.
Select [Yes] to use the data flash emulation function (default: [No]).
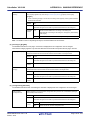
(b) [Writing Time/Erasing Time]
You can configure the delay time for writing to and erasing the data flash memory in this category.
Figure 2-22. [Writing Time/Erasing Time] Category
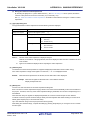
<1> [Writing time]
You can simulate the delay time for writing to the data flash memory.
Select the value to simulate the delay time from the following drop-down list.
No retry
Specifies "0" as the number of times of retry.
The delay time is 0 (the writing speed is fastest).
Typical number of times that is assumed by
Specifies the typical number of times that is assumed by flash
flash macro specifications
macro specifications (default).
Maximum number of times that is assumed
Specifies the maximum number of times that is assumed by
by flash macro specifications
flash macro specifications.
Retries for the maximum number of times
Specifies the maximum number of times of retry.
specified
The delay time is maximum (the writing speed is longest).
<2> [Address for writing time]
Specify the target address at which to simulate the delay time for writing.
Directly enter the address in hexadecimal number from 0xF1000 to 0xFFFFF (default: [F1000]).
R20UT2867EJ0100 Rev.1.00
Feb 01, 2014
Page 24 of 572
CubeSuite+ V2.02.00
CHAPTER 2 FUNCTIONS
<3> [Address mask value for writing time]
Specify a mask value for the address for writing time.
Directly enter the address in hexadecimal number from 0x0 to 0xFFFFF (default: [0]).
The address for the writing time is masked bit-wise with a mask value for which "0" is specified.
Example To set an address for writing time between 0xF1000 and 0xF1FFF
[Address for writing time]:
0xF1000
[Address mask value for writing time]:
0xFF000
<4> [Erasing time]
You can simulate the delay time for erasing the data flash memory.
Select the value to simulate the delay time from the following drop-down list.
No retry
Specifies "0" as the number of times of retry.
The delay time is 0 (the erasing speed is fastest).
Typical number of times that is assumed by
Specifies the typical number of times that is assumed by flash
flash macro specifications
macro specifications (default).
Maximum number of times that is assumed
Specifies the maximum number of times that is assumed by
by flash macro specifications
flash macro specifications.
Retries for the maximum number of times
Specifies the maximum number of times of retry.
specified
The delay time is maximum (the erasing speed is longest).
<5> [Address for erasing time]
Specify the target address at which to simulate the delay time for erasing.
Directly enter the address in hexadecimal number from 0xF1000 to 0xFFFFF (default: [F1000]).
<6> [Address mask value for erasing time]
Specify a mask value for the address for erasing time.
Directly enter the address in hexadecimal number from 0x0 to 0xFFFFF (default: [0]).
The address for the writing time is masked bit-wise with a mask value for which "0" is specified.
Example To set an address for writing time between 0xF1000 and 0xF1FFF
[Address for erasing time]:
0xF1000
[Address mask value for erasing time]:
0xFF000
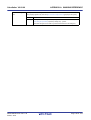
(c) [Macro Service Error]
In this category, you can configure the operation of flash functions, that are used for the data flash macro
service when performing the data flash emulation.
Figure 2-23. [Macro Service Error] Category
R20UT2867EJ0100 Rev.1.00
Feb 01, 2014
Page 25 of 572
CubeSuite+ V2.02.00
CHAPTER 2 FUNCTIONS
<1> [Macro Service Errors]
Specify the error to generate in the data flash macro service to emulate (errors will not be generated
during normal emulation).
Three types of errors to generate ([0]/[1]/[2]) can be specified with subproperties for this property. Select
any one of the following types from each of the [Generate error] subproperties to return the error values
forcibly, and then specify the address within the data flash memory (0xF1000 to 0xFFFFF) and its mask
value (0x0 to 0xFFFFF) at which the corresponding function error is to be generated, with the [Address
for error] and [Address mask value for error] subproperties that are listed newly in the lower area
[Address for error]: [F1000]/[Address mask value for error]: [0] is specified by default.
- Generate erase error for FlashErase
- Generate write error for FlashWrite
- Generate IVerify error for FlashIVerify
- Generate BlankCheck error for FlashBlankCheck
(5) [Download File Settings] tab
You can configure downloading to the debug tool.
See "2.5.1 Execute downloading" for details on each category configuration.
(6) [Hook Transaction Settings] tab
You can configure hook transaction for the debug tool.
See "2.17 Use Hook Function" for details on each category configuration and the function of the hook transaction.
R20UT2867EJ0100 Rev.1.00
Feb 01, 2014
Page 26 of 572
CubeSuite+ V2.02.00
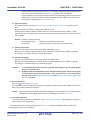
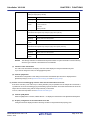
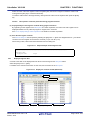
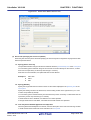
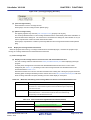
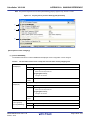
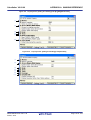
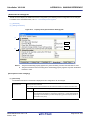
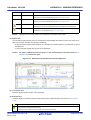
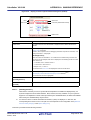
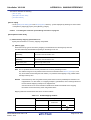
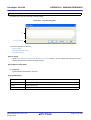
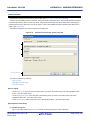
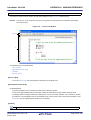
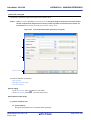
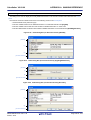
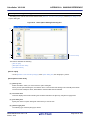
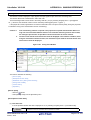
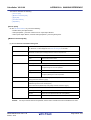
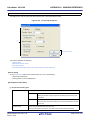
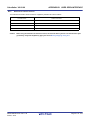
2.3.3
CHAPTER 2 FUNCTIONS
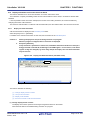
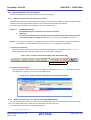
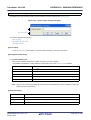
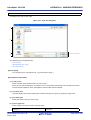
[E1]
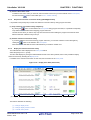
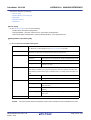
Configure the operating environment on the Property panel below when using E1.
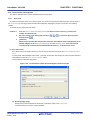
Figure 2-24. Example of Property Panel [E1]
Follow the steps below by selecting the corresponding tab on the Property panel.
(1) [Connect Settings] tab
(2) [Debug Tool Settings] tab
(3) [Download File Settings] tab
(4) [Hook Transaction Settings] tab
(1) [Connect Settings] tab
You configure the connection with the debug tool for each one of the following categories.
(a) [Internal ROM/RAM]
(b) [Clock]
(c) [Connection with Target Board]
(d) [Flash]
(e) [Hot Plug-in]
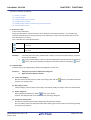
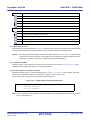
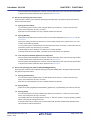
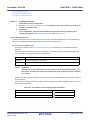
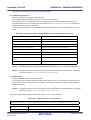
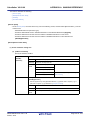
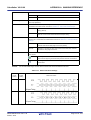
(a) [Internal ROM/RAM]
The configuration of internal ROM/RAM is displayed in this category.
Figure 2-25. [Internal ROM/RAM] Category [E1]
R20UT2867EJ0100 Rev.1.00
Feb 01, 2014
Page 27 of 572
CubeSuite+ V2.02.00
CHAPTER 2 FUNCTIONS
<1> [Size of internal ROM[KBytes]]
The internal ROM size to emulate is displayed (unit: Kbytes).
You cannot change the value of this property.
<2> [Size of internal RAM[Bytes]]
The internal RAM size to emulate is displayed (unit: bytes).
You cannot change the value of this property.
<3> [Size of DataFlash memory[KBytes]]
The data flash memory size is displayed (unit: Kbytes).
If the currently selected microcontroller does not incorporate the data flash, [0] is displayed.
You cannot change the value of this property.
(b) [Clock]
You can configure the clock in this category.
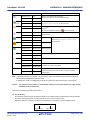
Figure 2-26. [Clock] Category [E1]
<1> [Main clock frequency [MHz]]
Specify the main clock frequency.
You can specify the frequency from the drop-down list or by directly entering a frequency value between
0.001 and 99.999 (unit: MHz) (default: [Using internal clock]).
When using X1/X2 oscillation, specify the clock frequency.
When using an external clock oscillation with the embedded PLL circuit, specify the frequency of the
transmitter/resonator (i.e. the frequency before the setting of the PLL clock).
Remark
The main clock frequency is used to synchronize the communication between E1 and the
host machine. This specification is not for the frequency of the CPU operation.
<2> [Sub clock frequency[kHz]]
Specify the sub clock frequency.
You can specify the frequency from the drop-down list or by directly entering a frequency value number
between 0.001 and 99.999 (unit: kHz) (default: [Using internal clock]).
Remark
The sub clock frequency is used to synchronize the communication between E1 and the host
machine. This specification is not for the frequency of the CPU operation.
<3> [Monitor clock]
Select a clock for monitor programs to operate while the program is stopped, from the following dropdown list.
System
Operates with main clock (default).
User
Operates with the clock that the program specified.
R20UT2867EJ0100 Rev.1.00
Feb 01, 2014
Page 28 of 572
CubeSuite+ V2.02.00
CHAPTER 2 FUNCTIONS
(c) [Connection with Target Board]
You can configure the connection between E1 and the target board in this category.
Caution
Properties in this category cannot be changed when E1 is connected to CubeSuite+.
Figure 2-27. [Connection with Target Board] Category [E1]
<1> [Communication method]
This property appears only when the communication method of the selected microcontroller can be
changed.
Select the communication method for E1 to communicate in serial mode with microcontrollers on the
target board, from the following drop-down list.
Note that selectable ports depend on the type of the selected microcontroller.
1 line type (TOOL0)
The communication method is to use 1 line type (TOOL0) (default).
2 line type (TOOL0+TOOL1)
The communication method is to use 2 line type (TOOL0+TOOL1).
<2> [Low voltage OCD board]
This property appears only when the selected microcontroller supports a low voltage OCD board.
Select whether to use a low voltage OCD board.
Select [Yes] to use a low voltage OCD board (default: [No]).
<3> [Power target from the emulator (MAX 200mA)]
This property appears only when the [Low voltage OCD board] property is set to [No] if it is displayed.
Select whether to supply power to the target board from E1.
Select [Yes] to supply power to the target board (default: [No]).
<4> [Supply voltage]
This property appears only when the [Power target from the emulator (MAX 200mA)] property is
displayed and also [Yes] is set to it.
Select the power voltage supplied to the target board (default: [3.3V]).
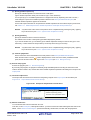
(d) [Flash]
You can configure the flash memory rewriting in this category.
Caution
Properties in this category cannot be changed when E1 is connected to CubeSuite+.
Figure 2-28. [Flash] Category
R20UT2867EJ0100 Rev.1.00
Feb 01, 2014
Page 29 of 572
CubeSuite+ V2.02.00
CHAPTER 2 FUNCTIONS
<1> [Security ID]
This property appears only when the selected microcontroller supports the ROM security function (onchip debug security ID) for flash memory.
Specify a security ID for reading codes in the internal ROM or internal flash memory.
Directly enter 20 digits hexadecimal number (10 bytes: 0x0 to 0xFFFFFFFFFFFFFFFFFFFE) (default:
[00000000000000000000]).
For details on the on-chip debug security ID, see E1 User's Manual.
<2> [Permit flash programming]
Select whether to enable the flash memory rewriting.
Select [Yes] to enable flash rewrite (default).
Note that when [No] is specified with this property, the flash memory area cannot be rewritten at all from
the debug tool.
<3> [Use wide voltage mode]
This property appears only when the selected microcontroller supports the wide voltage mode for the
flash memory rewriting.
Select whether to rewrite the flash memory with the wide voltage mode.
Select [Yes] to rewrite with the low voltage flash mode (default).
<4> [Erase flash ROM when starting]
This property appears only when the [Permit flash programming] property is set to [Yes].
Select whether to erase flash ROM when connecting to the debug tool.
Select [Yes] to erase flash ROM (default: [No]).
Note that this property is set to [No] after connecting to the debug tool.
Caution
When conducting hot plug-in connection, the setting of this property will be ignored
and flash ROM will not be erased.
(e) [Hot Plug-in]
You can configure the hot plug-in connection in this category.
Note that this category appears only when the selected microcontroller incorporates the hot plug-in function.
See "2.4.3 Connect to the debug tool using hot plug-in [E1][E20] for details on hot plug-in function and this
category configuration.
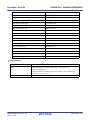
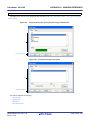
(2) [Debug Tool Settings] tab
You configure the basic settings of the debug tool for each one of the following categories.
(a) [Memory]
(b) [Access Memory While Running]
(c) [Break]
(d) [Trace]
(e) [Mask for Input Signal]
(f) [Smart Analog]
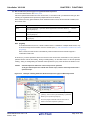
(a) [Memory]
You can configure the memory in this category.
R20UT2867EJ0100 Rev.1.00
Feb 01, 2014
Page 30 of 572
CubeSuite+ V2.02.00
CHAPTER 2 FUNCTIONS
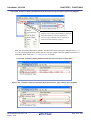
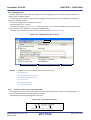
Figure 2-29. [Memory] Category [E1]
<1> [Memory mappings]
Current memory mapping status is displayed for each type of memory area.
The memory mapping status cannot be changed on this panel. If it is necessary to add a memory
mapping, click on the [Memory Mapping] property, and click on the [...] button that appears on the right
end of the setting field. The Memory Mapping dialog box opens; perform the setting from there.
See the section for the Memory Mapping dialog box for details on how to configure the parameters.
Figure 2-30. Opening Memory Mapping Dialog Box
Caution
If you are not connected to a debug tool, then only memory mapping areas added by
user is displayed.
Connecting to a debug tool (see "2.4.1 Connect to the debug tool") will display details
for each memory type.
<2> [Verify on writing to memory]
Select whether to perform a verify check when writing to the memory.
Select [Yes] to perform verification after download or when values are changed in the Memory panel/
Watch panel (default).
(b) [Access Memory While Running]
You can configure the memory access while executing a program (the real-time display update function) in this
category. See "(4) Display/modify the memory contents during program execution" for details on the real-time
display update function.
Figure 2-31. [Access Memory While Running] Category [E1]
R20UT2867EJ0100 Rev.1.00
Feb 01, 2014
Page 31 of 572
CubeSuite+ V2.02.00
CHAPTER 2 FUNCTIONS
<1> [Access by stopping execution]
For a memory area not accessible during execution of a program (e.g. target memory area/SFR area),
select whether to allow access to the area by temporary stopping the execution.
Note that if this property is set to [Yes] when the [Communication method] property in the [Connection
with Target Board] category is set to [1 line type (TOOL0+TOOL1)], then a message will appear because
the debug tool's response speed becomes sluggish.
Select [Yes] to allow access (default: [No]).
<2> [Update display during the execution]
Select whether to automatically update the contents in the Memory panel/Watch panel display while
executing a program.
Select [Yes] to update the display automatically (default).
Remark
The display contents of the Memory panel/Watch panel can be updated manually by clicking
the
button on the panel.
<3> [Display update interval[ms]]
This property is valid only when the [Update display during the execution] property is set to [Yes].
Specify the interval in 100ms unit to automatically update the contents in the Memory panel/Watch panel
display while executing a program.
Directly enter the Integer number between 100 and 65500 (rounding up the fractions less than 100ms)
(default: [500]).
(c) [Break]
You can configure the break function.
See "2.8 Stop Programs (Break)" for details on the break function and this category configuration.
(d) [Trace]
You can configure the trace function in this category.
Note that this category appears only when the selected microcontroller incorporates the OCD trace function.
See "2.11 Collect Execution History of Programs" for details on the trace function and this category
configuration.
(e) [Mask for Input Signal]
You can configure the input signal masking in this category.
Cautions 1.
The settings of the properties in this category are ignored in the case of a hot plug-in
connection. That is, the program operates as if the specification for the properties is
[No] (the settings of them become valid again after reconnection with CubeSuite+).
2.
Maskable signals differ depending on the selected microcontroller type (a signal that
cannot be masked will be hidden).
Figure 2-32. [Mask for Input Signal] Category
With the properties shown below, select [Yes] to mask the signal from the drop-down list (default: [No]).
- [Mask TARGET RESET signal]
R20UT2867EJ0100 Rev.1.00
Feb 01, 2014
Page 32 of 572
CubeSuite+ V2.02.00
CHAPTER 2 FUNCTIONS
- [Mask INTERNAL RESET signal]
(f) [Smart Analog]
You can configure the Smart Analog function in this category.
Note that this category appears only when the selected microcontroller supports the Smart Analog function.
See "2.16 Use Smart Analog Function [E1][E20]" for details on the Smart Analog function and this category
configuration.
(3) [Download File Settings] tab
You can configure downloading to the debug tool.
See "2.5.1 Execute downloading" for details on each category configuration.
(4) [Hook Transaction Settings] tab
You can configure hook transaction for the debug tool.
See "2.17 Use Hook Function" for details on each category configuration and the function of the hook transaction.
R20UT2867EJ0100 Rev.1.00
Feb 01, 2014
Page 33 of 572
CubeSuite+ V2.02.00
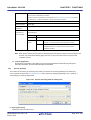
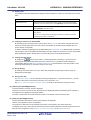
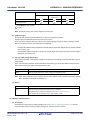
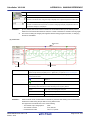
2.3.4
CHAPTER 2 FUNCTIONS
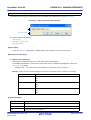
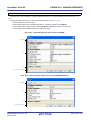
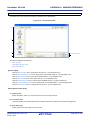
[E20]
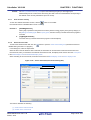
Configure the operating environment on the Property panel below when using E20.
Figure 2-33. Example of Property Panel [E20]
Follow the steps below by selecting the corresponding tab on the Property panel.
(1) [Connect Settings] tab
(2) [Debug Tool Settings] tab
(3) [Download File Settings] tab
(4) [Hook Transaction Settings] tab
(1) [Connect Settings] tab
You configure the connection with the debug tool for each one of the following categories.
(a) [Internal ROM/RAM]
(b) [Clock]
(c) [Connection with Target Board]
(d) [Flash]
(e) [Hot Plug-in]
(a) [Internal ROM/RAM]
The configuration of internal ROM/RAM is displayed in this category.
Figure 2-34. [Internal ROM/RAM] Category [E20]
R20UT2867EJ0100 Rev.1.00
Feb 01, 2014
Page 34 of 572
CubeSuite+ V2.02.00
CHAPTER 2 FUNCTIONS
<1> [Size of internal ROM[KBytes]]
The internal ROM size to emulate is displayed (unit: Kbytes).
You cannot change the value of this property.
<2> [Size of internal RAM[Bytes]]
The internal RAM size to emulate is displayed (unit: bytes).
You cannot change the value of this property.
<3> [Size of DataFlash memory[KBytes]]
The data flash memory size is displayed (unit: Kbytes).
If the currently selected microcontroller does not incorporate the data flash, [0] is displayed.
You cannot change the value of this property.
(b) [Clock]
You can configure the clock in this category.
Figure 2-35. [Clock] Category [E20]
<1> [Main clock frequency [MHz]]
Specify the main clock frequency.
You can specify the frequency from the drop-down list or by directly entering a frequency value between
0.001 and 99.999 (unit: MHz) (default: [Using internal clock]).
When using X1/X2 oscillation, specify the clock frequency.
When using an external clock oscillation with the embedded PLL circuit, specify the frequency of the
transmitter/resonator (i.e. the frequency before the setting of the PLL clock).
Remark
The main clock frequency is used to synchronize the communication between E20 and the
host machine. This specification is not for the frequency of the CPU operation.
<2> [Sub clock frequency[kHz]]
Specify the sub clock frequency.
You can specify the frequency from the drop-down list or by directly entering a frequency value number
between 0.001 and 99.999 (unit: kHz) (default: [Using internal clock]).
Remark
The sub clock frequency is used to synchronize the communication between E20 and the
host machine. This specification is not for the frequency of the CPU operation.
<3> [Monitor clock]
Select a clock for monitor programs to operate while the program is stopped, from the following dropdown list.
System
Operates with main clock (default).
User
Operates with the clock that the program specified.
R20UT2867EJ0100 Rev.1.00
Feb 01, 2014
Page 35 of 572
CubeSuite+ V2.02.00
CHAPTER 2 FUNCTIONS
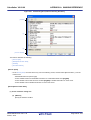
(c) [Connection with Target Board]
You can configure the connection between E20 and the target board in this category.
Note that this category does not appear if no property displayed exists according to the type of the selected
microcontroller.
Caution
Properties in this category cannot be changed when E20 is connected to CubeSuite+.
Figure 2-36. [Connection with Target Board] Category [E20]
<1> [Communication method]
This property appears only when the communication method of the selected microcontroller can be
changed.
Select the communication method for E20 to communicate in serial mode with microcontrollers on the
target board, from the following drop-down list.
Note that selectable ports depend on the type of the selected microcontroller.
1 line type (TOOL0)
The communication method is to use 1 line type (TOOL0) (default).
2 line type (TOOL0+TOOL1)
The communication method is to use 2 line type (TOOL0+TOOL1).
(d) [Flash]
You can configure the flash memory rewriting in this category.
Caution
Properties in this category cannot be changed when E20 is connected to CubeSuite+.
Figure 2-37. [Flash] Category
<1> [Security ID]
This property appears only when the selected microcontroller supports the ROM security function (onchip debug security ID) for flash memory.
Specify a security ID for reading codes in the internal ROM or internal flash memory.
Directly enter 20 digits hexadecimal number (10 bytes: 0x0 to 0xFFFFFFFFFFFFFFFFFFFE) (default:
[00000000000000000000]).
For details on the on-chip debug security ID, see E20 User's Manual.
<2> [Permit flash programming]
Select whether to enable the flash memory rewriting.
Select [Yes] to enable flash rewrite (default).
Note that when [No] is specified with this property, the flash memory area cannot be rewritten at all from
the debug tool.
R20UT2867EJ0100 Rev.1.00
Feb 01, 2014
Page 36 of 572
CubeSuite+ V2.02.00
CHAPTER 2 FUNCTIONS
<3> [Use wide voltage mode]
This property appears only when the selected microcontroller supports the wide voltage mode for the
flash memory rewriting.
Select whether to rewrite the flash memory with the wide voltage mode.
Select [Yes] to rewrite with the low voltage flash mode (default).
<4> [Erase flash ROM when starting]
This property appears only when the [Permit flash programming] property is set to [Yes].
Select whether to erase flash ROM when connecting to the debug tool.
Select [Yes] to erase flash ROM (default: [No]).
Note that this property is set to [No] after connecting to the debug tool.
Caution
When conducting hot plug-in connection, the setting of this property will be ignored
and flash ROM will not be erased.
(e) [Hot Plug-in]
You can configure the hot plug-in connection in this category.
Note that this category appears only when the selected microcontroller incorporates the hot plug-in function.
See "2.4.3 Connect to the debug tool using hot plug-in [E1][E20] for details on hot plug-in function and this
category configuration.
(2) [Debug Tool Settings] tab
You configure the basic settings of the debug tool for each one of the following categories.
(a) [Memory]
(b) [Access Memory While Running]
(c) [Break]
(d) [Trace]
(e) [Mask for Input Signal]
(f) [Smart Analog]
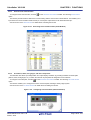
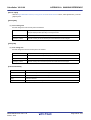
(a) [Memory]
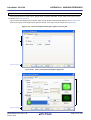
You can configure the memory in this category.
Figure 2-38. [Memory] Category [E20]
<1> [Memory mappings]
Current memory mapping status is displayed for each type of memory area.
R20UT2867EJ0100 Rev.1.00
Feb 01, 2014
Page 37 of 572
CubeSuite+ V2.02.00
CHAPTER 2 FUNCTIONS
The memory mapping status cannot be changed on this panel. If it is necessary to add a memory
mapping, click on the [Memory Mapping] property, and click on the [...] button that appears on the right
end of the setting field. The Memory Mapping dialog box opens; perform the setting from there.
See the section for the Memory Mapping dialog box for details on how to configure the parameters.
Figure 2-39. Opening Memory Mapping Dialog Box
Caution
If you are not connected to a debug tool, then only memory mapping areas added by
user is displayed.
Connecting to a debug tool (see "2.4.1 Connect to the debug tool") will display details
for each memory type.
<2> [Verify on writing to memory]
Select whether to perform a verify check when writing to the memory.
Select [Yes] to perform verification after download or when values are changed in the Memory panel/
Watch panel (default).
(b) [Access Memory While Running]
You can configure the memory access while executing a program (the real-time display update function) in this
category. See "(4) Display/modify the memory contents during program execution" for details on the real-time
display update function.
Figure 2-40. [Access Memory While Running] Category [E20]
<1> [Access by stopping execution]
For a memory area not accessible during execution of a program (e.g. target memory area/SFR area),
select whether to allow access to the area by temporary stopping the execution.
Note that if this property is set to [Yes] when the [Communication method] property in the [Connection
with Target Board] category is set to [1 line type (TOOL0+TOOL1)], then a message will appear because
the debug tool's response speed becomes sluggish.
Select [Yes] to allow access (default: [No]).
<2> [Update display during the execution]
Select whether to automatically update the contents in the Memory panel/Watch panel display while
executing a program.
Select [Yes] to update the display automatically (default).
Remark
The display contents of the Memory panel/Watch panel can be updated manually by clicking
the
R20UT2867EJ0100 Rev.1.00
Feb 01, 2014
button on the panel.
Page 38 of 572
CubeSuite+ V2.02.00
CHAPTER 2 FUNCTIONS
<3> [Display update interval[ms]]
This property is valid only when the [Update display during the execution] property is set to [Yes].
Specify the interval in 100ms unit to automatically update the contents in the Memory panel/Watch panel
display while executing a program.
Directly enter the Integer number between 100 and 65500 (rounding up the fractions less than 100ms)
(default: [500]).
(c) [Break]
You can configure the break function.
See "2.8 Stop Programs (Break)" for details on the break function and this category configuration.
(d) [Trace]
You can configure the trace function in this category.
Note that this category appears only when the selected microcontroller incorporates the OCD trace function.
See "2.11 Collect Execution History of Programs" for details on the trace function and this category
configuration.
(e) [Mask for Input Signal]
You can configure the input signal masking in this category.
Cautions 1.
The settings of the properties in this category are ignored in the case of a hot plug-in
connection. That is, the program operates as if the specification for the properties is
[No] (the settings of them become valid again after reconnection with CubeSuite+).
2.
Maskable signals differ depending on the selected microcontroller type (a signal that
cannot be masked will be hidden).
Figure 2-41. [Mask for Input Signal] Category
With the properties shown below, select [Yes] to mask the signal from the drop-down list (default: [No]).
- [Mask TARGET RESET signal]
- [Mask INTERNAL RESET signal]
(f) [Smart Analog]
You can configure the Smart Analog function in this category.
Note that this category appears only when the selected microcontroller supports the Smart Analog function.
See "2.16 Use Smart Analog Function [E1][E20]" for details on the Smart Analog function and this category
configuration.
(3) [Download File Settings] tab
You can configure downloading to the debug tool.
See "2.5.1 Execute downloading" for details on each category configuration.
(4) [Hook Transaction Settings] tab
You can configure hook transaction for the debug tool.
See "2.17 Use Hook Function" for details on each category configuration and the function of the hook transaction.
R20UT2867EJ0100 Rev.1.00
Feb 01, 2014
Page 39 of 572
CubeSuite+ V2.02.00
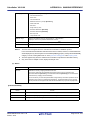
2.3.5
CHAPTER 2 FUNCTIONS
[EZ Emulator]
Configure the operating environment on the Property panel below when using EZ Emulator.
Figure 2-42. Example of Property Panel [EZ Emulator]
Follow the steps below by selecting the corresponding tab on the Property panel.
(1) [Connect Settings] tab
(2) [Debug Tool Settings] tab
(3) [Download File Settings] tab
(4) [Hook Transaction Settings] tab
(1) [Connect Settings] tab
You configure the connection with the debug tool for each one of the following categories.
(a) [Internal ROM/RAM]
(b) [Clock]
(c) [Connection with Target Board]
(d) [Flash]
(a) [Internal ROM/RAM]
The configuration of internal ROM/RAM is displayed in this category.
Figure 2-43. [Internal ROM/RAM] Category [EZ Emulator]
<1> [Size of internal ROM[KBytes]]
The internal ROM size to emulate is displayed (unit: Kbytes).
R20UT2867EJ0100 Rev.1.00
Feb 01, 2014
Page 40 of 572
CubeSuite+ V2.02.00
CHAPTER 2 FUNCTIONS
You cannot change the value of this property.
<2> [Size of internal RAM[Bytes]]
The internal RAM size to emulate is displayed (unit: bytes).
You cannot change the value of this property.
<3> [Size of DataFlash memory[KBytes]]
The data flash memory size is displayed (unit: Kbytes).
If the currently selected microcontroller does not incorporate the data flash, [0] is displayed.
You cannot change the value of this property.
(b) [Clock]
You can configure the clock in this category.
Figure 2-44. [Clock] Category [EZ Emulator]
<1> [Main clock frequency [MHz]]
Specify the main clock frequency.
You can specify the frequency from the drop-down list or by directly entering a frequency value between
0.001 and 99.999 (unit: MHz) (default: [Using internal clock]).
When using X1/X2 oscillation, specify the clock frequency.
When using an external clock oscillation with the embedded PLL circuit, specify the frequency of the
transmitter/resonator (i.e. the frequency before the setting of the PLL clock).
Remark
The main clock frequency is used to synchronize the communication between EZ Emulator
and the host machine. This specification is not for the frequency of the CPU operation.
<2> [Sub clock frequency[kHz]]
Specify the sub clock frequency.
You can specify the frequency from the drop-down list or by directly entering a frequency value number
between 0.001 and 99.999 (unit: kHz) (default: [Using internal clock]).
Remark
The sub clock frequency is used to synchronize the communication between EZ Emulator
and the host machine.
This specification is not for the frequency of the CPU operation.
<3> [Monitor clock]
Select a clock for monitor programs to operate while the program is stopped, from the following dropdown list.
System
Operates with main clock (default).
User
Operates with the clock that the program specified.
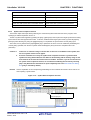
(c) [Connection with Target Board]
You can configure the connection between EZ Emulator and the target board in this category.
R20UT2867EJ0100 Rev.1.00
Feb 01, 2014
Page 41 of 572
CubeSuite+ V2.02.00
CHAPTER 2 FUNCTIONS
Note that this category does not appear if no property displayed exists according to the type of the selected
microcontroller.
Figure 2-45. [Connection with Target Board] Category [EZ Emulator]
<1> [Communication method]
This property appears only when the communication method of the selected microcontroller can be
changed.
Select the communication method for EZ Emulator to communicate in serial mode with microcontrollers
on the target board, from the following drop-down list.
Note that selectable ports depend on the type of the selected microcontroller.
1 line type (TOOL0)
The communication method is to use 1 line type (TOOL0) (default).
2 line type (TOOL0+TOOL1)
The communication method is to use 2 line type (TOOL0+TOOL1).
Caution
This property cannot be changed when EZ Emulator is connected to CubeSuite+.
<2> [Low voltage OCD board]
This property appears only when the selected microcontroller supports a low voltage OCD board.
Select whether to use a low voltage OCD board.
Select [Yes] to use a low voltage OCD board (default: [No]).
(d) [Flash]
You can configure the flash memory rewriting in this category.
Figure 2-46. [Flash] Category [EZ Emulator]
<1> [Security ID]
This property appears only when the selected microcontroller supports the ROM security function (onchip debug security ID) for flash memory.
Specify a security ID for reading codes in the internal ROM or internal flash memory.
Directly enter 20 digits hexadecimal number (10 bytes: 0x0 to 0xFFFFFFFFFFFFFFFFFFFE) (default:
[00000000000000000000]).
For details on the on-chip debug security ID, see EZ Emulator User's Manual.
Caution
This property cannot be changed when EZ Emulator is connected to CubeSuite+.
<2> [Permit flash programming]
Select whether to enable the flash memory rewriting.
Select [Yes] to enable flash rewrite (default).
R20UT2867EJ0100 Rev.1.00
Feb 01, 2014
Page 42 of 572
CubeSuite+ V2.02.00
CHAPTER 2 FUNCTIONS
Note that when [No] is specified with this property, the flash memory area cannot be rewritten at all from
the debug tool.
<3> [Use wide voltage mode]
This property appears only when the selected microcontroller supports the wide voltage mode for the
flash memory rewriting.
Select whether to rewrite the flash memory with the wide voltage mode.
Select [Yes] to rewrite with the low voltage flash mode (default).
Caution
This property cannot be changed when EZ Emulator is connected to CubeSuite+.
<4> [Erase flash ROM when starting]
This property appears only when the [Permit flash programming] property is set to [Yes].
Select whether to erase flash ROM when connecting to the debug tool.
Select [Yes] to erase the flash ROM (default: [No]).
Note that this property is set to [No] after connecting to the debug tool.
Caution
This property cannot be changed when EZ Emulator is connected to CubeSuite+.
(2) [Debug Tool Settings] tab
You configure the basic settings of the debug tool for each one of the following categories.
(a) [Memory]
(b) [Access Memory While Running]
(c) [Break]
(d) [Trace]
(e) [Mask for Input Signal]
(a) [Memory]
You can configure the memory in this category.
Figure 2-47. [Memory] Category [EZ Emulator]
<1> [Memory mappings]
Current memory mapping status is displayed for each type of memory area.
The memory mapping status cannot be changed on this panel. If it is necessary to add a memory
mapping, click on the [Memory Mapping] property, and click on the [...] button that appears on the right
end of the setting field. The Memory Mapping dialog box opens; perform the setting from there.
R20UT2867EJ0100 Rev.1.00
Feb 01, 2014
Page 43 of 572
CubeSuite+ V2.02.00
CHAPTER 2 FUNCTIONS
See the section for the Memory Mapping dialog box for details on how to configure the parameters.
Figure 2-48. Opening Memory Mapping Dialog Box
Caution
If you are not connected to a debug tool, then only memory mapping areas added by
user is displayed.
Connecting to a debug tool (see "2.4.1 Connect to the debug tool") will display details
for each memory type.
<2> [Verify on writing to memory]
Select whether to perform a verify check when writing to the memory.
Select [Yes] to perform verification after download or when values are changed in the Memory panel/
Watch panel (default).
(b) [Access Memory While Running]
You can configure the memory access while executing a program (the real-time display update function) in this
category. See "(4) Display/modify the memory contents during program execution" for details on the real-time
display update function.
Figure 2-49. [Access Memory While Running] Category [EZ Emulator]
<1> [Access by stopping execution]
Select whether to allow access to the memory area while executing a program.
Select [Yes] to allow access (default: [No]).
Note that if this property is set to [Yes] when the [Communication method] property in the [Connection
with Target Board] category is set to [1 line type (TOOL0+TOOL1)], then a message will appear because
the debug tool's response speed becomes sluggish.
<2> [Update display during the execution]
Select whether to automatically update the contents in the Memory panel/Watch panel display while
executing a program.
Select [Yes] to update the display automatically (default).
Remark
The display contents of the Memory panel/Watch panel can be updated manually by clicking
the
button on the panel.
<3> [Display update interval[ms]]
This property is valid only when the [Update display during the execution] property is set to [Yes].
Specify the interval in 100ms unit to automatically update the contents in the Memory panel/Watch panel
display while executing a program.
R20UT2867EJ0100 Rev.1.00
Feb 01, 2014
Page 44 of 572
CubeSuite+ V2.02.00
CHAPTER 2 FUNCTIONS
Directly enter the Integer number between 100 and 65500 (rounding up the fractions less than 100ms)
(default: [500]).
(c) [Break]
You can configure the break function.
See "2.8 Stop Programs (Break)" for details on the break function and this category configuration.
(d) [Trace]
You can configure the trace function in this category.
Note that this category appears only when the selected microcontroller incorporates the OCD trace function.
See "2.11 Collect Execution History of Programs" for details on the trace function and this category
configuration.
(e) [Mask for Input Signal]
You can configure the input signal masking in this category.
Caution
Maskable signals differ depending on the selected microcontroller type (a signal that
cannot be masked will be hidden).
Figure 2-50. [Mask for Input Signal] Category [EZ Emulator]
With the properties shown below, select [Yes] to mask the signal from the drop-down list (default: [No]).
- [Mask TARGET RESET signal]
- [Mask INTERNAL RESET signal]
(3) [Download File Settings] tab
You can configure downloading to the debug tool.
See "2.5.1 Execute downloading" for details on each category configuration.
(4) [Hook Transaction Settings] tab
You can configure hook transaction for the debug tool.
See "2.17 Use Hook Function" for details on each category configuration and the function of the hook transaction.
R20UT2867EJ0100 Rev.1.00
Feb 01, 2014
Page 45 of 572
CubeSuite+ V2.02.00
2.3.6
CHAPTER 2 FUNCTIONS
[Simulator]
Configure the operating environment on the Property panel below when using Simulator.
Figure 2-51. Example of Property Panel [Simulator]
Follow the steps below by selecting the corresponding tab on the Property panel.
(1) [Connect Settings] tab
(2) [Debug Tool Settings] tab
(3) [Download File Settings] tab
(4) [Hook Transaction Settings] tab
Caution
The following cautions apply to the instruction simulator for RL78:
- The data flash is not supported.
- The Pipeline is not supported.
- The CPU operation clock operates by the specification of RL78/G13.
- When using Multiplier and Divider/Multiply-Accumulator by division mode, the division
processing will be finished in by 1 clock.
- When using Multiplier and Divider/Multiply-Accumulator by division mode, the interrupt for the
end of division operation is not occurred. But DIVST bit of Multiplication/Division Control Register
"MDUC" is changed (DIVST bit displays division operation status).
Remark
When Simulator to be used corresponds to peripheral function simulations, you can use the Simulator GUI.
See "2.18 Use the Simulator GUI [Simulator]" for details on the Simulator GUI.
(1) [Connect Settings] tab
You configure the connection with the debug tool for each one of the following categories.
(a) [Internal ROM/RAM]
(b) [Clock]
(c) [Configuration]
(a) [Internal ROM/RAM]
You can configure internal ROM/RAM in this category.
R20UT2867EJ0100 Rev.1.00
Feb 01, 2014
Page 46 of 572
CubeSuite+ V2.02.00
CHAPTER 2 FUNCTIONS
The size of internal ROM/RAM of the selected microcontroller is specified by default.
There is no need to change the settings in this category if you wish to debug with the same memory mapping
of the selected microcontroller.
Figure 2-52. [Internal ROM/RAM] Category [Simulator]
<1> [Size of internal ROM[KBytes]
Select the internal ROM size to simulate (unit: Kbytes).
Change the value only when you perform debugging after changing the memory mapping.
<2> [Size of internal RAM[Bytes]]
Select the internal RAM size to simulate (unit: bytes).
Change the value only when you perform debugging after changing the memory mapping.
Remark
The data flash memory is not supported by Simulator.
(b) [Clock]
You can configure the clock in this category.
Figure 2-53. [Clock] Category [Simulator]
<1> [Main clock frequency [MHz]]
Specify the main clock frequency.
You can specify the frequency from the drop-down list or by directly entering a frequency value between
0.001 and 99.999 (unit: MHz) (default: [4.00]).
<2> [Sub clock frequency[kHz]]
Specify the sub clock frequency.
You can specify the frequency from the drop-down list or by directly entering a frequency value between
0.001 and 99.999 (unit: kHz) (default: [32.768]).
<3> [Select Timer/Trace clock frequency]
Select the clock frequency for using timer/trace function, from the following drop-down list.
CPU clock frequency
Specify clock frequency
Uses the CPU clock frequency (default).
Specifies an arbitrary frequency (property items to specify become valid in the
lower area).
R20UT2867EJ0100 Rev.1.00
Feb 01, 2014
Page 47 of 572
CubeSuite+ V2.02.00
CHAPTER 2 FUNCTIONS
<4> [Unit of Timer/Trace clock frequency]
This property appears only when the [Select Timer/Trace clock frequency] property is set to [Specify
clock frequency].
Select the unit of the clock frequency for timer/trace, from the following drop-down list.
MHz
The unit of the frequency is in MHz (default).
KHz
The unit of the frequency is in kHz.
<5> [Timer/Trace clock frequency]
The operation of this property differs depending on the specification of the [Select Timer/Trace clock
frequency] property.
- When [CPU clock frequency] is selected:
The following value is displayed (this cannot be changed).
While disconnected from the debug tool:
"---_---"
While connected to the debug tool:
"CPU clock frequency"
- When [Specify clock frequency] is selected:
Specify the clock frequency for timer/trace.
Directly enter the value between 1 [kHz] and 99.999 [MHz] (default: [4.00]).
Unit is depending on the specification with the [Unit of Timer/Trace clock frequency] property.
(c) [Configuration]
You can configure the customization of the simulator in this category.
Caution
Properties in this category cannot be changed when Simulator is connected to CubeSuite+.
Figure 2-54. [Configuration] Category
<1> [Use simulator configuration file]
Select whether to use the simulator configuration file to perform user customization (adding of user
models) of the simulator.
Select [Yes] to use the simulator configuration file (default: [No]).
<2> [Simulator configuration file]
This property appears only when the [Use simulator configuration file] property is set to [Yes].
Specify the simulator configuration file to use.
Directly enter the file name, or select the file with the Select Simulator Configuration File dialog box
[Simulator] opened by clicking on the [...] button that appears on the right end of the setting field.
(2) [Debug Tool Settings] tab
You configure the basic settings of the debug tool for each one of the following categories.
(a) [Memory]
(b) [Access Memory While Running]
(c) [Break]
(d) [Trace]
R20UT2867EJ0100 Rev.1.00
Feb 01, 2014
Page 48 of 572
CubeSuite+ V2.02.00
CHAPTER 2 FUNCTIONS
(e) [Timer]
(f) [Coverage]
(g) [Simulator GUI]
(a) [Memory]
You can configure the memory in this category.
Figure 2-55. [Memory] Category [Simulator]
<1> [Memory mappings]
Current memory mapping status is displayed for each type of memory area.
The memory mapping status cannot be changed on this panel. If it is necessary to add a memory
mapping, click on the [Memory Mapping] property, and click on the [...] button that appears on the right
end of the setting field. The Memory Mapping dialog box opens; perform the setting from there.
See the section for the Memory Mapping dialog box for details on how to configure the parameters.
Figure 2-56. Opening Memory Mapping Dialog Box
Caution
If you are not connected to a debug tool, then only memory mapping areas added by
user is displayed.
Connecting to a debug tool (see "2.4.1 Connect to the debug tool") will display details
for each memory type.
(b) [Access Memory While Running]
You can configure the memory access while executing a program (the real-time display update function) in this
category. See "(4) Display/modify the memory contents during program execution" for details on the real-time
display update function.
Figure 2-57. [Access Memory While Running] Category [Simulator]
R20UT2867EJ0100 Rev.1.00
Feb 01, 2014
Page 49 of 572
CubeSuite+ V2.02.00
CHAPTER 2 FUNCTIONS
<1> [Update display during the execution]
Select whether to automatically update the contents in the Memory panel/Watch panel display during a
program execution.
Select [Yes] to update the display automatically (default).
Remark
The display contents of the Memory panel/Watch panel can be updated manually by clicking
the
button on the panel.
<2> [Display update interval[ms]]
This property is valid only when the [Update display during the execution] property is set to [Yes].
Specify the interval in 100ms unit to automatically update the contents in the Memory panel/Watch panel
display while executing a program.
Directly enter the Integer number between 100 and 65500 (rounding up the fractions less than 100ms)
(default: [500]).
(c) [Break]
You can configure the break function.
See "2.8 Stop Programs (Break)" for details on the break function and this category configuration.
(d) [Trace]
You can configure the trace function in this category.
See "2.11 Collect Execution History of Programs" for details on the trace function and this category
configuration.
(e) [Timer]
You can configure the timer function in this category.
See "2.12 Measure Execution Time of Programs" for details on the timer function.
Figure 2-58. [Timer] Category [Simulator]
<1> [Use timer function]
Select whether to use the timer function.
Select [Yes] to use the timer function (default: [No]).
(f) [Coverage]
You can configure the coverage function in this category.
See "2.13 Measure Coverage [IECUBE][Simulator]" for details on the coverage function and this category
configuration.
(g) [Simulator GUI]
You can configure the Simulator GUI function in this category.
See "2.18 Use the Simulator GUI [Simulator]" for details on the Simulator GUI function and this category
configuration.
(3) [Download File Settings] tab
You can configure downloading to the debug tool.
See "2.5.1 Execute downloading" for details on each category configuration.
R20UT2867EJ0100 Rev.1.00
Feb 01, 2014
Page 50 of 572
CubeSuite+ V2.02.00
CHAPTER 2 FUNCTIONS
(4) [Hook Transaction Settings] tab
You can configure hook transaction for the debug tool.
See "2.17 Use Hook Function" for details on each category configuration and the function of the hook transaction.
R20UT2867EJ0100 Rev.1.00
Feb 01, 2014
Page 51 of 572
CubeSuite+ V2.02.00
2.4
CHAPTER 2 FUNCTIONS
Connect to/Disconnect from the Debug Tool
This section describes how to connect to/disconnect from the debug tool.
2.4.1
Connect to the debug tool
By selecting [Connect to Debug Tool] from the [Debug] menu, CubeSuite+ starts communicating with the debug tool
selected in the active project.
After succeeding in the connection to the debug tool, the Statusbar of the Main window changes as follows:
For details on each item displayed on the Statusbar, see the section of the "Main window".
Figure 2-59. Statusbar Indicating Successful Connection to Debug Tool
The information of the debug tool appears at this area.
Caution
If the version of compiler being used is not supported by CubeSuite+, [Connect to Debug Tool] will
be disabled.
Remarks 1.
When the
button on the Debug toolbar is clicked, the specified file is downloaded automatically
after connecting to the debug tool (see "2.5.1 Execute downloading").
When the
button on this toolbar is clicked, the project is built automatically, and then the built file is
downloaded after connecting to the debug tool.
2.
[Simulator]
When a microcontroller whose Simulator supports peripheral function simulations is selected, the
Simulator GUI window is automatically opened after connecting to the debug tool (default).
2.4.2
Disconnect from the debug tool
By clicking the
button on the Debug toolbar, CubeSuite+ cuts off the communication with the connected debug
tool.
After disconnecting from the debug tool, the Statusbar of the Main window changes as follows:
Figure 2-60. Statusbar Indicating Disconnection from Debug Tool
This area is left blank.
"DISCONNECT" is displayed.
Caution
The debug tool cannot be disconnected from CubeSuite+ while the program is running.
Remark
Disconnecting the debug tool will close all the panels and dialog boxes that can be displayed only during the
connection.
R20UT2867EJ0100 Rev.1.00
Feb 01, 2014
Page 52 of 572
CubeSuite+ V2.02.00
2.4.3
CHAPTER 2 FUNCTIONS
Connect to the debug tool using hot plug-in [E1][E20]
With hot plug-in function, you can connect the debug tool to the target board during execution of a program (without
having to turn off the system) and debug the program while it is in execution.
Follow the steps below to establish hot plug-in connection.
Cautions 1.
The hot plug-in connection is enabled only when the selected microcontroller incorporates the
hot plug-in function.
2.
When a hot plug-in connection is made, the settings of the following properties are ignored (i.e.
the program operates as if the specification for them is [No]). The settings of them become
valid again after reconnection with CubeSuite+.
- [Mask TARGET RESET signal]
- [Mask INTERNAL RESET signal]
- [Power target from the emulator (MAX 200mA)]
- [Erase flash ROM when starting]
3.
When a hot plug-in connection is made, events currently being set in the project are ignored.
They become valid again after reconnection with CubeSuite+.
(1) Set the number of times and interval to retry
Set the interval and number of times to retry connection when the emulator fails to communicate with the
microcontroller on the target board.
You can configure this settings in [Hot Plug-in] category on the [Connect Settings] tab of the Property panel.
Figure 2-61. [Hot Plug-in] Category
<1> [Retrying interval[ms]]
Specify an interval in 1 ms unit to retry the connection.
Directly enter the decimal number between 0 and 60000 (default: [1000]).
<2> [Number of times of retrying]
Specify the number of times to retry the connection.
Directly enter the decimal number between 0 and 3 (default: [3]).
(2) Execute the program
Execute the program which has been downloaded onto the microcontroller on the target board without connecting
to the emulator.
(3) Select the debug tool
In the active project, select the debug tool which supports hot plug-in connection (E1/ E20).
(4) Connect the debug tool to CubeSuite+ using hot plug-in
Select [Hot Plug-in] from [Debug] menu to initiate the preparation for hot plug-in connection.
(5) Connect to the target board
Following message will appear once you are ready to start hot plug-in connection. Connect the emulator to the
target system and click [OK]. This will start the communication with the debug tool which is selected in the
currently active project.
R20UT2867EJ0100 Rev.1.00
Feb 01, 2014
Page 53 of 572
CubeSuite+ V2.02.00
CHAPTER 2 FUNCTIONS
Figure 2-62. Message Indicating that Hot Plug-in Connection Is Ready to Be Started
(6) Hot plug-in connection completed
Once the connection to the debug tool is successfully completed, the Statusbar on the Main window will change as
shown below. For details on each item displayed on the statusbar, see the section of the "Main window".
Figure 2-63. Statusbar Indicating Successful Hot plug-in Connection to Debug Tool
This area shows information on the currently active debug tool.
“RUN“ indicates that the program is running.
R20UT2867EJ0100 Rev.1.00
Feb 01, 2014
Page 54 of 572
CubeSuite+ V2.02.00
2.5
CHAPTER 2 FUNCTIONS
Download/Upload Programs
This section describes how to download programs (such as load module files (*.lmf)) to debug to CubeSuite+ and how
to upload the memory contents being debugged from CubeSuite+ to files.
2.5.1
Execute downloading
Download the load module file to be debugged to the debug tool that is currently connected.
Follow the steps below on the [Download File Settings] tab in the Property panel for the downloading, and then execute
the downloading.
(1) [Download] category setting
Figure 2-64. [Download] Category
Caution
Properties displayed in this category differ depending on the debug tool used in the project.
(a) [Download files]
The names of files to be downloaded and download conditions are displayed (the number enclosed with "[ ]"
indicates the number of files to be download).
Files that are specified as build target files in the main project or subprojects will automatically be selected as
the files to be downloadedNote.
However, you can manually change the download files and the condition. In this case, see "2.5.2 Advanced
downloading".
Note To download the load module files created by an external build tool (e.g., compilers and assemblers
other than the build tools supplied with CubeSuite+), a debug-dedicated project needs to be created.
If you use a debug-dedicated project as the subject to debug, add your a download file to Download
files node on project tree. The file to be downloaded will be reflected in this property.
See "CubeSuite+ Integrated Development Environment User's Manual: Start" for details on the using
an external build tool and a debug-dedicated project.
(b) [CPU Reset after download]
Specify whether to reset the CPU after downloading.
Select [Yes] to reset the CPU (default).
Note, however, that this property does not appear if the selected microcontroller always resets the CPU after
downloading.
(c) [Download Mode] (except [Simulator])
Specify the download mode for downloading to the flash ROM.
R20UT2867EJ0100 Rev.1.00
Feb 01, 2014
Page 55 of 572
CubeSuite+ V2.02.00
CHAPTER 2 FUNCTIONS
Select one of the options from the following drop-down list.
Speed priority
Fills free space between the first data and the final data with FFH (the previous value in free
space before the first data and after the final data is retained).
Download speed will be faster because the writing data is reduced (default).
Data priority
Retains the previous value in free space.
Download speed will be very slow because data in free space are read once.
(d) [Erase flash ROM before download]
This property is valid only when the [Download Mode] (except [Simulator]) property is set to [Speed
priority](default).
Specify whether to erase the flash ROM before downloading.
Select [Yes] to erase the flash ROM (default: [No]).
(e) [Automatic change method of event setting position]
If the file is downloaded again during debugging then the location (address) set for the currently configured
event may change to midway in the instruction.
Specify with this property how to handle the target event in this circumstance.
Select one of the options from the following drop-down list.
Move to the head of instruction
Resets the subject event at the beginning address of the instruction.
Suspend event
Leaves the subject event pending (default).
Note, however, that this property setting only applies to the location setting of events without debugging
information. The location setting of events with debug information is always moved to the beginning of the
source text line.
(f) [Check reserved area overwriting when downloading] [E1][E20][EZ Emulator]
Specify whether to output a message when overwriting to an area reserved for use by the emulator is
attempted at the time of downloading.
Select [Yes] to output a message (default).
(2) [Debug Information] category setting
Figure 2-65. [Debug information] Category
(a) [Execute to the specified symbol after CPU Reset]
Specify from the drop-down list whether to execute the program to the specified symbol position after CPU
reset or downloading (for only when the [CPU Reset after download] property is set to [Yes]).
Select [Yes] to execute the program to the specified symbol position after CPU reset (default).
Remark
When the [CPU Reset after download] property is set to [Yes], the operation after downloading is
as follows:
R20UT2867EJ0100 Rev.1.00
Feb 01, 2014
Page 56 of 572
CubeSuite+ V2.02.00
CHAPTER 2 FUNCTIONS
If [Yes] is selected for this property, the Editor panel will open automatically with displaying source
text of the position specified with the [Specified symbol] property after downloading.
If [No] is selected for this property, the Editor panel will open with displaying source text of the reset
address (when if the source text has not been allocated to the reset address, the contents of the
reset address is displayed in the Disassemble panel).
(b) [Specified symbol]
This property appears only when the [Execute to the specified symbol after CPU Reset] property is set to
[Yes].
Specify the position at which the program is stop after CPU reset.
Directly enter an address expression between 0 and "last address in address space" (default: [_main]).
Note, however, that the program will not be executed if the specified address expression cannot be converted
into an address.
Remark
Normally, specify the following.
For assembler source:
Start label corresponding to main function
For C source:
Symbol assigned to the start of the main function name
(c) [Startup start symbol]
Specify the start symbol of the text area (code area) of the startup routine.
Directly enter an address expression between 0 and "last address in address space" (default: [_@cstart]).
This setting is not needed if the source is assembly language.
(d) [Startup end symbol]
Specify the end symbol of the text area (code area) of the startup routine.
Directly enter an address expression between 0 and "last address in address space" (default: [_@cend]).
This setting is not needed if the source is assembly language.
Cautions 1.
To automatically display the source text right after downloading the file, the startup symbol
must be correctly specified.
2.
By default, CPU reset automatically occurs after downloading the file, and then the program
is executed to the specified symbol position. If this operation above is not needed, specify
[No] with both of the [CPU Reset after download] and [Execute to the specified symbol after
CPU Reset] property.
(3) Execute download
Click the
button on the Debug toolbar.
If this operation is performed while disconnecting from the debug tool, the application automatically connects to the
debug tool, and then performs the download.
Remark
When a program that has been modified during debugging is re-downloaded, you can easily build and
download it by selecting [Build & Download] from the [Debug] menu on the Main window.
(4) Canceling a download
To cancel a download, click the [Cancel] button on the Progress Status dialog box, which displays the progress of
downloading, or press the [Esc] key.
If the load module file is successfully downloaded, the Editor panel opens automatically, and the contents of the
downloaded file's source text are displayed.
R20UT2867EJ0100 Rev.1.00
Feb 01, 2014
Page 57 of 572
CubeSuite+ V2.02.00
Remark
CHAPTER 2 FUNCTIONS
You can automatically overwrite the value of SFR/CPU register with the specified values before and after
performing the download (see "2.17 Use Hook Function" for details).
2.5.2
Advanced downloading
You can change the download files and the condition to download.
With CubeSuite+, the following file types can be downloaded.
Table 2-1. Type of Files That Can be Downloaded
File Type
File Format
Extension
Load module file
Load module format
.lmf
Hex file
Intel standard Hex format
.hex, .hxb, .hxf
Intel expanded Hex
formatNote
Motorola S type format
.hex, .hxb, .hxf
.hex, .hxb, .hxf
- (S0, S1, S9 - 16 bit-address)
- (S0, S2, S8 - 24 bit-address)
- (S0, S3, S7 - 32 bit-address)
Binary data file
Expanded Tektronix Hex format
.hex, .hxb, .hxf
Binary format
.bin
Note Can be up to 1 Mbyte
You can change the download files or download conditions in the following Download Files dialog box.
The Download Files dialog box is opened by clicking the [...] button that appears at the right edge in the column of the
[Download files] property when you select it in the [Download] category on the [Download File Settings] tab of the
Property panel.
Figure 2-66. Opening Download Files Dialog Box
R20UT2867EJ0100 Rev.1.00
Feb 01, 2014
Page 58 of 572
CubeSuite+ V2.02.00
CHAPTER 2 FUNCTIONS
Figure 2-67. Advanced Downloading (Download Files Dialog Box)
[Download file property] area
[Download file list] area
This section describes how to configure on the Download Files dialog box above when the following cases.
For details on the contents and function in each area, see the section for the Download Files dialog box.
Caution
You cannot download more than one load module file (*.lmf).
(1) Change download conditions for load module files
(2) Add download files (*.hex/*.hxb/*.hxf/*.bin)
(3) Perform source level debugging with files other than the load module file format
(1) Change download conditions for load module files
Follow the steps below in the Download Files dialog box to change the download conditions (object information
and symbol information) for load module files (*.lmf) to download.
(a) Select a load module file
Select a load module file to download in the [Download file list] area.
(b) Change download conditions
Current download conditions for the selected load module file are displayed in the [Download file property]
area.
Change each items displayed in the property.
Download object
Specify whether to download the object information from the specified file.
Default
Yes
Modifying
Select from the drop-down list.
Available
Yes
Downloads object information.
No
Does not download object information.
values
R20UT2867EJ0100 Rev.1.00
Feb 01, 2014
Page 59 of 572
CubeSuite+ V2.02.00
Download symbol
information
CHAPTER 2 FUNCTIONS
Specify whether to download the symbol information from the specified fileNote 1.
Default
Yes
Modifying
Select from the drop-down list.
Available
Yes
Downloads symbol information.
No
Does not download symbol information.
values
Generate the
Select whether to generate the information for the Symbol name completion function when
information for
downloadingNote 2.
input completion
Default
Yes
Modifying
Select from the drop-down list.
Available
Yes
values
Generates the information for the symbol name completion
function. (i.e. uses the symbol name completion function.)
No
Does not generate the information for the symbol name
completion function. (i.e. does not use the symbol name
completion function.)
Notes 1.
If the symbol information have not been downloaded, the source level debugging cannot be
performed.
2.
When [Yes] is selected, the time taken for downloading and the memory usage on the host
machine will increase. We recommend selecting [No] in this item if you do not intend to use the
symbol name completion function.
(c) Click the [OK] button
Enable all the configuration in this dialog box and change the download conditions.
(2) Add download files (*.hex/*.hxb/*.hxf/*.bin)
Follow the steps below to add download files other than the load module format (hex files (*.hex/*.hxb/*.hxf) or
binary data files (*.bin)) in the Download Files dialog box.
Caution
You cannot download more than one load module file (*.lmf).
(a) Click the [Add] button
When the [Add] button is clicked, a blank list item "-" is displayed in the last line of the [Download file list] area.
(b) Property configuration of the download files to add
Configure the download conditions for the download file to add in the [Download file property] area.
Configure each item displayed with the following condition.
When the configuration is completed, the file name specified in this property is displayed in the blank list of the
[Download file list] area.
File
Specify the download file (in hex format (*.hex/*.hxb/*.hxf/in binary format (*.bin)) to download
(up to 259 characters).
Default
Blank
Modifying
Directly enter from the keyboard, or specify with the Select Download File
dialog box opened by clicking the [...] button.
Available
See "Table 2-1. Type of Files That Can be Downloaded".
values
R20UT2867EJ0100 Rev.1.00
Feb 01, 2014
Page 60 of 572
CubeSuite+ V2.02.00
File type
CHAPTER 2 FUNCTIONS
Specify the type of the file to download.
Select [Hex file] or [Binary data file].
Default
Load module file
Modifying
Select from the drop-down list.
Available
Either one of the following
values
- Load module file
- Hex file
- Binary data file
Offset
Specify the offset from the address at which the file's download is to start.
Note that this item appears only when [File type] is set to [Hex file].
Default
0
Modifying
Directly enter from the keyboard.
Available
0x0 to 0xFFFFFFFF in hexadecimal number
values
Start address
Specify the address at which to start the file's download.
Note that this item appears only when [File type] is set to [Binary data file].
Default
0
Modifying
Directly enter from the keyboard.
Available
0x0 to 0xFFFFFFFF in hexadecimal number
values
Remark
The settings of whether to download the object information or symbol information can be made only
when the type of the file to download is load module files.
(c) Check the order of download
The order of the download is the display order of the files displayed in the [Download file list] area.
If you want to change the order, use the [Up]/[Down] button.
(d) Click the [OK] button
Enable all the configuration in this dialog box and add a download file (the file name is displayed in the
[Download] category on the [Download File Settings] tab of the Property panel).
(3) Perform source level debugging with files other than the load module file format
Even when a hex file (*.hex/*.hxb/*.hxf) or a binary data file (*.bin) is specified to be the subject file to download, it
is possible to do source level debugging by downloading symbol information for the load module file from which the
subject file was created, along with the subject file that you download.
To do so, follow the steps below on the Download Files dialog box.
(a) Click the [Add] button
When the [Add] button is clicked, a blank list item "-" is displayed in the last line of the [Download file list] area.
(b) Property configuration of the load module file to add
Configure each item displayed with the following condition in the [Download file property] area.
R20UT2867EJ0100 Rev.1.00
Feb 01, 2014
Page 61 of 572
CubeSuite+ V2.02.00
CHAPTER 2 FUNCTIONS
File
Specify a load module file from which the hex file (*.hex/*.hxb/*.hxf) or binary data file (*.bin)
that you want to download was created.
Directly enter from the keyboard, or specify with the Select Download File dialog box opened
by clicking the [...] button that appears at right by selecting this property.
File type
Select [Load module file] (default).
Download object
Specify [No].
Download symbol
Select [Yes] (default).
information
Generate the
Select whether to generate the information for the Symbol name completion function when
information for
downloadingNote.
input completion
Default
Yes
Modifying
Select from the drop-down list.
Available
Yes
values
Generates the information for the symbol name completion
function. (i.e. uses the symbol name completion function.)
No
Does not generate the information for the symbol name
completion function. (i.e. does not use the symbol name
completion function.)
Note When [Yes] is selected, the time taken for downloading and the memory usage on the host machine will
increase. We recommend selecting [No] in this item if you do not intend to use the symbol name
completion function.
(c) Click the [OK] button
Enable all the configuration in this dialog box and add the specified load module file (Only the symbol
information included in the load module file will be downloaded).
2.5.3
Execute uploading
The contents of the memory of the debug tool currently connected can be saved (uploaded) in an arbitrary file.
You can upload the data in the Data Save dialog box that is opened by selecting the [Debug] menu >> [Upload...].
In this dialog box, follow the steps below.
Figure 2-68. Execute Uploading (Data Save Dialog Box)
(1) Specify [File Name]
Specify the name of the file to save.
R20UT2867EJ0100 Rev.1.00
Feb 01, 2014
Page 62 of 572
CubeSuite+ V2.02.00
CHAPTER 2 FUNCTIONS
You can either type a filename directly into the text box (up to 259 characters), or select one from the input history
via the drop-down list (up to 10 items). You can also specify the file by clicking the [...] button, and selecting a file
via the Select Data Save File dialog box.
(2) Specify [File Type]
Select the format in which to save the file from the following drop-down list.
The following file formats can be selected.
Table 2-2. Type of Files That Can be Uploaded
Displayed List Items
File Format
Intel Hex format (Extension) (*.hex)
Intel expanded Hex format
Intel Hex format (Flash Programmer) (*.hex)Note
Intel expanded Hex format
[IECUBE][E1][E20]
(for flash programmer)
Motorola Hex format (S0, S2, S8 - 24bit-address) (*.hex)
Motorola S type format
Motorola Hex format (S0, S2, S8 - 24bit-address) (Flash Programmer) (*.hex) Note
Motorola S type format
[IECUBE][E1][E20]
(for flash programmer)
Extended Tektronix Hex format (*.hex)
Expanded Tektronix Hex format
Binary data (*.bin)
Binary format
Note [IECUBE][E1][E20]
This item is displayed only when the selected microcontroller incorporates the data flash memory.
(3) Specify [Save Range Address/Symbol]
Specify the range of addresses to save via "start address" and "end addresses".
Directly enter hexadecimal number/address expression in each text box or select from the input history displayed
in the drop-down list (up to 10 items).
Remark
A symbol name at the current caret position can be complemented by pressing the [Ctrl] + [Space] key
in each text box (see "2.19.2 Symbol name completion function").
(4) Click the [Save] button
Save the contents of the memory in the specified file in specified format as upload data.
R20UT2867EJ0100 Rev.1.00
Feb 01, 2014
Page 63 of 572
CubeSuite+ V2.02.00
2.6
CHAPTER 2 FUNCTIONS
Display/Change Programs
This section describes how to display and change programs when a load module file with the debug information is
downloaded to a debug tool.
Downloaded programs can be displayed in the following panels.
- Editor panel
The source file is displayed and can be edited.
Furthermore, the source level debugging/instruction level debugging (see "2.7.3 Execute programs in steps") and
the display of the code coverage measurement result (see "2.13.2 Display the coverage measurement result")
can be performed in this panel.
- Disassemble panel
The result of disassembling the downloaded program (the memory contents) is displayed and can be edited (line
assemble).
Furthermore, the instruction level debugging (see "2.7.3 Execute programs in steps") and the display of the code
coverage measurement result (see "2.13.2 Display the coverage measurement result") can be performed in this
panel. In this panel, the disassemble results can be displayed with the corresponding source text (default).
Remark
It is normally necessary to download a load module file (*.lmf) with debugging information in order to
perform the source level debugging, but it is also possible to do so by downloading a hex format (*.hex/
*.hxb/*.hxf) or binary format (*.bin) file (see "(3) Perform source level debugging with files other than the
load module file format").
2.6.1
Display source files
The source file is displayed in the Editor panel below. The Editor panel automatically opens with displaying source text
of the specified position (see "2.5.1 Execute downloading") when a load module file (*.lmf) is successfully downloaded.
If you want to open the Editor panel manually, double-click on the source file in the Project Tree panel.
For details on the contents and function in each area, see the section for the Editor panel.
Figure 2-69. Display Source File (Editor Panel)
Toolbar
(1)
(4)
(2) (3)
(5)
(6) (7)
(1) : Line number area
(2) : Selection area
(3) : Out of date module Indicator area
(4) : Coverage area
R20UT2867EJ0100 Rev.1.00
Feb 01, 2014
(8)
(5) : Address area
(6) : Event area
(7) : Main area
(8) : Characters area
Page 64 of 572
CubeSuite+ V2.02.00
Cautions 1.
CHAPTER 2 FUNCTIONS
When a project is closed, all of the Editor panels displaying a file being registered in the project
are closed.
2.
Remarks 1.
When a file is excluded from a project, the Editor panel displaying the file is closed.
You can open a file with a specific encoding selected in the Encoding dialog box that is opened by
selecting the [File] menu >> [Open with encoding...].
2.
When a file whose size is greater than 24MB is opened, a message dialog box is shown for
confirmation of whether or not to disable all of the functions listed below (if you select [No] in this
message dialog box, the operation speed may become sluggish).
- Syntax (reserved words, comments, etc.) coloring
- Code outlining
This section describes the following.
(1) Change display mode
(2) Set the columns to display
(3) Display multiple source files in a single panel
(4) Display variables
(5) Search characters
(6) Move to the specified line
(7) Jump to functions
(8) Jump to a desired line (tag jump)
(9) Register a bookmark
(1) Change display mode
You can change the display mode of the Editor panel by clicking the
button (toggle) on the toolbar.
- Normal display mode
In this display mode (default), the line number, address and source text, etc. are displayed.
Figure 2-70. Normal Display Mode (Editor Panel)
Address
Source text
Line number
- Mixed display mode
In this display mode, the code data, label and disassembled text are displayed combined with the source text.
Figure 2-71. Mixed Display Mode (Editor Panel)
Source text
Address
Label
Line number
R20UT2867EJ0100 Rev.1.00
Feb 01, 2014
Code
Disassembled text
Page 65 of 572
CubeSuite+ V2.02.00
Cautions 1.
CHAPTER 2 FUNCTIONS
The mixed display mode is enabled only when connected to the debug tool and the
downloaded source file is opened in this panel.
2.
In the mixed display mode, the source text and the corresponding code information that
were acquired from the downloaded load module file are displayed. Therefore, to display
the source text that has been modified in the mixed display mode, you need to run a rebuild
and download it.
3.
In the mixed display mode, the source files cannot be edited. In addition, [Redo]/[Cut]/
[Paste]/[Delete]/[Select All]/[Replace...]/[Bookmark]/[Outlining]/[Advanced] from the [Edit]
menu are disabled.
Remark
You can save the contents of the current mixed display to a file in the text or CSV format by selecting
[Save Source Mixed Data As...] from the [File] menu (the contents of hidden columns cannot be saved).
(2) Set the columns to display
The columns and marks displayed on the Editor panel can be set by selecting the toolbar items shown below.
Note that this setting applies to all of the Editor panels.
Columns
The following items are displayed to show or hide the columns or marks on all of the Editor panels.
Remove the check to hide the items (all the items are checked by default).
Line Number
Shows the line number, in the line number area.
Selection
Shows the mark that indicates the line modification status, in the line number area.
Out of date module
Shows the mark that indicates the update status of the downloaded load module file, in the line
indicator
number area.
Note that this item is enabled only when connected to the debug tool.
Coverage
Shows the coverage area.
Note that this item is enabled only when connected to the debug tool.
Address
Shows the address area.
Note that this item is enabled only when connected to the debug tool.
Op Code
Shows the code area.
Note that this item is enabled only when connected to the debug tool and the mixed display mode
is selected.
Label
Shows the label area.
Note that this item is enabled only when connected to the debug tool and the mixed display mode
is selected.
Event
Shows the event area.
Note that this item is enabled only when connected to the debug tool.
Main
Shows the main area.
Column Header
Shows the column header.
(3) Display multiple source files in a single panel
If the current PC moves between multiple source files when debugging (e.g. when performing step execution),
each of the source files will be opened in a separate editor panel. If this is the case, the recycle mode lets you
display multiple source files in a single Editor panel.
Select the [Use window recycling] check box on the [General - Text Editor] category in the Option dialog box to
enable this feature.
R20UT2867EJ0100 Rev.1.00
Feb 01, 2014
Page 66 of 572
CubeSuite+ V2.02.00
CHAPTER 2 FUNCTIONS
Figure 2-72. Normal Operation
Execute
A new panel is opened.
Figure 2-73. Recycle Mode Operation
"[RECYCLE]" is displayed following the file name.
Execute
The source file is displayed in the same panel.
Cautions 1.
The recycle mode is enabled only when connected to the debug tool and the downloaded
source file is opened in this panel.
2.
When the current PC value in program execution corresponds to a line in the Editor panel
while editing is being conducted in the recycle mode, that Editor panel is released from the
recycle mode, and a new Editor panel is opened in the recycle mode.
R20UT2867EJ0100 Rev.1.00
Feb 01, 2014
Page 67 of 572
CubeSuite+ V2.02.00
Remark
CHAPTER 2 FUNCTIONS
If the Editor panel that displays the corresponding source file is already opened, then the source file is
not opened in the panel of the recycle mode, but the Editor panel being opened is displayed.
(4) Display variables
When hovering the mouse cursor over a variable in the source text, a pop-up that shows the name and value of the
variable is displayed ("<variable name>=<variable value>").
The display format of the variable value is same as "Table A-9. Display Format of Watch-Expressions (Default)"
depending on the type of the variable.
Figure 2-74. Pop-up Display of Variables (Editor Panel)
Mouse cursor
Caution
A pop-up display is enabled only when connected to the debug tool and the downloaded source
file is opened in this panel.
(5) Search characters
Character searching in the source text is taken place in the Find and Replace dialog box opens with selecting the
button on the toolbar.
In this dialog box, follow the steps below.
Figure 2-75. Character Search in Source Text (Find and Replace Dialog Box)
(a) Specify [Search text]
Enter characters to search.
A word (variable/function) at the caret position in the Editor panel is specified by default.
If you want to change it, directly enter the characters into the text box (up to 1024 characters) or select from
the input history in the drop-down list (up to 10 items).
(b) Specify [Search location]
Select [Current document (file name)] from the drop-down list.
(c) Click the [Find Previous]/[Find Next] button
When the [Find Previous] button is clicked, search will start in the order from the large address number to
small and the search results are displayed selected in the Editor panel.
When the [Find Next] button is clicked, search will start in the order from the small address number to large
and the search results are displayed selected in the Editor panel.
R20UT2867EJ0100 Rev.1.00
Feb 01, 2014
Page 68 of 572
CubeSuite+ V2.02.00
Remarks 1.
CHAPTER 2 FUNCTIONS
Click the [Option] button to specify to use wild card, case sensitivity, word by word search, and so
on.
2.
In the Find and Replace dialog box, various search/replace operation can be performed by
selecting [Find in Files], [Quick Replace] or [Replace in Files] tab.
(6) Move to the specified line
You can move to the specified line in the source text in the Go to Line dialog box which opens when selecting [Go
to...] from the context menu.
In this dialog box, follow the steps below.
Figure 2-76. Move to Specified Line in Source Text (Go to Line Dialog Box)
(a) Specify [Line number (valid line range)]
Directly enter the line number (decimal number), symbol nameNote 1 or addressNote 2 to which you want to move
the caret.
"(valid line range)" shows the range of valid lines in the current file.
By default, the number of the line where the caret is currently located in the Editor panel is displayed.
Notes 1.
Note the following, when specifying a symbol name:
- Only a function name can be specified as a symbol name.
- Run and complete a build.
- If an error in building occurs, the information before the error occurred is used.
2.
Note the following, when specifying an address:
- Only a hexadecimal value with prefix "0x" or "0X" can be specified (a decimal value is treated as
a line number).
- Run and complete a build.
- If an error in building occurs, the information before the error occurred is used.
(b) Click the [OK] button
Caret is moved to the specified line.
(7) Jump to functions
It automatically recognizes the currently selected characters or the word at the caret position as the function name
and jumps to the first executable line of the target function.
Select [Jump to Function] from the context menu after moving the caret to the target function on the source text.
Caution
When multiple statements are described in a line, a jump to an illegal location may be made.
R20UT2867EJ0100 Rev.1.00
Feb 01, 2014
Page 69 of 572
CubeSuite+ V2.02.00
CHAPTER 2 FUNCTIONS
Figure 2-77. Jump to Functions
Note that this function is available only when the following conditions are satisfied for each specific build tool.
(a) When CA78K0R is used
- The target function resides in an active project.
- The type of the project specified as the active project is "Application".
- A file with the symbol information is selected for the [Download files] property. In case it is disconnected
from the debug tool, the above file is specified as the first file in the [Download files] property (when the file
is in the hex format, the setting for downloading the symbol information is required (see "(3) Perform
source level debugging with files other than the load module file format")).
Caution
A jump to a static function cannot be made when disconnected from the debug tool.
(b) When an external build tool is used
- The target function resides in an active project.
- A file with the symbol information is selected for the [Download files] property (when the file is in the
format other than the load module file, the setting for downloading the symbol information is required (see
"(3) Perform source level debugging with files other than the load module file format")). In case it is
disconnected from the debug tool, the file above is specified as the first file in the [Download files]
property.
Caution
Remark
A jump to a static function cannot be made when disconnected from the debug tool.
The judgement of words will depend on the build tool being used.
(8) Jump to a desired line (tag jump)
If the information of a file name, a line number and a column number exist in the line at the caret position, you can
open the file in another Editor panel and jump to the corresponding line and the corresponding column (if the Editor
panel is already open, you can jump to the panel).
Select [Tag Jump] from the context menu after moving the caret to the line on the source text.
R20UT2867EJ0100 Rev.1.00
Feb 01, 2014
Page 70 of 572
CubeSuite+ V2.02.00
CHAPTER 2 FUNCTIONS
The tag jump is operated as follows:
Table 2-3. Operation of Tag Jump
Example of Character String
Operation
C:\work\src.c
Jumps to the top line of the file "C:\work\src.c".
Tmp\src.c
Jumps to the top line of the file "Tmp\src.c".
(The reference point of the path is the project folder.)
C:\work\src.c(10)
C:\"work sub\src.c"(10)
Jumps to the tenth line from the top of the file "C:\work\src.c".
Jumps to the tenth line from the top of the file "C:\"work sub\src.c"".
(Path specification (path/file name) including space characters must be enclosed in
"".)
C:\work\src.c(10,5)
Jumps to the fifth column of the tenth line from the top of the file "C:\work\src.c".
Figure 2-78. Tag Jump
Remarks 1.
2.
Jumps are case-insensitive.
The reference point of the path is the project folder in which the file is registered. If the file is not
registered in any project, the reference point of the path will be the active folder.
3.
Path specifications (path/file names) including space characters must be enclosed in "".
(9) Register a bookmark
You can register a bookmark to the line at the current caret position by clicking the
toolbar. Once a bookmark is registered, the bookmark (
button on the bookmark
) is displayed in the [Main] area.
When this operation is performed at a place where a bookmark is already being registered, that bookmark is
deleted. Up to 50 bookmarks can be registered in one Editor panel.
Cautions 1.
2.
When the Mixed display mode is selected, bookmarks cannot be registered nor displayed.
After a line with a bookmark is deleted, the bookmark cannot be restored even if the [Edit]
menu >> [Undo] is selected.
R20UT2867EJ0100 Rev.1.00
Feb 01, 2014
Page 71 of 572
CubeSuite+ V2.02.00
CHAPTER 2 FUNCTIONS
Figure 2-79. Register Bookmark
Remarks 1.
The bookmark information is saved in the currently open project file and restored when that project
is re-opened. Therefore, if bookmarks are set in a file that does not belong to the project, those
bookmarks will not be restored.
2.
Clicking on the
and
buttons on the bookmark toolbar moves the caret to the previous
and next bookmarks, respectively. Note that the bookmarks are listed in the order of their
registration (not in the order of line numbers).
3.
Bookmarks currently being registered are listed on the Bookmarks dialog box that is opened by
clicking the
2.6.2
button on the bookmark toolbar.
Display the result of disassembling
The result of disassembling the downloaded program (disassembled text) is displayed in the Disassemble panel below.
Select [View] menu >> [Disassemble] >> [Disassemble1 - 4].
The maximum of 4 Disassemble panels can be opened. Each panel is identified by the names "Disassemble1",
"Disassemble2", "Disassemble3" and "Disassemble4" on the titlebar.
For details on the contents and function in each area, see the section for the Disassemble panel.
Figure 2-80. Display Result of Disassembling (Disassemble Panel)
Toolbar
Event area
Remark
Address area
Disassemble area
You can set the scroll range of the vertical scroll bar on this panel via the Scroll Range Settings dialog box
which is opened by clicking the
button from [View] on the toolbar.
This section describes the following.
(1) Change display mode
R20UT2867EJ0100 Rev.1.00
Feb 01, 2014
Page 72 of 572
CubeSuite+ V2.02.00
CHAPTER 2 FUNCTIONS
(2) Change display format
(3) Move to the specified address
(4) Move to the symbol defined location
(5) Save the disassembled text contents
(1) Change display mode
The result of disassembling is displayed in the mixed display mode (both the disassembled text and the source text) by
default.
When you click the
button (toggle function) on the toolbar, the source text is displayed or hidden.
Figure 2-81. Display Example of Source Text Hidden
(2) Change display format
The display format of the disassemble area can be changed using buttons below on the toolbar.
View
The following buttons to change the display format are displayed.
Displays the offset value of the label. The offset value from the nearest label is displayed when a label
is defined for the address.
Displays the address value as the result of disassembling in the format "symbol + offset value"
(default).
Note that when a symbol has been defined as the address value, only the symbol is displayed.
Displays the name of the register by its function name (default).
Displays the name of the register by its absolute name.
(3) Move to the specified address
You can move to the specified address in the disassembled text in the Go to the Location dialog box which opens
when selecting [Go to...] from the context menu.
In this dialog box, follow the steps below.
R20UT2867EJ0100 Rev.1.00
Feb 01, 2014
Page 73 of 572
CubeSuite+ V2.02.00
CHAPTER 2 FUNCTIONS
Figure 2-82. Move to Specified Address in Disassembled Text (Go to the Location Dialog Box)
(a) Specify [Address/Symbol]
Specify the address you want to move the caret to.
You can either type an address expression directly into the text box (up to 1024 characters), or select them
from the input history via the drop-down list (up to 10 items).
Remark
A symbol name at the current caret position can be complemented by pressing the [Ctrl] + [Space]
key in this text box (see "2.19.2 Symbol name completion function").
(b) Click the [OK] button
Caret is moved to the specified address.
(4) Move to the symbol defined location
You can move the caret to the address where the symbol is defined.
Click the
button on the toolbar after moving the caret to the instruction which refers to the symbol.
Furthermore, click the
button on the toolbar following the previous operation returns the caret to the
instruction which refers to the symbol at previous caret is defined.
(5) Save the disassembled text contents
Contents of the disassembled text can be saved in text files (*.txt)/CSV files (*.csv).
When saving to the file, the latest information is acquired from the debug tool, and it is saved in accordance with
the display format on this panel.
The Data Save dialog box can be opened by selecting the [File] menu >> [Save Disassemble Data As...] (when this
operation takes place with the range selected on the panel, the disassembled data can be saved only for the
selected range).
In this dialog box, follow the steps below.
Figure 2-83. Save Disassembled Text Contents (Data Save Dialog Box)
R20UT2867EJ0100 Rev.1.00
Feb 01, 2014
Page 74 of 572
CubeSuite+ V2.02.00
CHAPTER 2 FUNCTIONS
(a) Specify [File Name]
Specify the name of the file to save.
You can either type a filename directly into the text box (up to 259 characters), or select one from the input
history via the drop-down list (up to 10 items).
You can also specify the file by clicking the [...] button, and selecting a file via the Select Data Save File dialog
box.
(b) Specify [File Type]
Select the format in which to save the file from the following drop-down list.
The following file formats can be selected.
List Item
Format
Text files (*.txt)
Text format (default)
CSV (Comma-Separated Variables)(*.csv)
CSV formatNote
Note The data is saved with entries separated by commas (,).
If the data contains commas, each entry is surrounded by double quotes "" in order to avoid illegal
formatting.
(c) Specify [Save Range Address/Symbol]
Specify the range of addresses to save via "start address" and "end addresses".
Directly enter hexadecimal number/address expression in each text box or select from the input history
displayed in the drop-down list (up to 10 items).
If a range is selected in the panel, that range is specified as the default. If there is no selection, then the range
currently visible in the panel is specified.
Remark
A symbol name at the current caret position can be complemented by pressing the [Ctrl] + [Space]
key in each text box (see "2.19.2 Symbol name completion function").
(d) Click the [Save] button
Disassembling data is saved in the specified file with the specified format.
Figure 2-84. Output Example of Disassembling Data
-------------------------------------------------------Label (symbol name)
:
Label (symbol) line
File name
:
Line number
:
C language source text
:
Source text line
Address Offset
:
:
Code
:
Result of Disassembling
:
Disassembling line
Remarks 1.
When the contents of the panel are overwritten and saved by selecting the [File] menu >>[Save
Disassemble Data], the Disassemble panels (Disassemble1-4) are handled individually for these
respectively. In addition, saving range is same as the previously specified address range.
2.
2.6.3
You can print the current screen image of this panel by selecting the [File] menu >> [Print...].
Run a build in parallel with other operations
CubeSuite+ can automatically start a build when one of the following events occurs (rapid build function).
R20UT2867EJ0100 Rev.1.00
Feb 01, 2014
Page 75 of 572
CubeSuite+ V2.02.00
CHAPTER 2 FUNCTIONS
- For other than the debug-only project
- When any one of the following files that are added to the project is updated:
(C source file, assembler source file, header file, link directive file, symbol information file, object module file,
and library file)
- When a build target file has been added to or removed from the project
- When the link order of object module files and library files is changed
- When the property of the build tool or the build target file is changed
- For the debug-only project
- When you have edited and saved the C source file, assembler source file and header file that are added to the
debug-dedicated project
- When a C source file, assembler source file, or header file has been added to or removed from the debugdedicated project
- When the property of the debug-dedicated project is changed
If a rapid build is enabled, it is possible to perform a build in parallel with the above operations.
To enable/disable a rapid build, select [Rapid Build] from the [Build] menu. A rapid build is enabled by default.
Caution
When an external text editor is used, check the [Observe registered files changing] check box on
the [General - Build/Debug] category in the Option dialog box to enable this function.
Remarks 1.
2.6.4
After editing source files, it is recommend to save frequently by pressing the [Ctrl] + [S] key.
2.
Enable/Disable setting of the rapid build applies to the entire project (main project and subprojects).
3.
If you disable a rapid build while it is running, it will be stopped at that time.
Perform line assembly
Instructions and code displayed in the Disassemble panel can be edited (line assembly).
This section describes the following.
(1) Edit instructions
(2) Edit code
(1) Edit instructions
Follow the steps below to edit instructions.
(a) Switch to edit mode
Double-click the instruction to edit or select [Edit Disassemble] from the context menu after moving the caret to the
instruction to edit.
(b) Edit instructions
Use keyboard to directly edit the instructions.
(c) Write to memory
Press the [Enter] key to line assemble the edited instructions after editing. The code is automatically written to
the memory.
If the edited instruction is invalid, the instruction is shown in red and will not be written to the memory.
If there is a space because of overwriting the displayed result of disassembling by another instruction, its byte
number is automatically compensated with NOP instruction as follows:
R20UT2867EJ0100 Rev.1.00
Feb 01, 2014
Page 76 of 572
CubeSuite+ V2.02.00
Examples 1.
CHAPTER 2 FUNCTIONS
MOVW instruction (4-byte instruction) in the second line is overwritten by DEC instruction (1-byte
instruction).
Before editing
After editing
2.
0461CF
ADDW AX,#0CF61H
CBF820FE
MOVW SP,#0FE20H
FC8E1800
CALL
53C0
MOV
0461CF
ADDW AX,#0CF61H
93
DEC
00
NOP
00
NOP
00
NOP
FC8E1800
CALL
53C0
MOV
!!_funcA
B, #0C0H
B
!!_funcA
B, #0C0H
ADDW instruction (3-byte instruction) in the first line is overwritten by MOVW instruction (4-byte
instruction).
Before editing
After editing
0461CF
ADDW AX,#0CF61H
CBF820FE
MOVW SP,#0FE20H
FC8E1800
CALL
53C0
MOV
CBF820FE
MOVW SP, #0FE20H
00
NOP
00
NOP
00
NOP
FC8E1800
CALL
53C0
MOV
!!_funcA
B, #0C0H
!!_funcA
B, #0C0H
(2) Edit code
Follow the steps below to edit code.
(a) Switch to edit mode
Double-click the code to edit or select [Edit Code] from the context menu after moving the caret to the code to
edit.
(b) Edit code
Use keyboard to directly edit the code.
(c) Write to memory
Press the [Enter] key to write the code to the memory after editing.
If the edited instruction is invalid, the instruction is shown in red and will not be written to the memory.
When the code is written to the memory, the result of disassembling is also updated.
R20UT2867EJ0100 Rev.1.00
Feb 01, 2014
Page 77 of 572
CubeSuite+ V2.02.00
2.7
CHAPTER 2 FUNCTIONS
Execute Programs
This section describes how to execute programs.
Main operations in this section are taken place from the debug toolbar or the [Debug] menu in the Main window, where
commands to control the execution of programs are included.
Caution
Items of the debug toolbar and the [Debug] menu are valid only while connected to the debug tool.
Figure 2-85. Debug Toolbar
Figure 2-86. [Debug] Menu
2.7.1
Reset microcontroller (CPU)
To reset CPU, click the
button on the debug toolbar.
When CPU is reset, the current PC value is set to the reset address.
Remark
You can automatically overwrite the value of SFR/CPU register with the specified values after CPU reset
under breaking (see "2.17 Use Hook Function" for details).
2.7.2
Execute programs
The following types of CubeSuite+ execution functions are provided.
Select any of the following operations according to the purpose of debugging.
See "2.8 Stop Programs (Break)" for details on how to stop the program in execution.
R20UT2867EJ0100 Rev.1.00
Feb 01, 2014
Page 78 of 572
CubeSuite+ V2.02.00
CHAPTER 2 FUNCTIONS
(1) Execute after resetting microcontroller (CPU)
(2) Execute from the current address
(3) Execute after changing PC value
Remark
You can automatically overwrite the value of SFR/CPU register with the specified values before starting
program execution (see "2.17 Use Hook Function" for details).
(1) Execute after resetting microcontroller (CPU)
Click the
button on the debug toolbar.
Reset CPU and start execution of the program from the reset address.
When this operation is performed, the program continues to be executed until either of the following occurs:
- The
button has been clicked (see "2.8.2 Stop the program manually").
- The PC has reached a breakpoint (see "2.8.3 Stop the program at the arbitrary position (breakpoint)").
- A break event condition has been met (see "2.8.4 Stop the program at the arbitrary position (break event)" or
"2.8.5 Stop the program with the access to variables/SFRs").
- A fail-safe break has occurred (see "2.8.6 Stop the program when an invalid execution is detected
[IECUBE]").
- Other break causes have occurred.
Remark
This operation is the same as when the
button is clicked after clicking the
button.
(2) Execute from the current address
Perform any of the following operations to start executing the program from the address at the current PC value.
(a) Normal execution
Click the
button on the debug toolbar.
When this operation is performed, the program continues to be executed until either of the following occurs:
- The
button has been clicked (see "2.8.2 Stop the program manually").
- The PC has reached a breakpoint (see "2.8.3 Stop the program at the arbitrary position (breakpoint)").
- A break event condition has been met (see "2.8.4 Stop the program at the arbitrary position (break
event)" or "2.8.5 Stop the program with the access to variables/SFRs").
- A fail-safe break has occurred (see "2.8.6 Stop the program when an invalid execution is detected
[IECUBE]").
- Other break causes have occurred.
(b) Execution ignoring break-related events
Click the
button on the debug toolbar.
When this operation is performed, the program continues to be executed until either of the following occurs:
- The
button has been clicked (see "2.8.2 Stop the program manually").
- A fail-safe break has occurred (see "2.8.6 Stop the program when an invalid execution is detected
[IECUBE]").
- Other break causes have occurred.
Remark
If you have started the execution with this operation, the occurrence of Action event will also be
ignored.
R20UT2867EJ0100 Rev.1.00
Feb 01, 2014
Page 79 of 572
CubeSuite+ V2.02.00
CHAPTER 2 FUNCTIONS
(c) Execution to the caret position
To start this operation, move the caret to the line/instruction to stop the program in the Editor panel/
Disassemble panel, then select [Go to Here] from the context menu.
When this operation is performed, the program continues to be executed until either of the following occurs:
- The PC has reached the address of the caret position.
- The
button has been clicked (see "2.8.2 Stop the program manually").
- A fail-safe break has occurred (see "2.8.6 Stop the program when an invalid execution is detected
[IECUBE]").
- Other break causes have occurred.
Caution
When the corresponding address of the line at the caret position does not exist, the
program is executed to the corresponding address of the lower valid line (if the
corresponding address does not exist, an error message will appear).
Remark
If you have started the execution with this operation, the occurrence of Action event will also be
ignored.
(3) Execute after changing PC value
The program is executed after forcibly changing the current PC value to an arbitrary address.
To start this operation, move the caret to the line/instruction to start the program in the Editor panel/Disassemble
panel, then select [Set PC to Here] from the context menu (the current PC value is set to the address of the line/
instruction where the caret currently exists).
Then execute either one of the execution method described in "(2) Execute from the current address".
2.7.3
Execute programs in steps
When either of the following operation has occurred, the program will stop automatically after conducting step
execution in the source level (1 line of source text) or in the instruction level (1 instruction).
Once the program is stopped, the contents of each panel will be updated automatically. As such, step execution is
suited for debugging the program execution in transition either in source or instruction level.
The unit in which the program is step-executed depends on the setting of the Editor panel as follows:
- When the
button on the toolbar is invalid (default):
Step execution is conducted in source level.
Note, however, that when the focus is in the Disassemble panel or the line information does not exist in the
address specified by the current PC value, the step execution is conducted in instruction level.
- When the
button on the toolbar is valid:
Step execution is conducted in instruction level.
Remark
The
button is only enabled if the mixed display mode is selected on the Editor panel (see "(1) Change
display mode").
Step execution is divided into the following types:
(1) Step in function (Step in execution)
(2) Step over function (Step over execution)
(3) Execute until return is completed (Return out execution)
R20UT2867EJ0100 Rev.1.00
Feb 01, 2014
Page 80 of 572
CubeSuite+ V2.02.00
Cautions 1.
CHAPTER 2 FUNCTIONS
Breakpoints, break events, and action events that have been set do not occur during step
execution.
2.
An error message will appear while processing a function prologue or epilogue if the return
address cannot be acquired.
3.
If an instruction to move to standby mode (HALT/STOP) is executed during step execution, the
program will break at the next instruction after the standby mode instruction.
This behavior differs depending on the debug tool used.
- For other than [Simulator]
It will not go into standby mode during step execution.
- [Simulator]
It will go into standby mode during step execution.
It will appear that standby mode has been released. Check the CPU status on the Main
window's statusbar to see if standby mode has been released.
4.
For other than [Simulator]
- Interrupts are not acknowledged and fail-safe breaks [IECUBE] do not occur during step
execution.
- It will not go into standby mode during step execution.
- If step execution is performed in source level, CubeSuite+ determines whether an interrupt is
being processed via the NP, EP, and ID flags in the PSW register. For this reason, if the
above register or flags are changed (e.g. when using multiple interrupts), then Return out
execution may be incorrect.
5.
[Simulator]
You may jump to an interrupt handler during step execution.
(1) Step in function (Step in execution)
When the function is called, the program is stopped at the top of the called function.
Click the
button on the debug toolbar to perform Step in execution.
Cautions 1.
2.
Step in execution for a function without the debug information is not possible.
If Step in execution is performed for the longjmp function, program execution may not
complete and may wait for a time-out.
3.
The beginning of the function (prologue processing) is not skipped. To skip prologue
processing, perform Step in execution again.
(2) Step over function (Step over execution)
In the case of a function call by the CALL/CALLT/CALLF instruction, all the source lines/instructions in the function
are treated as one step and executed until the position where execution returns from the function (step execution
will continue until the same nest is formed as when the CALL /CALLT/CALLF instruction has been executed).
Click the
button on the debug toolbar to perform Step over execution.
In the case of an instruction other than CALL/CALLT/CALLF, operation is the same as when the
button is
clicked.
Caution
If Step over execution is performed for the longjmp function, program execution may not
complete and may wait for a time-out.
(3) Execute until return is completed (Return out execution)
Step-execute the program so that the program will stop when it returns from the current function to the caller
function. When the execution of source line/instruction that require checking has been completed, you can perform
step execution using this instruction so that you can make the program return to the caller function without step
executing the remaining instructions inside the function.
R20UT2867EJ0100 Rev.1.00
Feb 01, 2014
Page 81 of 572
CubeSuite+ V2.02.00
Click the
CHAPTER 2 FUNCTIONS
button on the debug toolbar to perform Return out execution.
Cautions 1.
If Return out execution is performed in the main function, the program is stopped in the
startup routine.
2.
3.
Return out execution cannot be performed immediately after stepping in a function.
Return out execution cannot be performed while processing a function prologue or
epilogue.
4.
If Return out execution is performed in a function that called the longjmp function, breaks
may not occur.
5.
Return out execution cannot be performed immediately after a function return.
6.
If Return out execution is performed in a recursive function, the program will be executed in
free-run mode.
R20UT2867EJ0100 Rev.1.00
Feb 01, 2014
Page 82 of 572
CubeSuite+ V2.02.00
2.8
CHAPTER 2 FUNCTIONS
Stop Programs (Break)
This section describes how to stop the program in execution.
CubeSuite+ can stop the program in execution at the arbitrary position by using the following functions.
(1) Forced break function
Stops the program forcibly.
(2) Hardware break function
The debug tool consecutively checks the break condition while the program is in execution and stops the program
when the condition is met. This function is implemented using the debug tool resources.
There are two types of Hardware Break event: "execution type" which stops the program at the arbitrary position;
and "access type" which stops the program when an arbitrary variable and so on is accessed with the specified
type.
Remarks 1.
[IECUBE]
There are two types of Hardware Break event (execution type): "before execution break" which
breaks before the instruction at the specified address is executed; and "after execution break"
which breaks after the instruction at the specified address is executed. CubeSuite+ starts by using
"before execution break" resource to set Hardware Break events, and as soon as that resource
becomes unavailable, uses "after execution break" resource (see "(1) Maximum number of
enabled events"). For this reason, you cannot select between before and after execution.
2.
[E1][E20][EZ Emulator]
Hardware Break events (execution type) break the program after the instruction at the specified
address is executed.
3.
[Simulator]
For a Hardware Break event (execution type), you can select between "before execution break"
which breaks before the instruction at the specified address is executed and "after execution
break" which breaks after the instruction at the specified address is executed (see "(3)
[Simulator]").
(3) Software break function (except for [Simulator])
Temporarily replaces the instruction code for a specified address with a break instruction and stops the program
when this instruction is executed.
Cautions 1.
If a forced break is performed while in standby mode (HALT/STOP), the current PC position will
indicate the address of the next instruction after the standby mode instruction.
This behavior differs depending on the debug tool used.
- For other than [Simulator]
The forced break will release standby mode.
- [Simulator]
The forced break will not release standby mode.
It will appear that standby mode has been released. Check the CPU status on the Main
window's statusbar to see if standby mode has been released.
2.
[E1][E20][EZ Emulator]
Do not decrease the voltage of the target system during a break. A reset that is generated by
the low-voltage detector (LVI) or by power-on-clear (POC) during a break causes an incorrect
operation of CubeSuite+ or communication errors.
A break during emulation of power supply off also causes communication errors.
R20UT2867EJ0100 Rev.1.00
Feb 01, 2014
Page 83 of 572
CubeSuite+ V2.02.00
Remark
CHAPTER 2 FUNCTIONS
When the program in execution is stopped, a statement of the cause of the break appears on the Statusbar
in the Main window.
2.8.1
Configure the break function
Before the break function can be used, it is necessary to make settings relating to the operation of a break.
This break operation can be configured in the [Break] category on the [Debug Tool Settings] tab of the Property panel.
The setting method differs depending on the debug tool used.
(1) [IECUBE]
(2) [E1]/[E20]/[EZ Emulator]
(3) [Simulator]
(1) [IECUBE]
Figure 2-87. [Break] Category [IECUBE]
(a) [First using type of breakpoint]
Specify the type of preferential breakpoint with a single click of the mouse in the Editor panel/Disassemble
panel.
Select from the drop-down list below for each use of the breakpoint.
Hardware break
Sets hardware breakpoint with priority, by using the Hardware break function.
Once set, it is treated as a Hardware Break event (execution system).
Software break
Sets software breakpoint with priority, by using the Software break function (except for
[Simulator]) (default).
Once set, it is treated as a Software Break event.
Caution
If the number of the set breakpoints of the specified type exceeds the limit settable (see "(1)
Maximum number of enabled events"), a breakpoint of another type will be used.
(b) [Stop emulation of timer group when stopping]
Select whether to terminate the peripheral emulation of timers while stopping the program execution
(Peripheral Break).
Select [Yes] to terminate (default: [No]).
(c) [Stop emulation of serial group when stopping]
This property appears only when the selected microcontroller supports the function that terminates the
peripheral emulation of serials (Peripheral Break).
Select whether to terminate the peripheral emulation of serials while stopping the program execution.
Select [Yes] to terminate (default: [No]).
(d) [Use open break function]
This property appears only when the selected microcontroller supports the open break function.
Select from the following drop-down list whether to use the open break function.
R20UT2867EJ0100 Rev.1.00
Feb 01, 2014
Page 84 of 572
CubeSuite+ V2.02.00
CHAPTER 2 FUNCTIONS
The default value depends on the type of the selected microcontroller.
Yes(Hi-Z)
The open break target pin becomes the Hi-Z state after the CPU is stopped.
No(Output signal)
The open break target pin outputs the signal even after the CPU is stopped.
(2) [E1]/[E20]/[EZ Emulator]
Figure 2-88. [Break] Category [E1][E20][EZ Emulator]
(a) [First using type of breakpoint]
This property appears only when the selected microcontroller supports multipule types of breakpoint.
Specify the type of preferential breakpoint with a single click of the mouse in the Editor panel/Disassemble
panel.
Select from the drop-down list below for each use of the breakpoint.
Hardware break
Sets hardware breakpoint with priority, by using the Hardware break function.
Once set, it is treated as a Hardware Break event (execution system).
Software break
Sets software breakpoint with priority, by using the Software break function (except for
[Simulator]) (default).
Once set, it is treated as a Software Break event.
Caution
If the number of the set breakpoints of the specified type exceeds the limit settable (see "(1)
Maximum number of enabled events"), a breakpoint of another type will be used.
(b) [Stop emulation of timer group when stopping]
Select whether to terminate the peripheral emulation of timers while stopping the program execution
(Peripheral Break).
Select [Yes] to terminate (default: [No]).
In the case of the selected microcontroller that provides the open break function, when this property is set to
[Yes], the open break target pin becomes the Hi-Z state after the CPU is stopped (when this property is set to
[No], the open break target pin outputs the signal even after the CPU is stopped).
(c) [Stop emulation of serial group when stopping]
This property appears only when the selected microcontroller supports the function that terminates the
peripheral emulation of serials (Peripheral Break).
Selectt whether to terminate the peripheral emulation of serials while stopping the program execution.
Select [Yes] to terminate (default: [No]).
(d) [Restore the breakpoint when pin reset occurs]
This property only appears if the selected microcontroller supports the function of restoring breakpoints after a
pin reset and the [Permit flash programming] property in the [Flash] category on the [Connect Settings] tab is
set to [Yes].
Select whether to restore the breakpoints when a pin reset occurs.
R20UT2867EJ0100 Rev.1.00
Feb 01, 2014
Page 85 of 572
CubeSuite+ V2.02.00
CHAPTER 2 FUNCTIONS
When [Yes] is selected, the CPU is briefly halted for restoration of the breakpoints after a pin reset (default).
When [No] is selected, the breakpoints are ignored and not restored after a pin reset, but are restored when
the program is stopped.
(3) [Simulator]
Figure 2-89. [Break] Category [Simulator]
(a) [Execute instruction at breakpoint when break]
You can specify the timing to stop the program execution by breakpoints whether after or before the execution
of the instruction at the breakpoint. Specify in this property whether to break after executing the instruction.
Select [Yes] to break after execution of the instruction (default: [No]).
All set breakpoints are handled as Hardware Break events.
Caution
When [Yes] is selected, all of action events currently being set are handled as Hardware
Break events (see "2.14 Set an Action into Programs").
2.8.2
Stop the program manually
The program in execution is forcibly stopped by clicking the
2.8.3
button on the debug toolbar.
Stop the program at the arbitrary position (breakpoint)
The program in execution can be stopped at the arbitrary position by setting a breakpoint. A breakpoint can be set by
one-clicking with the mouse.
You need to configure the type of breakpoints to use before setting a breakpoint.
This section describes the following operations.
(1) Set a breakpoint
(2) Edit a breakpoint
(3) Delete a breakpoint
(1) Set a breakpoint
Breakpoints can be set via the Editor panel/Disassemble panel in which the source text/disassembly text is
displayed.
Within the Main area (Editor panel) or Event area (Disassemble panel) in which a valid address is displayed, click
on the location where you want to set a breakpoint. A breakpoint whose type is being selected in the [First using
type of breakpoint] property is set to the instruction at the start address corresponding to the clicked line.
When a breakpoint is set, the following event mark appears at the breakpoint location, and the source text line/
disassembled text line is highlighted.
It is interpreted as if a break event (Software Break or Hardware Break) has been set at the target address, and it
is managed in the Events panel (see "2.15 Manage Events" for details).
R20UT2867EJ0100 Rev.1.00
Feb 01, 2014
Page 86 of 572
CubeSuite+ V2.02.00
CHAPTER 2 FUNCTIONS
Table 2-4. Event Marks of Breakpoint
Type of Breakpoint
Event Type
Hardware breakpoint
Hardware Break eventNote
Software breakpoint
Software Break eventNote
Event Mark
(except [Simulator])
Note In the [Name] area of the Events panel, "Break" is displayed as the event type name.
Figure 2-90. Breakpoint Setting Example (Disassemble Panel)
Event area
Indicates that a software
breakpoint has been set.
Indicates that a hardware
breakpoint has been set.
Figure 2-91. Example of Setting Breakpoint in Events Panel
Cautions 1.
Since a breakpoint is set as a break event and managed as a event, restrictions apply to the
number of breakpoints that can be simultaneously set. Also see "2.15.7 Notes for setting
events" for details on breakpoints (e.g. limits on the number of enabled events).
2.
No software breakpoints can be set to the data flash memory area.
3.
Breakpoints can only be set at lines that have valid addresses.
Remarks 1.
Event marks differ depending on the event state (see "2.15.1 Change the state of set events
(valid/invalid)").
When an event is set at the point where other event is already set, the event mark (
) is
displayed meaning more than one event is set at the point.
2.
[Simulator]
The type of breakpoint that can be set is locked to hardware breakpoints.
3.
For other than [Simulator]
You can set hardware breakpoints/software breakpoints without depending on the specification of
"2.8.1 Configure the break function" by following the step below.
Note, however, that "Operation1" is only available in the Disassemble panel.
R20UT2867EJ0100 Rev.1.00
Feb 01, 2014
Page 87 of 572
CubeSuite+ V2.02.00
CHAPTER 2 FUNCTIONS
Type
Operation1
Hardware breakpoint
[Ctrl] + mouse click
Operation2
Select [Break Settings] >> [Set Hardware Break]
from the context menu.
Software breakpoint
[Shift] + mouse click
Select [Break Settings] >> [Set Software Break]
from the context menu.
(2) Edit a breakpoint
It is possible to edit a breakpoint you have set.
For details on how to do it, see "(1) Edit execution-related events".
Caution
This function applies to only a breakpoint whose type is Hardware Break.
(3) Delete a breakpoint
Click event marks displayed in the Editor panel/Disassemble panel to delete set breakpoints (the event mark will be
erased).
2.8.4
Stop the program at the arbitrary position (break event)
The program in execution can be stopped at the arbitrary position by setting a break event (execution type).
This section describes the following operations.
(1) Set a break event (execution type)
(2) Edit a break event (execution type)
(3) Delete a break event (execution type)
(1) Set a break event (execution type)
Perform this operation in the Editor panel/Disassemble panel in which the source text/disassembly text is
displayed.
Follow the operation listed below from the context menu, in accordance with your desired event type, after moving
the caret to the target line that has a valid address.
Event Type
Hardware Break
Operation
Select [Break Settings] >> [Set Hardware Break]
Description
Sets a Hardware Break event by using the
Hardware break function.
Software Break
Select [Break Settings] >> [Set Software Break]
Sets a Software Break event by using the
Software break function (except for [Simulator]).
(except
[Simulator])
Combination Break
Select [Break Settings] >> [Set Combination
A combined break event, that is, a break condition
[E1][E20]
Break]
that is a combination of multiple break events, may
be set as the target event condition on the E1 and
E20Note 2 (see “Edit combination conditions of
events [E1] [E20]”).
Note [E1][E20]
This function is enabled only when the selected microcontroller supports a combination break event.
A break event is set to the instruction at the start address corresponding to the line of the caret position. When a
break event (execution type) is set, the following event mark appears at the break event location, and the source
text line or disassembled text line will be highlighted.
R20UT2867EJ0100 Rev.1.00
Feb 01, 2014
Page 88 of 572
CubeSuite+ V2.02.00
CHAPTER 2 FUNCTIONS
When you have performed this operation, the set break event is managed in the Events panel as a Hardware
Break event (execution type)/Software Break event (execution type) or a execution-related event in the detailed
information on a Combination Break event (see "2.15 Manage Events" for details).
Table 2-5. Event Marks of Break Event
Event Type
Event Mark
Hardware Break
Software Break
(except [Simulator])
Combination Break
[E1][E20]
Figure 2-92. Break event Setting Example (Disassemble Panel)
Event area
Indicates that a software
break event has been set.
Indicates that a hardware
break event has been set.
Figure 2-93. Example of Setting Hardware Break Event (Execution Type) in Events Panel
Figure 2-94. Example of Setting Combination Break Event (Execution Type) in Events Panel [E1][E20]
R20UT2867EJ0100 Rev.1.00
Feb 01, 2014
Page 89 of 572
CubeSuite+ V2.02.00
Cautions 1.
CHAPTER 2 FUNCTIONS
When setting a break event (execution type), also see "2.15.7 Notes for setting events" for
details (e.g. limits on the number of valid events).
2.
Remark
No software breakpoints can be set to the data flash memory area.
Event marks differ depending on the event state (see "2.15.1 Change the state of set events (valid/
invalid)"). When an event is set at the point where other event is already set, the event mark (
) is
displayed meaning more than one event is set at the point.
(2) Edit a break event (execution type)
It is possible to edit a break event (execution type) you have set.
For details on how to do it, see "(1) Edit execution-related events" or "(3) Edit combination conditions of events
[E1] [E20]".
Caution
This function applies to only a break event (execution type) whose type is Hardware Break or
Combination Break [E1][E20].
(3) Delete a break event (execution type)
To delete a break event (execution type) you have set, click the event mark displayed in the Editor panel/
Disassemble panel.
Also, there is another way to delete a set break event. Select a Software Break event/Hardware Break event, or
Combination Break event [E1][E20] in the Events panel, and then click the
button in the toolbar (see "2.15.5
Delete events").
Caution
In the Events panel, you cannot delete a break event (execution type) selectively in the
combination breaks. All the break events (including access type) displayed in the detailed
information on the combination break will be deleted.
2.8.5
Stop the program with the access to variables/SFRs
By setting a break event with the access, the program can be stopped when an arbitrary variable or SFR is accessed
with the specified type.
You can also limit the accessed value.
The following types can be specified with the access.
Table 2-6. Types of Accesses to Variables
Access Type
Description
Read
The program is stopped with the read access to (after reading) the specified variable/SFR.
Write
The program is stopped with the write access to (after writing) the specified variable/SFR.
Read/Write
The program is stopped with the read access/write access to (after reading or writing) the specified
variable/SFR.
Caution
[IECUBE][E1][E20][EZ Emulator]
The program is stopped with the access via DMA (Direct Memory Access).
This section describes the following.
(1) Set a break event (access type)
(2) Edit a break event (access type)
(3) Delete a break event (access type)
R20UT2867EJ0100 Rev.1.00
Feb 01, 2014
Page 90 of 572
CubeSuite+ V2.02.00
CHAPTER 2 FUNCTIONS
(1) Set a break event (access type)
Use one of the following methods to set a break event (access type) that stops programs with the access to a
variable/SFR.
Cautions 1.
Also see "2.15.7 Notes for setting events" for details on breakpoints (e.g. limits on the
number of enabled events).
2.
For other than [Simulator]
The access break events described here cannot be set for 32-bit (4-byte) variables.
Additionally, accessing a single byte of a 16-bit (2-byte) variable will not be detected as an
access.
(a) Set a break event to a variable/SFR in the Editor panel/Disassemble panel
Perform this operation in the Editor panel/Disassemble panel in which the source text/disassembly text is
displayed.
Follow the operation listed below from the context menu, in accordance with your desired access type, after
selecting an arbitrary variable or SFR on the source text/disassembled text. Note, however, that only global
variables, static variables inside functions, and file-internal static variables can be used.
Access Type
Operation
Select [Break Settings] >> [Set Read Break to]/[Set Read Combination Break to]Note, and then
Read
press the [Enter] key.
Select [Break Settings] >> [Set Write Break to]/[Set Write Combination Break to]Note, and then
Write
press the [Enter] key.
Select [Break Settings] >> [Set R/W Break to]/[Set R/W Combination Break to]Note, and then press
Read/Write
the [Enter] key.
Note [E1][E20]
A combined break event, that is, a break condition that is a combination of multiple break events, may
be set as the target event condition on the E1 and E20 (see “(3) Edit combination conditions of events
[E1] [E20]”).
Note, however, that this function is enabled only when the selected microcontroller supports a
combination break event.
At this time, if you have specified a value in the text box in the context menu, break will occur only when the
specified value is used for the reading, writing or reading/writing. On the other hand, if no value is specified,
reading., writing or reading/writing the selected variable by any value will cause the break to occur.
Cautions 1.
2.
Variables within the current scope can be specified.
Variables or SFR at lines that have no valid addresses cannot be used for break events.
R20UT2867EJ0100 Rev.1.00
Feb 01, 2014
Page 91 of 572
CubeSuite+ V2.02.00
CHAPTER 2 FUNCTIONS
Figure 2-95. Example of Setting Break Event (Access Type) on Variable in Editor Panel
From the context menu above the variable global_a,
enter a value in [Break Settings] >> [Set Writ Break
to], then press the [Enter] key.
Here, the program will break when the value "0xb" is
written to the variable global_a.
Figure 2-96. Example of Setting Combination Break Event (Access Type) on Variable in Editor Panel [E1][E20]
From the context menu above the variable global_a,
enter a value in [Break Settings] >> [Set Writ
Combination Break to], then press the [Enter] key.
Here, the program will break when the value "0xb" is
written to the variable global_a.
R20UT2867EJ0100 Rev.1.00
Feb 01, 2014
Page 92 of 572
CubeSuite+ V2.02.00
CHAPTER 2 FUNCTIONS
(b) Set a break event (access type) to a registered watch-expression
You can set break events in the Watch panel.
Follow the operation listed below from the context menu, in accordance with your desired access type, after
selecting the registered watch-expression (multiple selections not allowed).
Note, however, that only global variables, static variables inside functions, file-internal static variables, and
SFR can be used.
Access Type
Operation
Select [Access Break] >> [Set Read Break to]/[Set Read Combination Break to]Note, and then
Read
press the [Enter] key.
Select [Access Break] >> [Set Write Break to]/[Set Write Combination Break to]Note, and then
Write
press the [Enter] key.
Select [Access Break] >> [Set R/W Break to]/[Set R/W Combination Break to]Note, and then press
Read/Write
the [Enter] key.
Note [E1][E20]
A combined break event, that is, a break condition that is a combination of multiple break events, may
be set as the target event condition on the E1 and E20 (see “(3) Edit combination conditions of events
[E1] [E20]”).
Note, however, that this function is enabled only when the selected microcontroller supports a
combination break event.
At this time, if you have specified a value in the text box in the context menu, break will occur only when the
specified value is used for the reading., writing or reading/writing. On the other hand, if no value is specified,
reading., writing or reading/writing the selected watch-expression by any value will cause the break to occur.
Caution
A watch-expression within the current scope can be specified.
To target a watch-expression outside the current scope, select a watch-expression with a
specified scope.
Figure 2-97. Example of Setting Hardware Break Event (Access Type) on Watch-Expression
From the context menu above the watch-expression
"global_a", enter a value in [Access Break] >> [Set Write
Break to], then press the [Enter] key.
Here, the program will break when the value "0xb" is
written to the watch-expression "global_a".
R20UT2867EJ0100 Rev.1.00
Feb 01, 2014
Page 93 of 572
CubeSuite+ V2.02.00
CHAPTER 2 FUNCTIONS
Figure 2-98. Example of Setting Combination Break Event (Access Type) on Watch-Expression [E1][E20]
From the context menu above the watch-expression
"global_a", enter a value in [Access Break] >> [Set Write
Combination Break to], then press the [Enter] key.
Here, the program will break when the value "0xb" is
written to the watch-expression "global_a".
When you have performed the above operation, the set break event (access type) is managed in the Events
panel as a Hardware Break event (access type) or a execution-related event in the detailed information on a
Combination Break event (see "2.15 Manage Events" for details).
Figure 2-99. Example of Setting Hardware Break Event (Access Type) in Events Panel
Figure 2-100. Example of Setting Combination Break Event (Access Type) in Events Panel [E1][E20]
R20UT2867EJ0100 Rev.1.00
Feb 01, 2014
Page 94 of 572
CubeSuite+ V2.02.00
CHAPTER 2 FUNCTIONS
(2) Edit a break event (access type)
It is possible to edit a break event (access type) you have set.
For details on how to do it, see "(1) Edit execution-related events" or "(3) Edit combination conditions of events
[E1] [E20]".
(3) Delete a break event (access type)
To delete a break event (access type) you have set, select a Hardware Break event, or Combination Break event
[E1][E20] in the Events panel, and then click the
button in the toolbar (see "2.15.5 Delete events").
For a Combination Break event [E1][E20], it is also possible to delete a break event (access type) by clicking on
the event mark on the Editor panel/Disassemble panel.
Caution
In the Events panel, you cannot delete a break event (execution type) selectively in the
combination breaks. All the break events (including access type) displayed in the detailed
information on the combination break will be deleted.
2.8.6
Stop the program when an invalid execution is detected [IECUBE]
The system forcibly breaks the program execution when unexpected program behavior such as invalid access to
internal ROM/internal RAM/SFR/external memory is detected (fail-safe break function).
This function has various break conditions. Enable/disable each break condition in the [Fail-safe Break] category on
the [Debug Tool Settings] tab of the Property panel.
Caution
The fail-safe break function becomes invalid during step execution.
Figure 2-101. [Fail-safe Break] Category
In the following property setting, select [Yes] to enable and [No] to disable the function from the drop-down list.
All the properties are set to [Yes] by default (with some exceptions).
- [Stop when fetched from fetch protected area]
- [Stop when wrote to write protected area]
- [Stop when read from read protected SFR]
- [Stop when wrote to write protected SFR]
- [Stop when overflowed user stack]Note 1
- [Stop when underflowed user stack]Note 2
- [Stop when operated uninitialized stack pointer]
- [Stop when read from uninitialized RAM]
R20UT2867EJ0100 Rev.1.00
Feb 01, 2014
Page 95 of 572
CubeSuite+ V2.02.00
CHAPTER 2 FUNCTIONS
- [Stop when accessed to non-mapping area]
- [Stop when word miss-align accessed]
- [Stop when received fail safe from peripheral]
- [Stop when occurred flash illegal]
Notes 1.
[No] is selected by default.
To set to [Yes], the [User stack top address] property on the bottom must be set to the top address of
the user stack (default: [@STEND]).
2.
[No] is selected by default.
To set to [Yes], the [User stack bottom address] property on the bottom must be set to the end address
of the user stack (default: [@STBEG]).
2.8.7
Other break causes
The cause of the break other than the described above is as follows:
You can confirm the break cause with the Status message on the statusbar in the Main window.
Table 2-7. Other Break Causes
Debug Tool to Use
Break Cause
IECUBE
E1/E20
Simulator
EZ Emulator
Full of the trace memoryNote 1
-
An occurrence of Trace Delay Break
-
-
Execution time-over detected
-
-
An access to non-mapped area
-
A writing to write-protected area
-
An access to the odd number address by the word width
-
An occurrence of Temporary BreakNote 2
An occurrence of Flash Illegal Break
-
-
Illegal action of program related to the peripheral chip functionNote 3
-
-
Failure to execute/uncertain cause
Notes 1.
-
The operation depends on the setting of the [Operation after trace memory is full] property in the [Trace]
category on the [Debug Tool Settings] tab of the Property panel.
2.
A break that is internally used by CubeSuite+. (Users cannot use it.)
3.
See the documentation on peripheral emulation board to use.
R20UT2867EJ0100 Rev.1.00
Feb 01, 2014
Page 96 of 572
CubeSuite+ V2.02.00
2.9
CHAPTER 2 FUNCTIONS
Display/Change the Memory, Register and Variable
This section describes how to display/change the memory, register and variable.
2.9.1
Display/change the memory
The contents of the memory can be displayed and its values can be changed in the Memory panel below.
Select the [View] menu >> [Memory] >> [Memory1 - 4].
The maximum of 4 Memory panels can be opened. Each panel is identified by the names "Memory1", "Memory2",
"Memory3" and "Memory4" on the titlebar.
For details on the contents and function in each area, see the section for the Memory panel.
Figure 2-102. Display the Contents of Memory (Memory Panel)
Toolbar
Display position specification area
Address area
Remark
Memory value area
Character strings area
You can set the scroll range (as start and end address) of the vertical scroll bar on this panel via the Scroll
Range Settings dialog box which is opened by clicking the
button from [View] on the toolbar.
This section describes the following.
(1) Specify the display position
(2) Change display format of values
(3) Modify the memory contents
(4) Display/modify the memory contents during program execution
(5) Search the memory contents
(6) Modify the memory contents in batch (initialize)
(7) Save the memory contents
(1) Specify the display position
It is possible to specify the display start position of the memory contents by specifying an address expression in the
display position specification area (starting with address 0x0 by default).
Remark
An offset value of the display start position of memory values can be set via the Address Offset Settings
dialog box that is opened by selecting [Address Offset Value Settings...] from the context menu.
R20UT2867EJ0100 Rev.1.00
Feb 01, 2014
Page 97 of 572
CubeSuite+ V2.02.00
CHAPTER 2 FUNCTIONS
Figure 2-103. Display Position Specification Area (Memory Panel)
(a) Specify an address expression
Directly enter the address expression of the memory value address to display in the text box. You can specify
an input expression with up to 1024 characters. The result of the expression is treated as the display start
position address.
Note that if an address value greater than the microcontroller address space is specified, the high-order
address value is masked.
An address value greater than the value expressed within 32 bits cannot be specified.
Remarks 1.
A symbol name at the current caret position can be complemented by pressing the [Ctrl] +
[Space] key in this text box (see "2.19.2 Symbol name completion function").
2.
If the specified address expression is the symbol and its size can be recognized, everything
from the start address to the end address of that symbol is displayed selected.
(b) Specify automatic/manual evaluation of the address expression
The timing to change the display start position can be determined by specifying in the [Move when Stop] check
box and the [Move] button.
[Move when
The caret is moved to the address which is automatically calculated from the address
Stop]
expression after the program is stopped.
The address expression is not automatically evaluated after the program is stopped.
Click the [Move] button to manually evaluate the address expression.
[Move]
When the [Move when Stop] check box is not checked, click this button to evaluate the
address expression and move the caret to the result address of the evaluation.
(2) Change display format of values
The display format of the address area/memory value area/character strings area can be changed using buttons
below on the toolbar.
Notation
The following buttons to change the notation of memory values are displayed.
Displays memory values in hexadecimal number (default).
Displays memory values in signed decimal number.
Displays memory values in unsigned decimal number.
Displays memory values in octal number.
Displays memory values in binary number.
Size Notation
The following buttons to change the notation of sizes of memory values are displayed.
Displays memory values in 4-bit width.
Displays memory values in 8-bit width (default).
Displays memory values in 16-bit width.
Values are converted depending on the endian of the target memory area.
Displays memory values in 32-bit width.
Values are converted depending on the endian of the target memory area.
Displays memory values in 64-bit width.
Values are converted depending on the endian of the target memory area.
R20UT2867EJ0100 Rev.1.00
Feb 01, 2014
Page 98 of 572
CubeSuite+ V2.02.00
Encoding
CHAPTER 2 FUNCTIONS
The following buttons to change the encoding of character strings are displayed.
Displays character strings in ASCII code (default).
Displays character strings in Shift_JIS code.
Displays character strings in EUC-JP code.
Displays character strings in UTF-8 code.
Displays character strings in UTF-16 code.
Displays character strings as a single-precision floating-point valueNote.
Displays character strings as a double-precision floating-point valueNote.
Displays character strings as a complex number of single-precision floating-pointNote.
Displays character strings as a complex number of double-precision floating-pointNote.
Displays character strings as an imaginary number of single-precision floating-pointNote.
Displays character strings as an imaginary number of double-precision floating-pointNote.
View
The following buttons to change the display format are displayed.
Opens the Scroll Range Settings dialog box to set the scroll range for this panel.
Column Number
Opens the Column Number Settings dialog box to set the number of view columns in the
Settings...
memory value area.
Address Offset Value
Opens the Address Offset Settings dialog box to set an offset value for addresses displayed
Settings...
in the address area.
Note For details on the display of a floating-point value, see the section for the Memory panel.
(3) Modify the memory contents
The memory values can be edited.
Directly edit from the keyboard after moving the caret to the line to modify in memory value area/characters area.
The color of the memory value changes when it is in editing. Press the [Enter] key to write the edited value to the
target memory (if the [Esc] key is pressed before the [Enter] key is pressed, the editing is cancelled).
However, the character string that can be inputted during the editing is limited to that character string that can be
handled by the display notation that has been currently specified. In the character strings area, modification can
only be made with "ASCII" character code.
This operation can be taken place while the program is in execution. See "(4) Display/modify the memory
contents during program execution" for details on how to operate it.
When you modify the values, be aware of the following examples.
Examples 1.
The value exceeds the upper limit of the display bit wide
If you edit the display value "105" as "1" to "3" in the decimal 8-bit display, the value will be
changed to the upper limit of "127".
2.
The symbol, "-" is entered between numbers
If you edit the display value "32768" as "32-68" with signed decimal 16-bit display, "3" and "2" are
changed to the blank and the value is changed to "-68".
3.
The blank symbol (space) is entered between numbers
If you edit the display value "32767" as "32 67", "3" and "2" are changed to the blank and the value
is changed to "67".
4.
The same value is entered
Even if the same value as the current memory value is specified, the specified value is written to
the memory.
R20UT2867EJ0100 Rev.1.00
Feb 01, 2014
Page 99 of 572
CubeSuite+ V2.02.00
CHAPTER 2 FUNCTIONS
(4) Display/modify the memory contents during program execution
The Memory panel/Watch panel has the real-time display update function that can update/modify the display
contents of the memory/watch-expression in real-time while executing the program.
Using the real-time display update function allows you to display/modify the value of memory/watch-expression not
only while the program is stopped, but also in execution.
The real-time display update function is realized by the RRM function (reading) [IECUBE][Simulator], a RAM
monitor function (reading) (other than [Simulator]) or by the DMM function (modifying). Each function has a
different area that can be used for reading and writing.
Firstly, enable the real-time display update function by making the basic settings below on the [Debug Tool
Settings] tab of the Property panel.
Table 2-8. Basic Settings for Real-time Display Update Function
Category
Property
Set Value
[Access memory while running]
[Update display during the execution]
[Yes] (default)
[Display update interval[ms]]
[Integer number between 100
and 65500]
Caution
Local variables are not subject to the real-time display update function.
Remark
See "(3) Modify the memory contents" or "(6) Modify the contents of watch-expressions" for details on
how to modify values in the Memory panel/Watch panel.
(a) RRM function (reading) [IECUBE][Simulator]
This function is used to read the contents of the memory or of watch-expressions in real-time during execution
of a program.
The following area can be read by the RRM function.
Memory and watch-expressions allocated to this area can always be displayed in real-time.
Table 2-9. Target Area of RMM Function
Area
Internal ROM
IECUBE
Simulator
Note 1
Internal RAM (except register area)
Data flash
-
Emulation memory
-
Target memory
-
CPU register
Note 2
SFR
-
Notes 1.
Note 3
Note 3
This refers to data that were in the cache before execution, to the values are not real-time.
2.
Possible only for general-purpose registers and PC
3.
Impossible during tracer/timer execution
R20UT2867EJ0100 Rev.1.00
Feb 01, 2014
Page 100 of 572
CubeSuite+ V2.02.00
CHAPTER 2 FUNCTIONS
(b) RAM monitor function (reading) (other than [Simulator])
This function is used to read the contents of memory or a watch-expression through software emulation by
briefly halting the program.
The following area can be read by the RAM monitor function.
Caution
If CPU status shifts to the standby mode (HALT/STOP/IDLE) mode, a monitor time-out error
will occur.
Table 2-10. Target Area of RAM Monitor Function
Area
IECUBE
E1/E20/EZ Emulator
Internal ROM
-Note 1
-
Internal RAM (except register area)
-Note 1
Data flash
-Note 1
Emulation memory
-
-
Target memory
-
CPU register
Note 2
SFR
Note 3
Notes 1.
When it is available, priority is given to the RRM function. That is, the RAM monitor function is not
used in such cases.
2.
This only applies to the general-purpose registers corresponding to the bank specification.
3.
This does not apply to BCDADJ.
Note that to enable the RAM monitor function, the setting below is required in addition to the Basic Settings for
Real-time Display Update Function.
Category
Property
[Access memory while running]
[Access by stopping execution]
Set Value
[Yes]
(c) DMM function (modifying)
This function is used to write to the memory or watch-expressions in real-time during execution of a program.
The following area can be modified by the DMM function.
Caution
If CPU status shifts to the standby mode (HALT/STOP/IDLE) mode, a monitor time-out error
will occur.
Table 2-11. Target Area of DMM Function
Area
Internal ROM
IECUBE
E1/E20/EZ Emulator
-
-
-
-
Simulator
Internal RAM (except register area)
Emulation memory
Target memory
-
CPU register
Note 1
Note 2
SFR
Note 3
Note 2
R20UT2867EJ0100 Rev.1.00
Feb 01, 2014
Page 101 of 572
CubeSuite+ V2.02.00
CHAPTER 2 FUNCTIONS
:
Possible by briefly halting execution
:
Possible without briefly halting execution
Notes 1.
This only applies to the general-purpose registers corresponding to the bank specification.
2.
Impossible during tracer/timer execution
3.
Possible only for standard SFRs
To enable the DMM function, the setting below is required in addition to the Basic Settings for Real-time
Display Update Function.
Debug Tool
Property
Simulator
No setting is required.
Other than above
[Access memory while running] category
Set Value
[Yes]
>> [Access by stopping execution]
Caution
When a 2-, 4-, or 8-byte variable is to be read through the RRM or RAM monitor function, the
process of assigning a value to the variable may be divided into two steps.
If reading of the variable takes place between the two steps, an incorrect value may be read out
because the assignment is not completed.
Example In this example, if reading takes place before "(2)" is executed, the value of variable
"value_a" in which only the assignment to the two lower-order bytes has been completed is
read out.
[C source text]
long int
value_a = 0;
// Definition of a 4-byte variable
void func(void)
{
value_a = 4000000000;
// Assignment to a 4-byte variable
}
[Assembly instructions for the assignment processing above]
MOVW
AX, #2800H
MOVW
!_value_a, AX
MOVW
AX, #0EE6BH
MOVW
!_value_a+2, AX
;(1): Assignment to the two lower-order bytes of variable "value_a"
;(2): Assignment to the two high-order bytes of variable "value_a"
On the Memory panel/Watch panel, the memory values/watch-expressions updated by the real-time display update
function are highlighted in pink.
R20UT2867EJ0100 Rev.1.00
Feb 01, 2014
Page 102 of 572
CubeSuite+ V2.02.00
CHAPTER 2 FUNCTIONS
Figure 2-104. Example of Memory Display by Real-time Display Update Function
Moreover, on the Memory panel using IECUBE, the background color of the memory values updated by the RRM
function are highlighted as follows in accordance with the access status (character colors and background colors
depend on the configuration in the [General - Font and Color] category of the Option dialog box).
Access Condition
Display Example
Read or fetch
00 00 00 00
Write
00 00 00 00
Read and write
00 00 00 00
Figure 2-105. Example of Memory Display by Real-time Display Update Function (RRM Function) [IECUBE]
(5) Search the memory contents
Values of memory can be searched in the Memory Search dialog box that is opened by selecting [Find...] from the
context menu. The search is operated either in the memory value area or character strings area, in which the caret
exists. In this dialog box, follow the steps below.
R20UT2867EJ0100 Rev.1.00
Feb 01, 2014
Page 103 of 572
CubeSuite+ V2.02.00
CHAPTER 2 FUNCTIONS
Figure 2-106. Search Memory Contents (Memory Search Dialog Box)
Cautions 1.
2.
The contents of the memory cannot be searched during execution of a program.
Character strings displayed as floating-point values cannot be searched.
(a) Specify [Search Data]
Specify data to search.
You can either type a value directly into the text box (up to 256 bytes), or select one from the input history via
the drop-down list (up to 10 items).
If the search is performed in the memory value area, the value must be entered in the same display format
(notation and size) as that area.
If the search is performed in the character strings area, then the target of the search must be a string. The
specified string is converted into the encoding format displayed in that area, and searched for.
If a memory value was selected immediately prior to opening this dialog box, then that value will appear as
default.
(b) Specify [Search Range]
Select the range to search from the following drop-down list.
Specify address range
Searches in the address range specified in the [Address] area.
Memory mapping
Searches within the selected memory mapping range.
This list item displays individual memory mapping configured in the Memory Mapping
dialog box (except the non-mapped area).
Display format: <memory type> <address range> <size>
(c) Specify [Address]
This item is only enabled if [Specify address range] is selected in the (b) Specify [Search Range].
Specify the range of memory address to search via the start and end addresses. You can either type address
expressions directly into the text boxes (up to 1024 characters), or select them from the input history via the
drop-down list (up to 10 items).
The results of calculating the address expressions you have entered are treated as start and end addresses,
respectively.
Note that if an address value greater than the microcontroller address space is specified, the high-order
address value is masked.
An address value greater than the value expressed within 32 bits cannot be specified.
Remarks 1.
A symbol name at the current caret position can be complemented by pressing the [Ctrl] +
[Space] key in each text box (see "2.19.2 Symbol name completion function").
2.
If the start address field is left blank, it is treated as if "0x0" were specified.
R20UT2867EJ0100 Rev.1.00
Feb 01, 2014
Page 104 of 572
CubeSuite+ V2.02.00
3.
CHAPTER 2 FUNCTIONS
If the end address field is left blank, then it is treated as if the maximum value in the
microcontroller's address space were specified.
(d) Click the [Search Backward]/[Search Forward] button
When the [Search Backward] button is clicked, search will start in the order from the large address number to
small and the search results are displayed selected in the Memory panel.
When the [Search Forward] button is clicked, search will start in the order from the small address number to
small and the search results are displayed selected in the Memory panel.
(6) Modify the memory contents in batch (initialize)
Contents of the memory can be modified in batch (initialize).
When [Fill...] from the context menu is selected, the Memory Initialize dialog box opens to modify the memory
value of the specified address range in batch.
In this dialog box, follow the steps below.
Figure 2-107. Modify Memory Contents in Batch (Memory Initialize Dialog Box)
(a) Specify [Start address/symbol] and [End address/symbol]
Specify the range of memory address to initialize via the [Start address/symbol] and [End address/symbol].
You can either type address expressions directly into the text boxes (up to 1024 characters), or select them
from the input history via the drop-down list (up to 10 items).
The results of calculating the address expressions you have entered are treated as start and end addresses,
respectively.
Note that address values greater than the microcontroller address space cannot be specified.
Caution
You cannot specify the range of address aligned across the different endian area.
Remark
A symbol name at the current caret position can be complemented by pressing the [Ctrl] + [Space]
key in each text box (see "2.19.2 Symbol name completion function").
(b) Specify [Initialize data]
Specify the initializing data to write to the memory.
You can either type the initial value into the text box directly in hexadecimal number, or select one from the
input history via the drop-down list (up to10 items).
You can specify more than one initial value. Specify up to 16 values of up to 4 bytes (8 characters) each,
separated by spaces.
Each initial value is parsed from the end of the string, with each two characters interpreted as a byte.
If the string has an odd number of characters, then the first character is interpreted as one byte.
Note that if a initial value consists of more than one byte, then the target memory is overwritten with the value
converted into an array of bytes of the specified address range's endian, as follows.
R20UT2867EJ0100 Rev.1.00
Feb 01, 2014
Page 105 of 572
CubeSuite+ V2.02.00
CHAPTER 2 FUNCTIONS
Input Character Strings
How Data is Overwritten (in Bytes)
(Initial Value)
Little Endian
Big Endian
1
01
01
0 12
00 12
00 12
00 012 345
00 12 00 45 03
00 00 12 03 45
000 12 000345
00 00 12 45 03 00
00 00 12 00 03 45
(c) Click the [OK] button
Click the [OK] button.
The memory area in the specified address range is repeatedly overwritten with the specified initial data
pattern. If the end address is reached in the middle of the pattern, then writing ends at that point.
Note that if an illegal value is specified, a message will appear, and the memory value will not be initialized.
(7) Save the memory contents
Contents of the memory can be saved with range selection in text files (*.txt)/CSV files (*.csv).
When saving to the file, the latest information is acquired from the debug tool, and it is saved in accordance with
the display format on this panel.
The Data Save dialog box can be opened by selecting the [File] menu >> [Save Memory Data As...] (when this
operation is taken place with range selection on the panel, the memory data only in the selected range is saved).
In this dialog box, follow the steps below.
Figure 2-108. Save Memory Data (Data Save Dialog Box)
(a) Specify [File Name]
Specify the name of the file to save.
You can either type a filename directly into the text box (up to 259 characters), or select one from the input
history via the drop-down list (up to 10 items).
You can also specify the file by clicking the [...] button, and selecting a file via the Select Data Save File dialog
box.
(b) Specify [File Type]
Select the format in which to save the file from the following drop-down list.
The following file formats can be selected.
R20UT2867EJ0100 Rev.1.00
Feb 01, 2014
Page 106 of 572
CubeSuite+ V2.02.00
CHAPTER 2 FUNCTIONS
List Item
Format
Text files (*.txt)
Text format (default)
CSV (Comma-Separated Variables)(*.csv)
CSV formatNote
Note The data is saved with entries separated by commas (,).
If the data contains commas, each entry is surrounded by double quotes "" in order to avoid illegal
formatting.
(c) Specify [Save Range Address/Symbol]
Specify the range of addresses to save via "start address" and "end addresses".
Directly enter hexadecimal number/address expression in each text box or select from the input history
displayed in the drop-down list (up to 10 items).
If a range is selected in the panel, that range is specified as the default. If there is no selection, then the range
currently visible in the panel is specified.
Remark
A symbol name at the current caret position can be complemented by pressing the [Ctrl] + [Space]
key in each text box (see "2.19.2 Symbol name completion function").
(d) Click the [Save] button
Saves the memory data to a file with the specified filename, in the specified format.
Figure 2-109. Output Example of Memory Data
[Text files (*.txt)]
(Hexadecimal notation/8-bit width/ASCII code)
+0 +1 +2 +3 +4 +5 +6 +7 +8 +9 +a +b +c +d +e +f
0000 | 00 00 00 00 00 00 00 00 00 00 00 00 00 00 00 00 |
0010 | 11 11 11 11 11 11 11 11 11 11 11 11 11 11 11 11 |
[CSV files (*.csv)]
(Hexadecimal notation/8-bit width/ASCII code)
0000,00,00,00,00,00,00,00,00,00,00,00,00,00,00,00,00,
0010,11,11,11,11,11,11,11,11,11,11,11,11,11,11,11,11,
Remark
When the contents of the panel are overwritten by selecting the [File] menu>> [Save Memory Data],
each Memory panel (Memory1-4) is treated as a different panel.
In addition, saving range is same as the previously specified address range.
2.9.2
Display/change the CPU register
The contents of the CPU register (general-purpose register/control register) can be shown and the value can be
changed in the CPU Register panel below.
Select the [View] menu >> [CPU Register].
For details on the contents and function in each area, see the section for the CPU Register panel.
R20UT2867EJ0100 Rev.1.00
Feb 01, 2014
Page 107 of 572
CubeSuite+ V2.02.00
CHAPTER 2 FUNCTIONS
Figure 2-110. Display the Contents of CPU Register (CPU Register Panel)
Toolbar
[Register Name] area
[Value] area
This section describes the following.
(1) Change display format of values
(2) Modify the CPU register contents
(3) Display/modify the CPU register contents during program execution
(4) Save the CPU register contents
(1) Change display format of values
The display format of the [value] area can be changed using buttons below on the toolbar.
Notation
The following buttons to change the notation of a data value are displayed.
Displays the value of the selected item (including sub-items) in the default notation (default).
Displays the value of the selected item (including sub-items) in hexadecimal number.
Displays the value of the selected item (including sub-items) in signed decimal number.
Displays the value of the selected item (including sub-items) in unsigned decimal number.
Displays the value of the selected item (including sub-items) in octal number.
Displays the value of the selected item (including sub-items) in binary number.
Displays the character strings of the selected item (including sub-items) in ASCII code.
If the character size is 2 bytes and above, it is displayed with the characters for each 1 byte arranged
side-by-side.
Displays the value of the selected item in Float.
Note that when the value is not 4-byte data, displays it in the default notation.
Displays the value of the selected item in Double.
Note that when the value is not 8-byte data, displays it in the default notation.
Adds the value in hexadecimal number enclosing with "()" at the end of the value.
(2) Modify the CPU register contents
The CPU register values can be edited.
R20UT2867EJ0100 Rev.1.00
Feb 01, 2014
Page 108 of 572
CubeSuite+ V2.02.00
CHAPTER 2 FUNCTIONS
Select the value of the CPU register to edit in the [Value] area, then click on it again to switch the value to edit
mode (press the [Esc] key to cancel the edit mode).
To write the edited value to the target memory, directly enter the value from the keyboard then press the [Enter]
key.
Caution
This operation cannot be performed during program execution.
(3) Display/modify the CPU register contents during program execution
By registering a CPU register to the Watch panel as a watch-expression, the value of the CPU register can be
displayed/modified not only while the program is stopped, but in execution.
See "2.9.6 Display/change watch-expressions" for details on the watch-expression.
(4) Save the CPU register contents
The Save As dialog box can be opened by selecting the [File] menu >> [Save CPU Register Data As...], and all the
contents in the CPU register can be saved to a text file (*.txt) or CSV file (*.csv).
When saving to files, retrieve the latest information from the debug tool.
Figure 2-111. Output Example of CPU Register Data
Register name
Value
---------------------------------------------------------------------Category name
-Register name
Value
:
:
2.9.3
Display/change the SFR
Contents of the SFR can be displayed and its values can be changed in the SFR panel below.
Select the [View] menu >> [SFR].
For details on the contents and function in each area, see the section for the SFR panel.
Figure 2-112. Display the Contents of SFR (SFR Panel)
Toolbar
Search area
[SFR] area
R20UT2867EJ0100 Rev.1.00
Feb 01, 2014
[Value] area
[Type (Byte Size)] area
[Address] area
Page 109 of 572
CubeSuite+ V2.02.00
CHAPTER 2 FUNCTIONS
This section describes the following.
(1) Search for a SFR
(2) Organize SFRs
(3) Change display format of values
(4) Modify the SFR contents
(5) Display/modify the SFR contents during program execution
(6) Save the SFR contents
(1) Search for a SFR
A SFR can be searched for.
Specify the SFR name to search with the text box in the search area (case-insensitive). You can either type
character strings directly from the key board (up to 512 characters), or select one from the input history via the
drop-down list (up to 10 items).
Then, click either one of the following button.
Searches up for the SFR name containing the string specified in the text box, and selects the SFR
that is found.
Searches down for the SFR name containing the string specified in the text box, and selects the SFR
that is found.
Remarks 1.
The hidden SFR name being classified with a category can be searched (the category is opened
and the SFR is selected).
2.
After typing character strings to search, to press the [Enter] key is the same function as clicking the
button, and to press the [Shift] + [Enter] key is the same function as clicking the
button.
(2) Organize SFRs
The each SFR can be categorized (by folders) and displayed in the tree view.
Cautions 1.
2.
Categories cannot be created within categories.
SFRs cannot be added or deleted.
(a) Create new category
Move the caret to the SFR name to create a new category then click the
button in the toolbar and directly
enter the new category name.
(b) Edit category name
Click the category name to edit, and click it again, then directly modify the category name from the keyboard.
(c) Delete categories
Select categories to delete then click the
button in the toolbar.
However, the categories that can be deleted are only the empty categories.
(d) Change the display order
SFR name is categorized when SFR is dragged and dropped in the category.
Also, the display order of the categories and the SFR names (upper or lower position) can be changed easily
by drag and drop operation.
R20UT2867EJ0100 Rev.1.00
Feb 01, 2014
Page 110 of 572
CubeSuite+ V2.02.00
CHAPTER 2 FUNCTIONS
(3) Change display format of values
The display format of the [value] area can be changed using buttons below on the toolbar.
Notation
The following buttons to change the notation of a data value are displayed.
Displays the value of the selected item in hexadecimal number (default).
Displays the value of the selected item in signed decimal number.
Displays the value of the selected item in unsigned decimal number.
Displays the value of the selected item in octal number.
Displays the value of the selected item in binary number.
Displays the value of the selected item in ASCII code.
Adds the value in hexadecimal number enclosing with "()" at the end of the value of the selected item.
(4) Modify the SFR contents
The SFR values can be edited.
Select the value of the SFR to edit in the [Value] area, then click on it again to switch the value to edit mode (press
the [Esc] key to cancel the edit mode).
To write the edited value to the target memory, directly enter the value from the keyboard then press the [Enter]
key.
Cautions 1.
2.
Remarks 1.
This operation cannot be performed during program execution.
The value of the read-only SFR cannot be edited.
If a number with fewer digits than the size of the SFR is entered, the higher-order digits will be
padded with zeroes.
2.
If a number with more digits than the size of the SFR is entered, the higher-order digits will be
masked.
3.
ASCII characters can be entered to the SFR value.
- When the numeric "0x41" is written to the SFR "DMC0"
>> "0x41" is written in the port "DMC0".
- When the ASCII character "'A'" is written to the SFR "DMC0"
>> "0x41" is written in the port "DMC0".
(5) Display/modify the SFR contents during program execution
By registering a SFR to the Watch panel as a watch-expression, the value of the SFR can be displayed/modified
not only while the program is stopped, but in execution.
See "2.9.6 Display/change watch-expressions" for details on the watch-expression.
(6) Save the SFR contents
The Save As dialog box can be opened by selecting the [File] menu >> [Save SFR Data As...], and all the contents
of the SFR can be saved in a text file (*.txt) or CSV file (*.csv). At this time, the values of all SFRs become targets
irrespective of the setting of display/non-display on this panel.
When saving the contents to the file, the values of the SFR are reacquired and save the latest values acquired.
Note that the values of read-protected SFR are not re-read. If you want to save the latest values of those, select
[Force Read Value] from the context menu then save the file.
R20UT2867EJ0100 Rev.1.00
Feb 01, 2014
Page 111 of 572
CubeSuite+ V2.02.00
CHAPTER 2 FUNCTIONS
Figure 2-113. Output Example of SFR
SFR name
Value
Type (Byte Size)
Address
------------------------------------------------------------Category name
-SFR name
Value
Type (Byte Size)
Address
:
:
:
:
2.9.4
Display/change global variables/static variables
Global variables or static variables are displayed and its values can be changed in the Watch panel.
Register the variables to display/modify their values to the Watch panel as the watch-expressions.
For details, see "2.9.6 Display/change watch-expressions".
2.9.5
Display/change local variables
Contents of local variables can be displayed and its values can be changed in the Local Variables panel below.
Select the [View] menu >> [Local Variable].
Specify the scope in the scope area to display the contents of the target local variable.
In the Local Variables panel, the name of local variables and functions are displayed. The argument of the function is
also displayed as the local variable.
For details on the contents and function in each area, see the section for the Local Variables panel.
Figure 2-114. Display the Contents of Local Variables (Local Variables Panel)
Toolbar
Scope area
[Name] area
Caution
[Value] area
[Type (Byte Size)] area
[Address] area
Nothing is displayed on this panel during execution of a program.
When the program is stopped, items in each area are displayed.
This section describes the following.
(1) Change display format of values
(2) Modify the contents of local variables
(3) Save the contents of local variables
(1) Change display format of values
The display format of the [value] area can be changed using buttons below on the toolbar.
R20UT2867EJ0100 Rev.1.00
Feb 01, 2014
Page 112 of 572
CubeSuite+ V2.02.00
Notation
CHAPTER 2 FUNCTIONS
The following buttons to change the notation of a data value are displayed.
Displays values on this panel in the default notation according to the type of variable (default).
Displays values on this panel in hexadecimal number.
Displays values on this panel in decimal number.
Displays values on this panel in octal number.
Displays values on this panel in binary number.
Displays array indexes on this panel in decimal number (default).
Displays array indexes on this panel in hexadecimal number.
Displays values on this panel in Float.
Note that when the value is not 4-byte data, or has the type information, displays it in the default notation.
Displays values on this panel in Double.
Note that when the value is not 4-byte data, or has the type information, displays it in the default notation.
Adds the value in hexadecimal number enclosing with "()" at the end of the value.
Encoding
The following buttons to change the encoding of character variables are displayed.
Displays character variables in ASCII code (default).
Displays character variables in Shift_JIS code.
Displays character variables in EUC-JP code.
Displays character variables in UTF-8 code.
Displays character variables in UTF-16 code.
(2) Modify the contents of local variables
Values and arguments of local variables can be edited.
Select the value of the local variables/arguments to edit in the [Value] area, then click on it again to switch the value
to edit mode (press the [Esc] key to cancel the edit mode).
To write the edited value to the target memory, directly enter the value from the keyboard then press the [Enter]
key. At this time, the edited value is checked and if it is incompatible with the type, the editing is invalidated.
Caution
This operation cannot be performed during program execution.
Remarks 1.
If a number with fewer digits than the size of the variable is entered, the higher-order digits will be
padded with zeroes.
2.
If a number with more digits than the size of the variable is entered, the higher-order digits will be
masked.
3.
If the display format of a character array (type char or unsigned char) is set to ASCII, then the value
can also be entered as a string (ASCII/Shift_JIS/EUC-JP/Unicode (UTF-8/UTF-16)).
4.
ASCII characters can be entered to values of local variables.
- Entering via an ASCII character
In the [Value] area for the variable "ch", enter "'A'"
>> "0x41" will be written to the memory area allocated to "ch"
- Entering via a numeric value
In the [Value] area for the variable "ch", enter "0x41"
>> "0x41" will be written to the memory area allocated to "ch"
R20UT2867EJ0100 Rev.1.00
Feb 01, 2014
Page 113 of 572
CubeSuite+ V2.02.00
CHAPTER 2 FUNCTIONS
- Entering via an ASCII string
Set the display format of character array "str" to ASCII, and in the [Value] area, enter ""ABC""
>> "0x41, 0x42, 0x43, 0x00" will be written to the memory area allocated to "str"
(3) Save the contents of local variables
The Save As dialog box can be opened by selecting the [File] menu >> [Save Local Variables Data As...], and all
the contents in the local variables can be saved in a text file (*.txt) or CSV file (*.csv).
When saving to files, retrieve the latest information from the debug tool. If arrays, pointer type variables,
structures/unions, and CPU registers (only those with the part name) are displayed expanded, the value of each
expanded element is also saved. When they are not expanded, "+" mark is added on the top of the item and the
value becomes blank.
Figure 2-115. Output Example of Local Variables
Scope : Current scope
[V]Variable [P]Parameter [F]Function
Name
Value
Type (Byte Size)
Address
-------------------------------------------------------[V]Variable name[1]
Value
Type
Address
- [V]Variable name[0]
Value
Type
Address
:
:
:
:
2.9.6
Display/change watch-expressions
By registering C language variables, CPU register, SFR, and assembler symbols to the Watch panel as watchexpressions, you can always retrieve their values from the debug tool and monitor the values in batch.
The values of watch-expressions can be updated during the program is in execution (see "(7) Display/modify the
contents of watch-expressions during program execution").
Select the [View] menu >> [Watch] >> [Watch1 - 4] to open the Watch panel.
The Watch panel can be opened up to 4 panels. Each panel is identified by the names "Watch1", "Watch2", "Watch3"
and "Watch4" on the titlebar, and the watch-expressions can be registered/deleted/moved individually, and they are
saved as the user information of the project.
For details on the contents and function in each area, see the section for the Watch panel.
Figure 2-116. Display the Contents of Watch-Expression (Watch Panel)
Toolbar
[Watch] area
[Value] area
[Type (Byte Size)] area
[Address] area
[Memo] area
This section describes the following.
(1) Register a watch-expression
R20UT2867EJ0100 Rev.1.00
Feb 01, 2014
Page 114 of 572
CubeSuite+ V2.02.00
CHAPTER 2 FUNCTIONS
(2) Organize the registered watch-expressions
(3) Edit the registered watch-expressions
(4) Delete a watch-expression
(5) Change display format of values
(6) Modify the contents of watch-expressions
(7) Display/modify the contents of watch-expressions during program execution
(8) Export/import watch-expressions
(9) Save the contents of watch-expressions
(1) Register a watch-expression
There are three ways as follows to register watch-expressions (watch-expressions are not registered as default).
Caution
Watch-expressions can be registered up to 128 in one watch panel (if this restriction is violated,
a message appears).
Remarks 1.
Each watch-expression registered in each watch panel (Watch1 to Watch4) is managed in each
panel and saved as the user information of the project.
2.
More than one watch-expression with the same name can be registered.
(a) Register from other panels
Watch-expressions can be registered from other panel in CubeSuite+.
In other panel, drag and drop the watch-expression to register in any watch panel (Watch1 to Watch4).
For the relationship between panels that can use this operation and targets that can be registered as watchexpressions, see "Table A-4. Relationship between Panels and Targets That Can be Registered as WatchExpressions".
Figure 2-117. Registering Watch-Expressions from Other Panels
Here, the variable "m_minute" in the Disassemble
panel will be registered as a watch-expression.
Drag and drop on the Watch panel after selecting the
variable "m_minute" in the Disassemble panel.
Remark
You can also add a watch-expression by doing the following. First, select the target for which you
wish to register a watch-expression, or move the caret to one of the target strings (the target is
determined automatically). Next, from the context menu, select [Register Watch1] (but this is
limited to the Watch panel (Watch 1)).
R20UT2867EJ0100 Rev.1.00
Feb 01, 2014
Page 115 of 572
CubeSuite+ V2.02.00
CHAPTER 2 FUNCTIONS
(b) Directly register in the Watch panel
Click the
button in the toolbar in any the Watch panel (Watch1 to Watch4) to display the following entry
box in the [Watch] area.
Figure 2-118. Entry Box of Watch-Expression
Directly enter a watch-expression in this area.
Directly input a watch-expression from the keyboard in the entry box then press the [Enter] key.
For the input forms of watch-expressions entered this way, see the tables listed below.
- "Table A-5. Input Format of Watch-Expression"
- "Table A-6. Scope Specification of C language Used with Watch-Expression Registration"
- "Table A-7. Scope Specification of CPU Register with Watch-Expression Registration"
- "Table A-8. Scope Specification of SFR with Watch-Expression Registration"
Remark
A symbol name at the current caret position can be complemented by pressing the [Ctrl] + [Space]
key in this area (see "2.19.2 Symbol name completion function").
(c) Register from other application
Select the character strings of C language variables/CPU registers/SFR/assembler symbols from an external
editor and drag and drop it in the Watch panel (Watch 1 to Watch 4).
The dropped character strings are registered as a watch-expression.
(2) Organize the registered watch-expressions
Registered watch-expressions can be organized in categories (folders) and displayed in tree view (there is no
category as default).
Cautions 1.
2.
Categories cannot be created within categories.
Up to 64 categories can be created in one watch panel (if this restriction is violated, a
message appears).
(a) Create new category
Move the caret to the position to create a new category then click the
button in the toolbar and directly
enter the new category name.
(b) Edit category name
Click the category name to edit, and click it again, then directly modify the category name from the keyboard.
(c) Delete categories
Select categories to delete then click the
R20UT2867EJ0100 Rev.1.00
Feb 01, 2014
button in the toolbar.
Page 116 of 572
CubeSuite+ V2.02.00
CHAPTER 2 FUNCTIONS
(d) Change the display order
Registered watch-expressions are categorized when they are dragged and dropped in the category.
Also, the display order of the categories and the watch-expressions (upper or lower position) can be changed
easily by drag and drop operation.
Remark
Drag and drop the watch-expressions/categories in other watch panel (Watch1 to Watch4) to copy
them.
(3) Edit the registered watch-expressions
Registered watch-expressions can be edited.
Double-click the watch-expression to edit to switch the watch-expression to edit mode (press the [Esc] key to
cancel the edit mode).
Directly edit from the keyboard and then press the [Enter] key.
(4) Delete a watch-expression
To delete watch-expressions, select the one you want to delete in the Watch panel then click the
button in the
toolbar.
(5) Change display format of values
The display format of the [value] area can be changed using buttons below on the toolbar.
Notation
The following buttons to change the notation of a data value are displayed.
Displays the value of the selected watch-expression in the default notation (see "Table A-9. Display
Format of Watch-Expressions (Default)") according the type of variable (default).
Displays the value of the selected item in hexadecimal number.
Displays the value of the selected item in signed decimal number.
Displays the value of the selected item in unsigned decimal number.
Displays the value of the selected item in octal number.
Displays the value of the selected item in binary number.
Displays the value of the selected item in ASCII code.
Displays the value of the selected item in Float.
Note that this item becomes valid only when the selected watch-expression value is 4-byte data.
Displays the value of the selected item in Double.
Note that this item becomes valid only when the selected watch-expression value is 8-byte data.
Adds the value in hexadecimal number enclosing with "()" at the end of the value of the selected item
(except the item displayed in hexadecimal number).
(6) Modify the contents of watch-expressions
The values of watch-expressions can be edited.
Double-click the value of the watch-expression to edit in the [Value] area to switch the value to edit mode (press the
[Esc] key to cancel the edit mode).
To write the edited value to the target memory, directly enter the value from the keyboard then press the [Enter]
key.
Note that only those values that correspond one by one to variables of C language, CPU registers, SFR or
assembler symbols can be edited. In addition, read-only SFR values cannot be edited.
This operation can be taken place while the program is in execution. See "(4) Display/modify the memory
contents during program execution" for details on how to operate it.
R20UT2867EJ0100 Rev.1.00
Feb 01, 2014
Page 117 of 572
CubeSuite+ V2.02.00
Remarks 1.
CHAPTER 2 FUNCTIONS
If a number with fewer digits than the size of the variable is entered, the higher-order digits will be
padded with zeroes.
2.
If a number with more digits than the size of the variable is entered, the higher-order digits will be
masked.
3.
If the display format of a character array (type char or unsigned char) is set to ASCII, then the value
can also be entered as a string (ASCII/Shift_JIS/EUC-JP/Unicode (UTF-8/UTF-16)).
4.
ASCII characters can be entered to values of watch-expressions.
- Entering via an ASCII character
In the [Value] area for the variable "ch", enter "'A'"
>> "0x41" will be written to the memory area allocated to "ch"
- Entering via a numeric value
In the [Value] area for the variable "ch", enter "0x41"
>> "0x41" will be written to the memory area allocated to "ch"
- Entering via an ASCII string
Set the display format of character array "str" to ASCII, and in the [Value] area, enter ""ABC""
>> "0x41, 0x42, 0x43, 0x00" will be written to the memory area allocated to "str"
(7) Display/modify the contents of watch-expressions during program execution
The Memory panel/Watch panel has the real-time display update function that can update/modify the display
contents of the memory/watch-expression in real-time while executing the program.
Using the real-time display update function allows you to display/modify the value of memory/watch-expression not
only while the program is stopped, but also in execution.
See "(4) Display/modify the memory contents during program execution" for details on how to operate it.
(8) Export/import watch-expressions
This feature is for the export of currently registered watch-expressions to a file and the importing of such files,
enabling the re-registration of watch-expressions.
To do this, follow the procedure described below.
(a) Export watch-expressions
Save watch-expressions currently being registered (including categories) in a file format that is possible to
import.
With the Watch panel in focus, select [Save Watch Data As...] from the [File] menu.
On the Save As dialog box that is automatically opened, specify the following items, and then click the [Save]
button.
- [File name]:
Specify the name of a file to be saved (the file extension must be "csv").
- [Save as type]:
Select "Importable CSV (Comma-Separated Variables)(*.csv)"
Caution
Neither values nor the type information of watch-expressions can be saved.
Items that are expanded after analyzing watch-expressions (i.e. an array, structure, and so
on) cannot be saved.
R20UT2867EJ0100 Rev.1.00
Feb 01, 2014
Page 118 of 572
CubeSuite+ V2.02.00
CHAPTER 2 FUNCTIONS
Figure 2-119. Export of Watch-Expressions
(b) Import watch-expressions
Import the file that exported in (a) to the Watch panel.
On the Watch panel to which you want to import watch-expressions, select [Import Watch Expression] from the
context menu.
On the Open Watch Expression Data File dialog box that is automatically opened, specify the file that exported
previously, and then click the [Open] button.
Remark
If watch-expressions have been already registered, then imported watch-expressions will be
registered at the bottom of them.
Figure 2-120. Import of Watch-Expressions
R20UT2867EJ0100 Rev.1.00
Feb 01, 2014
Page 119 of 572
CubeSuite+ V2.02.00
CHAPTER 2 FUNCTIONS
(9) Save the contents of watch-expressions
By selecting the [File] menu >> [Save Watch Data As...], the Save As dialog box can be opened, and all the
contents of the watch-expression and its value can be saved in a text file (*.txt) or CSV file (*.csv).
When saving the contents to the file, all the values of the watch-expression are reacquired and save the latest
values acquired.
If arrays, pointer type variables, structures/unions, and CPU registers (only those with the part name) are displayed
expanded, the value of each expanded element is also saved. When they are not expanded, "+" mark is added on
the top of the item and the value becomes blank.
Note that the values of read-protected SFR are not re-read. If you want to save the latest values of those, select
[Force Read Value] from the context menu then save the file.
Figure 2-121. Output Example of Watch Data
Watch-expression
Value
Type(Byte Size)
Address
Memo
-----------------------------------------------------------------Watch-expression
Value
Type(Byte Size)
Address
Memo
-Category name
Watch-expression Value
Type(Byte Size)
Address
Memo
:
Remark
:
:
:
:
When the contents of the panel are overwritten by selecting the [File] menu >> [Save Watch Data],
each watch panel (Watch1 to Watch4) is treated as a different panel.
R20UT2867EJ0100 Rev.1.00
Feb 01, 2014
Page 120 of 572
CubeSuite+ V2.02.00
2.10
CHAPTER 2 FUNCTIONS
Display Information on Function Call from Stack
This section describes how to show the information on function call from the stack.
The CubeSuite+ compiler (CA78K0R) pushes function-call information onto the stack, in accordance with the ANSI
standard.
It is thus possible to learn the function call depth, the location of the caller, parameters, and other information by
analyzing the function-call information.
This "function-call information" is called the call stack information; this term will be used in the rest of this document.
2.10.1
Display call stack information
Call stack information is displayed in the Call Stack panel below.
Select the [View] menu >> [Call Stack].
For details on the contents and function in each area, see the section for the Call Stack panel.
Cautions 1.
Nothing is displayed on this panel during execution of a program.
When the program is stopped, items in each area are displayed.
2.
Except for [Simulator]
If step execution is performed in source level, CubeSuite+ determines whether an interrupt is
being processed via the NP, EP, and ID flags in the PSW register. For this reason, if the above
register or flags are changed (e.g. when using multiple interrupts), then call stack information
may be incorrect.
Figure 2-122. Display Call Stack Information (Call Stack Panel)
Toolbar
[Depth] area
[Call Stack] area
This section describes the following.
(1) Change display format of values
(2) Jump to the source line
(3) Display local variables
(4) Save the contents of call stack information
(1) Change display format of values
The display format of this panel can be changed using buttons below on the toolbar.
Note that these buttons are disabled during execution of a program.
R20UT2867EJ0100 Rev.1.00
Feb 01, 2014
Page 121 of 572
CubeSuite+ V2.02.00
Notation
CHAPTER 2 FUNCTIONS
The following buttons to change the notation of a data value are displayed.
Displays values on this panel in the default notation according to the type of variable (default).
Displays values on this panel in hexadecimal number.
Displays values on this panel in decimal number.
Displays values on this panel in octal number.
Displays values on this panel in binary number.
Encoding
The following buttons to change the encoding of character variables are displayed.
Displays character variables in ASCII code (default).
Displays character variables in Shift_JIS code.
Displays character variables in EUC-JP code.
Displays character variables in UTF-8 code.
Displays character variables in UTF-16 code.
(2) Jump to the source line
Double-clicking on the line will open the Editor panel with the caret moved to the source line of the calling function
indicated by the selected line (If the panel is already open, the screen will jump to the editor panel).
Remark
Selecting [Jump to Disassemble] from the context menu will open the Disassemble panel (Disassemble
1) with the caret moved to address of the calling function indicated by the selected line (If the panel is
already open, the screen will jump to the Disassemble panel (Disassemble 1)).
(3) Display local variables
Selecting [Jump to Local Variable at This Time] from the context menu will open the Local Variables panel that
displays the local variables indicated by the currently selected line.
(4) Save the contents of call stack information
By selecting the [File] menu >> [Save Call Stack Data As...], the Save As dialog box can be opened, and all the
contents in the call stack information can be saved in a text file (*.txt) or CSV file (*.csv).
When saving to files, retrieve the latest information from the debug tool.
Figure 2-123. Output Example of Call Stack Information
Depth
Call stack
---------------------------------------------------------------------0
Call stack information
1
Call stack information
:
:
Note If old information has been obtained from stack data that has lost its reliability, the information on that line is
shown in parentheses "( )".
R20UT2867EJ0100 Rev.1.00
Feb 01, 2014
Page 122 of 572
CubeSuite+ V2.02.00
2.11
CHAPTER 2 FUNCTIONS
Collect Execution History of Programs
This section describes how to collect the execution history of the program.
A history of program execution is generally called a trace; this term will be used in the remainder of this document.
It is nearly impossible to find the cause of runaway program execution from the memory contents, stack information,
and the like after the runaway has occurred. The collected trace data, however, can be used to trace program execution
up to the runaway directly, making this an effective tool for discovering hidden bugs.
Cautions 1.
[E1][E20][EZ Emulator]
The trace function is supported only when the selected microcontroller incorporates the OCD
trace function.
2.
[Simulator]
4 bytes of the final address of the code flash area (when a code flash area is 0x0 - 0x1FFFFF,
0x1FFFC - 1FFFFF corresponds to it) and the RAM area which can be fetched cannot be fetched
(a message of "Stopped by accessing to no map area." will appear).
2.11.1
Configure the trace operation
When the trace function starts, trace data which has recorded in it an execution history of the currently executed
program is collected in trace memory (when program execution stops, the trace function also automatically stops).
Before the trace function can be used, it is necessary to make settings relating to the operation of a trace.
Note that the method on how to set differs depending on the debug tool used.
(1) [IECUBE]
(2) [E1]/[E20]/[EZ Emulator]
(3) [Simulator]
(1) [IECUBE]
This trace operation can be configured in the [Trace] category on the [Debug Tool Settings] tab in the Property
panel.
Figure 2-124. [Trace] Category [IECUBE]
(a) [Clear trace memory before running]
Select whether to clear (initialize) the trace memory before tracing starts in this property.
Select [Yes] to clear the memory (default).
Remark
You can forcibly clear the trace memory when clicking the
button in the toolbar in the Trace
panel.
(b) [Operation after trace memory is full]
Select the operation after the trace memory is full with the collected trace data, from the following drop-down
list.
The trace memory size is 128K frames (fixed).
R20UT2867EJ0100 Rev.1.00
Feb 01, 2014
Page 123 of 572
CubeSuite+ V2.02.00
CHAPTER 2 FUNCTIONS
Non stop and overwrite to
Continues overwriting the older trace data after the trace memory is full (default).
trace memory
When the [Clear trace memory before running] property is set to [Yes], at the time of a
resumption, trace data is collected after clearing the trace memory.
Stop trace
When the trace memory is full, CubeSuite+ stops writing trace data (the program does
not stop execution).
Stop
When the trace memory is full, CubeSuite+ stops writing trace data and the program
stops execution.
(c) [Rate of frequency division of trace time tag]
Specify the frequency division ratio of the counter to be used for time tag display (i.e. display of the [Time] item
in the Trace panel) (default: [1/1(4ns/0.3min)]).
Remark
Values in "()" on the dorop-down list indicate the resolution and the maximum measurement time
when using a external clock of 240 MHz.
(2) [E1]/[E20]/[EZ Emulator]
This trace operation can be configured in the [Trace] category on the [Debug Tool Settings] tab of the Property
panel.
Caution
This category appears only when the selected microcontroller incorporates the OCD trace
function.
Figure 2-125. [Trace] Category [E1][E20][EZ Emulator]
(a) [Use trace function]
Select whether to use trace function.
Select [Yes] to use the trace function (default: [No]).
(b) [Operation after trace memory is full]
Select the operation after the trace memory is full with the collected trace data, from the following drop-down
list.
Non stop and overwrite to
Continues overwriting the older trace data after the trace memory is full (default).
trace memory
Stop trace
When the trace memory is full, CubeSuite+ stops writing trace data (the program does
not stop execution).
(c) [Trace memory size[frames]]
The size of trace memory (i.e. the number of trace frames) is displayed.
You cannot change the value of this property.
The trace frame is a unit of trace data. One trace frame is used for each operation in fetch/write/read.
Operation specifications of the OCD trace function are as follows:
R20UT2867EJ0100 Rev.1.00
Feb 01, 2014
Page 124 of 572
CubeSuite+ V2.02.00
CHAPTER 2 FUNCTIONS
Table 2-12. Operation Specifications of OCD Trace Function
Item
Description
Clearing the trace
memory
The trace memory is cleared when:
- The program is executed.
- The external reset signal is generated (the internal reset signal does not cause clearing
the trace memory).
Operation after the trace
The trace full break is not supported.
memory is full
Target of trace data
Branch origin instructions (internal ROM only)
For a branch instruction with a condition, it will be traced only when the condition is met.
Complement display of instructions between branch instructions cannot be performed.
Note that, for the following instructions, an instruction of the next address of its correct
position will be displayed.
- BT ES:[HL].bit, $addr20
- BF ES:[HL].bit, $addr20
- BTCLR ES:[HL].bit, $addr20
The following items are supported on the Trace panel.
- [Number]
- [Line/Address]
- [Source/Disassemble]
Trace event
See "2.15.7 Notes for setting events".
Notes
The following items cannot be traced.
- Interrupt vectors
- Instructions during a step execution
- Skip instructions with a condition
(3) [Simulator]
This trace operation can be configured in the [Trace] category on the [Debug Tool Settings] tab of the Property
panel.
Figure 2-126. [Trace] Category [Simulator]
(a) [Use trace function]
Select whether to use trace function.
Select [Yes] to use the trace function (default: [No]).
(b) [Clear trace memory before running]
Select whether to clear (initialize) the trace memory before tracing starts.
Select [Yes] to clear the memory (default).
Remark
You can forcibly clear the trace memory when clicking the
button in the toolbar in the Trace
panel.
R20UT2867EJ0100 Rev.1.00
Feb 01, 2014
Page 125 of 572
CubeSuite+ V2.02.00
CHAPTER 2 FUNCTIONS
(c) [Operation after trace memory is full]
Select the operation after the trace memory is full with the collected trace data, from the following drop-down
list.
Non stop and overwrite to
Continues overwriting the older trace data after the trace memory is full (default).
trace memory
When the [Clear trace memory before running] property is set to [Yes], at the time of a
resumption, the trace data is collected after clearing the trace memory.
Stop trace
When the trace memory is full, CubeSuite+ stops writing trace data (the program does
not stop execution).
Stop
When the trace memory is full, CubeSuite+ stops writing trace data and the program
stops execution.
(d) [Accumulate trace time]
Select whether to display the trace time with accumulated time.
Specify [Yew] to display trace time with accumulated time. Specify [No] to display the trace time with
differential time (default).
(e) [Trace memory size[frames]]
Selectt the trace memory size (trace frame number) (default: [4K]).
The trace frame is a unit of trace data. One trace frame is used for each operation in fetch/write/read.
2.11.2
Collect execution history until stop of the execution
In the debug tool, there is a function to collect the execution history from the start of program execution to the stop.
Therefore, the trace data collection is automatically started when the program starts executing and stopped when the
program stops.
See "2.11.6 Display the collected execution history" for how to check the collected trace data.
Remark
This function is actuated by an Unconditional Trace event, one of the built-in events that are set in the
debug tool by default.
Consequently, if the Unconditional Trace event is set to Invalid state by clearing the check box in the Events
panel, trace data linked to the start of program execution will not be collected (the Unconditional Trace
event is set to Valid state by default).
Note that Unconditional Trace event and Trace event described later (see "2.11.3 Collect execution history
in the arbitrary section") are used exclusively of each other. Therefore, if Trace event with Valid state is set,
Unconditional Trace event is automatically set to Invalid state.
2.11.3
Collect execution history in the arbitrary section
The execution history is collected as trace data only for the arbitrary section while the program is in execution by setting
a Trace event.
This Trace event consists of a trace start event and a trace end event.
To use this function, follow the procedure described below.
(1) Set a Trace event
(2) Execute the program
(3) Edit a Trace event
(4) Delete a Trace event
Cautions 1.
Also see "2.15.7 Notes for setting events" for details on Trace events (e.g. limits on the number
of enabled events).
R20UT2867EJ0100 Rev.1.00
Feb 01, 2014
Page 126 of 572
CubeSuite+ V2.02.00
2.
CHAPTER 2 FUNCTIONS
The event type (execution type/access type) that can be set as trace start and end events differ
with each debug tool used.
3.
[Simulator]
Trace start events and trace stop events cannot be set/deleted while a tracer is running.
(1) Set a Trace event
To set a Trace event, set a trace start event and a trace end event that starts/stops collecting the trace data.
Use one of the following methods to set a trace start event and a trace end event.
(a) For execution-related events
By setting execution-related events for a trace start event and a trace end event, it is possible to start and stop
the collection of trace data at any place.
Perform this operation in the Editor panel/Disassemble panel in which the source text/disassembly text is
displayed.
Follow the operation listed below from the context menu, in accordance with your desired event type, after
moving the caret to the target line that has a valid address.
Event Type
Operation
Trace start
Select [Trace Settings] >> [Start Tracing]
Trace end
Select [Trace Settings] >> [Stop Tracing]
Caution
[Simulator]
Simulator will not display a trace end event as the results of a trace. For this reason, set a
trace end event to one line below the range that you wish to display as the trace data.
A trace start event or a trace end event is set to the instruction at the start address corresponding to the line of
the caret position.
Once a trace start event or a trace end event is set, the following event mark is displayed in the event area of
the line that an event is set.
Table 2-13. Event Marks of Trace Start Event and Trace End Events
Event Type
Event Mark
Trace start
Trace end
Figure 2-127. Trace Start and Trace End Events Setting Example (Disassemble Panel)
Event area
Indicates that a trace start
event has been set.
Indicates that a trace end
event has been set.
R20UT2867EJ0100 Rev.1.00
Feb 01, 2014
Page 127 of 572
CubeSuite+ V2.02.00
CHAPTER 2 FUNCTIONS
(b) For access-related events [E1][E20]
By setting access-related events for a trace start event and a trace end event, it is possible to start and stop
the collection of trace data when a specified access is made to any variable or SFR.
Remark
The types of access that can be set by using methods described here are only a read/write (see
“Table 2-6. Types of Accesses to Variables“). To change the access type to a read or write, after
setting trace start and end events, edit their [access type] item (see "(2) Edit access-related
events").
<1> To set events for variables or SFR in the Editor panel/Disassemble panel
Perform this operation in the Editor panel/Disassemble panel in which the source text/disassembly text is
displayed.
Follow the operation listed below from the context menu, in accordance with your desired event type,
after selecting an arbitrary variable or SFR on the source text/disassembled text. Note, however, that
only global variables, static variables inside functions, and file-internal static variables can be used.
Event Type
Operation
Trace start
Select [Trace Settings] >> [Record Start R/W Value], and then press the [Enter] key.
Trace end
Select [Trace Settings] >> [Record End R/W Value], and then press the [Enter] key.
At this time, if you have specified a value in the text box in the context menu, collection of trace data is
started or finished only when a read/write is performed with a specified value. On the other hand, if no
value is specified, reading/writing the selected variable or SFR by any value will cause the break to
occur.
Cautions 1.
2.
Variables within the current scope can be specified.
Variables or SFR at lines that have no valid addresses cannot be used for trace
start events and trace end events.
<2> To set events for registered watch-expressions
Perform this operation in the Watch panel.
Follow the operation listed below from the context menu after selecting the registered watch-expression
(multiple selections not allowed).
Note, however, that only global variables, static variables inside functions, file-internal static variables,
and SFR can be used.
Event Type
Operation
Trace start
Select [Trace Output] >> [Record Start R/W Value], and then press the [Enter] key.
Trace end
Select [Trace Output] >> [Record End R/W Value], and then press the [Enter] key.
At this time, if you have specified a value in the text box in the context menu, collection of trace data is
started or finished only when a read/write is performed with a specified watch-expression. On the other
hand, if no value is specified, reading/writing the selected watch-expression by any value will cause the
break to occur.
Caution
A watch-expression within the current scope can be specified.
To target a watch-expression outside the current scope, select a watch-expression
with a specified scope.
R20UT2867EJ0100 Rev.1.00
Feb 01, 2014
Page 128 of 572
CubeSuite+ V2.02.00
CHAPTER 2 FUNCTIONS
When a trace start event and a trace end event are set, they are managed collectively on the Events panel as one
instance of a Trace event (see "2.15 Manage Events"). When you click the "+" mark at a Trace event item,
detailed information on the trace start event and the trace end event you have set is displayed.
Figure 2-128. Example of Trace Start and Trace End Events (Execution Type) in Events Panel
Remarks 1.
If either one of a trace start event and a trace end event is set as Valid state, the check box of
Unconditional Trace event in the Events panel is automatically cleared, therefore, trace data
collection does not automatically start with the start of the program execution (the tracer will not run
until the condition of the trace start event that has been set is met).
2.
A trace end event is not indispensable for a Trace event.
3.
Event marks differ depending on the event state (see "2.15.1 Change the state of set events
(valid/invalid)").
When an event is set at the point which other event is already set, the event mark (
) is
displayed meaning more than one event is set at the point.
4.
[Simulator]
If either one of a trace start event and a trace end event is set to Valid state, the [Use trace
function] property in the [Trace] category on the [Debug Tool Settings] tab of the Property panel is
automatically set to [Yes] and the trace function will be enabled.
(2) Execute the program
Execute the program (see "2.7 Execute Programs").
Collection of trace data is started or finished when the condition set for a trace start event or a trace end event is
met.
See "2.11.6 Display the collected execution history" for how to check the collected trace data.
(3) Edit a Trace event
It is possible to edit a trace start event or a trace end event you have set.
For details on how to do it, see "(1) Edit execution-related events" or "(2) Edit access-related events".
(4) Delete a Trace event
To delete a Trace event you have set, on the Editor panel/Disassemble panel, right-click the event mark in the
event area and select [Delete Event] from the context menu that is displayed.
Also, there is another way to delete a set event. Select the Trace event you want to delete on the Events panel,
and then click the
button in the toolbar (see "2.15.5 Delete events").
R20UT2867EJ0100 Rev.1.00
Feb 01, 2014
Page 129 of 572
CubeSuite+ V2.02.00
Caution
CHAPTER 2 FUNCTIONS
It is not possible to delete only a trace start event or a trace end event (i.e. if either a trace start
event or a trace end event is deleted from the event marks on the event area, all of the
corresponding event marks are deleted).
2.11.4
Collect execution history only when the condition is met [IECUBE][Simulator]
The program execution history can be collected only when a condition is met.
By setting a Point Trace event, the execution history is collected as trace data only when an arbitrary variable or SFR is
accessed with the specified type.
To use this function, follow the procedure described below.
(1) Set a Point Trace event
(2) Execute the program
(3) Edit a Point Trace event
(4) Delete a Point Trace event
Caution
[E1][E20][EZ Emulator]
This function is not supported.
(1) Set a Point Trace event
Use one of the following methods to set a Point Trace event.
Cautions 1.
Also see "2.15.7 Notes for setting events" for details on Point Trace events (e.g. limits on
the number of enabled events).
2.
[IECUBE]
Point Trace events cannot be set for 32-bit (4-byte) variables.
Additionally, see "(c) For access to a variable/SFR of 16-bit (2-byte) size [IECUBE]" for
setting of Point Trace events for 16-bit (2-byte) variables.
3.
[Simulator]
Point Trace events cannot be set/deleted while a tracer is running.
Remarks 1.
[IECUBE]
Accesses via DMA can be traced.
2.
[Simulator]
When a Point Trace event is set to Valid state, the [Use trace function] property in the [Trace]
category on the [Debug Tool Settings] tab of the Property panel is automatically set to [Yes] and the
trace function will be enabled.
(a) For access to a variable/SFR on the Editor panel/Disassemble panel
Perform this operation in the Editor panel/Disassemble panel in which the source text/disassembly text is
displayed.
Follow the operation listed below from the context menu, in accordance with your desired access type, after
selecting the variable or SFR as the subject to access.
Note, however, that only global variables, static variables inside functions, and file-internal static variables can
be used.
Access Type
Operation
Read
Select [Trace Settings] >> [Record Reading Value].
Write
Select [Trace Settings] >> [Record Writing Value].
Read/Write
Select [Trace Settings] >> [Record R/W Value].
R20UT2867EJ0100 Rev.1.00
Feb 01, 2014
Page 130 of 572
CubeSuite+ V2.02.00
Caution
CHAPTER 2 FUNCTIONS
Variables within the current scope can be specified.
(b) For access to a registered watch-expression
Perform this operation in the Watch panel.
Select the watch-expression as the subject to access and perform the following operation from the context
menu.
Note, however, that only global variables, static variables inside functions, file-internal static variables, and
SFR can be used.
Access Type
Operation
Read
Select [Trace Output] >> [Record Reading Value].
Write
Select [Trace Output] >> [Record Writing Value].
Read/Write
Select [Trace Output] >> [Record R/W Value].
Caution
A watch-expression within the current scope can be specified.
To target a watch-expression outside the current scope, select a watch-expression with a
specified scope.
(c) For access to a variable/SFR of 16-bit (2-byte) size [IECUBE]
If you want to set a Point Trace event to a variable/SFR of 16-bit (2-byte) size when using IECUBE, register
each address of the higher 8-bit and the lower 8-bit of the variable/SFR in the Watch panel directly as watchexpressions (see "(1) Register a watch-expression").
Then, set a Point Trace event to each watch-expression by using the method described in "(b) For access to
a registered watch-expression".
Figure 2-129. How to Set Point Trace Event for 16-bit (2-byte) Variable/SFR [IECUBE]
This example shows how to set a Point Trace event for the 2-byte SFR (ADCR).
Directly register 0xfff1e (lower 8-bit address) and 0xfff1f (higher 8-bit address) as
watch-expressions, and then set a Point Trace event to each watch-expression.
By performing the above operation, it is interpreted as if a Point Trace event has been set at the target variable/
SFR/watch-expression, and it is managed in the Events panel (see "2.15 Manage Events" for details).
R20UT2867EJ0100 Rev.1.00
Feb 01, 2014
Page 131 of 572
CubeSuite+ V2.02.00
CHAPTER 2 FUNCTIONS
Figure 2-130. Example of Setting Point Trace Event in Events Panel
(2) Execute the program
Execute the program (see "2.7 Execute Programs").
If the conditions for a Point Trace event that you have set are met while the program is executing, that information
is collected as trace data.
See "2.11.6 Display the collected execution history" for details on checking trace data.
Figure 2-131. Example of Point Trace Event Results View
Example of the result of the point trace
event with read-access to the variable
"global_a".
Figure 2-132. Example of Point Trace Event Results View (For 16-bit (2-byte) Variable/SFR) [IECUBE]
Example of the result of the Pint Trace event
with read-access to the 2-byte SFR (ADCR).
An access address of trace shows
The data is displayed
a defined SFR name or address.
each 1 byte.
(3) Edit a Point Trace event
It is possible to edit a Point Trace event you have set.
For details on how to do it, see "(2) Edit access-related events".
R20UT2867EJ0100 Rev.1.00
Feb 01, 2014
Page 132 of 572
CubeSuite+ V2.02.00
CHAPTER 2 FUNCTIONS
(4) Delete a Point Trace event
To delete a Point Trace event you have set, select the Point Trace event you want to delete on the Events panel,
and then click the
2.11.5
button in the toolbar (see "2.15.5 Delete events").
Stop/restart collection of execution history [IECUBE][Simulator]
It is possible to temporarily stop or restart the collection of execution history during program execution.
(1) Stop collection of execution history temporarily
By clicking the
button on the toolbar in the Trace panel during program execution, it is possible to temporarily
stop collection of trace data without stopping program execution.
Use this function when you want to stop only the trace function without halting the program and check the trace
data that has been collected until you stop it.
(2) Restart collection of execution history
If you have halted the trace function during program execution, you can start collection of trace data again by
clicking the
button on the toolbar in the Trace panel.
Note that the trace data that has been collected before you restart is cleared once.
2.11.6
Display the collected execution history
The collected trace data is displayed in the Trace panel below.
Select the [View] menu >> [Trace].
The trace data displays by mixing the disassembled text and source text by default, but it is also possible to display
either one of these by selecting the Display mode.
For details on the contents and function in each area, see the section for the Trace panel.
Figure 2-133. Display Trace Data (Trace Panel)
Toolbar
[Number] area [Time (h:min:s,ms,μs,ns)] area [Line/Address] area
[Source/Disassemble] area
[Address] area [Data] area
This section describes the following.
(1) Change display mode
(2) Change display format of values
(3) Link with other panels
R20UT2867EJ0100 Rev.1.00
Feb 01, 2014
Page 133 of 572
CubeSuite+ V2.02.00
CHAPTER 2 FUNCTIONS
(1) Change display mode
Display mode can be changed to the purpose when clicking the buttons below in the toolbar.
Note that these buttons are disabled while the tracer is running.
Table 2-14. Display Modes of Trace Panel
Button
Display Mode
Mixed display mode
Displayed Content
Displays the instruction (disassemble results), labels, source text
(corresponding source line), point trace results [IECUBE][Simulator],
reset causes [IECUBE], and break causes (default).
Disassemble display mode
Displays the instruction (disassemble results), labels, point trace results
[IECUBE][Simulator], reset causes [IECUBE], and break causes.
Source display mode
Displays the source text (corresponding source line), reset causes
[IECUBE], and break causes.
However, when a place where no debugging information is present is
executed, "<No Debug Information>" is displayed.
Figure 2-134. Example of Source Display Mode View (Trace Panel)
(2) Change display format of values
The display format of the [Line Number/Address], [Address] [IECUBE][Simulator] and [Data]
[IECUBE][Simulator] area can be changed using buttons below on the toolbar.
Note that these buttons are disabled while the tracer is running.
Notation
The following buttons to change the notation of a data value are displayed.
Displays values on this panel in hexadecimal number (default).
Displays values on this panel in decimal number.
Displays values on this panel in octal number.
Displays values on this panel in binary number.
(3) Link with other panels
Items in the trace panel can be linked to other panels using the currently selected line address as a pointer
(window focus will not move).
Click the
button on the toolbar to start linking to the Editor panel. Click the
button on the toolbar to start
linking to the Disassemble panel.
If the button is clicked again, the link is disconnected.
R20UT2867EJ0100 Rev.1.00
Feb 01, 2014
Page 134 of 572
CubeSuite+ V2.02.00
Remark
CHAPTER 2 FUNCTIONS
The Editor panel/Disassemble panel opens when selecting the [Jump to Source]/[Jump to
Disassemble] from the context menu with moving the caret to the source line/address corresponding to
the address of the currently selected line (focus is moved).
2.11.7
Clear the trace memory
To clear the collected trace data contents, click the
button on the toolbar.
Note that this button is disabled while a tracer is running.
Remarks 1.
[IECUBE][Simulator]
When [Yes] is specified in the [Clear trace memory before running] property in the [Trace] category on
the [Debug Tool Settings] tab of the Property panel, the trace memory is cleared each time a program is
executed.
2.
[E1][E20][EZ Emulator]
The trace memory is cleared each time a program is executed (fixed).
2.11.8
Search the trace data
To search the collected trace data, click the
button to open the Trace Search dialog box (note that the search is
disabled during execution of a program).
In this dialog box, follow the steps below.
When the tab on the tab selection area is selected, the trace data can be searched in instruction level/source level.
Note however, that if you search the trace data at the instruction level, the display mode must be set in the Trace panel
to the Mixed display mode or Disassemble display mode.
When searching at the source level, the mode must be set to the Mixed display mode or Source display mode.
Figure 2-135. Search Trace Data (Trace Search Dialog Box)
Tab selection area
This section describes the following.
(1) Search in the instruction level
(2) Search in the source level
R20UT2867EJ0100 Rev.1.00
Feb 01, 2014
Page 135 of 572
CubeSuite+ V2.02.00
CHAPTER 2 FUNCTIONS
(1) Search in the instruction level
Search the trace data in the instruction level.
Select the [Instruction Level] tab and then follow the steps below.
Figure 2-136. Search Trace Data in Instruction Level
(a) Specify [Fetch Address]
Specify the fetch address if it is a required search parameter.
You can either type address expressions directly into the text boxes, or select it from the input history via the
drop-down list (up to 10 items).
The fetch address can also be specified as a range. In this case, specify a range by specifying address
expressions in both the left and right text boxes.
If the right-hand text box is blank or contains the text [(Input when range is specified)], then the fixed address
specified in the left-hand text box will be searched.
Note that if an address value greater than the microcontroller address space is specified, the high-order
address value is masked.
An address value greater than the value expressed within 32 bits cannot be specified.
(b) Specify [Mnemonic]
Specify the mnemonic if it is a required search parameter.
The specified character strings in this area is searched within the [Source/Disassemble] area of the Trace
panel.
You can either type a mnemonic directly into the text boxes, or select one from the input history via the dropdown list (up to 10 items).
Searches are case-insensitive, and partial matches are also allowed.
(c) Specify [Access Address] [IECUBE][Simulator]
Specify the access address if it is a required search parameter.
You can either type the address value directly into the text boxes (in hexadecimal number), or select it from the
input history via the drop-down list (up to 10 items).
R20UT2867EJ0100 Rev.1.00
Feb 01, 2014
Page 136 of 572
CubeSuite+ V2.02.00
CHAPTER 2 FUNCTIONS
The access address can also be specified as a range. In this case, specify a range by specifying address
expressions in both the left and right text boxes.
If the right-hand text box is blank or contains the text [(Input when range is specified)], then the fixed address
specified in the left-hand text box will be searched.
Note that if an address value greater than the microcontroller address space is specified, the high-order
address value is masked.
An address value greater than the value expressed within 32 bits cannot be specified.
(d) Specify [Access Status] [IECUBE][Simulator]
This item is only enable if a value for Specify [Access Address] [IECUBE][Simulator] is specified.
Select the access type (Read/Write, Read, Write, Vector Read and DMA) from drop-down list.
Select [(No Specification)] if you do not wish to limit access types.
(e) Specify [Data] [IECUBE][Simulator]
This item is only enable if a value for Specify [Access Address] [IECUBE][Simulator] is specified.
Specify the access data.
You can either type the data directly into the text boxes (in hexadecimal number), or select it from the input
history via the drop-down list (up to 10 items).
The data can also be specified as a range. In this case, specify a range by specifying data in both the left and
right text boxes.
If the right-hand text box is blank or contains the text [(Input when range is specified)], then the fixed data
specified in the left-hand text box will be searched.
(f) Specify [Number]
Specify the range within the trace data to search via the number displayed in the [Number] area of the Trace
panel.
Specify the starting number in the left text box, and the ending number in the right text box ("0" to "last number"
are specified by default).
You can either type the numbers directly into the text boxes (in base-10 format), or select them from the input
history via the drop-down list (up to 10 items).
If the left-hand text box is left blank, it is treated as if "0" were specified.
If the right-hand text box is left blank, it is treated as if the last number were specified.
(g) Click the [Search Backward]/[Search Forward] button
When the [Search Backward] button is clicked, search is taken place in the order from the large number to
small and the search results are shown selected in the Trace panel.
When the [Search Backward] button is clicked, search is taken place in the order from the small number to
large and the search results are shown selected in the Trace panel.
(2) Search in the source level
Search the trace data in the source level.
Select the [Source Level] tab.
R20UT2867EJ0100 Rev.1.00
Feb 01, 2014
Page 137 of 572
CubeSuite+ V2.02.00
CHAPTER 2 FUNCTIONS
Figure 2-137. Search Trace Data in Source Level
(a) Search with specifying the source line (default)
Select the [The execution part is retrieved specifying the source line] item in the [Search object] area and then
follow the operation below.
<1> Specify [Source and Line]
The specified character strings in this area is searched within the [Line/Address] area of the Trace panel.
You can either type the character strings of the source line to be find directly into the text box, or select
them from the input history via the drop-down list (up to 10 items).
Searches are case-insensitive, and partial matches are also allowed.
Examples 1.
main.c#40
2.
main.c
3.
main
<2> Specify [Number]
Specify the range within the trace data to search via the number displayed in the [Number] area of the
Trace panel.
Specify the starting number in the left text box, and the ending number in the right text box ("0" to "last
number" are specified by default).
You can either type the numbers directly into the text boxes (in base-10 format), or select them from the
input history via the drop-down list (up to 10 items).
If the left-hand text box is left blank, it is treated as if "0" were specified.
If the right-hand text box is left blank, it is treated as if the last number were specified.
<3> Click the [Search Backward]/[Search Forward] button
When the [Search Backward] button is clicked, search is taken place in the order from the large number
to small and the search results are shown selected in the Trace panel.
R20UT2867EJ0100 Rev.1.00
Feb 01, 2014
Page 138 of 572
CubeSuite+ V2.02.00
CHAPTER 2 FUNCTIONS
When the [Search Backward] button is clicked, search is taken place in the order from the small number
to large and the search results are shown selected in the Trace panel.
(b) Search with specifying the function name
Select the [The execution part is retrieved specifying the function] item in the [Search object] area and then
follow the operation below.
<1> Specify [Function Name]
You can either type the function name to be find directly into the text box, or select it from the input
history via the drop-down list (up to 10 items).
Searches are case-insensitive, and only complete matches are retrieved.
<2> Specify [Number]
Specify the range within the trace data to search via the number displayed in the [Number] area of the
Trace panel.
Specify the starting number in the left text box, and the ending number in the right text box ("0" to "last
number" are specified by default).
You can either type the numbers directly into the text boxes (in base-10 format), or select them from the
input history via the drop-down list (up to 10 items).
If the left-hand text box is left blank, it is treated as if "0" were specified.
If the right-hand text box is left blank, it is treated as if the last number were specified.
<3> Click the [Search Backward]/[Search Forward] button
When the [Search Backward] button is clicked, search is taken place in the order from the large number
to small and the search results are shown selected in the Trace panel.
When the [Search Backward] button is clicked, search is taken place in the order from the small number
to large and the search results are shown selected in the Trace panel.
(c) Search with specifying the global variable [IECUBE][Simulator]
Select the [The execution part is retrieved specifying the global variable] item in the [Search object] area and
then follow the operation below.
<1> Specify [Variable Name]
You can either type the variable name to be find directly into the text box, or select it from the input
history via the drop-down list (up to 10 items).
Searches are case-insensitive, and only complete matches are retrieved.
<2> Specify [Kind]
Select the access type ([Reference/Substitution], [Reference], or [Substitution]) from the drop-down list.
<3> Specify [Value]
You can either type the accessed variable value directly into the text box, or select one from the input
history via the drop-down list (up to 10 items).
The variable value can also be specified as a range. In this case, specify a range by specifying variable
values in both the left and right text boxes.
If the right-hand text box is blank, then access locations with the fixed variable values specified in the
left-hand text box will be searched for.
R20UT2867EJ0100 Rev.1.00
Feb 01, 2014
Page 139 of 572
CubeSuite+ V2.02.00
CHAPTER 2 FUNCTIONS
<4> Specify [Number]
Specify the range within the trace data to search via the number displayed in the [Number] area of the
Trace panel.
Specify the starting number in the left text box, and the ending number in the right text box ("0" to "last
number" are specified by default).
You can either type the numbers directly into the text boxes (in base-10 format), or select them from the
input history via the drop-down list (up to 10 items).
If the left-hand text box is left blank, it is treated as if "0" were specified.
If the right-hand text box is left blank, it is treated as if the last number were specified.
<5> Click the [Search Backward]/[Search Forward] button
When the [Search Backward] button is clicked, search is taken place in the order from the large number
to small and the search results are shown selected in the Trace panel.
When the [Search Backward] button is clicked, search is taken place in the order from the small number
to large and the search results are shown selected in the Trace panel.
2.11.9
Save the contents of execution history
Contents of the collected trace data can be saved with range selection in text files (*.txt)/CSV files (*.csv).
When saving to the file, the latest information is acquired from the debug tool, and it is saved in accordance with the
display format on this panel.
The following Data Save dialog box can be opened by selecting the [File] menu >> [Save Trace Data As...].
In this dialog box, follow the steps below.
Figure 2-138. Save Execution History (Data Save Dialog Box)
(1) Specify [File Name]
Specify the name of the file to save.
You can either type a filename directly into the text box (up to 259 characters), or select one from the input history
via the drop-down list (up to 10 items).
You can also specify the file by clicking the [...] button, and selecting a file via the Select Data Save File dialog box.
(2) Specify [File Type]
Select the format in which to save the file from the following drop-down list.
The following file formats can be selected.
List Item
Text files (*.txt)
R20UT2867EJ0100 Rev.1.00
Feb 01, 2014
Format
Text format (default)
Page 140 of 572
CubeSuite+ V2.02.00
CHAPTER 2 FUNCTIONS
List Item
Format
CSV (Comma-Separated Variables)(*.csv)
Note
CSV format
Note The data is saved with entries separated by commas (,).
If the data contains commas, each entry is surrounded by double quotes "" in order to avoid illegal
formatting.
(3) Specify [Save Range Number]
Specify the range of the number to save via "start number" and "end number".
Directly enter decimal number in each text box or select from the input history displayed in the drop-down list (up to
10 items).
When saving all the trace data, select the [All Trace Data] item in the drop-down list at the left (the right text box
becomes invalid).
If a range is selected in the panel, that range is specified as the default. If there is no selection, then the range
currently visible in the panel is specified.
(4) Click the [Save] button
Trace data is saved in the specified file with the specified format.
Figure 2-139. Output Example of Trace Data
Number
Time
Line Number/Address
Source/Disassemble
Address
Data
-----------------------------------------------------------------------------Number
Time
Line Number/Address
Source/Disassemble
Address
Data
:
:
:
:
:
:
R20UT2867EJ0100 Rev.1.00
Feb 01, 2014
Page 141 of 572
CubeSuite+ V2.02.00
2.12
CHAPTER 2 FUNCTIONS
Measure Execution Time of Programs
This section describes how to measure the execution time of the program.
2.12.1
Measure execution time until stop of the execution
In the debug tool, there is a function to measure the program execution time (Run-Break time) from the start to the stop.
Therefore, when the program starts its execution, the execution time is automatically measured.
You can check the result of the measurement by either one of the following.
Cautions 1.
[E1][E20][EZ Emulator]
The Run-Break time for a step execution cannot be measured.
2.
[Simulator]
To measure the Run-Break time, [Yes] must be specified with the [Use timer function] property
in the [Timer] category oncategory on the [Debug Tool Settings] tab of the Property panel.
Remark
This function is operated by a Run-Break Timer event, which is one of the built-in events set by default in
the debug tool. The Run-Break timer event is always Valid state (settings not changeable).
(1) Check in the status bar
After the program is stopped, the result of the measurement is displayed in the status bar on the Main window
(when measurements have not been performed yet, "Not measured" is displayed).
Figure 2-140. Example of Result of Run-Break Timer Event (Status Bar)
The result of the measurement
(2) Check on the Events panel
After the program is stopped, the result of the measurement is displayed in the Events panel opened by selecting
the [View] menu >> [Event], in event type as "Run-Break Timer".
Figure 2-141. Example of Result of Run-Break Timer Event (Events Panel)
2.12.2
Measure execution time in the arbitrary section [IECUBE][Simulator]
In the program execution process, the execution time in the arbitrary section can be measured by setting Timer Result
event. This Timer Result event consists of a timer start event and a timer end event.
To use this function, follow the procedure described below.
(1) Set a Timer Result event
R20UT2867EJ0100 Rev.1.00
Feb 01, 2014
Page 142 of 572
CubeSuite+ V2.02.00
CHAPTER 2 FUNCTIONS
(2) Execute the program
(3) Edit a Timer Result event
(4) Delete a Timer Result event
Cautions 1.
[E1][E20][EZ Emulator]
Timer Result event is not supported.
2.
Also see "2.15.7 Notes for setting events" for details on Timer Result events (e.g. limits on the
number of enabled events).
3.
[Simulator]
To use this function, [Yes] must be specified with the [Use timer function] property in the
[Timer] category on the [Debug Tool Settings] tab of the Property panel.
(1) Set a Timer Result event
To set a Timer Result event, set a timer start event and a timer end event that starts/stops a timer measurement.
Use one of the following methods to set a timer start event and a timer end event.
(a) For execution-related events
Perform this operation in the Editor panel/Disassemble panel in which the source text/disassembly text is
displayed.
Follow the operation listed below from the context menu, in accordance with your desired event type, after
moving the caret to the target line that has a valid address.
Event Type
Operation
Timer start
Select [Timer Settings] >> [Start Timer]
Timer end
Select [Timer Settings] >> [Stop Timer]
Caution
[Simulator]
Simulator will not include the time for a timer end event in the measurement results. For
this reason, set a timer end event to one line below the range for which you wish to measure
the run time.
A timer start event or a timer end event is set to the instruction at the start address corresponding to the line of
the caret position.
Once a timer start event or a timer end event is set, the following event mark is displayed in the event area of
the line that an event is set.
Table 2-15. Event Marks of Timer Start Event/Timer End Event
Event Type
Event mark
Timer start
Timer end
R20UT2867EJ0100 Rev.1.00
Feb 01, 2014
Page 143 of 572
CubeSuite+ V2.02.00
CHAPTER 2 FUNCTIONS
Figure 2-142. Timer Start and Timer End Events Setting Example (Disassemble Panel)
Event area
Indicates that a timer start
event has been set.
Indicates that a timer end
event has been set.
(b) For access-related events
In this product version, this function is not supported.
When a timer start event and a timer end event are set, they are managed collectively on the Events panel as one
instance of a Timer Result event (see "2.15 Manage Events"). When you click the "+" mark at a Timer Result
event item, detailed information on the timer start event and the timer end event you have set is displayed.
Figure 2-143. Example of Timer Start and Timer End Events (Execution Type) in Events Panel
Remark
Event marks differ depending on the event state (see "2.15.1 Change the state of set events (valid/
invalid)").
When an event is set at the point which other event is already set, the event mark (
) is displayed
meaning more than one event is set at the point.
(2) Execute the program
Execute the program (see "2.7 Execute Programs").
When an instruction for which a timer start event or a timer end event has been set is executed, a timer
measurement is started or finished.
After the program is stopped, the result of the measurement is displayed in the Events panel opened by selecting
the [View] menu >> [Event], in event type as "Timer Result".
This Timer Result is a particular type of event that is displayed on only the Events panel when either a timer start
event or a timer end event has been set.
R20UT2867EJ0100 Rev.1.00
Feb 01, 2014
Page 144 of 572
CubeSuite+ V2.02.00
CHAPTER 2 FUNCTIONS
Figure 2-144. Example of Result of Timer Result Event (Timer Start Event/Timer End Event)
(3) Edit a Timer Result event
It is possible to edit a timer start event or a timer end event you have set.
For details on how to do it, see "(1) Edit execution-related events".
(4) Delete a Timer Result event
To delete a Timer Result event you have set, on the Editor panel/Disassemble panel, right-click the event mark in
the event area and select [Delete Event] from the context menu that is displayed.
Also, there is another way to delete a set event. Select the Timer Result event you want to delete on the Events
panel, and then click the
Caution
button in the toolbar (see "2.15.5 Delete events").
It is not possible to delete only a timer start event or a timer end event (i.e. if either a timer start
event or a timer end event is deleted from the event marks on the event area, all of the
corresponding event marks are deleted).
2.12.3
Measurable time ranges
The scope of time that can be measured via timers using Run-Break Timer events (see "2.12.1 Measure execution
time until stop of the execution" for details) or Timer Result events (see "2.12.2 Measure execution time in the arbitrary
section [IECUBE][Simulator]" for details) is shown below.
If the maximum measurable length of time is exceeded, a timer-over break is generated, and program execution stops.
Table 2-16. Measurable Time Ranges
Debug Tool
IECUBE
Run-Break Timer Event
Timer Result Event
Min.
8 ns
Min.
8 ns
Max.
Approx. 40 hours 43 min
Max.
Approx. 40 hours 43 min (time for 4K cycles)
Overflow detection included
Maximum pass count: 4294967295 times
Overflow detection included
E1/E20
EZ Emulator
Simulator
Min.
100 μs
Max.
Approx. 119 hours 18 min
Depends on the clock frequency for timer/trace
R20UT2867EJ0100 Rev.1.00
Feb 01, 2014
Depends on the clock frequency for timer/trace
Page 145 of 572
CubeSuite+ V2.02.00
2.13
CHAPTER 2 FUNCTIONS
Measure Coverage [IECUBE][Simulator]
This section describes coverage measurements that are conducted using the coverage function.
There are several kinds of coverage measurement methods. Of these, CubeSuite+ performs, in areas designated
below, a code coverage measurement of fetch-related operations on source lines and functions (C0 coverage) and a data
coverage measurement of access-related operations on variables.
The area in which CubeSuite+ performs coverage measurements are as follows:
Table 2-17. Subject Areas of Coverage Measurement
Debug Tool
Code Coverage Measurement Area
IECUBE
Internal ROM/RAM, DataFlash, Target memory
Simulator
Internal ROM/RAM, Emulation ROM/RAM, Target memory
Caution
[E1][E20][EZ Emulator]
The coverage function is not supported.
Remark
C0 coverage: Instruction coverage (statement coverage)
For example, if all instructions (statements) in code are executed at least once, then C0 = 100%.
2.13.1
Configure the coverage measurement
You need to configure the code coverage measurement before using the coverage function.
The setting method differs depending on the debug tool used.
(1) [IECUBE]
(2) [Simulator]
(1) [IECUBE]
You can configure the coverage measurement in the [Coverage] category on the [Debug Tool Settings] tab of the
Property panel as follows:
Figure 2-145. [Coverage] Category [IECUBE]
(a) [Reuse coverage result]
The currently obtained results of code coverage measurements are automatically saved when CubeSuite+ is
disconnected from the debug tool. The next time it is connected to the debug tool, specify from the drop-down
list whether or not you want to reproduce the contents of saved measurement results.
Select [Yes] to reproduce the contents of previously obtained code coverage measurement results (default:
[No]).
The file that saves results of code coverage measurements (raw.csr.cv) will be created in the folder where the
load module file currently being downloaded exists.
(2) [Simulator]
You can configure the coverage measurement function in the [Coverage] category on the [Debug Tool Settings] tab
of the Property panel as follows:
R20UT2867EJ0100 Rev.1.00
Feb 01, 2014
Page 146 of 572
CubeSuite+ V2.02.00
CHAPTER 2 FUNCTIONS
Figure 2-146. [Coverage] Category [Simulator]
(a) [Use coverage function]
Select whether to use the coverage function.
Select [Yes] to use the coverage function (default: [No]).
(b) [Reuse coverage result]
This property appears only when the [Use coverage function] property is set to [Yes].
The currently obtained results of code coverage measurements are automatically saved when CubeSuite+ is
disconnected from the debug tool. The next time it is connected to the debug tool, select whether or not you
want to reproduce the contents of saved measurement results.
Select [Yes] to reproduce the contents of previously obtained code coverage measurement results (default:
[No]).
2.13.2
Display the coverage measurement result
When the program starts running, a coverage measurement is automatically begun, and when the program stops
running, the coverage measurement is terminated at the same time.
(1) Code coverage rates
(a) Display of code coverage rates for source text lines and disassembled text lines
The code coverage rates are indicated on the Editor panel/Disassemble panel that is displaying the target
program.
On each panel, the target source text lines and disassembled result lines are shown in color-coded
background (see "Table 2-19.") according to their code coverage rate that was calculated based on the
formula described in "Table 2-18.".
Note that the results are not shown when disconnected from the debug tool or during the program execution.
Selecting [Clear coverage information] from the context menu in the Editor panel/Disassemble panel will reset
all the coverage information acquired, including the color-coded display on each panel.
Table 2-18. Method for Calculating Code Coverage Rates for Source Lines and Disassemble Lines
Panel
Calculation Method
Editor panel
"Number of bytes of code executed in the address range corresponding to the
source text line" / "Total number of bytes of code in the address range corresponding
to the source text line"
Disassemble panel
"Number of bytes of code executed in the address range corresponding to the
disassembled text line" / "Total number of bytes of code in the address range
corresponding to the disassembled text line"
Table 2-19. View of Code Coverage Measurement Result (Default)
Code Coverage
Background Color
100 %
Source text/disassembled text
1 to 99 %
Source text/disassembled text
0 % (not yet executed)
Source text/disassembled text
R20UT2867EJ0100 Rev.1.00
Feb 01, 2014
Page 147 of 572
CubeSuite+ V2.02.00
Remarks 1.
CHAPTER 2 FUNCTIONS
The code coverage measurement result displayed on each panel is automatically updated at
every program break.
2.
The above background colors depend on the configuration in the [General - Font and Color]
3.
The above background colors do not apply to the lines that are outside of the subject area (see
category of the Option dialog box.
"Table 2-17. Subject Areas of Coverage Measurement").
4.
If the downloaded lode module file is older than the source file currently being open, the
displaying of the code coverage measurement result is not performed in the Editor panel.
Figure 2-147. View of Code Coverage Measurement Result (Editor Panel)
Code on this line has been executed by 100%
Code on this line has been executed by 0%
(not yet executed)
Figure 2-148. View of Code Coverage Measurement Result (Disassemble Panel)
Code on this line has been executed by 100%
Code on this line has been executed by 0%
(not yet executed)
(b) Display of code coverage rates for each function
Code coverage rates of each function can be checked via the [Code Coverage[%]] item in the Function List
panel of the analyze tool. For details on "the code coverage rates of the function", see "CubeSuite+ Integrated
Development Environment User's Manual: Analysis".
(2) Data coverage rates
Data coverage rates of each variable can be checked via the [Data Coverage[%]] item in the Variable List panel of
the analyze tool. For details on "the data coverage rates of the variable", see "CubeSuite+ Integrated
Development Environment User's Manual: Analysis".
R20UT2867EJ0100 Rev.1.00
Feb 01, 2014
Page 148 of 572
CubeSuite+ V2.02.00
2.14
CHAPTER 2 FUNCTIONS
Set an Action into Programs
This section describes how to set the specified action into the program.
2.14.1
Inset printf
By setting a Printf event that is one of "action events", the value of the specified variable expression can be output to
the Output panel by executing a printf command after temporarily stopping the program in execution at an arbitrary
position.
To use this function, follow the steps below.
Cautions 1.
Also see "2.15.7 Notes for setting events" for details on action events (e.g. limits on the
number of enabled events).
2.
No action events occur during step execution (
related events (
3.
/
/
) or execution ignoring break-
).
[Simulator]
When [Yes] is specified with the [Execute instruction at breakpoint when break] property in the
[Break] category on the [Debug Tool Settings] tab in the Property panel, all of action events
currently being set are handled as Hardware Break events (i.e. no Printf events occur).
(1) Set a Printf event
Set a Printf event to the position where you want to execute the printf command in the Editor panel/Disassemble
panel.
On each panel, select [Register Action Event...] from the context menu after moving the caret to the line that has a
valid address to open the Action Events dialog box below.
In this dialog box, follow the steps below.
Figure 2-149. Set Printf Event (Action Events Dialog Box: [Printf event] tab)
(a) Specify [Output string]
Directly enter from the keyboard the characters to add when output to the Output panel.
Characters must be in one line (spaces allowed).
R20UT2867EJ0100 Rev.1.00
Feb 01, 2014
Page 149 of 572
CubeSuite+ V2.02.00
CHAPTER 2 FUNCTIONS
(b) Specify [Variable expression]
Specify the variable expression for the Printf event to take place.
Type a variable expression directly into the text box (up to 1024 characters).
You can specify up to 10 variable expressions for a single Printf event by separating them with commas ",".
If this dialog box opens with a variable expression selected in the Editor panel/Disassemble panel, the
selected variable expression appears as the default.
For the basic input format that can be specified as variable expressions and the values output by Printf event,
see "Table A-14. Relationship between Variable Expressions and Output Value (Printf Event)".
Remark
A symbol name at the current caret position can be complemented by pressing the [Ctrl] + [Space]
key in this text box (see "2.19.2 Symbol name completion function").
(c) Specify [Address]
Specify the address at which to set the Printf event.
The address of the location currently being specified is displayed by default.
If you want to edit this area, you can either type an address expression directly into the text box (up to 1024
characters), or select them from the input history via the drop-down list (up to 10 items).
Remark
A symbol name at the current caret position can be complemented by pressing the [Ctrl] + [Space]
key in this text box (see "2.19.2 Symbol name completion function").
(d) Click the [OK] button
Set the Printf event to the line/address at the caret position in the Editor panel/Disassemble panel.
When the Printf event is set, the
mark is displayed in the event area on the Editor panel/Disassemble
panel, and the set Printf event is managed in the Events panel (see "2.15 Manage Events").
(2) Execute the program
Execute the program (see "2.7 Execute Programs").
By executing the program, the program momentarily stops immediately before executing the instruction at the
location where this event is set, and the value of the variable expression specified in this dialog box is output to the
Output panel.
(3) Check the output result
The output result format from the Printf event in the [Debug Tool] tab of the Output panel are as follows (see
"Figure A-42. Output Result Format of Printf Event").
Figure 2-150. Example of Output Result of Printf Event
[Output string]: Sample=
[Variable expression]: global_a
The result of the specification above
(4) Edit the Printf event
You can edit the Print event that has been set once.
To do this, on the Events panel, select [Edit Condition...] from the context menu after selecting the Printf event to be
edited. On the Action Events dialog box opened automatically, edit the items, and then click the [OK] button.
R20UT2867EJ0100 Rev.1.00
Feb 01, 2014
Page 150 of 572
CubeSuite+ V2.02.00
2.15
CHAPTER 2 FUNCTIONS
Manage Events
An event represents a certain status of the target system when debugging such as "Address 0x1000 is fetched" and
"Data is written to address 0x2000".
In CubeSuite+, these events are used as the action trigger of the debug function such as breakpoint, start/stop the
tracing, and start/stop the timer.
This section describes how to manage those events.
Select the [View] menu >> [Event].
Events are all managed in the Events panel. In the Events panel, you can confirm the details of the currently set events
in a list, and they can be deleted and changed enable/disable status.
For details on the contents and function in each area, see the section for the Events panel.
Figure 2-151. Manage Events (Events Panel)
Toolbar
[Name] area
Remark
[Detail Information] area
[Comment] area
For details on how to set various events, see the section below:
- Set a breakpoint
- Set a break event (execution type)
- Set a break event (access type)
- Set a Trace event
- Set a Point Trace event
- Set a Timer Result event
2.15.1
Change the state of set events (valid/invalid)
By changing the check on the check box of the event name, the setting state of the event can be changed (the Event
mark is changed depending on the setting state of the event).
The following are types of the setting state of the event.
Figure 2-152. Event Name Check Box
Check box Event mark
R20UT2867EJ0100 Rev.1.00
Feb 01, 2014
Event name
Page 151 of 572
CubeSuite+ V2.02.00
CHAPTER 2 FUNCTIONS
Table 2-20. Setting State of Event
Valid state
Event occurs when the specified condition is met.
It is possible to set the event to an invalid state by removing the check.
Invalid state
Event does not occur when the specified condition is met.
It is possible to set the event to a valid state by removing the check.
Suspended State
The conditions that have been specified cannot be set with the program of the debugging target. It is
not possible to operate the check box.
Remarks 1.
Both of the timer start event and the timer end event is must be set for the Timer Result event.
Therefore, it is not possible to set a particular event to a valid state by only the setting of one of these
(at the same time as both events are set, they are treated as grouped events as a Timer Result).
2.
It is not possible to set the Run-Break Timer event to an invalid/suspended state.
3.
The setting state of the event can be changed from the menu displayed by right clicking on the Event
mark in the Editor panel/Disassemble panel.
4.
The setting of the Unconditional Trace event and the Trace event to valid or invalid state is exclusively
controlled. Therefore, the Unconditional Trace event, which is a built-in event, is valid state by default,
but if either a trace start event/trace end event is set, it automatically becomes invalid state, and the
Trace event, which is a event name that is collectively called with a trace start event and a trace end
event, becomes valid state. Conversely, if the set Trace event is invalid state, the Unconditional Trace
event automatically becomes valid state.
2.15.2
Display only particular event types
Click on the toolbar button to display only the particular event type.
Displays events related to the Hardware Break.
Displays events related to the Software Break.
(except [Simulator])
Displays events related to the traceNote.
Displays events related to the timer.
[IECUBE][Simulator]
Displays events related to the action event (Printf event).
Displays the built-in events (Unconditional Trace event and Run-Break Timer event).
Note [E1][E20][EZ Emulator]
This button is available only when the selected microcontroller incorporates the OCD trace function.
2.15.3
Jump to the event address
Clicking the following buttons jumps to each panel which selected events address exist.
Note however, that when a Trace event/Timer Result event/ Unconditional Trace event/ Run-Break Timer event is
selected, these buttons are disabled.
Opens the Editor panel and jumps to the source line corresponding to the address where the
selected event is being set.
Opens the Disassemble panel and jumps to the disassemble results corresponding to the
address where the selected event is being set.
R20UT2867EJ0100 Rev.1.00
Feb 01, 2014
Page 152 of 572
CubeSuite+ V2.02.00
CHAPTER 2 FUNCTIONS
Opens the Memory panel and jumps to the source line corresponding to the address where the
selected event is being set.
2.15.4
Edit detailed settings of events
This section describes how to edit detailed settings of various events.
(1) Edit execution-related events
(2) Edit access-related events
(3) Edit combination conditions of events [E1] [E20]
Remark
For information on editing of action events (Printf events and interrupt events), see "2.14 Set an Action into
Programs".
(1) Edit execution-related events
The address condition and pass count condition [IECUBE][Simulator] for execution-related events you have set
can be edited.
Perform this operation in the Detail dialog box (for execution events) that is opened by selecting [Edit Condition...]
from the context menu after moving the caret to an execution-related eventNote you want to edit on the Events
panel.
Note An execution-related event refers to any one of the following events in the Events panel.
- Hardware Break event (execution type)
- Execution-related break event in detailed information on Combination Break event [E1][E20]
- Execution-related event as start and end condition in detailed information on Trace event
- Execution-related event as start and end condition in detailed information on Timer Result event
[IECUBE][Simulator]
Figure 2-153. Example of Detail Dialog Box (for Execution Events) [Simulator]
(a) Editing [Address Condition]
You can edit the address condition for an execution-related event in this area.
Figure 2-154. [Address Condition] [IECUBE]
R20UT2867EJ0100 Rev.1.00
Feb 01, 2014
Page 153 of 572
CubeSuite+ V2.02.00
CHAPTER 2 FUNCTIONS
Figure 2-155. [Address Condition] [E1][E20][EZ Emulator]
Figure 2-156. [Address Condition] [Simulator]
- For [IECUBE][Simulator]
From the [Compare condition] drop-down list, select the type of condition for address comparison.
After that, specify the address for use with the selected type of condition in the field displayed under the
list.
List of [Compare condition]
Specified address (==)
Setting Method
After selecting any of these conditions, directly enter an address
expression as the address value in the [Address] field displayed under
Greater than or equal to (>=)
the list for selection of the type of comparison.
Less than or equal to (<=)
Inside the range (<=Values<=)
After selecting any of these conditions, directly enter an address
Outside the range !(<=Values<=)
expression as the address range in the [Start address] and [End
address] field displayed under the list for selection of the type of
comparison.
It is possible to specify the value of an address mask for the specified address value [Simulator].
In this case, specify [Yes] in the [Use the address mask], and specify the mask value in the [Mask value]
field under the list by directly entering a hexadecimal address.
- For [E1][E20][EZ Emulator]
In [Address], the address at which the execution-related event is currently set is displayed.
To edit this address, directly enter an address expression for the address value at which you want to set
the event.
(b) Editing [Pass Count] [IECUBE][Simulator]
You can edit the pass count condition for an execution-related event in this area.
Directry enter a pass count value in decimal notation between 1 and 65535.
Figure 2-157. [Pass Count]
Caution
[IECUBE]
A value other than "1" cannot be specified as the pass count condition for an executionrelated event (before execution).
R20UT2867EJ0100 Rev.1.00
Feb 01, 2014
Page 154 of 572
CubeSuite+ V2.02.00
CHAPTER 2 FUNCTIONS
(2) Edit access-related events
The address condition, data condition and pass count condition [IECUBE][Simulator] for access-related events
you have set can be edited.
Perform this operation in the Detail dialog box (for access events) that is opened by selecting [Edit Condition...]
from the context menu after moving the caret to an access-related eventNote you want to edit on the Events panel.
Note An access-related event refers to any one of the following events in the Events panel.
- Hardware Break event (access type)
- Access-related break event in detailed information on Combination Break event [E1][E20]
- Access-related event as start and end condition [E1][E20] in detailed information on Trace event
- Access-related event in detailed information on Point Trace event
Figure 2-158. Example of Detail Dialog Box (for Access Events) [Simulator]
(a) Editing [Address Condition]
You can edit the address condition for an execution-related event in this area.
Figure 2-159. [Address Condition] [IECUBE]
Figure 2-160. [Address Condition] [E1][E20][EZ Emulator]
R20UT2867EJ0100 Rev.1.00
Feb 01, 2014
Page 155 of 572
CubeSuite+ V2.02.00
CHAPTER 2 FUNCTIONS
Figure 2-161. [Address Condition] [Simulator]
- For [IECUBE][Simulator]
From the [Compare condition] drop-down list, select the type of condition for address comparison.
After that, specify the address for use with the selected type of condition in the field displayed under the
list.
List of [Compare condition]
Specified address (==)
Setting Method
After selecting any of these conditions, directly enter an address
expression as the address value in the [Address] field displayed under
Greater than or equal to (>=)
the list for selection of the type of comparison.
Less than or equal to (<=)
Inside the range (<=Values<=)
Outside the range !(<=Values<=)
After selecting any of these conditions, directly enter an address
expression as the address range in the [Start address] and [End
address] field displayed under the list for selection of the type of
comparison.
It is possible to specify the value of an address mask for the specified address value [Simulator].
In this case, specify [Yes] in the [Use the address mask], and specify the mask value in the [Mask value]
field under the list by directly entering a hexadecimal address.
- For [E1][E20][EZ Emulator]
In [Address], the address at which the access-related event is currently set is displayed.
To edit this address, directly enter an address expression for the address value at which you want to set
the event.
(b) Editing [Data Condition]
You can edit the data condition for an access-related event in this area.
Figure 2-162. [Data Condition]
<1> Specify an access type
In [Access type], select an access type from the following drop-down list.
Read
When a read access occurs, the condition holds true.
Write
When a write access occurs, the condition holds true.
R20UT2867EJ0100 Rev.1.00
Feb 01, 2014
Page 156 of 572
CubeSuite+ V2.02.00
Read/Wrote
CHAPTER 2 FUNCTIONS
When a read or write access occurs, the condition holds true.
<2> Specify an access size
In [Access size], select an access size from the following drop-down list.
No conditions
When an access in any size occurs, the condition holds true.
1byte
When an access in 1-byte size occurs, the condition holds true.
2byte
When an access in 2-byte size occurs, the condition holds true.
<3> Specify a data comparison condition
From the [Compare condition] drop-down list, select the type of condition for data comparison.
After that, specify the value of data for use with the selected type of condition in the field displayed under
the list.
- For [IECUBE][Simulator]
No conditions
Comparison data is not specified.
Specified value (==)
After selecting any of these conditions, directly enter a value in
hexadecimal number in the [Data] field displayed under the list for
Any other value (!=)
selection of the type of comparison.
Greater than or equal to (>=)
Less than or equal to (<=)
Inside the range (<=Values<=)
Outside the range !(<=Values<=)
After selecting any of these conditions, directly enter values in
hexadecimal number for the data range in the [Data] field displayed
under the list for selection of the type of comparison.
- For [E1][E20][EZ Emulator]
No conditions
Comparison data is not specified.
Specified value (==)
After selecting this, directly enter a value in hexadecimal number in the
[Data] field displayed under this field.
<4> Specify a data mask
Select [Yes] in the [Use the data mask] field to specify a mask value for the matching of data values.
When [Yes] is selected, a [Mask value] field appears below the [Use a data mask] field. Specify a
hexadecimal value with no more than five digits for the data mask by directly entering it in the [Mask
value] field.
(c) Editing [Pass Count] [IECUBE][Simulator]
You can edit the pass count condition for an access-related event in this area.
Directry enter a pass count value in decimal notation between 1 and 65535.
Figure 2-163. [Pass Count]
R20UT2867EJ0100 Rev.1.00
Feb 01, 2014
Page 157 of 572
CubeSuite+ V2.02.00
CHAPTER 2 FUNCTIONS
(3) Edit combination conditions of events [E1] [E20]
Edit the combination condition for a combination break event comprised of multiple events set.
Caution
This function is enabled only when the selected microcontroller supports combination break
events.
Perform this operation in the Combination Condition dialog box [E1][E20] that is opened by selecting [Edit
Condition...] from the context menu after moving the caret to a combination break event you want to edit on the
Events panel.
Figure 2-164. Example of Combination Condition Dialog Box
(a) Editing [Combination] area
Select the combination condition from the following drop-down list.
OR
The condition is satisfied when one of the set events is encountered (default).
Sequential
The condition is satisfied when the set events are encountered in the specified sequence.
Caution
When [OR] is selected, up to two break events can be specified.
When [Sequential] is selected, break event can be specified for the 1st to the 2nd position.
(b) Editing [Object event] area
This area displays details on the break event set as a combination break event.
When [Sequential] is specified in the [Combination] area, the order of display here corresponds to the order in
which the conditions are to be satisfied. To change the order, select a target event and click on the [Up] or
[Down] buttons.
(c) Editing [Reset event] area
Reset events are always enabled.
R20UT2867EJ0100 Rev.1.00
Feb 01, 2014
Page 158 of 572
CubeSuite+ V2.02.00
2.15.5
CHAPTER 2 FUNCTIONS
Delete events
To delete any event and event condition you have set, select the event and click the
button on the toolbar.
Note that it is not possible to delete the built-in events (Unconditional Trace event and Run-Break Timer event).
Remarks 1.
For the Break event of execution type, it is possible to delete the set event to click the event mark
displayed in the Editor panel/Disassemble panel.
2.
To delete all of the events and event conditions you have set at a time, select [Select All] from the
context menu, then click the
button (note, however, that it is not possible to delete the built-in
events).
2.15.6
Write comment to events
The user can write comments for each event that has been set.
To input comments, click the [Comment] area after selecting the event to input comments, then input directly the
desired text from the keyboard (the edit mode is cancelled by pressing the [Esc] key).
After editing the comments, complete the editing by pressing the [Enter] key or moving the focus to outside the edit
region.
Up to 256 characters can be inputted for the comments, and this is saved as the settings of the user during use.
2.15.7
Notes for setting events
This section describes notes for setting each type of event.
(1) Maximum number of enabled events
(2) Event types that can be set and deleted during execution
(3) Other notes
(1) Maximum number of enabled events
The number of events that can be set to Valid state simultaneously are subject to the following limitations.
Therefore, if this limit is exceeded when you set one or more new valid state events, some of the events that are
already set need to be Invalid state before you can set a new one.
The meaning of numbers in the table below is as follows:
x+y
"Hardware Break (after execution): x" + "Hardware Break (access): y"
Table 2-21. Maximum Number of Enabled Events
Debug Tool to Use
E1/E20/EZ Emulator
Event Type
IECUBE
Hardware Break
Without OCD Trace Function
With OCD
8-bit bus width
Except for 8-bit
products
bus width products
4 to 8
0
0
8
2
8
0
2000
0
Note 1
Trace Function
Simulator
0
(before execution)
Hardware Break
(after execution)
Hardware Break
64Note 4
1Note 2
2Note 3
(access)
Software Break
R20UT2867EJ0100 Rev.1.00
Feb 01, 2014
2000
-
Page 159 of 572
CubeSuite+ V2.02.00
CHAPTER 2 FUNCTIONS
Debug Tool to Use
E1/E20/EZ Emulator
Event Type
IECUBE
Without OCD Trace Function
With OCD
Trace Function
Simulator
8-bit bus width
Except for 8-bit
products
bus width products
4 + 4Note 5
-
-
2Note 3
32Note 5
Point Trace
8 + 8Note 6
-
-
0
64Note 6
Timer Result
4 + 4Note 5
-
-
-
1
100Note 7
0
Trace
(trace start/trace end)
(timer start/timer end)
Action (Printf)
Notes 1.
100Note 7
64Note 8
Depending on the address and instruction to which the event is set (however, Hardware Break (before
execution) cannot be used in RAM area).
2.
A Hardware Break (after execution) and a Software Break are combined use.
3.
A Hardware Break and a Trace are exclusive of each other (i.e. if one is set, then the other will become
invalid). Total of 2 events (a trace start and a trace end) are available for a Trace.
4.
The before break/after break can be specified in the Property panel.
5.
In this version, only one group can be set (however, two or more Start/Stop events can be set).
6.
In this version, only one can be set (however, two or more conditions for this event can be set).
7.
Combination with Software Break events (however, up to 100 can be set regardless of their valid/invalid
state).
8.
Combination with Hardware Break events (before execution) (however, up to 64 can be set regardless
of their valid/invalid state).
(2) Event types that can be set and deleted during execution
Types of events that can be set or removed during execution of the program or during execution of the tracer/timer
are described below.
The meaning of each mark in the table below is as follows:
Possible
Possible, if the program execution is allowed to pause for events
(Property panel >> [Debug Tool Settings] tab >> [Set Event While Running] category >> [Set event
by stopping execution momentarily] property >> [Yes])
Impossible while tracer or timer is executing
Impossible, or not supported
Table 2-22. Event Types That Can be Set and Deleted during Execution
Debug Tool to Use
E1/E20/EZ Emulator
Event Type
IECUBE
Hardware Break
Without OCD Trace Function
8-bit bus width
Except for 8-bit
products
bus width products
-
-
With OCD
Trace Function
Simulator
-
(before execution)
R20UT2867EJ0100 Rev.1.00
Feb 01, 2014
Page 160 of 572
CubeSuite+ V2.02.00
CHAPTER 2 FUNCTIONS
Debug Tool to Use
E1/E20/EZ Emulator
Event Type
Without OCD Trace Function
IECUBE
8-bit bus width
Except for 8-bit
products
bus width products
With OCD
Trace Function
Simulator
Hardware Break
(after execution)
Hardware Break
-
(access)
Software Break
-
-
-
-
Trace
-
-
-
-
Point Trace
-
-
-
-
Timer Result
-
-
-
-
-
-
-
-
(trace start/trace end)
(timer start/timer end)
Action (Printf)
(3) Other notes
- No events can be set to local variables.
- Events do not occur during step execution (including return execution) and program execution by selecting
[Go to Here] from the context menu.
- If the location set for an existing event changes to midway in an instruction because the program to debug has
been downloaded again, re-set the event using the following method.
- If debugging information is available:
The location setting of events is always moved to the beginning of the source text line.
- If debugging information is not available:
Depends on the [Automatic change method of event setting position] property in the [Download] category
on the [Download File Settings] tab of the Property panel.
- If a change to internal ROM/RAM changes the location the event is set to a non-mapped area, then set events
will not occur (they will also not change to Invalid state /Suspended State on the Events panel).
- If you differentiate function or variable names by leading underscores, then CubeSuite+ may misrecognize
them, and convert symbols or make break event settings invalid. This applies for cases like when you have
two functions, one named "_reset" and the other named "__reset".
- If there is code (text sections) to be ROMified, any software break event set for that code will be deleted during
rcopy to RAM. For this reason, no break will occur. Use a hardware break if you are using OCD(JTAG) or
OCD(Serial) or IECUBE. Note that if you are using a simulator, execution will not break even if a hardware
breakpoint is used, but it will break if the tracer or timer is turned on.
- For other than [Simulator]
Use a hardware break event.
- [Simulator]
Execution will not break even if a hardware break event is used, but it will break if the trace function or the
timer function is valid (on the [Debug Tool Settings] tab of the Property panel, specify [Yes] with the [Use
R20UT2867EJ0100 Rev.1.00
Feb 01, 2014
Page 161 of 572
CubeSuite+ V2.02.00
CHAPTER 2 FUNCTIONS
trace function]/[Use timer function]property on the [Trace]/[Timer] category).
- For other than [IECUBE]
If a software break event is set in a boot-swap area, then a break instruction will be written to the flash ROM.
For this reason, a break instruction will remain after the boot swap.
- [E1][E20][EZ Emulator]
Use a hardware break event in a boot-swap area if you wish to.
- [Simulator]
Do not use a break event in a boot-swap area.
- For other than [Simulator]
Hardware Break events with access conditions and Point Trace events [IECUBE] cannot be set for 32-bit (4byte) variables.
Additionally, Hardware Break events with access conditions and Point Trace events [IECUBE] cannot be
detected if a single byte of a 16-bit (2-byte) variable is accessed.
R20UT2867EJ0100 Rev.1.00
Feb 01, 2014
Page 162 of 572
CubeSuite+ V2.02.00
2.16
CHAPTER 2 FUNCTIONS
Use Smart Analog Function [E1][E20]
This section describes how to collect the data using Smart Analog function.
For details on how to check the collected data, see "CubeSuite+ Integrated Development Environment User's Manual:
Analysis".
Cautions 1.
Smart Analog function is supported only when the selected microcontroller incorporates a
Smart Analog IC.
2.
Using the Smart Analog function to collect data requires linking of the monitor program for data
collection to the execution program. For details, see the document of SA-Designer.
(1) Set to data collection mode
To collect the data for Smart Analog while execution of a program, specify [Yes] with the [Collect data during the
execution] property in the [Smart Analog] category on the [Debug Tool Settings] tab of the Property panel.
Figure 2-165. [Smart Analog] Category
When you have performed the setting above, the debug tool is set to the data collection mode.
Note that when the debug tool is in the data collection mode, the following property values on the Property panel
will be automatically changed to [No].
Tab
Category
[Debug Tool Settings]
[Access Memory While Running]
Property
[Access by stopping execution]
[Update display during the execution]
[Download File Settings]
Cautions 1.
[Debug Information]
[Execute to the specified symbol after CPU Reset]
The setting of the [Smart Analog] category cannot be changed while execution of a
program.
2.
When the setting of the [Smart Analog] category is changed, CPU reset is automatically
generated.
(2) Execute the program
To execute the program, click the
button on the debug toolbar (this is the same as the selecting [Ignore break
and go] from the [Debug] menu). In the data collection mode, all execution-related buttons other than the
button will become invalid.
When the program starts running, the data collection for Smart Analog begins automatically.
While the data collection is executed, the following icon and character strings are displayed on the Statusbar in the
Main window.
Figure 2-166. Statusbar Under Execution in Data Collection Mode
R20UT2867EJ0100 Rev.1.00
Feb 01, 2014
Page 163 of 572
CubeSuite+ V2.02.00
Cautions 1.
2.
CHAPTER 2 FUNCTIONS
All events are ignored during the program execution.
An access to the memory by stopping the execution temporarily (i.e. a read/write by using
RAM monitor function) cannot be made during the program execution.
3.
On the debug toolbar, no buttons other than the
button are available during the
program execution.
4.
If you operate plug-in tools other than the analyze tool (Program Analyzer), debug operation
cannot be guaranteed.
(3) Stop the program
To stop the program, click the
button on the debug toolbar (this is the same as the selecting [Stop] from the
[Debug] menu).
When the program stops running, the data collection for Smart Analog terminates.
R20UT2867EJ0100 Rev.1.00
Feb 01, 2014
Page 164 of 572
CubeSuite+ V2.02.00
2.17
CHAPTER 2 FUNCTIONS
Use Hook Function
This section describes how to set hooks in the debug tool by using the hook function.
By setting a hook transaction, you can automatically change the values of the SFR/CPU register before and after
downloading a load module or after resetting the CPU.
Configure the hook transaction in the [Hook Transaction Settings] category on the [Hook Transaction Settings] tab of
the Property panel.
Remark
By setting a SFR by using the [Before download] property, for example, downloading can be executed at
high speeds. Downloading to the external RAM is also facilitated by using this function.
Figure 2-167. [Hook Transaction Settings] Category
Table 2-23. Properties in [Hook Transaction Settings] Category
Property
Description
Before download
Perform the specified process immediately before downloading the load module file.
After download
Perform the specified process immediately after downloading the load module file.
After CPU reset under breaking
Perform the specified process immediately after resetting the CPU under breaking.
Before running
Perform the specified process immediately before starting program execution.
After breaking
Perform the specified process immediately after breaking program execution.
The properties in the [Hook Transaction Settings] category indicate the timing with which the hook process will be
performed. "[]" indicates the current number of specified processes (no hook processes are configured by default).
Specify the target process in the property for which you want the hook process to be performed.
To specify a process, select the target property, then open the Text Edit dialog box by clicking the [...] button that
appears on the right edge of the field.
Figure 2-168. Opening Text Edit Dialog Box
Figure 2-169. Use Hook Function (Text Edit Dialog Box)
R20UT2867EJ0100 Rev.1.00
Feb 01, 2014
Page 165 of 572
CubeSuite+ V2.02.00
CHAPTER 2 FUNCTIONS
In this dialog box, directly enter the desired process from the key board.
The format for specifying processes is as follows:
[Process 1]:
Automatically overwrites the value of SFR with Value.
Specification format:
SFR-name Value
[Process 2]:
Automatically overwrites the value of CPU register with Value.
Specification format:
CPU-register-name Value
[Process 3]:
Automatically executes a script file which is specified with Python script path (absolute path or relative path from
the project folder).
Specification format:
Source Python-script-path
Remarks 1.
2.
When specifying hook processes, lines starting with a hash mark "#" will be treated as comments.
A tab character can be used instead of the space character.
Up to 64 characters for one process, and up to 128 processes for each property can be set (one line in the [Text] area
in the Text Edit dialog box is equivalent to one processing).
After the specification of the process is complete, click the [OK] button to set the process to the Property panel.
Figure 2-170. Example of Hook Transaction
R20UT2867EJ0100 Rev.1.00
Feb 01, 2014
Page 166 of 572
CubeSuite+ V2.02.00
2.18
CHAPTER 2 FUNCTIONS
Use the Simulator GUI [Simulator]
This section describes how to use the Simulator GUI.
Note that the function of the Simulator GUI described in this section is only supported when a microcontroller whose
Simulator supports peripheral function simulations is selected.
Control the Simulator GUI via the Simulator GUI window below.
This window appears automatically by default after connecting to the debug tool when a microcontroller whose
Simulator supports peripheral function simulations is selected and [Simulator] is selected as the debug tool to use.
Remark
The Simulator GUI window and windows opened from it cannot be docked to the CubeSuite+ Main window.
Figure 2-171. Using Simulator GUI (Simulator GUI Window)
The setting of the display of the Simulator GUI window can be configured in the [Simulator GUI] category on the [Debug
Tool Settings] tab of the Property panel as follows:
Configure the appropriate settings.
Caution
After connecting to the debug tool, all the properties in this category will become invalid if a
microcontroller whose Simulator does not support peripheral function simulations (instruction
simulation version) is selected.
Figure 2-172. [Simulator GUI] Category
(1) [Display Simulator GUI]
Specify whether to display the Simulator GUI window from the drop-down list.
Select [Yes] to use the function of the Simulator GUI (default).
When you do not need to use the Simulator GUI, select [No] to close the Simulator GUI window.
(2) [Display Simulator GUI on top of other windows]
This property appears only when the [Display Simulator GUI] property is set to [Yes].
R20UT2867EJ0100 Rev.1.00
Feb 01, 2014
Page 167 of 572
CubeSuite+ V2.02.00
CHAPTER 2 FUNCTIONS
Specify whether to display the Simulator GUI window in the forefront when program execution starts. Select [Yes]
to display it in the forefront (default).
2.18.1
Check the I/O waveform of the microcontroller
It is possible to check the I/O waveform of the microcontroller by clicking the
button on the Simulator GUI window's
toolbar and opening the Timing Chart window (shown below).
This window displays a timing chart of the input and output signals of the microcontroller's pins.
See the section on the Timing Chart window for details about controlling the window.
Figure 2-173. Checking I/O Waveform of Microcontroller (Timing Chart Window)
2.18.2
Input signals to the pins
To configure the input signal to a pin, click the
on the Simulator GUI window's toolbar. The following Signal Data
Editor window opens.
You can use this window to set the input signal data for the input pin to a numerical value, to be input at an arbitrary
time.
See the section on the Signal Data Editor window for details about controlling the window.
Figure 2-174. Configuring Input Signal to Pin (Signal Data Editor Window)
R20UT2867EJ0100 Rev.1.00
Feb 01, 2014
Page 168 of 572
CubeSuite+ V2.02.00
2.18.3
CHAPTER 2 FUNCTIONS
Perform serial communication
To configure serial communication, click the
on the Simulator GUI window's toolbar. The following Serial window
opens.
This window provides serial I/O features for communicating with the CPU's built-in serial interface. This enables you to
input data to the microcontroller's serial receiver pin, and acquire output data from its serial transmitter pin.
See the section on the Serial window for details about controlling the window.
Figure 2-175. Performing Serial Communication (Serial Window)
2.18.4
Use buttons, LEDs, level gauges, and other components
The Simulator GUI allows input manipulation and output display simulation by providing standard connected parts
(buttons, LEDs, level gauges, etc.) in which the I/O block for peripheral I/O designed as a GUI interface.
To configure connected parts, click the
on the Simulator GUI window's toolbar. The following I/O Panel window
opens.
This window enables you to configure the various connected parts, building a dummy target system.
See the section on the I/O Panel window for details about controlling the window.
Figure 2-176. Configuring Connected Parts (I/O Panel Window)
R20UT2867EJ0100 Rev.1.00
Feb 01, 2014
Page 169 of 572
CubeSuite+ V2.02.00
2.19
CHAPTER 2 FUNCTIONS
About Input Value
This section describes consideration to take when inputting values in each panel and dialog box.
2.19.1
Input rule
Following is the rules for input to each panel/dialog box.
(1) Character set
Character sets that are allowed to input are as follows:
Table 2-24. List of Character Set
Character Set
Outline
ASCII
1- byte alphabets, numbers, symbols
Shift-JIS
2-byte alphabet, number, symbol, Hiragana, Katakana, Kanji and 1-byte Katakana.
EUC-JP
2-byte alphabet, number, symbol, Hiragana, Katakana, Kanji and 1-byte Katakana.
UTF-8
2-byte alphabet, number, symbol, Hiragana, Katakana, Kanji (include Chinese
characters) and 1-byte Katakana.
UTF-16
2-byte alphabet, number, symbol, Hiragana, Katakana, Kanji (include Chinese
characters) and 1-byte Katakana.
(2) Number
Notations allowed when entering numbers are as follows:
Table 2-25. Notation List
Notation
Outline
Binary number
Start with 0b and continues with the numbers from 0 to 1.
(Case insensitive for alphabets)
Octal number
Start with 0 and continues with the numbers from 0 to 7.
Decimal
Start without 0 and continues with the numbers from 0 to 9.
Hexadecimal number
Start with 0x and continues with the numbers from 0 to 9 and alphabets a to f.
(Case insensitive for alphabets)
In the input area with the
mark, prefix 0x is not needed.
(3) Expression and operator
Expression represents constants, register name, SFR name and symbols and those connected with operators.
When SFR name, label name, function name and variable name are described as symbols, the address is
operated as a value of symbols. The basic input formats are as follows:
Table 2-26. Basic Input Format of Expressions
Expression
Description
Variable name of C language
Value of C language variable
Expression [Index]
Element of array
Expression.Member name
Member of structures/unions
Expression->Member name
Member of structures/unions that pointer designates
R20UT2867EJ0100 Rev.1.00
Feb 01, 2014
Page 170 of 572
CubeSuite+ V2.02.00
CHAPTER 2 FUNCTIONS
Expression
2.19.2
Description
*Expression
Value of pointer variable
CPU register name
Value of the CPU register
SFR name
SFR value
Label name, EQU symbol name and immediate address
Values of label, EQU symbol and immediate address
Bit symbol
Bit symbol value
Symbol name completion function
This function helps users input data by selecting one of the listed symbol names that exist in the program, when
specifying an address expression and so on.
The list of symbol names appears by pressing the [Ctrl] + [Space] keys when a part of the target symbol name is being
input in the text box that supports this function. In this list, double-click the target symbol name (or press the [Space]/
[Enter] key after selecting it by using the [Up]/[Down] key) to complement the symbol name currently being input.
At this time, if a key other than the [Space]/[Enter] key is pressed or the focus moves to outside the panel/dialog box
currently being operated, then the list of symbol names will disappear (the symbol name completion will not be
performed).
Cautions 1.
If there are no character strings in the text box or there are no candidates of the symbol, then
the list of symbol names will not appear.
2.
Since the information for use by the symbol name completion function is generated while
symbols are being downloaded, the time taken for downloading and the memory usage on the
host machine will increase when this function is enabled. Therefore, if you do not intend to use
the symbol name completion function, we recommend invalidating this function by selecting
[No] in the [Generate the information for input completion] item in the Download Files dialog
box ([Yes] is selected by default).
Remark
See the explanation of the corresponding panel/dialog box as to whether this function can be used or not
when inputting a symbol name.
Figure 2-177. Symbol Name Completion Function
Press the [Ctrl] + [Space] keys.
Select the target symbol name from
this list displayed.
R20UT2867EJ0100 Rev.1.00
Feb 01, 2014
Page 171 of 572
CubeSuite+ V2.02.00
2.19.3
CHAPTER 2 FUNCTIONS
Icons for invalid input
In some of the dialogs in CubeSuite+, the
icon will appear at a point where incorrect characters are entered as a
warning sign.
Remark
Placing the cursor over the
R20UT2867EJ0100 Rev.1.00
Feb 01, 2014
icon will pop up the information that indicates the characters to be entered.
Page 172 of 572
CubeSuite+ V2.02.00
APPENDIX A WINDOW REFERENCE
APPENDIX A WINDOW REFERENCE
Appendix A provides detailed explanations of windows/panels/dialog boxes used for debugging with CubeSuite+.
A.1
Description
Windows/panels/dialog boxes for debugging are listed below.
Table A-1. Window/Panel/Dialog Box List
Window/Panel/Dialog Box Name
Main window
Description
Controls the program execution. Various windows, panels and dialogs can be
opened from this window.
Project Tree panel
Selects the debug tool to use.
Property panel
Displays detailed information on the debug tool currently selected in the Project
Tree panel, and enables the settings of the tool to be changed.
Editor panel
Enables text files to be viewed and edited, and is used to execute source level
debug.
Memory panel
Displays and modifies memory values.
Disassemble panel
Displays the results of memory value disassemble and is used to execute line
assemble and instruction level debug.
CPU Register panel
Displays the contents of CPU registers, and modifies register values.
SFR panel
Displays and modifies SFR values.
Local Variables panel
Displays and modifies local variables.
Watch panel
Displays and modifies registered watch-expression values.
Call Stack panel
Displays call stack information on function calls.
Trace panel
Displays trace data acquired from the debug tool.
Events panel
Displays detailed information on set events, switches the events between
enabled and disabled, or deletes them.
Output panel
Displays messages output from the build tool/debug tool/plug-ins, or the results
of batch searches carried out using the Find and Replace dialog box.
Memory Mapping dialog box
Sets the memory mapping.
Download Files dialog box
Selects files to be downloaded and sets the download conditions.
Text Edit dialog box
Inputs and modifies character strings.
Action Events dialog box
Sets action events.
Encoding dialog box
Selects a file-encoding.
Save Settings dialog box
Specifies the encoding and the new line code of the file being edited.
Bookmarks dialog box
Displays and deletes bookmarks.
Column Number Settings dialog box
Specifies the number of view columns of memory values on the Memory panel.
Address Offset Settings dialog box
Specifies an offset value for the address display on the Memory panel.
Memory Initialize dialog box
Initializes memory.
Memory Search dialog box
Searches memory.
R20UT2867EJ0100 Rev.1.00
Feb 01, 2014
Page 173 of 572
CubeSuite+ V2.02.00
APPENDIX A WINDOW REFERENCE
Window/Panel/Dialog Box Name
Description
Print Address Range Settings dialog box
Sets the address range to print the contents of the Disassemble panel.
Print Preview window
Previews the source file before printing.
Trace Search dialog box
Searches trace data.
Combination Condition dialog box [E1][E20]
Displays and modifies detailed information on a Combination Break event
Detail dialog box (for execution events)
Displays and modifies detailed information on an execution-related event.
Detail dialog box (for access events)
Displays and modifies detailed information on an access-related event.
Scroll Range Settings dialog box
Sets the scroll range for the Memory panel/Disassemble panel.
Go to Line dialog box
Moves the caret to the specified line.
Go to the Location dialog box
Moves the caret to the specified position.
Data Save dialog box
Saves the settings and other data displayed in the respective windows/panels/
dialogs or saves upload data.
Progress Status dialog box
Displays the progress of the processing being executed.
Option dialog box
Makes settings for various environments.
Select Download File dialog box
Selects files to be downloaded.
Open Watch Expression Data File dialog box
Selects a file for importing watch-expressions.
Open File dialog box
Selects files to be opened.
Save As dialog box
Saves files or the contents of various windows/panels/dialogs.
Select Data Save File dialog box
Selects the file to save data.
Open Option Setting File dialog box
Selects the option setting file to import to the Option dialog box.
Save Option Setting File dialog box
Saves the set contents of the Option dialog box to a option setting file.
Select Simulator Configuration File dialog
Selects simulator configuration file.
box [Simulator]
Table A-2. Simulator GUI Block-Dedicated Window/Dialog Box List
Window/Dialog Box Name
Description
Simulator GUI window
Opens and controls various simulator GUI's windows and dialog boxes.
Customize dialog box
Setting of window colors and fonts
Signal Data Editor window
Setting of input signal data
Loop dialog box
Setting of loop information for the Signal Data Editor window
Select Pin dialog box
Selection of display pins in the Signal Data Editor window and Timing Chart window
Timing Chart window
Timing chart display of input and output signals
Search Data dialog box
Detailed search of the Timing Chart window
I/O Panel window
Creation of dummy target system
Parts Button Properties dialog box
Setting of button pin connection information
Analog Button Properties dialog box
Setting of analog button pin connection information
Parts Key Properties dialog box
Setting of key matrix LED pin information
Parts Level Gauge Properties dialog box
Setting of level gauge pin connection information
R20UT2867EJ0100 Rev.1.00
Feb 01, 2014
Page 174 of 572
CubeSuite+ V2.02.00
APPENDIX A WINDOW REFERENCE
Window/Dialog Box Name
Description
Parts Led Properties dialog box
Setting of key matrix LED pin information
Parts Segment LED Properties dialog box
Setting of 7/14-segment LED pin connection information
Parts Matrix Led Properties dialog box
Setting of matrix LED pin connection information
Parts Buzzer Properties dialog box
Setting of buzzer pin connection information
Pull up/Pull down dialog box
Setting of pull-up/pull-down resistor pin connection information
Object Properties dialog box
Setting of connection information for figure, character, and bitmap pins
Parts List dialog box
List display of object pin connection status in the I/O Panel window
Serial window
Serial interface communication window
Format (UART) dialog box
Setting of serial format (UART)
Format (CSI) dialog box
Setting of serial format (CSI)
R20UT2867EJ0100 Rev.1.00
Feb 01, 2014
Page 175 of 572
CubeSuite+ V2.02.00
APPENDIX A WINDOW REFERENCE
Main window
This window is automatically opened when CubeSuite+ is started up.
In this window, you can control the program execution and open panels for the debugging process.
Figure A-1. Main Window
(1)
(2)
(3)
(4)
This section describes the following.
- [How to open]
- [Description of each area]
[How to open]
- From the Windows [Start] menu, select [All Programs] >> [Renesas Electronics CubeSuite+] >> [CubeSuite+].
[Description of each area]
(1) Menubar
Menu items related to the debugging are as follows:
Remark
The items that can be selected in each menu can be customized using the User Setting dialog box.
(a) [View]
The [View] menu provides the following items and functions (default).
Watch
The following cascade menus are displayed to open the Watch panel.
These items are disabled when disconnected from the debug tool.
R20UT2867EJ0100 Rev.1.00
Feb 01, 2014
Page 176 of 572
CubeSuite+ V2.02.00
APPENDIX A WINDOW REFERENCE
Watch1
Opens the Watch panel (Watch1).
Watch2
Opens the Watch panel (Watch2).
Watch3
Opens the Watch panel (Watch3).
Watch4
Opens the Watch panel (Watch4).
Local Variable
Opens the Local Variables panel.
Call Stack
Opens the Call Stack panel.
Memory
The following cascade menus are displayed to open the Memory panel.
These items are disabled when disconnected from the debug tool.
Memory1
Opens the Memory panel (Memory1).
Memory2
Opens the Memory panel (Memory2).
Memory3
Opens the Memory panel (Memory3).
Memory4
Opens the Memory panel (Memory4).
SFR
Opens the SFR panel.
This item is disabled when disconnected from the debug tool.
CPU Register
Opens the CPU Register panel.
This item is disabled when disconnected from the debug tool.
Opens the Trace panelNote.
Trace
This item is disabled when disconnected from the debug tool.
Disassemble
The following cascade menus are displayed to open the Disassemble panel.
These items are disabled when disconnected from the debug tool.
Disassemble1
Opens the Disassemble panel (Disassemble1).
Disassemble2
Opens the Disassemble panel (Disassemble2).
Disassemble3
Opens the Disassemble panel (Disassemble3).
Disassemble4
Opens the Disassemble panel (Disassemble4).
Event
Opens the Events panel.
This item is disabled when disconnected from the debug tool.
Show Current PC
Displays the current PC position in the Editor panel.
Location
This item is disabled when disconnected from the debug tool.
Back to Last Cursor
Goes back to the position before jumping (see "(7) Jump to functions"/"(4) Move to the
Position
symbol defined location") to the defined location.
This item is disabled when disconnected from the debug tool.
Forward to Next Cursor
Forwards to the position before operating [Back to Last Cursor Position].
Position
Tag Jump
Jumps to the corresponding line/column in the corresponding file if the information of a file
name/line number/column number exists in the line at the caret position on the Editor panel/
Output panel (see "(8) Jump to a desired line (tag jump)").
Note [E1][E20][EZ Emulator]
This item is available only when the selected microcontroller incorporates the OCD trace function.
(b) [Debug]
The [Debug] menu provides the following items and functions (default).
R20UT2867EJ0100 Rev.1.00
Feb 01, 2014
Page 177 of 572
CubeSuite+ V2.02.00
Download
APPENDIX A WINDOW REFERENCE
Downloads the specified file(s) into the debug tool currently selected in the active project.
If CubeSuite+ is disconnected from the debug tool at this time, it is automatically connected
to the debug tool before a download is executed.
This item is disabled during program execution/build (not including rapid build) execution.
Build & Download
Builds a project and executes a download to the debug tool currently selected in the active
project after the build is complete. If CubeSuite+ is disconnected from the debug tool at this
time, it is automatically connected to the debug tool before a download is executed.
This item is disabled during program execution/build (not including rapid build) execution.
When the build has failed, download will not be executed.
Rebuild & Download
Rebuilds a project and executes a download to the debug tool currently selected in the
active project after the rebuild is complete. If CubeSuite+ is disconnected from the debug
tool at this time, it is automatically connected to the debug tool before a download is
executed.
This item is disabled during program execution/build (not including rapid build) execution.
When the rebuild has failed, download will not be executed.
Connect to Debug Tool
Connects to the debug tool currently selected in the active project.
This item is disabled while connected to the debug tool, during build (not including rapid
build) execution or if the version of compiler being used is not supported by CubeSuite+.
Hot Plug-in
Connects to the debug tool currently selected in the active project via the hot plug-in
[E1][E20]
function, in order to debug the target system currently running (see "2.4.3 Connect to the
debug tool using hot plug-in [E1][E20]").
This item is disabled while connected to the debug tool.
Upload...
Opens the Data Save dialog box to save the memory contents.
This item is disabled during program execution/build (not including rapid build) execution or
when disconnected from the debug tool.
Disconnect from
Disconnects from the currently connected debug tool.
Debug Tool
This item is disabled during program execution/build (not including rapid build) execution or
when disconnected from the debug tool.
Using Debug Tool
The following cascade menus are displayed to select the debug tool to use.
This item is disabled while connected to the debug tool.
RL78 IECUBE
Uses IECUBE as the debug tool.
RL78 E1(Serial)
Uses E1 with serial communication method as the debug tool.
RL78 E20(Serial)
Uses E20 with serial communication method as the debug tool.
RL78 EZ Emulator
Uses EZ Emulator with an evaluation kit and so on.
RL78 Simulator
Uses Simulator as the debug tool.
Stop
Forcibly stops the program currently being executed.
This item is disabled when the program is already halted or disconnected from the debug
tool.
Go
Executes the program from the current PC position.
Execution of the program will be stopped when the condition of a set break event is met.
This item is disabled during program execution/build (not including rapid build) execution or
when disconnected from the debug tool.
Ignore break and go
Executes the program from the current PC position.
Execution of the program continues, ignoring set break events and action events.
This item is disabled during program execution/build (not including rapid build) execution or
when disconnected from the debug tool.
R20UT2867EJ0100 Rev.1.00
Feb 01, 2014
Page 178 of 572
CubeSuite+ V2.02.00
APPENDIX A WINDOW REFERENCE
Executes the program step by stepNote from the current PC position (Step in execution).
Step In
However, in the case of a function call, the program is stopped at the beginning of the
function having been called.
This item is disabled during program execution/build (not including rapid build) execution or
when disconnected from the debug tool.
Executes the program step by stepNote from the current PC position (Step over execution).
Step Over
In the case of a function call by the CALL/CALLT/CALLF instruction, all the source lines/
instructions in the function are treated as one step and executed until the position where
execution returns from the function (step-by-step execution will continue until the same nest
is formed as when the CALL /CALLT/CALLF instruction has been executed).
In the case of an instruction other than CALL/CALLT/CALLF, operation is the same as when
[Step In] is selected.
This item is disabled during program execution/build (not including rapid build) execution or
when disconnected from the debug tool.
Return Out
Executes the program until execution returns from the current function (or returns to the
calling function)Note(Return out execution).
This item is disabled during program execution/build (not including rapid build) execution or
when disconnected from the debug tool.
CPU Reset
Resets the CPU (does not execute a program)
This item is disabled during build (not including rapid build) execution or when disconnected
from the debug tool.
Restart
Resets the CPU and then executes the program from the reset address.
This item is disabled during build (not including rapid build) execution or when disconnected
from the debug tool.
Note Step execution can be carried out either in units of source lines or in units of instructions.
For details, see "2.7.3 Execute programs in steps".
(2) Debug toolbar
The debug toolbar includes the buttons that control the execution of programs.
The debug toolbar provides the following buttons and functions (default).
Remarks 1.
The buttons on the toolbar can be customized using the User Setting dialog box. Furthermore, a
new toolbar can be created using the same dialog box.
2.
A Group of toolbar displayed can be selected with the context menu that is displayed by rightclicking on the toolbar.
Executes the build of a project and downloads the file into the debug tool currently selected in the active
project. If CubeSuite+ is disconnected from the debug tool at this time, it is automatically connected to the
debug tool before a download is executed.
This item is disabled during program execution/build (not including rapid build) execution.
When the build has failed, download will not be executed.
The function of this item is the same as that of [Build & Download] in the [Debug] menu.
Downloads the specified file(s) into the debug tool currently selected in the active project.
If CubeSuite+ is disconnected from the debug tool at this time, it is automatically connected to the debug
tool before a download is executed.
This item is disabled during program execution/build (not including rapid build) execution.
The function of this item is the same as that of [Download] in the [Debug] menu.
R20UT2867EJ0100 Rev.1.00
Feb 01, 2014
Page 179 of 572
CubeSuite+ V2.02.00
APPENDIX A WINDOW REFERENCE
Resets the CPU (does not execute a program)
This item is disabled during build (not including rapid build) execution or when disconnected from the
debug tool.
The function of this item is the same as that of [CPU Reset] in the [Debug] menu.
Forcibly stops the program currently being executed.
This item is disabled when the program is already halted or disconnected from the debug tool.
The function of this item is the same as that of [Stop] in the [Debug] menu.
Executes the program from the current PC position.
Execution of the program will be stopped when the condition of a set break event is met.
This item is disabled during program execution/build (not including rapid build) execution or when
disconnected from the debug tool.
The function of this item is the same as that of [Go] in the [Debug] menu.
Executes the program from the current PC position.
Execution of the program continues, ignoring set break events and action events.
This item is disabled during program execution/build (not including rapid build) execution or when
disconnected from the debug tool.
The function of this item is the same as that of [Ignore break and go] in the [Debug] menu.
Resets the CPU and then executes the program from the reset address.
This item is disabled during build (not including rapid build) execution or when disconnected from the
debug tool.
The function of this item is the same as that of [Restart] in the [Debug] menu.
Executes the program step by stepNote from the current PC position (Step in execution).
However, in the case of a function call, the program is stopped at the beginning of the function having been
called.
This item is disabled during program execution/build (not including rapid build) execution or when
disconnected from the debug tool.
The function of this item is the same as that of [Step In] in the [Debug] menu.
Executes the program step by stepNote from the current PC position (Step over execution).
In the case of a function call by the CALL/CALLT/CALLF instruction, all the source lines/instructions in the
function are treated as one step and executed until the position where execution returns from the function
(step-by-step execution will continue until the same nest is formed as when the CALL /CALLT/CALLF
instruction has been executed).
In the case of an instruction other than CALL/CALLT/CALLF, operation is the same as when the
button is clicked.
This item is disabled during program execution/build (not including rapid build) execution or when
disconnected from the debug tool.
The function of this item is the same as that of [Step Over] in the [Debug] menu.
Executes the program until execution returns from the current function (or returns to the calling
function)Note (Return out execution).
This item is disabled during program execution/build (not including rapid build) execution or when
disconnected from the debug tool.
The function of this item is the same as that of [Return Out] in the [Debug] menu.
Disconnects from the currently connected debug tool.
This item is disabled during program execution/build (not including rapid build) execution or when
disconnected from the debug tool.
The function of this item is the same as that of [Disconnect from Debug Tool] in the [Debug] menu.
Note Step execution can be carried out either in units of source lines or in units of instructions.
For details, see "2.7.3 Execute programs in steps".
R20UT2867EJ0100 Rev.1.00
Feb 01, 2014
Page 180 of 572
CubeSuite+ V2.02.00
APPENDIX A WINDOW REFERENCE
(3) Panel display area
This area displays the various panels.
For details on the display content, see the sections describing the individual panels.
(4) Statusbar
Statusbar displays the following items of information.
Figure A-2. Statusbar
(a)
(b)
(c)
(d)
(e)
(f)
(g)
(h)
(a) Status message
This area displays the following messages and other information.
- A brief explanation of the selected menu item
- A message reporting that an invalid value has been input in the panel/dialog
- A message reporting that the specified character string has not been found as a result of a search using
the Find and Replace dialog box
- A statement of the cause of the break when a break has occurred (see "2.8 Stop Programs (Break)")
(b) Focus panel status information
This area displays status information on the panel currently having the focus.
Note that nothing is displayed here for a panel that has no status information.
(c) Running state
This area displays the state of the program with the following icons and character strings.
Note that nothing is displayed here when the debug tool is not connected.
State of Program
Displayed Content
Under execution
RUN
Now halted
BREAK
Step execution in progress
STEP
Data collection in progressNote
COLLECTING DATA
Note See "2.16 Use Smart Analog Function [E1][E20]".
(d) CPU status
This area displays the current CPU status of the debug tool. When there is the possibility that the CPU is in
two or more statuses, the corresponding display contents are displayed separated by "&".
Note that nothing is displayed here when the debug tool is not connected.
R20UT2867EJ0100 Rev.1.00
Feb 01, 2014
Page 181 of 572
CubeSuite+ V2.02.00
APPENDIX A WINDOW REFERENCE
Debug Tool
Displayed Content
IECUBE
E1/E20
EZ Emulator
Simulator
Remark
CPU Status
Halt
In HALT mode
Stop
In STOP mode
Wait
In wait state
Reset
In reset state
Pow Off
Power not supplied to the target
Reset
In reset state
Pow Off
Power not supplied to the target
Halt
In HALT mode
Stop
In STOP mode
Reset
In reset state
Nothing is displayed here when the CPU is in status other than those listed above.
(e) Current PC position
This area displays the current PC position with a hexadecimal value. When this area is clicked, the caret
moves to the current PC position on the Editor panel.
In addition, when the mouse pointer is placed over this area, a pop-up window appears to display the following
information.
- Current PC: 0x current PC value (source name#line countNote )
Note that nothing is displayed here when the debug tool is not connected.
Note "symbol name+offset value" is displayed when acquisition of information is impossible.
Remark
"Running" is displayed in this area during execution of a program.
(f) Connection state
This area displays the current state of connection with the debug tool using the following icons and character
strings.
Connection State
Displayed Content
Connected
Debug tool name
Disconnected
DISCONNECTED
(g) Run-Break Timer measurement result
This area displays the result of measurement by the Run-Break Timer event (the unit of value used differs
depending on the measurement amount). See "2.12.1 Measure execution time until stop of the execution".
Note that nothing is displayed here when the debug tool is not connected.
Condition
Displayed Content
Un-measuring
Not measured
Under measurement
Measuring
When a timer measurement overflow has
OVERFLOW
occurred
R20UT2867EJ0100 Rev.1.00
Feb 01, 2014
Page 182 of 572
CubeSuite+ V2.02.00
APPENDIX A WINDOW REFERENCE
(h) Debug tool state [IECUBE][Simulator]
This area displays the current state of debug tool's functions using the following icons and character strings.
When a function is stopped, clicking the appropriate icon enables the state to be switched between "Use" and
"Not use"Note.
Note that nothing is displayed here when the debug tool is not connected.
Function
Being Executed
Stopped (Use)
Not Use
Trace
Timer
Coverage
Note [IECUBE]
Switching is impossible because the trace function, the timer function and the coverage function are
always used (the icon for "Not use" is not displayed).
[Simulator]
The result of switching will be reflected in the setting of the [Use trace function]/[Use timer function]/
[Use coverage function] property in the [Trace]/[Timer]/[Coverage] category on the [Debug Tool
Settings] tab of the Property panel.
R20UT2867EJ0100 Rev.1.00
Feb 01, 2014
Page 183 of 572
CubeSuite+ V2.02.00
APPENDIX A WINDOW REFERENCE
Project Tree panel
This panel is used to display the project components (microcontroller, build tool, debug tool, etc.) in a tree structure.
On this panel, you can select or change the debug tool to use.
Figure A-3. Project Tree Panel
(1)
The following items are explained here.
- [How to open]
- [Description of each area]
- [Context menu]
[How to open]
- From the [View] menu, select [Project Tree].
[Description of each area]
(1) Project tree area
Project components are displayed in tree view with the following given node.
R20UT2867EJ0100 Rev.1.00
Feb 01, 2014
Page 184 of 572
CubeSuite+ V2.02.00
APPENDIX A WINDOW REFERENCE
Node
RL78 Debug tool name (Debug tool)
Description
Debug tool name:
The debug tool (IECUBE, E1(Serial), E20(Serial), EZ Emulator or
Simulator) currently being used in the project is displayed.
[Simulator] is selected by default.
Select the debug tool node to configure with the Property panel. If the Property panel is not being opened, doubleclick the node to open the corresponding Property panel.
[Context menu]
Using Debug Tool
The following cascade menus are displayed to select the debug tool to use.
RL78 IECUBE
Uses IECUBE as the debug tool.
RL78 E1(Serial)
Uses E1 with serial communication method as the debug tool.
RL78 E20(Serial)
Uses E20 with serial communication method as the debug tool.
RL78 EZ Emulator
Uses EZ Emulator with an evaluation kit and so on.
RL78 Simulator
Uses Simulator as the debug tool.
Property
R20UT2867EJ0100 Rev.1.00
Feb 01, 2014
Displays the selected category node's property in the Property panel.
Page 185 of 572
CubeSuite+ V2.02.00
APPENDIX A WINDOW REFERENCE
Property panel
This panel is used to display and set the debug tool operation environment that is selected in the Project Tree panel.
Figure A-4. Property Panel (When IECUBE Is Selected)
(1)
(2)
This section describes the following.
- [How to open]
- [Description of each area]
- [[Edit] menu (Property panel-dedicated items)]
- [Context menu]
[How to open]
- On the Project Tree panel, select the [RL78 Debug tool name (Debug Tool)] node to use, and then select [Property]
from the [View] menu or the context menu.
- On the Project Tree panel, double-click the [RL78 Debug tool name (Debug Tool)] node to use.
Remark
If this panel has been opened, the detailed information on the debug tool is displayed by selecting the [RL78
Debug tool name (Debug Tool)] node on the Project Tree panel.
[Description of each area]
(1) Detailed information display/change area
In this area, the detailed information on the debug tool that is selected in Project Tree panel is displayed by
category in the list. Also, you can directly change its settings.
The
mark is indicates all the items in the category are expanded. The
mark indicates all the items are
collapsed. You can expand/collapse the items by clicking these marks or double-clicking the category name.
Note that only the hexadecimal number is allowed in the text box if the
mark is displayed in the property
configuration area.
For details on the information/how to setup in the category and property items contained in it, see the section
explaining the corresponding tab.
R20UT2867EJ0100 Rev.1.00
Feb 01, 2014
Page 186 of 572
CubeSuite+ V2.02.00
APPENDIX A WINDOW REFERENCE
(2) Tab selection area
Categories for the display of the detailed information are changed when each tab is selected.
In this panel, following tabs are contained (see the section explaining each tab for details on the display/setting on
the tab).
-
[Connect Settings] tab
-
[Debug Tool Settings] tab
-
[Flash Self Emulation Settings] tab [IECUBE]
-
[DataFlash Emulation Settings] tab [IECUBE]
-
[Download File Settings] tab
-
[Hook Transaction Settings] tab
[[Edit] menu (Property panel-dedicated items)]
Undo
Undoes the latest property value editing being done.
Cut
Deletes the selected character string(s) and copies them to the clipboard while editing the property
value.
Copy
Copies the contents of the selected range to the clipboard as character string(s).
Paste
Pastes the contents of the clipboard to the property value while editing the property value.
Delete
Deletes the selected character string(s) while editing the property value.
Select All
Selects all the character strings in the selected property while editing the property value.
[Context menu]
[While not editing the property value]
Reset to Default
Restores the selected setting of the property item to default value.
Reset All to Default
Restores all the selected settings of the property items on the tab to default value.
[While editing the property value]
Undo
Undoes the latest property value editing being done.
Cut
Deletes the selected character string(s) and copies them to the clipboard while editing the property
value.
Copy
Copies the contents of the selected range to the clipboard as character string(s).
Paste
Pastes the contents of the clipboard to the property value while editing the property value.
Delete
Deletes the selected character string(s) while editing the property value.
Select All
Selects all the character strings in the selected property while editing the property value.
R20UT2867EJ0100 Rev.1.00
Feb 01, 2014
Page 187 of 572
CubeSuite+ V2.02.00
APPENDIX A WINDOW REFERENCE
[Connect Settings] tab
This tab is used to display the detailed information categorized by the following and the configuration can be changed.
(1) [Internal ROM/RAM]
(2) [Clock]
(3) [Connection with Target Board] (except [Simulator])
(4) [Flash] [E1][E20][EZ Emulator]
(5) [Hot Plug-in] [E1][E20]
(6) [Configuration] [Simulator]
Figure A-5. Property Panel: [Connect Settings] Tab [IECUBE]
(1)
(2)
(3)
Figure A-6. Property Panel: [Connect Settings] Tab [E1][E20][EZ Emulator]
(1)
(2)
(3)
Note
(4)
(5)
R20UT2867EJ0100 Rev.1.00
Feb 01, 2014
Page 188 of 572
CubeSuite+ V2.02.00
APPENDIX A WINDOW REFERENCE
Note The [Power target from the emulator (MAX200mA)] property appears only when E1 is used.
Figure A-7. Property Panel: [Connect Settings] Tab [Simulator]
(1)
(2)
(6)
[Description of each category]
(1) [Internal ROM/RAM]
The detailed information on internal ROM/RAM is displayed and its configuration can be changed.
Caution
You should be careful not to overlap the area with other memory mapping area.
Size of internal
ROM[KBytes]
Display and change the internal ROM size of the selected microcontroller.
Default
Internal ROM size of the selected microcontroller
Modifying
[IECUBE][Simulator]
Select from the drop-down list.
[E1][E20][EZ Emulator]
Changes not allowed
Available
Depends on the selected microcontroller.
values
Size of internal
RAM[Bytes]
Display and change the internal RAM size of the selected microcontroller.
Default
Internal RAM size of the selected microcontroller
Modifying
[IECUBE][Simulator]
Select from the drop-down list.
[E1][E20][EZ Emulator]
Changes not allowed
Available
Depends on the selected microcontroller.
values
Size of DataFlash
memory[KBytes]
Displays the size of the data flash memory area of the selected microcontroller.
Default
Data flash memory size of the selected microcontroller
Modifying
Changes not allowed
(except [Simulator])
R20UT2867EJ0100 Rev.1.00
Feb 01, 2014
Page 189 of 572
CubeSuite+ V2.02.00
APPENDIX A WINDOW REFERENCE
(2) [Clock]
The detailed information on clocks is displayed and its configuration can be changed.
Main clock source
Select the main clock source to input to the CPU.
[IECUBE]
Default
Generate by emulator
Modifying
Select from the drop-down list.
Note that changes can be made only when disconnected from the debug tool.
Available
values
Generate by emulator
Uses a clock generated inside IECUBE.
External
Uses a main clock (square wave) on the target board.
Clock socket
Uses a clock of the transmitter on the clock socket.
Main clock frequency
Specify the main clock frequency in MHz unit.
[MHz]
[IECUBE]
This property appears only when the [Main clock source] property is set to [Generate by
emulator].
Default
[IECUBE][Simulator]
4.00
[E1][E20][EZ Emulator]
Using internal clock
Modifying
Select from the drop-down list or directly enter from the keyboard.
Available
[IECUBE]
values
- Either one of the following from the drop-down listNote 1
1.00, 2.00, 3.00, 3.57, 4.00, 4.19, 4.91, 5.00, 6.00, 8.00, 8.38, 10.00, 12.00,
16.00, 20.00 (unit: MHz)
[E1][E20][EZ Emulator]Note 2
- Either one of the following from the drop-down list
Using internal clock, 2.00, 3.00, 3.57, 4.00, 4.19, 4.91, 5.00, 6.00, 8.00, 8.38,
10.00, 12.00, 16.00, 20.00 (unit: MHz)
- Directly enter the numbers ranged below
0.001 to 99.999 (unit: MHz)
[Simulator]
- Either one of the following from the drop-down list
2.00, 3.00, 3.57, 4.00, 4.19, 4.91, 5.00, 6.00, 8.00, 8.38, 10.00, 12.00, 16.00,
20.00 (unit: MHz)
- Directly enter the numbers ranged below
0.001 to 99.999 (unit: MHz)
Sub clock source
[IECUBE]
Select the sub clock source to input to the CPU and peripheral microcontrollers.
Default
Generate by emulator
Modifying
Select from the drop-down list.
Note that changes can be made only when disconnected from the debug tool.
Available
values
R20UT2867EJ0100 Rev.1.00
Feb 01, 2014
Generate by emulator
Uses a clock generated inside IECUBE.
External
Uses a main clock (square wave) on the target board.
Page 190 of 572
CubeSuite+ V2.02.00
APPENDIX A WINDOW REFERENCE
Sub clock
Specify the sub clock frequency in kHz unit.
frequency[kHz]
[IECUBE]
This property appears only when the [Sub clock source] property is set to [Generate by
emulator].
Default
[IECUBE][Simulator]
32.768
[E1][E20][EZ Emulator]
Using internal clock
Modifying
Select from the drop-down list or directly enter from the keyboard.
Available
[IECUBE]
values
32.768 or 38.40 (unit: kHz)
[E1][E20][EZ Emulator]
- Either one of the following from the drop-down list
Using internal clock, 32.768, 38.40 (unit: kHz)
- Directly enter the numbers ranged below
0.001 to 99.999 (unit: kHz)
[Simulator]
- Either one of the following from the drop-down list
32.768 or 38.40 (unit: kHz)
- Directly enter the numbers ranged below
0.001 to 99.999 (unit: kHz)
Monitor clock
[E1][E20]
Select a clock for monitor programs to operate while the program is stopped.
Default
System
Modifying
Select from the drop-down list.
Available
System
Operates with main clock.
User
Operates with the clock that the program specified.
[EZ Emulator]
values
Select Timer/Trace
clock frequency
Select the clock frequency for using timer/trace function.
Default
CPU clock frequency
Modifying
Select from the drop-down list.
Available
CPU clock frequency
Uses the CPU clock frequency.
Specify clock
Specifies an arbitrary frequency (property items to specify
frequency
become valid in the lower area).
[Simulator]
values
Unit of Timer/Trace
Select the unit of the clock frequency for timer/trace.
clock frequency
This property appears only when the [Select Timer/Trace clock frequency] property is set to
[Simulator]
[Specify clock frequency].
Default
MHz
Modifying
Select from the drop-down list.
Available
MHz
The unit of the frequency is in MHz.
KHz
The unit of the frequency is in kHz.
values
R20UT2867EJ0100 Rev.1.00
Feb 01, 2014
Page 191 of 572
CubeSuite+ V2.02.00
APPENDIX A WINDOW REFERENCE
Timer/Trace clock
The operation of this property differs depending on the specification with the [Select Timer/Trace
frequency
clock frequency] property.
[Simulator]
- When [Specify clock frequency] is specified
Specify the clock frequency for timer/trace.
- When [CPU clock frequency] is specified, displays the following (changes not allowed)
While disconnected from the debug tool:
[---_---]
While connected to the debug tool:
[CPU clock frequency]
Default
4.00
Modifying
Directly enter from the keyboard.
Available
1 kHz to 99.999 MHz
values
Unit is depending on the specification with the [Unit of Timer/Trace clock frequency]
property.
Notes 1.
2.
You can also select the frequency greater than 20.00 MHz, depending on the selected microcontroller.
When using X1/X2 oscillation, specify the clock frequency.
When using an external clock oscillation with the embedded PLL circuit, specify the frequency of the
transmitter/resonator (the frequency before the setting of the PLL clock).
(3) [Connection with Target Board] (except [Simulator])
The detailed information on the connection to the target board is displayed and its configuration can be changed.
Note that this category does not appear if no property displayed exists according to the type of the selected
microcontroller.
Connecting with target
board
Select if the target board is connected to IECUBE or not.
Default
No
Modifying
Select from the drop-down list.
[IECUBE]
Note that changes can be made only when disconnected from the debug tool.
Available
values
Yes
Target board is connected.
No
Target board is not connected.
Communication
Select the communication method for the emulator to communicate in serial mode with
method
microcontrollers on the target board.
[E1][E20]
This property appears only when the communication method of the selected microcontroller can
[EZ Emulator]
be changed
Default
1 line type (TOOL0)
Modifying
Select from the drop-down list.
Note that changes can be made only when disconnected from the debug tool.
Available
values
1 line type (TOOL0)
The communication method is to use 1 line type (TOOL0).
2 line type
The communication method is to use 2 line type
(TOOL0+TOOL1)
(TOOL0+TOOL1).
Low voltage OCD
Select whether to use a low voltage OCD board.
board
This property appears only when the selected microcontroller supports a low voltage OCD
[E1]
board.
[EZ Emulator]
Default
No
Modifying
Select from the drop-down list.
Available
Yes
Uses a low voltage OCD board.
No
Does not use a low voltage OCD board.
values
R20UT2867EJ0100 Rev.1.00
Feb 01, 2014
Page 192 of 572
CubeSuite+ V2.02.00
APPENDIX A WINDOW REFERENCE
Power target from the
Select whether to supply power to the target board from E1.
emulator (MAX 200mA)
This property appears only when the [Low voltage OCD board] property is set to [No] if it is
[E1]
displayed.
Default
No
Modifying
Select from the drop-down list.
Note that changes can be made only when disconnected from the debug tool.
Available
values
Yes
Supplies power to the target board.
No
Does not supply power to the target board.
Supply voltage
Select the power voltage supplied to the target board.
[E1]
This property appears only when the [Power target from the emulator (MAX 200mA)] property is
set to [Yes].
Default
3.3V
Modifying
Select from the drop-down list.
Note that changes can be made only when disconnected from the debug tool.
Available
3.3V, 5.0V
values
(4) [Flash] [E1][E20][EZ Emulator]
The detailed information on the flash memory writing is displayed and its configuration can be changed.
Security ID
Specify a security ID for reading codes in the internal ROM or internal flash memoryNote.
This property appears only when the selected microcontroller supports the ROM security
function (security ID) for flash memory.
Default
00000000000000000000
Modifying
Directly enter from the keyboard.
Note that changes can be made only when disconnected from the debug tool.
Available
0x0 to 0xFFFFFFFFFFFFFFFFFFFE in hexadecimal number
values
Permit flash
programming
Select whether to enable flash rewrite.
Default
Yes
Modifying
Select from the drop-down list.
Available
Yes
Enables flash rewrite.
No
Disables flash rewrite.
values
The flash memory area cannot be rewritten at all from the debug tool.
Use wide voltage mode
Select whether to rewrite the flash memory with the wide voltage mode.
This property appears only when the selected microcontroller supports the wide voltage mode
for the flash memory rewriting.
Default
Yes
Modifying
Select from the drop-down list.
Note that changes can be made only when disconnected from the debug tool.
Available
values
R20UT2867EJ0100 Rev.1.00
Feb 01, 2014
Yes
Rewrites the flash memory with the wide voltage mode.
No
Rewrites the flash memory with the normal mode.
Page 193 of 572
CubeSuite+ V2.02.00
APPENDIX A WINDOW REFERENCE
Erase flash ROM when
Select whether to erase flash ROM when connecting to the debug tool.
starting
This property appears only when the [Permit flash programming] property is set to [Yes].
[E1][E20]
When conducting hot plug-in connection, the setting of this property will be ignored and flash
ROM will not be erased.
Default
No
Modifying
Select from the drop-down list.
Note that changes can be made only when disconnected from the debug tool.
Available
Yes
values
Erases the flash ROM when connecting to the debug tool.
Note that after connecting to the debug tool, this property automatically
selects [No].
No
Does not erase flash ROM when connecting to the debug tool.
Note For details on the on-chip debug security ID, see User's Manual of the emulator.
(5) [Hot Plug-in] [E1][E20]
The detailed information on hot plug-in connection is displayed and its configuration can be changed.
Note that this category appears only when the selected microcontroller incorporates the hot plug-in function.
Retrying interval[ms]
Specify the interval in 1-ms units for retrying connection in the case of hot plug-in connection
when the emulator fails to communicate with the microcontroller on the target board.
Default
1000
Modifying
Directly enter from the keyboard.
Note that changes can be made only when disconnected from the debug tool.
Available
0 to 60000 in decimal number
values
Number of times of
Specify the number of times for retrying connection in the case of hot plug-in connection when
retrying
the emulator fails to communicate with the microcontroller on the target board.
Default
3
Modifying
Directly enter from the keyboard.
Note that changes can be made only when disconnected from the debug tool.
Available
0 to 3 in decimal number
values
(6) [Configuration] [Simulator]
The detailed information when customizing the simulator is displayed and its configuration can be changed.
Use simulator
Select whether to use the simulator configuration file to perform user customization (adding of
configuration file
user models) of the simulator.
Default
No
Modifying
Select from the drop-down list.
Note that changes can be made only when disconnected from the debug tool.
Available
values
R20UT2867EJ0100 Rev.1.00
Feb 01, 2014
Yes
Uses the simulator configuration file.
No
Does not use the simulator configuration file.
Page 194 of 572
CubeSuite+ V2.02.00
APPENDIX A WINDOW REFERENCE
Simulator configuration
Specify the simulator configuration file to be use.
file
This property appears only when the [Use simulator configuration file] property is set to [Yes].
Default
Blank
Modifying
Directly enter from the keyboard, or specify with the Select Simulator Configuration
File dialog box [Simulator] opened by clicking the [...] button.
Note that changes can be made only when disconnected from the debug tool.
R20UT2867EJ0100 Rev.1.00
Feb 01, 2014
Page 195 of 572
CubeSuite+ V2.02.00
APPENDIX A WINDOW REFERENCE
[Debug Tool Settings] tab
This tab is used to display the detailed information categorized by the following and the configuration can be changed.
(1) [Memory]
(2) [Access Memory While Running]
(3) [Set Event While Running] [IECUBE]
(4) [Break]
(5) [Fail-safe Break] [IECUBE]
(6) [Trace]
(7) [Timer] [IECUBE][Simulator]
(8) [Coverage] [IECUBE][Simulator]
(9) [Mask for Input Signal] (except [Simulator])
(10) [Smart Analog] [E1][E20]
(11) [Simulator GUI] [Simulator]
Figure A-8. Property Panel: [Debug Tool Settings] Tab [IECUBE]
(1)
(2)
(3)
(4)
(5)
(6)
(7)
(8)
(9)
R20UT2867EJ0100 Rev.1.00
Feb 01, 2014
Page 196 of 572
CubeSuite+ V2.02.00
APPENDIX A WINDOW REFERENCE
Figure A-9. Property Panel: [Debug Tool Settings] Tab [E1][E20][EZ Emulator]
(1)
(2)
(4)
(6)
(9)
(10)
Figure A-10. Property Panel: [Debug Tool Settings] Tab [Simulator]
(1)
(2)
(4)
(6)
(7)
(8)
(11)
R20UT2867EJ0100 Rev.1.00
Feb 01, 2014
Page 197 of 572
CubeSuite+ V2.02.00
APPENDIX A WINDOW REFERENCE
[Description of each category]
(1) [Memory]
The detailed information on memories is displayed and its configuration can be changed.
For details on memory types that are displayed, see the "Memory Mapping dialog box".
Memory mappings
Current memory mapping status is displayed by the types of memory areaNote.
Default
[Total number of the memory mapping types]
Modifying
Specify with the Memory Mapping dialog box.
The Memory Mapping dialog box is opened by clicking the [...] button that appears
at the right edge of this field when you select the mapping value (you cannot
change the mapping value on this panel).
Displayed
Displays the memory mapping status by the types of memory area.
Content
The following detailed information is displayed by clicking the "+" mark of each
memory type.
- Memory type
- Start address
- End address
- Access width[bits]
Verify on writing to
memory
Select whether to perform a verify check when the memory value is initialized.
Default
Yes
Modifying
Select from the drop-down list.
Available
Yes
Executes the verify check.
No
Does not execute the verify check.
(except [Simulator])
values
Note The type is of the memory mapping area registered in the device file.
(2) [Access Memory While Running]
The detailed information on memory accesses while executing a program (real-time display update function: see
"(4) Display/modify the memory contents during program execution") is displayed and its configuration can be
changed.
Access by stopping
execution
(except [Simulator])
[IECUBE]
For a memory area not accessible during execution of a program, select whether access to
the area is permitted (target memory area/SFR area/CPU registers).
[E1][E20][EZ Emulator]
Select whether to allow access to the memory area while executing a programNot.e.
Default
No
Modifying
Select from the drop-down list.
Available
Yes
Temporarily stops execution and reads/writes.
No
Does not access to the memory during execution of a program.
values
R20UT2867EJ0100 Rev.1.00
Feb 01, 2014
Page 198 of 572
CubeSuite+ V2.02.00
APPENDIX A WINDOW REFERENCE
Update display during
Select whether to update the display in the Memory panel/Watch panel during a program
the execution
execution.
Default
Yes
Modifying
Select from the drop-down list.
Available
Yes
Updates the display during program execution.
No
Does not update the display during program execution.
values
Display update
Specify the interval in 100ms unit to update the contents in the Memory panel/Watch panel
interval[ms]
display while executing a program.
This property appears only when the [Update display during the execution] property is set to
[Yes].
Default
500
Modifying
Directly enter from the keyboard.
Available
Integer number between 100 and 65500 (rounding up the fractions less than 100
values
ms).
Note [E1][E20][EZ Emulator]
When [1 line type (TOOL0)] is specified with the [Communication method] property in the [Connection with
Target Board] (except [Simulator]) category, if this property is set to [Yes], the debug tool's response speed
will be greatly slow.
(3) [Set Event While Running] [IECUBE]
The detailed information on the function of the event setting during program execution is displayed and its
configuration can be changed.
Set event by stopping
Select whether to forcibly pause the execution for events that cannot be set while executing the
execution momentarily
program.
For details on the event types that are affected by this property, see "(2) Event types that can be
set and deleted during execution".
Default
No
Modifying
Select from the drop-down list.
Available
Yes
Sets these events by stopping the program execution momentarily.
No
Does not allow to set these events during program execution.
values
(4) [Break]
The detailed information on break functions is displayed and its configuration can be changed.
First using type of
Select the type of the breakpoint to use with priority when setting it at the source line or the
breakpoint
execution address with a one click operation of the mouse in the Editor panel/Disassemble
(except [Simulator])
panel.
This property does not appear when the selected microcontroller supports only one breakpoint
type.
Default
Software break
Modifying
Select from the drop-down list.
Available
Software break
Sets software breakpoint with priority.
Hardware break
Sets hardware breakpoint with priority.
values
R20UT2867EJ0100 Rev.1.00
Feb 01, 2014
Page 199 of 572
CubeSuite+ V2.02.00
APPENDIX A WINDOW REFERENCE
Stop emulation of timer
Select whether to terminate the peripheral emulation of timers while stopping the program
group when stopping
execution (Peripheral Break).
(except [Simulator])
Default
No
Modifying
Select from the drop-down list.
Available
Yes
Terminates the peripheral emulation of timersNote 1.
No
Does not terminate the peripheral emulation of timers.
values
Stop emulation of
Select whether to terminate the peripheral emulation of serials while stopping the program
serial group when
execution (Peripheral Break).
stopping
This property appears only when the selected microcontroller supports this function.
(except [Simulator])
Default
No
Modifying
Select from the drop-down list.
Available
Yes
Terminates the peripheral emulation of serials.
No
Does not terminate the peripheral emulation of serials.
values
Use open break
Select whether to use the open break function.
function
This property appears only when the selected microcontroller supports the open break function.
[IECUBE]
Default
Depends on the selected microcontroller.
Modifying
Select from the drop-down list.
Available
Yes(Hi-Z)
The open break target pin becomes the Hi-Z state after the
values
CPU is stopped.
No(Output signal)
The open break target pin outputs the signal even after the
CPU is stopped.
Restore the breakpoint
Select whether to restore the breakpoints when a pin reset occurs.
when pin reset occurs
This property appears only when the selected microcontroller supports this function, and [Yes] is
[E1][E20]
specified for the [Permit flash programming] property.
[EZ Emulator]
Default
Yes
Modifying
Select from the drop-down list.
Available
Yes
values
The CPU is briefly halted for restoration of the breakpoints after a pin
reset.
No
The breakpoints are ignored and not restored after a pin reset, but are
restored when the program is stopped.
Execute instruction at
Select the timing to stop the program execution by breakpoints either after or before the
breakpoint when break
execution of the instruction at the breakpoint.
[Simulator]
Default
No
Modifying
Select from the drop-down list.
Available
Yes
Breaks after executing the instructionNote 2.
No
Breaks before executing the instruction.
values
Notes 1.
[E1][E20][EZ Emulator]
In the case of the selected microcontroller that provides the open break function, when this property is
set to [Yes], the open break target pin becomes the Hi-Z state after the CPU is stopped (when this
property is set to [No], the open break target pin outputs the signal even after the CPU is stopped).
2.
When [Yes] is selected, all of action events currently being set are handled as Hardware Break events
(see "2.14 Set an Action into Programs").
R20UT2867EJ0100 Rev.1.00
Feb 01, 2014
Page 200 of 572
CubeSuite+ V2.02.00
APPENDIX A WINDOW REFERENCE
(5) [Fail-safe Break] [IECUBE]
The detailed information on fail-safe break functions is displayed and its configuration can be changed.
Stop when fetched
from fetch protected
area
Select whether to stop the execution right after fetching from the fetch protected area.
Default
Yes
Modifying
Select from the drop-down list.
Available
Yes
Stops right after fetching.
No
Does not stop even after fetching.
values
Stop when wrote to
write protected area
Select whether to stop the execution right after writing to the write protected area.
Default
Yes
Modifying
Select from the drop-down list.
Available
Yes
Stops right after writing.
No
Does not stop even after writing.
values
Stop when read from
read protected SFR
Select whether to stop the execution right after reading from the read protected SFR.
Default
Yes
Modifying
Select from the drop-down list.
Available
Yes
Stops right after reading.
No
Does not stop even after reading.
values
Stop when wrote to
write protected SFR
Select whether to stop the execution right after writing to the write protected SFR.
Default
Yes
Modifying
Select from the drop-down list.
Available
Yes
Stops right after writing.
No
Does not stop even after writing.
values
Stop when overflowed
Select whether to stop the execution right after the user stack overflow occurs.
user stack
Default
No
Modifying
Select from the drop-down list.
Available
Yes
Stops right after the occurrence.
No
Does not stop even after the occurrence.
values
User stack top address
Specify the top address of the user stack.
Default
@STEND
Modifying
Directly enter from the keyboard.
Available
Address expression from 0 to the "end address of the address space".
values
Stop when
Select whether to stop the execution right after the user stack underflow occurs.
underflowed user stack
Default
No
Modifying
Select from the drop-down list.
Available
Yes
Stops right after the occurrence.
No
Does not stop even after the occurrence.
values
R20UT2867EJ0100 Rev.1.00
Feb 01, 2014
Page 201 of 572
CubeSuite+ V2.02.00
User stack bottom
address
APPENDIX A WINDOW REFERENCE
Specify the bottom address of the user stack.
Default
@STBEG
Modifying
Directly enter from the keyboard.
Available
Address expression from 0 to the "end address of the address space".
values
Stop when operated
Select whether to stop the execution right after the operation of the stack pointer that is not
uninitialized stack
initialized.
pointer
Default
Yes
Modifying
Select from the drop-down list.
Available
Yes
Stops right after the operation.
No
Does not stop even after the operation.
values
Stop when read from
uninitialized RAM
Select whether to stop the execution right after reading from the RAM that is not initialized.
Default
Yes
Modifying
Select from the drop-down list.
Available
Yes
Stops right after reading.
No
Does not stop even after reading.
values
Stop when accessed to
Select whether to stop the execution right after accessing to the areas where are not memory
non-mapping area
mapped in the [Memory Mappings] property in the [Memory] category.
Default
Yes
Modifying
Select from the drop-down list.
Available
Yes
Stops right after accessing.
No
Does not stop even after accessing.
values
Stop when word miss-
Select whether to stop the execution right after accessing to the odd number address by the
align accessed
word width.
Default
Yes
Modifying
Select from the drop-down list.
Available
Yes
Stops right after accessing.
No
Does not stop even after accessing.
values
Stop when received fail
safe from peripheral
Select whether to stop the execution right after the fail safe from the peripheral occurs.
Default
Yes
Modifying
Select from the drop-down list.
Available
Yes
Stops right after the occurrence.
No
Does not stop even after the occurrence.
values
Stop when occurred
flash illegal
Select whether to stop the execution right after the flash illegal occurs.
Default
Yes
Modifying
Select from the drop-down list.
Available
Yes
Stops right after the occurrence.
No
Does not stop even after the occurrence.
values
R20UT2867EJ0100 Rev.1.00
Feb 01, 2014
Page 202 of 572
CubeSuite+ V2.02.00
APPENDIX A WINDOW REFERENCE
(6) [Trace]
The detailed information on trace functions is displayed and its configuration can be changed.
Caution
[E1]E20][EZ Emulator]
This category appears only when the selected microcontroller incorporates the OCD trace
function.
Use trace function
Select whether to use the trace functionNote 1.
[E1][E20]
Default
No
Modifying
Select from the drop-down list.
Available
Yes
Uses trace functions.
No
Does not use trace functions.
[EZ Emulator]
[Simulator]
values
Clear trace memory
before running
Select whether to clear the trace memory before executing.
Default
Yes
Modifying
Select from the drop-down list.
Available
Yes
Clears the trace memory.
No
Does not clear the trace memory.
[IECUBE]
[Simulator]
values
Operation after trace
memory is full
Select the operation after the trace memory is full with the collected trace data.
Default
Non stop and overwrite to trace memory
Modifying
Select from the drop-down list.
Available
Non stop and overwrite
Continues overwriting trace data even after trace
values
to trace memory
memory is used up.
Stop trace
Stops overwriting trace data when trace memory is
used up (the program execution will not be stopped).
Stop
Stops running the program and overwriting trace data
[IECUBE]
when trace memory is used up.
[Simulator]
Rate of frequency
division of trace time
tag
[IECUBE]
Select the frequency division ratio of the counter to be used for time tag display.
Default
1/1(4ns/0.3min)
Modifying
Select from the drop-down list.
Available
1/1(4ns/0.3min)
1/2(8ns/0.6min)
1/4(17ns/1.2min)
values
1/8(33ns/2.4min)
1/16(67ns/4.8min)
1/32(133ns/9.5min)
1/64(267ns/19.1min)
1/128(533ns/38.2min)
1/256(1067ns/1.3h)
1/512(2133ns/2.5h)
1/1024(4267ns/5.1h)
1/2048(8533ns/10.2h)
1/4096(17067ns/20.4h)
(Values in "()" indicate the resolution, and the maximum measurement time when using
a external clock of 240 MHz).
Accumulate trace time
[Simulator]
Select whether to display the accumulated tracing time in the Trace panel.
Default
No
Modifying
Select from the drop-down list.
Available
Yes
Displays the accumulated tracing time.
No
Displays the trace time with differential value.
values
R20UT2867EJ0100 Rev.1.00
Feb 01, 2014
Page 203 of 572
CubeSuite+ V2.02.00
Trace memory
size[frames]
APPENDIX A WINDOW REFERENCE
Select the size of memory that stores trace data by the number of trace framesNote 2.
Default
[E1][E20]
[E1][E20][EZ Emulator]
Depends on the selected microcontroller.
[EZ Emulator]
[Simulator]
[Simulator]
4K
Modifying
[E1][E20][EZ Emulator]
Changes not allowed
[Simulator]
Select from the drop-down list.
Available
values
[Simulator]
4K, 8K, 12K, 16K, 20K, 24K, 28K,32K, 36K, 40K, 44K, 48K, 52K,56K, 60K, 64K,
128K, 192K, 256K, 320K, 384K, 448K, 512K, 576K, 640K, 704K, 768K, 832K,
896K, 960K, 1M, 2M, 3M
Notes 1.
This property is automatically set to [Yes] when selecting [Start Tracing]/[Stop Tracing] from the context
menu in the Editor panel/Disassemble panel.
[E1]E20][EZ Emulator]
This property is automatically changed in accordance with the property setting of the build tool used.
2.
The trace frame is a unit of trace data. Each fetch/write/read uses one trace frame.
(7) [Timer] [IECUBE][Simulator]
The detailed information on timer functions is displayed and its configuration can be changed.
Rate of frequency
Select the frequency division ratio of the timer counter (120 MHz) used for timer
division of timer
measurementNote.
[IECUBE]
Default
1/2(17ns/1.2min) (Resolution/maximum measurement time are displayed in "()").
Modifying
Select from the drop-down list.
Available
1/1(8ns/0.6min),
1/2(17ns/1.2min),
values
1/8(67ns/4.8min),
1/16(133ns/9.5min),
1/4(33ns/2.4min),
1/32(267ns/19.1min),
1/64(533ns/38.2min),
1/128(1067ns/1.3h),
1/256(2133ns/2.5h),
1/512(4267ns/5.1h),
1/1024(8533ns/10.2h),
1/2048(17067ns/20.4h),
1/4096(34133ns/40.7h
Use timer function
[Simulator]
Select whether to use the timer function.
Default
No
Modifying
Select from the drop-down list.
Available
Yes
Uses timer functions.
No
Does not use timer functions.
values
Note It is not possible to divide the timer counter for the Run-Break time.
(8) [Coverage] [IECUBE][Simulator]
The detailed information on coverage functions is displayed and its configuration can be changed.
R20UT2867EJ0100 Rev.1.00
Feb 01, 2014
Page 204 of 572
CubeSuite+ V2.02.00
Use coverage function
[Simulator]
APPENDIX A WINDOW REFERENCE
Select whether to use the coverage function.
Default
No
Modifying
Select from the drop-down list.
Available
Yes
Uses coverage functions
No
Does not use coverage functions
values
Reuse coverage result
Select whether to load/save the coverage measurement result when connecting to or
disconnecting from the debug tool.
[Simulator]
This property appears only when the [Use coverage function] property is set to [Yes].
Default
No
Modifying
Select from the drop-down list.
Available
Yes
Loads/saves the coverage measurement result.
No
Does not load/save the coverage measurement result.
values
(9) [Mask for Input Signal] (except [Simulator])
The detailed information on the masking input signal is displayed and its configuration can be changed.
Cautions 1.
[E1][E20]
The properties in this category are disabled in the case of a hot plug-in connection.
That is, the program operates as if the specification for the properties is [No] (the properties
become enabled again after reconnection with CubeSuite+).
2.
[E1][E20]
Maskable signals differ depending on the selected microcontroller type (a signal that
cannot be masked will be hidden).
Mask WAIT signal
Select whether to mask WAIT signal to prevent the signal input to emulators.
[IECUBE]
Default
NoNote
Modifying
Select from the drop-down list.
Available
Yes
Masks WAIT signal.
No
Does not mask WAIT signal.
values
Mask TARGET RESET
signal
Select whether to mask TARGET RESET signal to prevent the signal input to emulators.
Default
NoNote
Modifying
Select from the drop-down list.
Available
Yes
Masks TARGET RESET signal.
No
Does not mask TARGET RESET signal.
values
Mask INTERNAL
RESET signal
Select whether to mask INTERNAL RESET signal to prevent the signal input to emulators.
Default
No
Modifying
Select from the drop-down list.
Available
Yes
Masks INTERNAL RESET signal.
No
Does not mask INTERNAL RESET signal.
values
R20UT2867EJ0100 Rev.1.00
Feb 01, 2014
Page 205 of 572
CubeSuite+ V2.02.00
Mask NMI signal
[IECUBE]
APPENDIX A WINDOW REFERENCE
Select whether to mask NMI signal to prevent the signal input to emulators.
Default
No
Modifying
Select from the drop-down list.
Available
Yes
Masks NMI signal.
No
Does not mask NMI signal.
values
Note [IECUBE]
When the [Connecting with target board] property in the [Connection with Target Board] (except [Simulator])
category on the [Connect Settings] tab is set to [No], this property is fixed to [Yes] automatically after
connecting to the debug tool (changes not allowed).
(10) [Smart Analog] [E1][E20]
The detailed information on the Smart Analog function is displayed and its configuration can be changed.
Note that this category appears only when the selected microcontroller supports the Smart Analog function.
Collect data during the
Select whether to collect the data during execution of a program, using the Smart Analog
execution
function (see "2.16 Use Smart Analog Function [E1][E20]").
Default
No
Modifying
Select from the drop-down list.
Available
Yes
Collects the data during execution of a program.
No
Does not collect the data during execution of a program.
values
(11) [Simulator GUI] [Simulator]
The detailed information on the Simulator GUI is displayed and its configuration can be changed.
Caution
After connecting to the debug tool, all the properties in this category will become invalid when a
microcontroller whose Simulator does not support peripheral function simulations (instruction
simulation version) is selected.
Display Simulator GUI
Select whether to display the Simulator GUI window to use the Simulator GUI.
Default
Yes
Modifying
Select from the drop-down list.
(Changes not allowed during execution of a program.)
Available
values
Yes
Uses the function of the Simulator GUI.
No
Does not use the function of the Simulator GUI.
Display Simulator GUI
Select whether to display the Simulator GUI window in the forefront when program execution
on top of other
starts.
windows
This property appears only when the [Display Simulator GUI] property is set to [Yes].
Default
Yes
Modifying
Select from the drop-down list.
Available
Yes
Displays it in the forefront.
No
Does not display it in the forefront.
values
R20UT2867EJ0100 Rev.1.00
Feb 01, 2014
Page 206 of 572
CubeSuite+ V2.02.00
APPENDIX A WINDOW REFERENCE
[Flash Self Emulation Settings] tab [IECUBE]
This tab is used to display the detailed information categorized by the following and the configuration can be changed.
Note that this tab appears only when the selected microcontroller incorporates the flash memory.
(1) [Flash Self Emulation]
(2) [Writing Time/Erasing Time]
(3) [Macro Service Error]
(4) [Setting Flash shield wIndow]
(5) [Security Flag Emulation]
Figure A-11. Property Panel: [Flash Self Emulation Settings] Tab
(1)
(2)
(3)
(4)
(5)
[Description of each category]
(1) [Flash Self Emulation]
The detailed information on flash self programming emulation functions is displayed and its configuration can be
changed.
Flash selfprogramming
Select whether to use the flash self programming emulation function.
Default
No
Modifying
Select from the drop-down list.
Available
Yes
Uses the flash self programming emulation function.
No
Does not use the flash self programming emulation function.
values
R20UT2867EJ0100 Rev.1.00
Feb 01, 2014
Page 207 of 572
CubeSuite+ V2.02.00
APPENDIX A WINDOW REFERENCE
(2) [Writing Time/Erasing Time]
The detailed information on the time for writing to and erasing the flash memory is displayed and its configuration
can be changed.
Writing time
Select the value to simulate the delay time for writing to the flash memory.
Default
Typical number of times that is assumed by flash macro specifications
Modifying
Select from the drop-down list.
Available
No retry
values
Specifies "0" as the number of times of retry.
The delay time is 0 (the writing speed is fastest).
Typical number of times
Specifies the typical number of times that is assumed
that is assumed by flash
by flash macro specifications.
macro specifications
Maximum number of times
Specifies the maximum number of times that is
that is assumed by flash
assumed by flash macro specifications.
macro specifications
Retries for the maximum
Specifies the maximum number of times of retry.
number of times specified
The delay time is maximum (the writing speed is
longest).
Address for writing
time
Specify the target address at which to simulate the delay time for writing.
Default
0
Modifying
Directly enter from the keyboard.
Available
0x0 to 0xFFFFF in hexadecimal number
values
Address mask value
for writing time
Specify a mask value for the address for writing time.
Default
0
Modifying
Directly enter from the keyboard.
Available
0x0 to 0xFFFFF in hexadecimal number
values
Erasing time
Select the value to simulate the delay time for erasing the flash memory.
Default
Typical number of times that is assumed by flash macro specifications
Modifying
Select from the drop-down list.
Available
No retry
values
Specifies "0" as the number of times of retry.
The delay time is 0 (the erasing speed is fastest).
Typical number of times
Specifies the typical number of times that is assumed
that is assumed by flash
by flash macro specifications.
macro specifications
Maximum number of times
Specifies the maximum number of times that is
that is assumed by flash
assumed by flash macro specifications.
macro specifications
Retries for the maximum
Specifies the maximum number of times of retry.
number of times specified
The delay time is maximum (the erasing speed is
longest).
R20UT2867EJ0100 Rev.1.00
Feb 01, 2014
Page 208 of 572
CubeSuite+ V2.02.00
Address for erasing
time
APPENDIX A WINDOW REFERENCE
Specify the target address at which to simulate the delay time for erasing.
Default
0
Modifying
Directly enter from the keyboard.
Available
0x0 to 0xFFFFF in hexadecimal number
values
Address mask value
for erasing time
Specify a mask value for the address for erasing time.
Default
0
Modifying
Directly enter from the keyboard.
Available
0x0 to 0xFFFFF in hexadecimal number
values
(3) [Macro Service Error]
The detailed information on the flash macro service is displayed and its configuration can be changed.
The error values that are not returned during normal emulation can be forcibly returned by setting the properties of
this category.
Macro Service Errors
Specify the error to generate in the flash macro service to emulate.
Up to three types of errors to generate ([0]/[1]/[2]) can be specified with subproperties for this
property.
Generate error
(Subproperty)
Select the type of error to generate.
Default
None
Modifying
Select from the drop-down list.
Available
None
values
Generate FlashErase Error (Erase)
Generate FlashBlankCheck Error (BlankCheck)
Generate FlashWrite Error (Write)
Generate FlashIVerify Error (IVerify)
Generate FlashSetSecurity / FlashSetFSW Error (Erase)
Generate FlashSetSecurity / FlashSetFSW Error (Write)
Generate FlashSetSecurity / FlashSetFSW Error (IVerify)
Address for error
Specify an address at which the error is to be generated, within the flash memory area.
(Subproperty)
This property appears only when the [Generate error] subproperty is set to [Generate erase error
for FlashErase]/[Generate write error for FlashWrite]/[Generate IVerify error for FlashIVerify]/
[Generate BlankCheck error for FlashBlankCheck].
Default
0
Modifying
Directly enter from the keyboard.
Available
0x0 to 0xFFFFF in hexadecimal number
values
R20UT2867EJ0100 Rev.1.00
Feb 01, 2014
Page 209 of 572
CubeSuite+ V2.02.00
APPENDIX A WINDOW REFERENCE
Address mask value
Specify a mask value for the address, at which the error is to be generated.
for error
This property appears only when the [Generate error] subproperty is set to [Generate erase error
(Subproperty)
for FlashErase]/[Generate write error for FlashWrite]/[Generate IVerify error for FlashIVerify]/
[Generate BlankCheck error for FlashBlankCheck].
Default
0
Modifying
Directly enter from the keyboard.
Available
0x0 to 0xFFFFF in hexadecimal number
values
(4) [Setting Flash shield wIndow]
The detailed information on the flash shield window function is displayed and its configuration can be changed.
Caution
Settings of this category are applied after CPU reset is generated.
If you changed these settings, execute the program after reset the CPU.
Flash shield window
start block
Specify the start block of the area that can be written to and erased by flash self programming.
Default
0
Modifying
Directly enter from the keyboard.
Available
0x0 to 0xFFFF in hexadecimal number
values
Flash shield window
end block
Specify the end block of the area that can be written to and erased by flash self programming.
Default
FFFF
Modifying
Directly enter from the keyboard.
Available
0x0 to 0xFFFF in hexadecimal number
values
(5) [Security Flag Emulation]
The detailed information on the security flag emulation function is displayed and its configuration can be changed.
Caution
Settings of this category are applied after CPU reset is generated.
If you changed these settings, execute the program after reset the CPU.
Disable block erase
Select whether to emulate to disable block erase.
Default
No
Modifying
Select from the drop-down list.
Available
Yes
Emulates to disable block erase.
No
Does not emulate to disable block erase.
values
Disable program
Select whether to emulate to disable writing.
Default
No
Modifying
Select from the drop-down list.
Available
Yes
Emulates to disable writing.
No
Does not emulate to disable writing.
values
R20UT2867EJ0100 Rev.1.00
Feb 01, 2014
Page 210 of 572
CubeSuite+ V2.02.00
Disable boot block
cluster reprogram
APPENDIX A WINDOW REFERENCE
Select whether to emulate to disable rewrite boot area.
Default
No
Modifying
Select from the drop-down list.
Available
Yes
Emulates to disable rewrite boot area.
No
Does not emulate to disable rewrite boot area.
values
R20UT2867EJ0100 Rev.1.00
Feb 01, 2014
Page 211 of 572
CubeSuite+ V2.02.00
APPENDIX A WINDOW REFERENCE
[DataFlash Emulation Settings] tab [IECUBE]
This tab is used to display the detailed information categorized by the following and the configuration can be changed.
Note that this tab appears only when the selected microcontroller incorporates the data flash memory.
(1) [DataFlash Emulation]
(2) [Writing Time/Erasing Time]
(3) [Macro Service Error]
Figure A-12. Property Panel: [DataFlash Emulation Settings] Tab
(1)
(2)
(3)
[Description of each category]
(1) [DataFlash Emulation]
The detailed information on the data flash emulation functions is displayed and its configuration can be changed.
DataFlash emulation
Select whether to use the data flash emulation function.
Default
No
Modifying
Select from the drop-down list.
Available
Yes
Uses data flash emulation functions.
No
Does not use data flash emulation functions.
values
(2) [Writing Time/Erasing Time]
The detailed information on the time for writing to and erasing the data flash memory is displayed and its
configuration can be changed.
R20UT2867EJ0100 Rev.1.00
Feb 01, 2014
Page 212 of 572
CubeSuite+ V2.02.00
Writing time
APPENDIX A WINDOW REFERENCE
Select the value to simulate the delay time for writing to the data flash memory.
Default
Typical number of times that is assumed by flash macro specifications
Modifying
Select from the drop-down list.
Available
No retry
values
Specifies "0" as the number of times of retry.
The delay time is 0 (the writing speed is fastest).
Typical number of times
Specifies the typical number of times that is assumed
that is assumed by flash
by flash macro specifications.
macro specifications
Maximum number of times
Specifies the maximum number of times that is
that is assumed by flash
assumed by flash macro specifications.
macro specifications
Retries for the maximum
Specifies the maximum number of times of retry.
number of times specified
The delay time is maximum (the writing speed is
longest).
Address for writing
time
Specify the target address at which to simulate the delay time for writing.
Default
F1000
Modifying
Directly enter from the keyboard.
Available
0xF1000 to 0xFFFFF in hexadecimal number
values
Address mask value
for writing time
Specify a mask value for the address for writing time.
Default
0
Modifying
Directly enter from the keyboard.
Available
0x0 to 0xFFFFF in hexadecimal number
values
Erasing time
Select the value to simulate the delay time for erasing the data flash memory.
Default
Typical number of times that is assumed by flash macro specifications
Modifying
Select from the drop-down list.
Available
No retry
values
Specifies "0" as the number of times of retry.
The delay time is 0 (the erasing speed is fastest).
Typical number of times
Specifies the typical number of times that is assumed
that is assumed by flash
by flash macro specifications.
macro specifications
Maximum number of times
Specifies the maximum number of times that is
that is assumed by flash
assumed by flash macro specifications.
macro specifications
Retries for the maximum
Specifies the maximum number of times of retry.
number of times specified
The delay time is maximum (the erasing speed is
longest).
Address for erasing
time
Specify the target address at which to simulate the delay time for erasing.
Default
F1000
Modifying
Directly enter from the keyboard.
Available
0xF1000 to 0xFFFFF in hexadecimal number
values
R20UT2867EJ0100 Rev.1.00
Feb 01, 2014
Page 213 of 572
CubeSuite+ V2.02.00
Address mask value
for erasing time
APPENDIX A WINDOW REFERENCE
Specify a mask value for the address for erasing time.
Default
0
Modifying
Directly enter from the keyboard.
Available
0x0 to 0xFFFFF in hexadecimal number
values
(3) [Macro Service Error]
The detailed information on the data flash macro service is displayed and its configuration can be changed.
The error values that are not returned during normal emulation can be forcibly returned by setting the properties of
this category.
Macro Service Errors
Specify the error to generate in the data flash macro service to emulate.
Up to three types of errors to generate ([0]/[1]/[2]) can be specified with subproperties for this
property.
Generate error
(Subproperty)
Select the type of error to generate.
Default
None
Modifying
Select from the drop-down list.
Available
None
values
Generate FlashErase Error (Erase)
Generate FlashBlankCheck Error (BlankCheck)
Generate FlashWrite Error (Write)
Generate FlashIVerify Error (IVerify)
Address for error
(Subproperty)
Specify an address at which the error is to be generated, within the flash memory area.
This property appears only when the [Generate error] subproperty is set to the value other than
[None].
Default
F1000
Modifying
Directly enter from the keyboard.
Available
0xF1000 to 0xFFFFF in hexadecimal number
values
Address mask value
Specify a mask value for the address, at which the error is to be generated.
for error
This property appears only when the [Generate error] subproperty is set to the value other than
(Subproperty)
[None].
Default
0
Modifying
Directly enter from the keyboard.
Available
0x0 to 0xFFFFF in hexadecimal number
values
R20UT2867EJ0100 Rev.1.00
Feb 01, 2014
Page 214 of 572
CubeSuite+ V2.02.00
APPENDIX A WINDOW REFERENCE
[Download File Settings] tab
This tab is used to display the detailed information categorized by the following and the configuration can be changed.
For details on the download function, see "2.5 Download/Upload Programs".
(1) [Download]
(2) [Debug Information]
Figure A-13. Property Panel: [Download File Settings] Tab
(1)
Note 1
Note 2
(2)
Notes 1.
2.
The [Download Mode] property appears only when the debug tool other than Simulator is used.
The [Check reserved area overwriting when downloading] property appears only when E1/E20/EZ
Emulator is used.
[Description of each category]
(1) [Download]
The detailed information on download is displayed and its configuration can be changed.
Download files
Specify the file to downloadNote 1.
The names of files to be downloaded and the download conditions are listed in the lower area.
Default
[Number of files to download]
Modifying
Specify with the Download Files dialog box.
The Download Files dialog box is opened by clicking the [...] button that appears at
right edge of this field when you select this property (you cannot specify the file to
download on this panel).
R20UT2867EJ0100 Rev.1.00
Feb 01, 2014
Page 215 of 572
CubeSuite+ V2.02.00
CPU Reset after
download
APPENDIX A WINDOW REFERENCE
Select whether to reset the CPU after downloading.
This property does not appear when the selected microcontroller always resets the CPU after
downloading.
Default
Yes
Modifying
Select from the drop-down list.
Available
Yes
Resets the CPU after downloading.
No
Does not reset the CPU after downloading.
values
Download Mode
Select the download mode for downloading to the flash ROM.
(except [Simulator])
Default
Speed priority
Modifying
Select from the drop-down list.
Available
Speed priority
values
Fills free space between the first data and the final data
with FFH.
Download speed will be faster because the writing data is
reduced (default).
Data priority
Retains the previous value in free space.
Download speed will be very slow because data in free
space are read once.
Erase flash ROM
before download
Select whether to erase the flash ROM before downloading.
Default
No
Modifying
Select from the drop-down list.
Note that changes cannot be made when the [Download Mode] property is set to
[Data priority].
Available
values
Yes
Erases the flash ROM before downloading.
No
Does not erase the flash ROM before downloading.
Automatic change
Select how to perform the setting again if the file is downloaded again, and the location
method of event
(address) set for the currently set event changes to midway in the instructionNote 2.
setting position
Default
Suspend event
Modifying
Select from the drop-down list.
Available
Move to the head of
values
instruction
Suspend event
Sets the event to the top address of the instruction.
Disables the event (suspended state).
Check reserved area
Select whether to output a message when overwriting to an area reserved for use by the
overwriting when
emulator is attempted at the time of downloading.
downloading
Default
Yes
Modifying
Select from the drop-down list.
Available
Yes
Outputs a message when overwriting to an area reserved is attempted.
No
Does not output a message when overwriting to an area reserved is
[E1][E20]
[EZ Emulator]
values
attempted.
Notes 1.
Files specified as build targets in a main project or sub-project cannot be deleted from the target files to
download (These files are automatically registered as download files by default).
See "Table 2-1. Type of Files That Can be Downloaded" for downloadable file format.
R20UT2867EJ0100 Rev.1.00
Feb 01, 2014
Page 216 of 572
CubeSuite+ V2.02.00
2.
APPENDIX A WINDOW REFERENCE
This property setting works only for the location setting of events without the debug information. The
location setting of events with the debug information is always moved to the beginning of the source
text line.
(2) [Debug Information]
The detailed information on debugging is displayed and its configuration can be changed.
Execute to the
specified symbol after
CPU Reset
Select whether to execute the program to the specified symbol position after CPU reset.
Default
Yes
Modifying
Select from the drop-down list.
Available
Yes
Executes the program to the specified symbol position after CPU reset.
No
Does not execute the program after CPU reset.
values
Specified symbol
Specify the position at which the program is stop after CPU reset.
This property appears only when the [Execute to the specified symbol after CPU Reset] property
is set to [Yes].
Default
_main
Modifying
Directly enter from the keyboard.
Available
Address expression from 0 to the "end address of the address space".
values
Startup start symbol
Specify the start symbol of the text area of the startup routine.
Default
_@cstart
Modifying
Directly enter from the keyboard.
Available
Address expression from 0 to the "end address of the address space".
values
Startup end symbol
Specify the end symbol of the text area of the startup routine.
Default
_@cend
Modifying
Directly enter from the keyboard.
Available
Address expression from 0 to the "end address of the address space".
values
R20UT2867EJ0100 Rev.1.00
Feb 01, 2014
Page 217 of 572
CubeSuite+ V2.02.00
APPENDIX A WINDOW REFERENCE
[Hook Transaction Settings] tab
This tab is used to display the detailed information categorized by the following and the configuration can be changed.
For details on the hook transaction, see "2.17 Use Hook Function".
(1) [Hook Transaction Settings]
Figure A-14. Property Panel: [Hook Transaction Settings] Tab
(1)
[Description of each category]
(1) [Hook Transaction Settings]
The detailed information on the hook transaction is displayed and its configuration can be changed.
Note that the properties on this tab can be specified via the Text Edit dialog box, which is opened by clicking the [...]
button that appears at right edge of a field when you select each property (you cannot specify the process directly
on this panel).
Caution
Up to 64 characters for one process, and up to 128 processes for each property can be set (one
line in the [Text] area in the Text Edit dialog box is equivalent to one processing).
Before download
Specify the process to proceed right before downloading the load module file.
Default
Before download[0] ("[]" is the current number of specified processes.)
Modifying
Specify with the Text Edit dialog box.
Format
Either one of the following
- SFR name + space + Value
[Process] Automatically overwrites the value of SFR with Value.
- CPU register name + space + Value
[Process] Automatically overwrites the value of CPU register with Value.
- Source Python script path
[Process] Automatically executes a script file specified with Python script path.
R20UT2867EJ0100 Rev.1.00
Feb 01, 2014
Page 218 of 572
CubeSuite+ V2.02.00
After download
APPENDIX A WINDOW REFERENCE
Specify the process to proceed right after downloading the load module file.
Default
After download[0] ("[]" is the current number of specified processes.)
Modifying
Specify with the Text Edit dialog box.
Format
Either one of the following
- SFR name + space + Value
[Process] Automatically overwrites the value of SFR with Value.
- CPU register name + space + Value
[Process] Automatically overwrites the value of CPU register with Value.
- Source Python script path
[Process] Automatically executes a script file specified with Python script path.
After CPU reset under
Specify the process to proceed right after CPU reset during break.
breaking
Default
After CPU reset under breaking[0] ("[]" is the current number of specified
processes.)
Modifying
Specify with the Text Edit dialog box.
Format
Either one of the following
- SFR name + space + Value
[Process] Automatically overwrites the value of SFR with Value.
- CPU register name + space + Value
[Process] Automatically overwrites the value of CPU register with Value.
- Source Python script path
[Process] Automatically executes a script file specified with Python script path.
Before running
Specify the process to proceed right before the execution of the program.
Default
Before running[0] ("[]" is the current number of specified processes.)
Modifying
Specify with the Text Edit dialog box.
Format
Either one of the following
- SFR name + space + Value
[Process] Automatically overwrites the value of SFR with Value.
- CPU register name + space + Value
[Process] Automatically overwrites the value of CPU register with Value.
- Source Python script path
[Process] Automatically executes a script file specified with Python script path.
After breaking
Specify the process to proceed right after the program break.
Default
After breaking[0] ("[]" is the current number of specified processes.)
Modifying
Specify with the Text Edit dialog box.
Format
Either one of the following
- SFR name + space + Value
[Process] Automatically overwrites the value of SFR with Value.
- CPU register name + space + Value
[Process] Automatically overwrites the value of CPU register with Value.
- Source Python script path
[Process] Automatically executes a script file specified with Python script path.
R20UT2867EJ0100 Rev.1.00
Feb 01, 2014
Page 219 of 572
CubeSuite+ V2.02.00
APPENDIX A WINDOW REFERENCE
Editor panel
This panel is used to display and edit files.
Furthermore, the source level debugging/instruction level debugging (see "2.7.3 Execute programs in steps") and the
code coverage measurement result display [IECUBE][Simulator] (see "2.13 Measure Coverage [IECUBE][Simulator]")
can be performed when connected to the debug tool and the downloaded source file is opened in this panel.
The code data, label and disassembled text can be displayed combined with the source code by selecting the Mixed
display mode (see "(1) Change display mode").
When opened the file encoding and newline code is automatically detected and retained when it is saved. You can
open a file with a specific encoding selected in the Encoding dialog box. If the encoding and newline code is specified in
the Save Settings dialog box then the file is saved with those settings.
This panel can be opened multiple times (up to 100 panels).
Cautions 1.
When a project is closed, all of the Editor panels displaying a file being registered in the project
are closed.
2.
Remarks 1.
When a file is excluded from a project, the Editor panel displaying the file is closed.
This panel can be zoomed in and out by
in the tool bar, or by moving the mouse
wheel forward or backward while holding down the [Ctrl] key.
2.
When a file whose size is greater than 24MB is opened, a message dialog box is shown for
confirmation of whether or not to disable all of the functions listed below (if you select [No] in this
message dialog box, the operation speed may become sluggish).
- Syntax (reserved words, comments, etc.) coloring
- Code outlining
Figure A-15. Editor Panel
(3)
(1)
[Toolbar]
(2)
(3)
(4) (5) (6) (7)
R20UT2867EJ0100 Rev.1.00
Feb 01, 2014
(8)
(11) (12)
(13)
Page 220 of 572
CubeSuite+ V2.02.00
APPENDIX A WINDOW REFERENCE
Figure A-16. Editor Panel (When Code Coverage Measurement Result Is Displayed)
(3)
(1)
[Toolbar]
(2)
(3)
(4) (5) (6) (7)
(8)
(11) (12)
(13)
Figure A-17. Editor Panel (When Mixed Display Mode Is Selected)
(1)
[Toolbar]
(2)
(4)
(7)
(8)
(9)
(10)
(11) (12)
(13)
This section describes the following.
- [How to open]
- [Description of each area]
- [Toolbar]
- [[File] menu (Editor panel-dedicated items)]
- [[Edit] menu (Editor panel-dedicated items)]
- [[Window] menu (Editor panel-dedicated items)]
- [Context menu]
R20UT2867EJ0100 Rev.1.00
Feb 01, 2014
Page 221 of 572
CubeSuite+ V2.02.00
APPENDIX A WINDOW REFERENCE
[How to open]
- Automatically opens after downloading the load module file with debug information.
- On the Project Tree panel, double click a file.
- On the Project Tree panel, select a source file, and then select [Open] from the context menu.
- On the Project Tree panel, select a file, and then select [Open with Internal Editor...] from the context menu.
- On the Project Tree panel, select [Add] >> [Add New File...] from the context menu, and then create a text file or
source file.
- On the Disassemble panel, Call Stack panel, Trace panel, or Events panel, select [Jump to Source] from the
context menu.
- Automatically opens if there is a source text line corresponding to the current PC value when the current PC value
is forcibly changed or the program stops executing.
[Description of each area]
(1) Title bar
The name of the opened text file or source file is displayed.
Marks displayed at the end of the file name indicate the following:
Mark
Description
*
The file has been modified since being opened.
!
Update time and date of the source file opened are later than the one of the downloaded load module file.
Note that this mark is valid only when connected to the debug tool and the downloaded source file is
opened.
[RECYCLE]
The recycle mode (see "(3) Display multiple source files in a single panel") is valid.
Note that this mark is valid only when connected to the debug tool and the downloaded source file is
opened.
(Read only)
The opened file is read only.
(2) Column header
The title of each column on the Editor panel is displayed.
Hovering the mouse cursor over this area displays the title name.
Display
Title Name
Line
Line
(No display)
Selection
Description
Displays line numbers (see "(4) Line number area").
The display is colored to reflect the state in terms of saving of the state of editing
(see "(5) Selection area").
However, this column is not displayed in the Mixed display mode.
(No display)
Out of Date Module
The display is colored to reflect cases where a source file has been updated more
Indicator
recently than the corresponding load module file (see "(6) Out of date module
Indicator area").
However, this column is not displayed when disconnected from the debug tool or in
the Mixed display mode.
Coverage
Displays the coverage information (see "(7) Coverage area").
However, this column is not displayed when disconnected from the debug tool.
Address
Address
Displays addresses (see "(8) Address area").
However, this column is not displayed when disconnected from the debug tool.
R20UT2867EJ0100 Rev.1.00
Feb 01, 2014
Page 222 of 572
CubeSuite+ V2.02.00
Display
APPENDIX A WINDOW REFERENCE
Title Name
Op code
Op code
Description
Displays instruction codes (see "(9) Op code area").
However, this column is displayed only in the Mixed display mode.
Label
Label
Displays labels (see "(10) Label area").
However, this column is displayed only in the Mixed display mode.
Event
Sets events (see "(11) Event area").
However, this column is not displayed when disconnected from the debug tool.
Main
Displays bookmarks, address marks and the current PC mark.
Furthermore, sets breakpoints (see "(12) Main area").
Remark
Show/hide of the column header can be switched by the setting of the toolbar.
(3) Splitter bars
You can split the Editor panel by using the horizontal and vertical splitter bars within the view. This panel can be
split up to two times vertically, and two times horizontally.
- To split this panel, drag the splitter bar down or to the right to the desired position, or double-click any part of
the splitter bar.
- To remove the split, double-click any part of the splitter bar.
Caution
The split is enabled only when this panel is in the normal display mode (setting to the Mixed
display mode removes the split).
Figure A-18. Editor Panel (Vertical/Horizontal Two-way Split View)
(4) Line number area
This area displays the line number of the opened file.
(5) Selection area
This area displays the following indicators that shows the line modification status (except in the Mixed display
mode).
This means new or modified line but unsaved.
This means new or modified line and saved.
To erase this mark, close the panel, and then open this source file again.
R20UT2867EJ0100 Rev.1.00
Feb 01, 2014
Page 223 of 572
CubeSuite+ V2.02.00
APPENDIX A WINDOW REFERENCE
(6) Out of date module Indicator area
This area is valid only when connected to the debug tool and the downloaded source file is opened (except in the
Mixed display mode).
If the update time and date of the source file opened are later than the one of the downloaded load module file, the
following indicator is displayed (the color of the indicator depends on the "Warning" color of the [General - Font and
Color] category of the Option dialog box).
To erase this mark, run a build and then download the load module file again.
(7) Coverage area
This area is valid only when connected to the debug tool and the downloaded source file is opened.
When the coverage function is validNote, lines corresponding to the specified coverage measurement area are
shown highlighted based on the code coverage measurement result that is acquired by executing the program (the
color depends on the configuration in the [General - Font and Color] category of the Option dialog box).
See "2.13 Measure Coverage [IECUBE][Simulator]" for details on the coverage measurement.
Note [IECUBE]
The coverage function is always valid.
(8) Address area
This area is valid only when connected to the debug tool and the downloaded source file is opened.
This area shows the address corresponding to where the instruction is located in the memory space of the selected
microcontroller.
The format of this area is fixed as hexadecimal number notation.
The address width corresponds to the one in memory space of the selected microcontroller in the project.
(9) Op code area
This area is valid only when connected to the debug tool and the downloaded source file is opened in the Mixed
display mode.
This area shows the code corresponding to the source code.
(10) Label area
This area is valid only when connected to the debug tool and the downloaded source file is opened in the Mixed
display mode.
This area shows the label name when a label is defined for the address.
(11) Event area
This area is valid only when connected to the debug tool and the downloaded source file is opened.
This area is provided with the following functions.
R20UT2867EJ0100 Rev.1.00
Feb 01, 2014
Page 224 of 572
CubeSuite+ V2.02.00
APPENDIX A WINDOW REFERENCE
(a) Setting/deleting of various events
By selecting a item from the context menu on the line that has the address mark (
), a Timer event, Trace
event or action event (Printf event) can be set/deleted.
Once an event is set, the Event mark corresponding to the event is displayed at the line that is set. In addition,
the detailed information about the set event is reflected in the Events panel.
(b) Pop-up display
By hovering the mouse cursor over the Event mark, the name of the event, the detailed information for the
event and the comments added to the event are a pop-up displayed.
When multiple events have been set in the applicable place, information for each event, up to a maximum of
three events, is listed and displayed.
(12) Main area
This area is provided with the following functions.
(a) Error marks and warning marks display
When an error or warning has been output via the last build commandNote, an error mark (
(
) or warning mark
) is displayed at the corresponding line.
To erase these marks, run a clean.
Note Compiling or assembling of source files and running a build, rebuild, or rapid build of the project
Figure A-19. Error Marks and Warning Marks Display
When hovering the mouse cursor over
a mark, a pop-up that shows the
corresponding message is displayed.
Cautions 1.
This function is disabled when connected to the debug tool.
2.
This function targets only a source file that have been registered in the project.
3.
Even when the line number of the source text is changed by modifying, the position of a
mark currently being displayed is not moved.
(b) Bookmarks display
Bookmarks (
) that have been registered are displayed.
See "(9) Register a bookmark" for details on the bookmark.
Caution
This function is disabled when the Mixed display mode is selected.
R20UT2867EJ0100 Rev.1.00
Feb 01, 2014
Page 225 of 572
CubeSuite+ V2.02.00
APPENDIX A WINDOW REFERENCE
The following functions are also available when the debug tool is connected and a downloaded source file is open.
(c) Address marks display
Address marks (
) are displayed at lines that have valid addresses.
Breakpoints or various events can be set at lines with the address mark.
(d) Current PC mark display
The current PC mark (
) that corresponds to the current PC position (PC register value) is displayed.
Note that the current PC mark is only displayed if the current PC value corresponds to the source text line,
when the state of the debug tool is changed from execution to stop.
Remark
When the Mixed display mode is selected, if the unit of step execution is set to instruction level by
selecting the
button on the toolbar, then the current PC mark will be moved to a disassembled
text line.
(e) Setting/deleting breakpoints
By clicking the line that has the address mark (
) with the mouse, the breakpoints can be set easily.
Once a breakpoint is set, an Event mark is displayed at the line that is set. In addition, the detailed information
about the set breakpoint is reflected in the Events panel.
When this operation is performed at a place where a breakpoint is already set, that breakpoint is deleted and
the setting of breakpoints cannot be done.
See "2.8.3 Stop the program at the arbitrary position (breakpoint)" for details on how to set the breakpoint.
Remark
Setting a breakpoint and changing the state of a breakpoint can also be done from the context
menu in this area.
(f) Pop-up display
By hovering the mouse cursor over the Event mark, the name of the event, the detailed information for the
event and the comments added to the event are a pop-up displayed.
When multiple events have been set in the applicable place, information for each event, up to a maximum of
three events, is listed and displayed.
(13) Characters area
This area displays character strings of files and you can edit it.
This area is provided with the following functions.
(a) Characters editing
Characters can be entered from the keyboard.
Various shortcut keys can be used to enhance the edit function.
Caution
This function is disabled when the Mixed display mode is selected.
Remark
The following items can be customized by setting the Option dialog box.
- Display fonts
- Tab interval
- Show or hide white space marks (blank symbols)
- Colors of syntax (reserved words, comments, etc.)
R20UT2867EJ0100 Rev.1.00
Feb 01, 2014
Page 226 of 572
CubeSuite+ V2.02.00
APPENDIX A WINDOW REFERENCE
(b) Code outlining
This allows you to expand and collapse source code blocks so that you can concentrate on the areas of code
which you are currently modifying or debugging. This is only available for only C source file types.
This is achieved by clicking the plus and minus symbols to the left of the Characters area.
Types of source code blocks that can be expanded or collapsed are:
Open and close braces ('{' and '}')
Multi-line comments ('/*' and '*/')
Pre-processor statements ('if', 'elif', 'else', 'endif')
Caution
This function is disabled when the Mixed display mode is selected.
(c) Highlighting the current line
By selecting the [Enable line highlight for current] check box in the []General - Text Editor] category of the
Option dialog box, the line at the current caret position can be displayed within a rectangle (the rectangle color
depends on the highlight color in the [General - Font and Color] category of the same dialog box above).
Figure A-20. Highlighting Current Line
(d) Emphasizing brackets
The bracket that corresponds to a bracket at the caret position is shown emphasized.
Supported types of brackets vary with the file type.
File Type
Types of Brackets
C or Python
( and ), { and }, [ and ]
HTML or XML
< and >
Remark
When CubeSuite+ emphasizes the corresponding bracket, it does not consider those within
comments, character constants, character strings, or string constants. For this reason, if the
bracket at the position of the caret is within a comment, character constant, character string, or
string constant, CubeSuite+ may emphasize a bracket that is not actually the corresponding
bracket.
(e) Multiple lines selection and block selection
You can select multiple lines or a block that consists of multiple lines by any one of the following methods:
- Multiple lines selection
- Drag the left-mouse button
- Press the [Right], [Left], [Up] or [Down] key while holding down the [Shift] key
- Block selection
- Drag the left-mouse button while holding down the [Alt] key
- Press the [Right], [Left], [Up] or [Down] key while holding down the [Alt] + [Shift] key
R20UT2867EJ0100 Rev.1.00
Feb 01, 2014
Page 227 of 572
CubeSuite+ V2.02.00
APPENDIX A WINDOW REFERENCE
Figure A-21. Multiple Lines Selection and Block Selection
[Multiple lines selection]
Caution
Remark
[Block selection]
The information on bookmarks is not included in the selected contents.
Editing of the selected contents can be done by using [Cut], [Copy], [Paste], or [Delete] from the
[Edit] menu.
(f) Jump to functions
It automatically recognizes the currently selected characters or the word at the caret position as the function
name and jumps to the target function.
See "(7) Jump to functions" for details on the jump to functions.
(g) Tag jump
If the information of a file name, a line number and a column number exists in the line at the caret position,
selecting [Tag Jump] from the context menu opens the file in a new Editor panel and jumps to the
corresponding line and the corresponding column (if the target file is already opened in the Editor panel, you
can jump to the panel).
See "(8) Jump to a desired line (tag jump)" for details on the tag jump.
(h) Registration of bookmarks
By clicking the
button on the bookmark toolbar or selecting [Bookmark] >> [Toggle Bookmark] from the
context menu on this area, a bookmark can be registered to the line at the caret position.
See "(9) Register a bookmark" for details on the bookmark.
Caution
This function is disabled when the Mixed display mode is selected.
(i) File monitor
If the contents of the currently displayed file is changed (including renaming or deleting) without using
CubeSuite+, a message will appear asking you whether you wish to update the file or not.
The following functions are also available when the debug tool is connected and a downloaded source file is open.
(j) Highlighting the current PC line
When the current PC position (PC register value) corresponds to the source text lines, those lines are shown
highlighted (the highlighting color depends on the current PC color in the [General - Font and Color] category
of the Option dialog box).
(k) Highlighting lines with breakpoints
Lines where the breakpoints are set are shown highlighted (the highlighting color depends on the breakpoint
color in the [General - Font and Color] category of the Option dialog box).
(l) Code coverage measurement result display [IECUBE][Simulator]
When the coverage function is validNote, lines corresponding to the specified coverage measurement area are
shown highlighted based on the code coverage measurement result that is acquired by executing the program
R20UT2867EJ0100 Rev.1.00
Feb 01, 2014
Page 228 of 572
CubeSuite+ V2.02.00
APPENDIX A WINDOW REFERENCE
(the highlighting color depends on the configuration in the [General - Font and Color] category of the Option
dialog box).
See "2.13 Measure Coverage [IECUBE][Simulator]" for details on the coverage measurement.
Note [IECUBE]
The coverage function is always valid.
(m) Pop-up display of variables
When hovering the mouse cursor over a variable in the source text, a pop-up that shows the name and value
of the variable is displayed (see "(4) Display variables").
Remark
When hovering the mouse cursor over a constant, because a constant value is interpreted as an
address, a pop-up that shows the memory value of the address is displayed.
(n) Setting of various events
By selecting a item from the context menu on the line that has the address mark (
), various events can be set.
Once an event is set, the Event mark corresponding to the event is displayed at the line that is set in the Event
area or the Main area. In addition, the detailed information about the set event is reflected in the Events panel.
See the following for details on how to set events.
- "2.8.4 Stop the program at the arbitrary position (break event)"
- "2.8.5 Stop the program with the access to variables/SFRs"
- "2.11.3 Collect execution history in the arbitrary section"
- "2.11.4 Collect execution history only when the condition is met [IECUBE][Simulator]"
- "2.12.2 Measure execution time in the arbitrary section [IECUBE][Simulator]"
- "2.14.1 Inset printf"
(o) Registering watch expressions
C language variable, CPU registers, SFR, and assembler symbols can be registered in the Watch panel as
watch expressions.
See "(1) Register a watch-expression" for details on how to operate it.
[Toolbar]
Toggles between the normal display mode (default) and the mixed display mode, as the display mode of
this panel (see "(1) Change display mode").
Note that this item is enabled only when connected to the debug tool and the downloaded source file is
opened in this panel.
Toggles between source (default) and instruction level, as the unit in which the program is step-executed
(see "2.7.3 Execute programs in steps").
When the unit of a step execution is set to instruction level, then the current PC mark will be moved to a
disassembled text line
Note that this item is enabled only when connected to the debug tool and the downloaded source file is
opened in this panel.
Displays the current PC position.
Note that this item is enabled only when connected to the debug tool.
Forwards to the position before operating [Back To Last Cursor Position].
Note that this item is disabled when this panel is in the mixed display mode.
R20UT2867EJ0100 Rev.1.00
Feb 01, 2014
Page 229 of 572
CubeSuite+ V2.02.00
APPENDIX A WINDOW REFERENCE
Goes back to the position before operating [Jump to Function]/[Find...]/[Go To...]/[Next Bookmark]/
[Previous Bookmark] or moving the caret by clicking the mouse.
The jump history is cleared when all of the Editor panel currently being opened are closed.
Note that this item is disabled when this panel is in the mixed display mode.
Columns
The following items are displayed to show or hide the columns or marks on all of the Editor panels.
Remove the check to hide the items (all the items are checked by default).
This setting is reflected in all the Editor panels.
Line Number
Shows the line number, in the line number area.
Selection
Shows the mark that indicates the line modification status, in the line number area.
Out of date
Shows the mark that indicates the update status of the downloaded load module file, in the line number
module indicator
area.
Note that this item is enabled only when connected to the debug tool.
Coverage
Shows the coverage area.
Note that this item is enabled only when connected to the debug tool.
Address
Shows the address area.
Note that this item is enabled only when connected to the debug tool.
Op Code
Shows the code area.
Note that this item is enabled only when connected to the debug tool and the mixed display mode is
selected.
Label
Shows the label area.
Note that this item is enabled only when connected to the debug tool and the mixed display mode is
selected.
Event
Shows the event area.
Note that this item is enabled only when connected to the debug tool.
Main
Shows the main area.
Column Header
Shows the column header.
[[File] menu (Editor panel-dedicated items)]
The following items are exclusive for the [File] menu in the Editor panel (other items are common to all the panels).
Close file name
Closes the currently editing Editor panel.
When the contents of the panel have not been saved, a confirmation message is shown.
Save file name
Overwrites the contents of the currently editing Editor panel.
When the file has never been saved or the file is read only, the same operation is applied as the
selection in [Save file name As...].
Note that this item is disabled when this panel is in the mixed display mode.
Save file name As...
Opens the Save As dialog box to newly save the contents of the currently editing Editor panel.
Note that if this panel is in the mixed display mode, then "file name" will be changed to "Source
Mixed Data".
File name Save
Opens the Save Settings dialog box to change the encoding and newline code of the file being
Settings...
opened in the currently editing Editor panel.
Page Setup...
This item is always disabled.
Print...
Opens the Windows dialog box for printing the contents of the currently editing Editor panel.
Print Preview
Opens the Print Preview window to preview the file contents to be printed.
R20UT2867EJ0100 Rev.1.00
Feb 01, 2014
Page 230 of 572
CubeSuite+ V2.02.00
APPENDIX A WINDOW REFERENCE
[[Edit] menu (Editor panel-dedicated items)]
The following items are exclusive for [Edit] menu in the Editor panel (all other items are disabled).
Undo
Cancels the previous operation and restores the characters and the caret position (up to 100
times).
Note that this item is disabled when this panel is in the mixed display mode.
Redo
Cancels the previous [Undo] operation and restores the characters and the caret position.
Note that this item is disabled when this panel is in the mixed display mode.
Cut
Cuts the selected character string and copies it to the clipboard.
If there is no selection, the entire line is cut.
Note that this item is disabled when this panel is in the mixed display mode.
Copy
Copies the contents of the selected range to the clipboard as character string(s).
If there is no selection, the entire line is copied.
Paste
Inserts (insert mode) or overwrites (overwrite mode) the characters that are copied on the clip
board into the caret position.
Note that this item is disabled when the contents of the clipboard are not recognized as characters or
this panel is in the mixed display mode.
Delete
Deletes one character at the caret position.
When there is a selection area, all the characters in the area are deleted.
Note that this item is disabled when this panel is in the mixed display mode.
Select All
Selects all the characters from beginning to the end in the currently editing text file.
Note that this item is disabled when this panel is in the mixed display mode.
Find...
Opens the Find and Replace dialog box with selecting [Quick Find] tab.
Replace...
Opens the Find and Replace dialog box with selecting [Quick Replace] tab.
Note that this item is disabled when this panel is in the mixed display mode.
Go To...
Opens the Go to Line dialog box to move the caret to the specified line.
Bookmark
Displays a cascading menu for bookmarks (see "(9) Register a bookmark").
Toggle Bookmark
Inserts/deletes a bookmark on the line at the current caret position.
Note that this item is disabled when this panel is in the mixed display mode.
Next Bookmark
Moves a caret to the position of the next bookmark, in the active Editor panel.
Note that this item is disabled in the following cases:
- No bookmark is registered.
- A bookmark is registered only in one line with a caret.
- This panel is in the mixed display mode.
Previous Bookmark
Moves a caret to the position of the previous bookmark, in the active Editor panel.
Note that this item is disabled in the following cases:
- No bookmark is registered.
- A bookmark is registered only in one line with a caret.
- This panel is in the mixed display mode.
Clear All Bookmarks
Clears all the registered bookmarks, in the active Editor panel.
Note that this item is disabled in the following cases:
- No bookmark is registered.
- This panel is in the mixed display mode.
List Bookmarks...
Opens the Bookmarks dialog box for displaying the list of bookmarks.
Note that this item is disabled when the project is closed.
R20UT2867EJ0100 Rev.1.00
Feb 01, 2014
Page 231 of 572
CubeSuite+ V2.02.00
Outlining
APPENDIX A WINDOW REFERENCE
Displays a cascading menu for controlling expand and collapse states of source file outlining (see
"(b) Code outlining").
Note that these items are disabled when this panel is in the mixed display mode.
Collapse to Definitions
Collapses all nodes that are marked as implementation blocks (e.g. function definitions).
Toggle Outlining
Toggles the current state of the innermost outlining section in which the cursor lies when you are in
Expansion
a nested collapsed section.
Toggle All Outlining
Toggles the collapsed state of all outlining nodes, setting them all to the same expanded or
collapsed state. If there is a mixture of collapsed and expanded nodes, all nodes will be expanded.
Stop Outlining
Stops code outlining and remove all outlining information from source files.
Start Automatic
Starts automatic code outlining and automatically displayed in supported source files.
Outlining
Advanced
Displays a cascading menu for performing an advanced operation for the Editor panel.
Note that these items are disabled when this panel is in the mixed display mode.
Increase Line Indent
Increases the indentation of the current cursor line by one tab.
Decrease Line Indent
Decreases the indentation of the current cursor line by one tab.
Uncomment Lines
Removes the first set of line-comment delimiters from the start of the current cursor line,
appropriate to the current language. This operation will only be available when the language of the
current source file has line-comment delimiters specified.
Comment Lines
Places line-comment delimiters at the start of the current cursor line, appropriate to the current
language. This operation will only be available when the language of the current source file has
line-comment delimiters specified.
Convert Tabs to Spaces
Convert Spaces to Tabs
Converts all tabs on the current cursor line into spaces.
Converts each set of consecutive space characters on the current line to tab characters, but only
for those sets of spaces that are at least equal to one tab size.
Tabify Selected Lines
Tabifies the current line, causing all spaces at the start of the line (prior to any text) to be converted
to tabs where possible.
Untabify Selected Lines
Untabifies the current line, causing all tabs at the start of the line (prior to any text) to be converted
to spaces.
Make Uppercase
Converts all letters within the selection to uppercase.
Make Lowercase
Converts all letters within the selection to lowercase.
Toggle Character
Toggles the character cases (uppercase / lowercase) of all letters within the selection.
Casing
Capitalize
Capitalizes the first character of every word within the selection.
Delete Horizontal
Deletes any excess white space either side of the cursor position, leaving only one whitespace
Whitespace
character remaining. If there the cursor is within a word or not surrounded by whitespace, this
operation will have no effect.
Trim Trailing
Deletes any trailing whitespace that appears after the last non-whitespace character on the cursor
Whitespace
line.
Delete Line
Completely delete the current cursor line.
Duplicate Line
Duplicates the cursor line, inserting a copy of the line immediately after the cursor line.
Delete Blank Lines
Deletes the line at the cursor if it is empty or contains only whitespace.
R20UT2867EJ0100 Rev.1.00
Feb 01, 2014
Page 232 of 572
CubeSuite+ V2.02.00
APPENDIX A WINDOW REFERENCE
[[Window] menu (Editor panel-dedicated items)]
The following items are exclusive for the [Window] menu in the Editor panel (other items are common to all the panels).
Split
Splits the active Editor panel horizontally.
Only the active Editor panel can be split. Other panels will not be split. A panel can be split up to
two times.
Remove Split
Removes the split view of the Editor panel.
[Context menu]
(1) Titlebar area
(2) Coverage area [IECUBE][Simulator]
(3) Event area
(4) Main area (when connected to the debug tool)
(5) Characters area (when disconnected from the debug tool)
(6) Characters area (when connected to the debug tool)
(1) Titlebar area
Close Panel
Closes the currently selected panel.
Close All but This
Closes all other panels being displayed in the same panel display area as the selected panel,
except for the currently selected panel.
Save file name
Saves the contents of the opened text file.
Copy FUll Path
Copies the full path of the opened text file to the clipboard.
Open Containing Folder
Opens the folder where the text file is saved in Explorer.
New Horizontal Tab
The area for the display of active panels is evenly divided into two areas in the horizontal
Group
direction, and the panels are displayed as a new group of tabbed pages. Only one panel is
active in the new group. The area may be divided into up to four panels.
This item is not displayed in the following cases.
- Only one panel is open.
- The group has already been divided in the vertical direction.
- The group has already been divided into four panels.
New Vertical Tab Group
The area for the display of active panels is evenly divided into two areas in the vertical
direction, and the panels are displayed as a new group of tabbed pages. Only one panel is
active in the new group. The area may be divided into up to four panels.
This item is not displayed in the following cases.
- Only one panel is open.
- The group has already been divided in the horizontal direction.
- The group has already been divided into four panels.
Go to Next Tab Group
When the display area is divided in the horizontal direction, this moves the displayed panel to
the group under that displaying the selected panel.
When the display area is divided in the vertical direction, this moves the displayed panel to the
group to the right of that displaying the selected panel.
This item is not displayed if there is no group in the given direction.
R20UT2867EJ0100 Rev.1.00
Feb 01, 2014
Page 233 of 572
CubeSuite+ V2.02.00
APPENDIX A WINDOW REFERENCE
Go to Previous Tab
When the display area is divided in the horizontal direction, this moves the displayed panel to
Group
the group over that displaying the selected panel.
When the display area is divided in the vertical direction, this moves the displayed panel to the
group to the left of that displaying the selected panel.
This item is not displayed if there is no group in the given direction.
(2) Coverage area [IECUBE][Simulator]
Clear Coverage
Clears all the coverage measurement results currently being stored in the debug tool.
Information
(3) Event area
Set Timer Start Event
Sets a timer start event to start measuring the execution time of the program when the line at
caret is executed (see "2.12.2 Measure execution time in the arbitrary section
[IECUBE][Simulator]").
Set Timer End Event
Sets a timer end event to stop measuring the execution time of the program when the line at
caret is executed (see "2.12.2 Measure execution time in the arbitrary section
[IECUBE][Simulator]").
Set Trace Start Event
Sets a trace start event to start collecting the trace data when the line at the caret is executed
(see "2.11.3 Collect execution history in the arbitrary section")Note.
Set Trace End Event
Sets a trace end event to stop collecting the trace data when the line at the caret is executed
(see "2.11.3 Collect execution history in the arbitrary section")Note.
Register Action Event...
Opens the Action Events dialog box to set an action event to the corresponding address of the
line at the caret position (see "2.14.1 Inset printf").
Enable Event(s)
Changes the state of a selected event to a Valid state.
If the event mark (
) which indicates that multiple events have been set is selected, all of the
events that have been set are enabled.
Disable Events(s)
Changes the state of a selected event to an Invalid state.
If the event mark (
) which indicates that multiple events have been set is selected, all of the
events that have been set are disabled.
Delete Event(s)
Deletes a selected event.
If the event mark (
) which indicates that multiple events have been set is selected, all of the
events that have been set are deleted.
View Details in Event
Opens the Events panel to display the detailed information of the selected event.
Panel
Note [E1][E20][EZ Emulator]
This item is enabled only when the selected microcontroller incorporates the OCD trace function.
(4) Main area (when connected to the debug tool)
Set Breakpoint
Sets a breakpoint to the line at the caret position (see "2.8.3 Stop the program at the arbitrary
position (breakpoint)")Note.
If a breakpoint is already being set to the line, then the breakpoint will be deleted.
Set Hardware Breakpoint
Sets a breakpoint (Hardware Break event) to the line at the caret position.
(except [Simulator])
R20UT2867EJ0100 Rev.1.00
Feb 01, 2014
Page 234 of 572
CubeSuite+ V2.02.00
Set Software Breakpoint
APPENDIX A WINDOW REFERENCE
Sets a breakpoint (Software Break event) to the line at the caret position.
(except [Simulator])
Hardware Break First
(except [Simulator])
The type of break that can be set by a one click operation of the mouse is set as a hardware
breakpoint (this is reflected in the setting of the [First using type of breakpoint] property in the
[Break] category from the [Debug Tool Settings] tab on the Property panel).
Software Break First
The type of break that can be set by a one click operation of the mouse is set as a software
(except [Simulator])
breakpoint (this is reflected in the setting of the [First using type of breakpoint] property in the
[Break] category from the [Debug Tool Settings] tab on the Property panel).
Enable Breakpoint
Changes the selected breakpoint state to a Valid state.
If the event mark (
) which indicates that multiple events have been set is selected, all of the
breakpoints that have been set are enabled.
Disable Breakpoint
Changes the selected breakpoint state to an Invalid state.
If the event mark (
) which indicates that multiple events have been set is selected, all of the
breakpoints that have been set are disabled.
Delete Breakpoint
Deletes the selected breakpoint.
If the event mark (
) which indicates that multiple events have been set is selected, all of the
breakpoints that have been set are deleted.
View Details in Event
Opens the Events panel to display the detailed information of the selected event.
Panel
Note Except for [Simulator]
By default the debug tool will set a hardware break when resources are available.
This behavior can be customized by using the [Hardware Break First] or [Software Break First] menu items.
(5) Characters area (when disconnected from the debug tool)
Cut
Cuts the selected character string and copies it to the clipboard.
If there is no selection, the entire line is cut.
Copy
Copies the contents of the selected range to the clipboard as character string(s).
If there is no selection, the entire line is copied.
Paste
Inserts (insert mode) or overwrites (overwrite mode) the characters that are copied on the clip
board into the caret position.
When the contents of the clipboard are not recognized as characters, the operation is invalid.
Find...
Opens the Find and Replace dialog box with selecting [Quick Find] tab.
Go To...
Opens the Go to Line dialog box to move the caret to the specified line.
Forward To Next Cursor
Forwards to the position before operating [Back To Last Cursor Position].
Position
Back To Last Cursor
Goes back to the position before operating [Jump to Function]/[Find...]/[Go To...]/[Next
Position
Bookmark]/[Previous Bookmark] or moving the caret by clicking the mouse.
The jump history is cleared when all of the Editor panel currently being opened are closed.
Jump to Function
Jumps to the function that is selected or at the caret position regarding the selected characters
and the words at the caret position as functions (see "(7) Jump to functions").
Tag Jump
Jumps to the corresponding line and column in the corresponding file if the information of a file
name, a line number and a column number exists in the line at the caret position (see "(g) Tag
jump").
Bookmark
R20UT2867EJ0100 Rev.1.00
Feb 01, 2014
Displays a cascading menu for bookmarks (see "(9) Register a bookmark").
Page 235 of 572
CubeSuite+ V2.02.00
APPENDIX A WINDOW REFERENCE
Toggle Bookmark
Inserts/deletes a bookmark on the line at the current caret position.
Next Bookmark
Moves a caret to the position of the next bookmark, in the active Editor panel.
Note that this item is disabled in the following cases:
- No bookmark is registered.
- A bookmark is registered only in one line with a caret.
Previous Bookmark
Moves a caret to the position of the previous bookmark, in the active Editor panel.
Note that this item is disabled in the following cases:
- No bookmark is registered.
- A bookmark is registered only in one line with a caret.
Clear All Bookmarks
Clears all the registered bookmarks, in the active Editor panel.
Note that this item is disabled when no bookmark is registered.
List Bookmarks...
Opens the Bookmarks dialog box for displaying the list of bookmarks.
Note that this item is disabled when the project is closed.
Advanced
Displays a cascading menu for performing an advanced operation for the Editor panel.
Increase Line Indent
Increases the indentation of the current cursor line by one tab.
Decrease Line Indent
Decreases the indentation of the current cursor line by one tab.
Uncomment Lines
Removes the first set of line-comment delimiters from the start of the current cursor line,
appropriate to the current language. This operation will only be available when the language of
the current source file has line-comment delimiters specified.
Comment Lines
Places line-comment delimiters at the start of the current cursor line, appropriate to the current
language. This operation will only be available when the language of the current source file has
line-comment delimiters specified.
Convert Tabs to
Converts all tabs on the current cursor line into spaces.
Spaces
Convert Spaces to
Converts each set of consecutive space characters on the current line to tab characters, but
Tabs
only for those sets of spaces that are at least equal to one tab size.
Tabify Selected Lines
Tabifies the current line, causing all spaces at the start of the line (prior to any text) to be
converted to tabs where possible.
Untabify Selected
Untabifies the current line, causing all tabs at the start of the line (prior to any text) to be
Lines
converted to spaces.
Make Uppercase
Converts all letters within the selection to uppercase.
Make Lowercase
Converts all letters within the selection to lowercase.
Toggle Character
Toggles the character cases (uppercase / lowercase) of all letters within the selection.
Casing
Capitalize
Capitalizes the first character of every word within the selection.
Delete Horizontal
Deletes any excess white space either side of the cursor position, leaving only one whitespace
Whitespace
character remaining. If there the cursor is within a word or not surrounded by whitespace, this
operation will have no effect.
Trim Trailing
Deletes any trailing whitespace that appears after the last non-whitespace character on the
Whitespace
cursor line.
Delete Line
Completely delete the current cursor line.
Duplicate Line
Duplicates the cursor line, inserting a copy of the line immediately after the cursor line.
Delete Blank Lines
Deletes the line at the cursor if it is empty or contains only whitespace.
R20UT2867EJ0100 Rev.1.00
Feb 01, 2014
Page 236 of 572
CubeSuite+ V2.02.00
APPENDIX A WINDOW REFERENCE
(6) Characters area (when connected to the debug tool)
Register to Watch1
Registers a selected character string or a word at the caret position to the Watch panel
(Watch1) as a watch-expression (the judgment of the word depends on current build tool).
Note that this item is disabled when no corresponding address exists in the line at caret.
Register to Analysis
Registers a selected character string or a word at the caret position to the Analysis Chart panel
Chart
of the analyze tool (Program Analyzer) as a variable. If variables have been already registered
to all channels, a message is displayed and this operation will have no effect.
Note that this item is disabled when the active project does not support a plug-in of the analyze
tool.
Register Action Event...
Opens the Action Events dialog box to set an action event to the corresponding address of the
line at the caret positionNote 1.
Note that this item is disabled when no corresponding address exists in the line at caret.
Cut
Deletes the selected character string(s) and copies them to the clipboard.
If there is no selection, the entire line is cut.
Note that this item is disabled when this panel is in the mixed display mode.
Copy
Copies the contents of the selected range to the clipboard as character string(s).
If there is no selection, the entire line is copied.
Paste
Inserts (insert mode) or overwrites (overwrite mode) the characters that are copied on the clip
board into the caret position.
Note that this item is disabled when the contents of the clipboard are not recognized as characters
or this panel is in the mixed display mode.
Find...
Opens the Find and Replace dialog box with selecting [Quick Find] tab.
Go To...
Opens the Go to Line dialog box to move the caret to the specified line.
Forward To Next Cursor
Forwards to the position before operating [Back To Last Cursor Position].
Position
Note that this item is disabled when this panel is in the mixed display mode.
Back To Last Cursor
Goes back to the position before operating [Jump to Function]/[Find...]/[Go To...]/[Next
Position
Bookmark]/[Previous Bookmark] or moving the caret by clicking the mouse.
The jump history is cleared when all of the Editor panel currently being opened are closed.
Note that this item is disabled when this panel is in the mixed display mode.
Go to Here
Executes the program from the address indicated by the current PC value to the address
corresponding to the line at the caret positionNote 1.
Note that this item is disabled during program execution/build (not including rapid build)
execution.
Set PC to Here
Sets the address of the line at the current caret position to the current PC valueNote 1.
Note that this item is disabled when no corresponding address exists in the line at caret, or
during program execution/build (not including rapid build) execution
Jump to Function
Jumps to the function that is selected or at the caret position regarding the selected characters
and the words at the caret position as functions (see "(7) Jump to functions").
Tag Jump
Jumps to the corresponding line and column in the corresponding file if the information of a file
name, a line number and a column number exists in the line at the caret position (see "(g) Tag
jump").
Jump to Disassemble
Opens the Disassemble panel and jumps to the address corresponding to the line at the
caretNote 1.
Note that this item is disabled when no corresponding address exists in the line at caret.
Bookmark
R20UT2867EJ0100 Rev.1.00
Feb 01, 2014
Displays a cascading menu for bookmarks (see "(9) Register a bookmark").
Page 237 of 572
CubeSuite+ V2.02.00
Toggle Bookmark
APPENDIX A WINDOW REFERENCE
Inserts/deletes a bookmark on the line at the current caret position.
Note that this item is disabled when this panel is in the mixed display mode.
Next Bookmark
Moves a caret to the position of the next bookmark, in the active Editor panel.
Note that this item is disabled in the following cases:
- No bookmark is registered.
- A bookmark is registered only in one line with a caret.
- This panel is in the mixed display mode.
Previous Bookmark
Moves a caret to the position of the previous bookmark, in the active Editor panel.
Note that this item is disabled in the following cases:
- No bookmark is registered.
- A bookmark is registered only in one line with a caret.
- This panel is in the mixed display mode.
Clear All Bookmarks
Clears all the registered bookmarks, in the active Editor panel.
Note that this item is disabled in the following cases:
- No bookmark is registered.
- This panel is in the mixed display mode.
List Bookmarks...
Opens the Bookmarks dialog box for displaying the list of bookmarks.
Note that this item is disabled when the project is closed.
Advanced
Displays a cascading menu for performing an advanced operation for the Editor panel.
Note that these items are disabled when this panel is in the mixed display mode.
Increase Line Indent
Increases the indentation of the current cursor line by one tab.
Decrease Line Indent
Decreases the indentation of the current cursor line by one tab.
Uncomment Lines
Removes the first set of line-comment delimiters from the start of the current cursor line, appropriate to
the current language. This operation will only be available when the language of the current source file
has line-comment delimiters specified.
Comment Lines
Places line-comment delimiters at the start of the current cursor line, appropriate to the current
language. This operation will only be available when the language of the current source file has linecomment delimiters specified.
Convert Tabs to Spaces
Converts all tabs on the current cursor line into spaces.
Convert Spaces to
Converts each set of consecutive space characters on the current line to tab characters, but only for
Tabs
those sets of spaces that are at least equal to one tab size.
Tabify Selected Lines
Tabifies the current line, causing all spaces at the start of the line (prior to any text) to be converted to
tabs where possible.
Untabify Selected
Untabifies the current line, causing all tabs at the start of the line (prior to any text) to be converted to
Lines
spaces.
Make Uppercase
Converts all letters within the selection to uppercase.
Make Lowercase
Converts all letters within the selection to lowercase.
Toggle Character
Toggles the character cases (uppercase / lowercase) of all letters within the selection.
Casing
Capitalize
Capitalizes the first character of every word within the selection.
Delete Horizontal
Deletes any excess white space either side of the cursor position, leaving only one whitespace
Whitespace
character remaining. If there the cursor is within a word or not surrounded by whitespace, this
operation will have no effect.
Trim Trailing
Deletes any trailing whitespace that appears after the last non-whitespace character on the cursor
Whitespace
line.
R20UT2867EJ0100 Rev.1.00
Feb 01, 2014
Page 238 of 572
CubeSuite+ V2.02.00
APPENDIX A WINDOW REFERENCE
Delete Line
Completely delete the current cursor line.
Duplicate Line
Duplicates the cursor line, inserting a copy of the line immediately after the cursor line.
Delete Blank Lines
Deletes the line at the cursor if it is empty or contains only whitespace.
Break Settings
Set Hardware Break
The following cascade menus are displayed to set the break-related event.
Sets a breakpoint (Hardware Break event) to the line at the caret position (see "2.8.4 Stop the
program at the arbitrary position (break event)")Note 1.
Set Software Break
Sets a breakpoint (Software Break event) to the line at the caret position (see "2.8.4 Stop the
(except [Simulator])
program at the arbitrary position (break event)")Note 1.
Set Combination
Sets a break event (execution type) to the line at the caret position as one of the condition for a
Break
combination break event (see "(1) Set a break event (execution type)")Note 1, 2.
[E1][E20]
Set Read Break to
Sets a break event with read access condition to the line at the caret or the selected variable
(global variable, static variable inside functions, or file-internal static variable)/SFR (see "2.8.5
Stop the program with the access to variables/SFRs").
Set Write Break to
Sets a break event with write access condition to the line at the caret or the selected variable
(global variable, static variable inside functions, or file-internal static variable)/SFR (see "2.8.5
Stop the program with the access to variables/SFRs").
Set R/W Break to
Sets a break event with read/write access condition to the line at the caret or the selected
variable (global variable, static variable inside functions, file-internal static variable)/SFR (see
"2.8.5 Stop the program with the access to variables/SFRs").
Set Read Combination
Sets a break event with read access condition to the line at the caret or the selected variable
Break to
(global variable, static variable inside functions, or file-internal static variable)/SFR as one of
[E1][E20]
the condition for a combination break event (see "2.8.5 Stop the program with the access to
variables/SFRs")Note 2.
Set Write Combination
Sets a break event with write access condition to the line at the caret or the selected variable
Break to
(global variable, static variable inside functions, or file-internal static variable)/SFR as one of
[E1][E20]
the condition for a combination break event (see "2.8.5 Stop the program with the access to
variables/SFRs")Note 2.
Set R/W Combination
Sets a break event with read/write access condition to the line at the caret or the selected
Break to
variable (global variable, static variable inside functions, file-internal static variable)/SFR as
[E1][E20]
one of the condition for a combination break event (see "2.8.5 Stop the program with the
access to variables/SFRs")Note 2.
Break Option
Trace Settings
Start Tracing
Opens the Property panel to set the break function.
The following cascade menus are displayed to set the trace-related eventNote 3.
Sets a trace start event to start collecting the trace data when the line at the caret is executed
(see "2.11.3 Collect execution history in the arbitrary section")Note 1,4.
Stop Tracing
Sets a trace end event to stop collecting the trace data when the line at the caret is executed
(see "2.11.3 Collect execution history in the arbitrary section")Note 1,4.
Record Reading Value
Sets a Point Trace event to record the access value as the trace data when a variable at the
caret or the selected variable (global variable, static variable inside functions, file-internal static
variable) /SFR is read accessed (see "2.11.4 Collect execution history only when the condition
is met [IECUBE][Simulator]").
Record Writing Value
Sets a Point Trace event to record the access value as the trace data when a variable at the
caret or the selected variable (global variable, static variable inside functions, file-internal static
variable) /SFR is write accessed (see "2.11.4 Collect execution history only when the
condition is met [IECUBE][Simulator]").
R20UT2867EJ0100 Rev.1.00
Feb 01, 2014
Page 239 of 572
CubeSuite+ V2.02.00
Record R/W Value
APPENDIX A WINDOW REFERENCE
Sets a Point Trace event to record the access value as the trace data when a variable at the
caret or the selected variable (global variable, static variable inside functions, file-internal static
variable) /SFR is read/ write accessed (see "2.11.4 Collect execution history only when the
condition is met [IECUBE][Simulator]").
Record Start R/W
Sets a trace start event to start collecting the trace data when a variable at the caret or the
Value
selected variable (global variable, static variable inside functions, file-internal static variable) /
[E1][E20]
SFR is read/ write accessed (see "2.11.3 Collect execution history in the arbitrary section").
Record End R/W
Sets a trace end event to stop collecting the trace data when a variable at the caret or the
Value
selected variable (global variable, static variable inside functions, file-internal static variable) /
[E1][E20]
SFR is read/ write accessed (see "2.11.3 Collect execution history in the arbitrary section").
Show Trace Result
Opens the Trace panel and displays the acquired trace data.
Trace Settings
Opens the Property panel to set the trace function.
Note that this item is disabled the trace function is in operation.
Timer Settings
The following cascade menus are displayed to set the timer-related event (see "2.12.2
[IECUBE][Simulator]
Measure execution time in the arbitrary section [IECUBE][Simulator]").
Start timer
Sets a timer start event to start measuring the execution time of the program when an
instruction of an address at the caret position is executedNote 1, 5.
Stop timer
Sets a timer end event to stop measuring the execution time of the program when an
instruction of an address at the caret position is executedNote 1, 5.
View Result of Timer
Clear Coverage
Opens the Events panel and displays only timer-related events.
Clears all the coverage measurement results currently being stored in the debug tool.
Information
[IECUBE][Simulator]
Save Source Mixed Data
Opens the Save As dialog box to newly save the contents of the currently editing Editor panel.
As...
Note that this item is enabled only when the Editor panel is in the mixed display mode.
Notes 1.
A message is displayed if these items are selected when the downloaded load module file is older than
the opened source file.
2.
[E1][E20]
This item is displayed only when the selected microcontroller supports combination break events.
3.
[E1][E20][EZ Emulator]
This item is enabled only when the selected microcontroller incorporates the OCD trace function.
4.
[Simulator]
The [Use trace function] property in the [Trace] category on the Property panel is automatically set to
[Yes].
5.
[Simulator]
The [Use timer function] property in the [Timer] [IECUBE][Simulator] category on the Property panel is
automatically set to [Yes].
R20UT2867EJ0100 Rev.1.00
Feb 01, 2014
Page 240 of 572
CubeSuite+ V2.02.00
APPENDIX A WINDOW REFERENCE
Memory panel
This panel is used to display the contents of the memory and change the memory value (see "2.9.1 Display/change
the memory").
Furthermore, the contents of data flash memory can be displayed and changed when the selected microcontroller
incorporates the data flash memory.
Up to a maximum of four of these panels can be opened. Each panel is identified by the names "Memory1",
"Memory2", "Memory3", and "Memory4" on the titlebar.
The display contents are automatically updated when the value of the memory changes after a program is executed
(when the execution is done in steps, the display is updated after each step).
In addition, by enabling the Real-time display update function, it is also possible to update the display contents in realtime even while a program is being executed.
This panel appears only when connected to the debug tool.
Remarks 1.
You can set the scroll range of the vertical scroll bar on this panel via the Scroll Range Settings dialog
box which is opened by clicking the
2.
button from [View] on the toolbar.
This panel can be zoomed in and out by
in the tool bar, or by moving the mouse
wheel forward or backward while holding down the [Ctrl] key.
Figure A-22. Memory Panel
[Toolbar]
(1)
(2)
(3)
(4)
This section describes the following.
- [How to open]
- [Description of each area]
- [Toolbar]
- [[File] menu (Memory panel-dedicated items)]
- [[Edit] menu (Memory panel-dedicated items)]
- [Context menu]
[How to open]
- From the [View] menu, select [Memory] >> [Memory1-4].
R20UT2867EJ0100 Rev.1.00
Feb 01, 2014
Page 241 of 572
CubeSuite+ V2.02.00
APPENDIX A WINDOW REFERENCE
[Description of each area]
(1) Display position specification area
It is possible to specify the display start position of the memory contents by specifying an address expression.
Specify the following items.
(a) Specify an address expression
Directly input the address expression of the memory value address to display in the text box. You can specify
an input expression with up to 1024 characters. The result of the expression is treated as the display start
position address.
Note that if an address value greater than the microcontroller address space is specified, the high-order
address value is masked.
In addition, an address value greater than the value expressed within 32 bits cannot be specified.
Remarks 1.
A symbol name at the current caret position can be complemented by pressing the [Ctrl] +
[Space] key in this text box (see "2.19.2 Symbol name completion function").
2.
If the specified address expression is the symbol and its size can be recognized, everything
from the start address to the end address of that symbol is displayed selected.
(b) Specify automatic/manual evaluation of the address expression
The timing to change the display start position can be determined by specifying in the [Move when Stop] check
box and the [Move] button.
[Move when Stop]
The caret is moved to the address which is automatically calculated from the address
expression after the program is stopped.
The address expression is not automatically evaluated after the program is stopped.
Click the [Move] button to manually evaluate the address expression.
[Move] button
When the [Move when Stop] check box is not checked, click this button to evaluate the
address expression and move the caret to the result address of the evaluation.
(2) Address area
The address of the memory is displayed (hexadecimal number notation fixing).
The display starts from address 0x0 by default. However, an offset value of the start address can be set via the
Address Offset Settings dialog box that is opened by selecting [Address Offset Value Settings...] from the context
menu.
The address width corresponds to the one in memory space of the specified microcontroller in the project.
This area cannot be edited.
Caution
The offset value that have been set is automatically changed in accordance with the number of
view columns in the Memory value area.
(3) Memory value area
The value of the memory is displayed and changed.
Specification of the display notation, display width of memory values or the number of view columns is performed
by selecting the buttons on the toolbar or [Notation]/[Size Notation]/[View] from the context menu (see "(2)
Change display format of values").
The meanings of the marks and colors displayed as memory values are as follows (character colors and
background colors depend on the configuration in the [General - Font and Color] category of the Option dialog
box):
R20UT2867EJ0100 Rev.1.00
Feb 01, 2014
Page 242 of 572
CubeSuite+ V2.02.00
APPENDIX A WINDOW REFERENCE
Display Example (Default)
(Under line)
Description
Character color
Blue
Memory value that the user is changing
Background color
Standard color
Character color
Standard color
Background color
Standard color
Character color
Brown
Background color
Cream
Press the [Enter] key to write to the target memory.
Memory value of the address whose symbol has been defined
(Registering watch-expression can be performed).
Memory value that has been changed because of the execution of a
programNote
To reset the highlighting, select the
Character color
**
Pink
Memory value for which the Real-time display update function is
Background color
Standard color
Character color
Standard color
Background color
Palegreen
Character color
Standard color
Background color
Orange
Character color
Standard color
Background color
Paleturquoise
Character color
Gray
Background color
Standard color
Character color
Gray
Background color
Standard color
Character color
Gray
being operated
Read/Fetch
Current access condition of the memory value
when the Real-time display update function is
being operated
Write
Read and Write
Memory value of the read-protected area
Areas not memory-mapped
Areas not rewritable (e.g. SFR area/I/O protection area) or when
Background color
Standard color
Character color
Standard color
Background color
button on the toolbar.
Standard color
acquisition of memory values failed
When display is specified for other than the real-time display update
area during program execution or when acquisition of memory
values failed
Note Just before execution of a program, only the memory value in the address range for which the Memory
panel had been displayed becomes the target.
In addition, the value is not highlighted if it is same for before and after the execution of the program.
Caution
The number of view columns is automatically changed in accordance with the set value of [Size
Nortation] of the context menu.
This area is provided with the following functions.
(a) Pop-up display
The following contents are pop-up displayed based on the nearest existing symbol forward from the address
the mouse is designating when hovering the mouse cursor over the memory value.
Note that if there is no symbol information (the underlining is non-display), no pop-up display is done.
variable
Symbol name
R20UT2867EJ0100 Rev.1.00
Feb 01, 2014
+ 0x14
Offset value
Page 243 of 572
CubeSuite+ V2.02.00
Symbol name
Offset value
APPENDIX A WINDOW REFERENCE
Indicates the name of the symbol.
When a symbol has not been defined for the addresses, the offset value from the nearest
symbol exists forward is displayed (hexadecimal number notation fixing).
(b) Real-time display update function
Using the real-time display update function allows you to display/modify the value of the memory contents not
only while the program is stopped, but also in execution.
See "(4) Display/modify the memory contents during program execution" for details on the real-time display
update function.
(c) Changing memory values
Directly edit from the keyboard after moving the caret to the memory value to be edited.
The color of the memory value changes when it is in editing. Press the [Enter] key to write the edited value to
the target memory (if the [Esc] key is pressed before the [Enter] key is pressed, the editing is cancelled).
See "(3) Modify the memory contents" for details on the method for changing the memory value.
(d) Searching/initializing memory value
The Memory Search dialog box is opened to search the memory contents in the specified address range by
selecting [Find...] from the context menu (see "(5) Search the memory contents").
In addition, the Memory Initialize dialog box is opened to change the memory contents collectively in the
specified address range by selecting [Fill...] from the context menu (see "(6) Modify the memory contents in
batch (initialize)").
(e) Copying and pasting
By selecting a range of memory values with the mouse, the contents of the range can be copied to the
clipboard as a character string, and these contents can be pasted to the caret position.
These operations are performed by selecting from the context menu or selecting from the [Edit] menu.
However, the paste operation is possible only when the character string to be pasted and the display notation
(radix and size) of the area match.
If the display notation does not match, a message is displayed.
The character codes and character strings that can be handled by this area are as follows.
If character strings other than these are pasted, a message is displayed.
Character code
ASCII
Character string
0, 1, 2, 3, 4, 5, 6, 7, 8, 9, a, b, c, d, e, f, A, B, C, D, E, F
(f) Registering watch-expression
A memory value with underline indicates that a symbol has been defined in the address, and its symbol can be
registered as a watch-expression.
After selecting the memory value or placing the caret on the memory value, the symbol name of the address is
registered in the Watch panel (Watch1) as a watch-expression by selecting [Register to Watch1] from the
context menu.
Caution
A memory value without underline cannot be registered as a watch-expression.
(g) Saving the contents of memory values
The Data Save dialog box can be opened by selecting the [File] menu >> [Save Memory Data As...], and the
contents of this panel can be saved in a text file (*.txt) or CSV file (*.csv).
R20UT2867EJ0100 Rev.1.00
Feb 01, 2014
Page 244 of 572
CubeSuite+ V2.02.00
APPENDIX A WINDOW REFERENCE
See "(7) Save the memory contents" for details on the method for saving the contents of memory values.
(4) Character strings area
Memory values converted into character code are displayed.
The character code can be specified by selecting [Encoding] from the toolbar or context menu (ASCII code is
selected by default).
Furthermore, in this area, memory values converted into a floating-point value can be displayed as character
strings. To do this, select the following item from [Encording] of the context menu.
Item
Display Format
Float
Single-precision floating-point value
Double
Numeric value
<sign><mantissa>e<sign><exponent>
Infinite number
Inf, and -Inf
Not a number
NaN
Example
+ 1.234567e+123
Double-precision floating-point value
Float Complex
Numeric value
<sign><mantissa>e<sign><exponent>
Infinite number
Inf, and -Inf
Not a number
NaN
Example
+ 1.2345678901234e+123
Complex number of single-precision floating-point
Size
32-bit
64-bit
64-bit
<Single-precision floating-point value> <Single-precision floating-point value> * I
Double Complex
Complex number of double-precision floating-point
128-bit
<Double-precision floating-point value> <Double-precision floating-point value> * I
Float Imaginary
Imaginary number of single-precision floating-point
32-bit
<Single-precision floating-point value> * I
Double Imaginary
Imaginary number of double-precision floating-point
64-bit
<Double-precision floating-point value> * I
Caution
Nothing is displayed when the minimum size of a character code or a floating-point value is
greater than "the number of bytes of display width of memory values" x "the number of bytes of
the number of view columns".
This area is provided with the following functions.
(a) Changing character strings
Directly edit from the keyboard after moving the caret to the character string to be edited.
The color of the character string changes when it is in editing. Press the [Enter] key to write the edited value to
the target memory (if the [Esc] key is pressed before the [Enter] key is pressed, the editing is cancelled).
Caution
Character strings displayed as floating-point values cannot be searched.
(b) Searching character strings
The Memory Search dialog box is opened to search for character strings by selecting [Find...] from the context
menu (see "(5) Search the memory contents").
R20UT2867EJ0100 Rev.1.00
Feb 01, 2014
Page 245 of 572
CubeSuite+ V2.02.00
APPENDIX A WINDOW REFERENCE
(c) Copying and pasting
By selecting a range of character strings with the mouse, the contents of the range can be copied to the
clipboard as a character string, and these contents can be pasted to the caret position.
These operations are performed by the selecting from the context menu or selecting from the [Edit] menu.
However, the paste operation is possible only when [ASCII] has been selected as the character code. If other
than [ASCII] is selected, a message is displayed.
[Toolbar]
Acquires the latest data from the debug tool, and updates the contents of this panel.
Resets highlighting of values that have been changed by executing a program.
This item is disabled during execution of a program.
Notation
The following buttons to change the notation of memory values are displayed.
The items below is disabled during execution of a program.
Displays memory values in hexadecimal number (default).
Displays memory values in signed decimal number.
Displays memory values in unsigned decimal number.
Displays memory values in octal number.
Displays memory values in binary number.
Size Notation
The following buttons to change the notation of sizes of memory values are displayed.
The items below is disabled during execution of a program.
Displays memory values in 4-bit width.
Displays memory values in 8-bit width (default).
Displays memory values in 16-bit width.
Values are converted depending on the endian of the target memory area.
Displays memory values in 32-bit width.
Values are converted depending on the endian of the target memory area.
Displays memory values in 64-bit width.
Values are converted depending on the endian of the target memory area.
Encoding
The following buttons to change the encoding of character strings are displayed.
The items below is disabled during execution of a program.
Displays character strings in ASCII code (default).
Displays character strings in Shift_JIS code.
Displays character strings in EUC-JP code.
Displays character strings in UTF-8 code.
Displays character strings in UTF-16 code.
Displays character strings as a single-precision floating-point value.
Displays character strings as a double-precision floating-point value.
Displays character strings as a complex number of single-precision floating-point.
Displays character strings as a complex number of double-precision floating-point.
Displays character strings as an imaginary number of single-precision floating-point.
Displays character strings as an imaginary number of double-precision floating-point.
R20UT2867EJ0100 Rev.1.00
Feb 01, 2014
Page 246 of 572
CubeSuite+ V2.02.00
View
APPENDIX A WINDOW REFERENCE
The following buttons to change the display format are displayed.
Opens the Scroll Range Settings dialog box to set the scroll range for this panel.
Column Number
Opens the Column Number Settings dialog box to set the number of view columns in the Memory
Settings...
value area.
Address Offset Value
Opens the Address Offset Settings dialog box to set an offset value for addresses displayed in the
Settings...
Address area.
[[File] menu (Memory panel-dedicated items)]
The following items are exclusive for the [File] menu in the Memory panel (other items are common to all the panels).
Note that all these items are disabled during execution of a program.
Save Memory Data
Overwrites the contents of this panel to the previously saved text file (*.txt)/CSV file (*.csv) (see
"(g) Saving the contents of memory values").
Note that when the file has never been saved or the file is write disabled, the same operation is
applied as the selection in [Save Memory Data As...].
Save Memory Data As...
Opens the Data Save dialog box to newly save the contents of this panel to the specified text file
(*.txt)/CSV file (*.csv) (see "(g) Saving the contents of memory values").
[[Edit] menu (Memory panel-dedicated items)]
The following items are exclusive for [Edit] menu in the Memory panel (all other items are disabled).
Note that all these items are disabled during execution of a program.
Copy
Copies the contents of the selected range to the clipboard as character string(s).
Paste
Pastes the character string(s) copied in the clipboard to the caret position.
- To the memory value area:
See "(e) Copying and pasting".
- To the character strings area: See "(c) Copying and pasting".
Find...
Opens the Memory Search dialog box.
The search is operated either in the Memory value area or the Character strings area, in which a
caret is.
[Context menu]
Register to Watch1
Registers the symbol at the caret to the Watch panel (Watch1).
At this time, since it is registered as a variable name, the symbol name that is displayed changes
depending on the scope.
Note that this item is disabled when no symbol has been defined in the address corresponding to
the memory value at the caret position (see "(f) Registering watch-expression").
Find...
Opens the Memory Search dialog box.
The search is operated either in the Memory value area or the Character strings area (unless the
floating-point value display is selected), in which a caret is.
This item is disabled during execution of a program.
Fill...
Opens the Memory Initialize dialog box.
Refresh
Acquires the latest data from the debug tool, and updates the contents of this panel.
Copy
Copies the contents of the selected range to the clipboard as character string(s).
This item is disabled during execution of a program.
R20UT2867EJ0100 Rev.1.00
Feb 01, 2014
Page 247 of 572
CubeSuite+ V2.02.00
Paste
APPENDIX A WINDOW REFERENCE
Pasts the character string(s) copied in the clipboard to the caret position.
This item is disabled during execution of a program.
- To the memory value area:
See "(e) Copying and pasting".
- To the character strings area: See "(c) Copying and pasting".
Notation
The following cascade menus are displayed to specify the notation of memory values.
Hexadecimal
Displays memory values in hexadecimal number (default).
Signed Decimal
Displays memory values in signed decimal number.
Unsigned Decimal
Displays memory values in unsigned decimal number.
Octal
Displays memory values in octal number.
Binary
Displays memory values in binary number.
Size Notation
The following cascade menus are displayed to specify the notation of sizes of memory values.
4 Bits
Displays memory values in 4-bit width.
1 Byte
Displays memory values in 8-bit width (default).
2 Bytes
Displays memory values in 16-bit width.
Values are converted depending on the endian of the target memory area.
4 Bytes
Displays memory values in 32-bit width.
Values are converted depending on the endian of the target memory area.
8 Bytes
Displays memory values in 64-bit width.
Values are converted depending on the endian of the target memory area.
Encoding
The following cascade menus are displayed to specify the display format in the character strings
area.
ASCII
Displays character strings in ASCII code (default).
Shift_JIS
Displays character strings in Shift_JIS code.
EUC-JP
Displays character strings in EUC-JP code.
UTF-8
Displays character strings in UTF-8 code.
UTF-16
Displays character strings in UTF-16 code.
Float
Displays character strings as a single-precision floating-point value.
Double
Displays character strings as a double-precision floating-point value.
Float Complex
Displays character strings as a complex number of single-precision floating-point.
Double Complex
Displays character strings as a complex number of double-precision floating-point.
Float Imaginary
Displays character strings as an imaginary number of single-precision floating-point.
Double Imaginary
Displays character strings as an imaginary number of double-precision floating-point.
View
Settings Scroll Range...
The following cascade menus are displayed to specify the display format.
Opens the Scroll Range Settings dialog box to set the scroll range for this panel.
Column Number
Opens the Column Number Settings dialog box to set the number of view columns in the Memory
Settings...
value area.
Address Offset Value
Opens the Address Offset Settings dialog box to set an offset value for addresses displayed in the
Settings...
Address area.
Highlight Accessed
Highlights memory values that have changed by execution of a program if this item is checked
(default).
This item is disabled during execution of a program.
R20UT2867EJ0100 Rev.1.00
Feb 01, 2014
Page 248 of 572
CubeSuite+ V2.02.00
Periodic Updating
APPENDIX A WINDOW REFERENCE
The following cascade menus are displayed to set for the real-time display update function (see
"(b) Real-time display update function").
Periodic Updating
Opens the Property panel to set for the real-time display update function.
Options
R20UT2867EJ0100 Rev.1.00
Feb 01, 2014
Page 249 of 572
CubeSuite+ V2.02.00
APPENDIX A WINDOW REFERENCE
Disassemble panel
This panel is used to display the results of disassembling the contents of the memory (disassembled text), and execute
line assembly (see "2.6.4 Perform line assembly").
Furthermore, the instruction level debugging (see "2.7.3 Execute programs in steps") and the code coverage
measurement result display [IECUBE][Simulator] (see "2.13 Measure Coverage [IECUBE][Simulator]") can be
performed in this panel.
Up to a maximum of four of these panels can be opened. Each panel is identified by the names "Disassemble1",
"Disassemble2", "Disassemble3" and "Disassemble4" on the titlebar.
The source text in the source file corresponding to the code data can also be displayed by setting to the mixed display
mode (default).
This panel appears only when connected to the debug tool.
Caution
A step execution is performed in instruction level units when the focus is in this panel (see "2.7.3
Execute programs in steps").
Remarks 1.
You can set the scroll range of the vertical scroll bar on this panel via the Scroll Range Settings dialog
box which is opened by clicking the
button from [View] on the toolbar.
2.
You can print the current screen image of this panel by selecting [Print...] from the [File] menu.
3.
This panel can be zoomed in and out by
in the tool bar, or by moving the mouse
wheel forward or backward while holding down the [Ctrl] key.
Figure A-23. Disassemble Panel (When Mixed Display Mode Is Selected)
[Toolbar]
(1)
(2)
R20UT2867EJ0100 Rev.1.00
Feb 01, 2014
(3)
Page 250 of 572
CubeSuite+ V2.02.00
APPENDIX A WINDOW REFERENCE
Figure A-24. Disassemble Panel (When Mixed Display Mode Is Not Selected)
[Toolbar]
(1)
(2)
(3)
Figure A-25. Disassemble Panel (When Code Coverage Measurement Result Is Displayed)
[Toolbar]
(1)
(2)
(3)
This section describes the following.
- [How to open]
- [Description of each area]
- [Toolbar]
- [[File] menu (Disassemble panel-dedicated items)]
- [[Edit] menu (Disassemble panel-dedicated items)]
- [Context menu]
R20UT2867EJ0100 Rev.1.00
Feb 01, 2014
Page 251 of 572
CubeSuite+ V2.02.00
APPENDIX A WINDOW REFERENCE
[How to open]
- From the [View] menu, select [Disassemble] >> [Disassemble1 - 4].
[Description of each area]
(1) Event area
The lines for which events can be set are shown with the background color in white (this mean that events cannot
be set for those lines whose background color in gray).
In addition, the Event mark corresponding to an event that has been currently set is displayed.
This area is provided with the following functions.
(a) Setting/deleting breakpoints
By clicking where you want to set a breakpoint with the mouse, the breakpoint can be set easily.
The breakpoint is set to the instruction at the start address of the clicked line.
Once the breakpoint is set, the Event mark is displayed at the line that is set. In addition, the detailed
information about the set breakpoint is reflected in the Events panel.
When this operation is performed at a place where any one of the event marks is already being displayed, that
event is deleted and the setting of breakpoints cannot be done.
Note that the setting of events can be done only for those lines where the background color is shown in white.
See "2.8.3 Stop the program at the arbitrary position (breakpoint)" for details on how to set the breakpoint.
(b) Changes event status
Event status can be changed from the following menu displayed by right-clicking the event mark.
Enable Event
Changes the selected event state to a Valid state.
Event occurs when the specified condition is met.
When the event mark (
) which indicates that multiple events have been set is
selected, all of the events that have been set are enabled.
Disable Event
Changes the selected event state to an Invalid state.
Event does not occur when the specified condition is met.
When the event mark (
) which indicates that multiple events have been set is
selected, all of the events that have been set are disabled.
Delete Event
Deletes the selected event.
When the event mark (
) which indicates that multiple events have been set is
selected, all of the events that have been set are deleted.
View Event Detailed Setup
Opens the Events panel to display the detailed information of the selected event.
(c) Pop-up display
By hovering the mouse cursor over the Event mark, the name of the event, the detailed information for the
event and the comments added to the event are pop-up displayed.
When multiple events have been set in the applicable place, information for each event, up to a maximum of
three events, is listed and displayed.
(2) Address area
The address per line to start disassembling is displayed (hexadecimal number notation fixing).
In addition, the current PC mark (
) that corresponds to the current PC position (PC register value) is displayed.
The address width corresponds to the one in memory space of the specified microcontroller in the project.
For the source text line in the mixed display mode, line numbers (xxx:) in the source file correspond to the start
address are displayed.
R20UT2867EJ0100 Rev.1.00
Feb 01, 2014
Page 252 of 572
CubeSuite+ V2.02.00
APPENDIX A WINDOW REFERENCE
This area is provided with the following functions.
(a) Pop-up display
By hovering the mouse cursor over a address or line number, the following information is pop-up displayed.
Address
Format: <Label name> + <Offset value>
Source line number
Example1:
main + 0x10
Example2:
sub function + 0x20
Format: <File name> # <Line number>
Example1:
main.c#40
Example2:
main.c#100
(3) Disassemble area
The results of disassembling are displayed next to the corresponding source text as follows.
Figure A-26. Display Contents of Disassemble Area (In Case of Mixed Display Mode)
Label line
PC line
Breakpoint line
Source text line
Disassemble results
Offset value
Label line
Code
Instruction
The label is displayed when a label is defined for the address, and its corresponding line is
shown highlighted in lightgreen.
PC line
A line corresponding to an address of the current PC (PC register value) is shown
highlightedNote 1.
Breakpoint line
A line at which a breakpoint is set is shown highlightedNote 1.
Source text line
The source text corresponding to the code data is displayedNote 2.
Disassemble
results
Offset value
The offset value from the nearest label is displayed when a label is defined for the addressNote 3.
Code
The code that is the target of disassembly is displayed in hexadecimal number.
Instruction
Instruction is displayed as the result of disassembling.
The mnemonics are shown highlighted in blue.
Notes 1.
The highlighting color depends on the configuration in the [General - Font and Color] category of the
Option dialog box.
R20UT2867EJ0100 Rev.1.00
Feb 01, 2014
Page 253 of 572
CubeSuite+ V2.02.00
2.
APPENDIX A WINDOW REFERENCE
The source text can be set to non-display by clicking the
button (toggle) on the toolbar or removing
the check for [Mixed Display] from the context menu (this option is checked by default).
3.
Offset values are not displayed by default. They can be displayed by clicking the
button on the
toolbar or selecting [Show Offset] from the context menu.
This area is provided with the following functions.
(a) Line assembly
Instructions and code displayed in this panel can be edited (line assembly).
See "2.6.4 Perform line assembly" for details on how to operate it.
(b) Program execution by instruction level
Execution can be controlled at the instruction level unit by step executing a program in a state where there is a
focus on this panel.
See "2.7.3 Execute programs in steps" for details on how to operate it.
(c) Setting of various events
Various events can be set to the addresses/lines where the caret currently exists by selecting [Bread Settings],
[Trace Settings] or [Timer Settings] from the context menu.
The corresponding Event mark is displayed in the Event area when an event is set. In addition, the detailed
information about the set event is reflected in the Events panel.
+Note, however, that the setting of events can be done only for those lines where the background color is
shown in white in the event area.
See the following for details on how to set events.
- "2.8.5 Stop the program with the access to variables/SFRs"
- "2.11.3 Collect execution history in the arbitrary section"
- "2.11.4 Collect execution history only when the condition is met [IECUBE][Simulator]"
- "2.12.2 Measure execution time in the arbitrary section [IECUBE][Simulator]"
Remark
A breakpoint can be set or deleted easily in the Event area as well (see "(a) Setting/deleting
breakpoints").
(d) Registering watch-expression
Variable names of C language, CPU registers, SFR, and assembler symbols can be registered in the Watch
panel as watch-expressions.
See "(1) Register a watch-expression" for details on how to operate it.
(e) Moving to symbol definition place
By clicking the
button on the toolbar or selecting [Go to Symbol] from the context menu in a state where the
caret has been moved to a instruction that has referenced a symbol, the caret position is moved to the address
where the symbol at the caret position has been defined.
In addition, when following on this operation you click on the
button on the toolbar or select [Back to
Address] from the context menu, the caret position is returned to the instruction that has referenced a symbol
before the caret was moved (the address value of the instruction that has referenced a symbol is displayed in
Address).
(f) Jump to source line and memory
Selecting [Jump to Source] from the context menu will open the Editor panel with the caret moved to the
source line corresponding to the address at the current caret position (if the Editor panel is already open, the
screen will jump to the panel).
R20UT2867EJ0100 Rev.1.00
Feb 01, 2014
Page 254 of 572
CubeSuite+ V2.02.00
APPENDIX A WINDOW REFERENCE
In addition, similarly, selecting [Jump to Memory] will open the Memory panel (Memory1) with the caret moved
to the memory value corresponding to the address at the current caret position (if the Memory panel
(Memory1) is already open, the screen will jump to the panel).
(g) Code coverage measurement result display [IECUBE][Simulator]
When the coverage function is validNote, lines corresponding to the specified coverage measurement area are
shown highlighted based on the code coverage measurement result that is acquired by executing the program.
See "2.13 Measure Coverage [IECUBE][Simulator]" for details on the coverage measurement.
Note [IECUBE]
The coverage function is always valid.
(h) Saving the contents of disassembled data
The Data Save dialog box can be opened by selecting the [File] menu >> [Save Disassemble Data As…], and
the contents of this panel can be saved in a text file (*.txt) or CSV file (*.csv).
See "(5) Save the disassembled text contents" for details on the method for saving the contents of
disassembled data.
[Toolbar]
Acquires the latest data from the debug tool, and updates the contents of this panel.
Sets to the mixed display mode and displays the correspondence between the disassembled data and the
source text (default).
Specifies the caret position so that it follows the current PC value.
Moves the caret to the define position of the selected symbol.
Moves the caret to the position (address) immediately before it is moved with the
View
button.
The following buttons to set the display contents in the disassemble area are displayed.
Displays the offset value of the label. The offset value from the nearest label is displayed when a label is
defined for the address.
Displays the address value in the format "symbol + offset value" (default).
Note that when a symbol has been defined as the address value, only the symbol is displayed.
Displays the name of the register by its function name (default).
Displays the name of the register by its absolute name.
Opens the Scroll Range Settings dialog box to set the scroll range for this panel.
[[File] menu (Disassemble panel-dedicated items)]
The following items are exclusive for the [File] menu in the Disassemble panel (other items are common to all the
panels).
Note that all these items are disabled during execution of a program.
Save Disassemble Data
Overwrites the contents of the disassembling to the previously saved text file (*.txt)/CSV file
(*.csv) (see "(h) Saving the contents of disassembled data").
Note that when the file has never been saved or the file is write disabled, the same operation is
applied as the selection in [Save Disassemble Data As…].
Save Disassemble Data
Opens the Data Save dialog box to newly save the contents of the disassembling to the
As…
specified text file (*.txt)/CSV file (*.csv) (see "(h) Saving the contents of disassembled data").
R20UT2867EJ0100 Rev.1.00
Feb 01, 2014
Page 255 of 572
CubeSuite+ V2.02.00
Print...
APPENDIX A WINDOW REFERENCE
Opens the Print Address Range Settings dialog box for printing the contents of this panel.
[[Edit] menu (Disassemble panel-dedicated items)]
The following items are exclusive for the [Edit] menu in the Disassemble panel (all other items are disabled).
Copy
When a line is selected, copies the contents of the selected line to the clipboard as a character
string.
In the case of the edit mode, copies the selected character string to the clipboard.
Rename
Changes to the edit mode to edit the instruction/code at the caret position (see "2.6.4 Perform
line assembly").
This item is disabled during execution of a program.
Find…
Opens the Find and Replace dialog box with selecting the [Find in Files] tab.
Replace…
Opens the Find and Replace dialog box with selecting the [Replace in Files] tab.
Move…
Opens the Go to the Location dialog box to move the caret to the specified address.
[Context menu]
[Disassemble area and Address area]
Register to Watch1
Registers the selected character string or the word at the caret position to the Watch panel
(Watch1) as a watch-expression (the judgment of the word depends on current build tool).
At this time, since it is registered as a variable name, the symbol name that is displayed
changes depending on the scope.
Register Action Event...
Opens the Action Events dialog box to set an action event to the address at the caret position.
Go to Here
Executes the program from the address indicated by the current PC value to the address
corresponding to the line at the caret position.
This item is disabled during program execution/build (not including rapid build) execution.
Set PC to Here
Sets the address of the line at the current caret position to the current PC value.
This item is disabled during program execution/build (not including rapid build) execution.
Move…
Opens the Go to the Location dialog box to move the caret to the specified address.
Go to Symbol
Moves the caret to the define position of the selected symbol.
Back to Address
Moves the caret to the position (address) immediately before it is moved by [Go to Symbol].
Note that this item is disabled when no symbol name is displayed in the address.
Break Settings
The following cascade menus are displayed to set the break-related event.
Note that breakpoints can be set only for lines for which events can be set (see "(1) Event
area").
Set Hardware Break
Sets a breakpoint (Hardware Break event to the address at the caret position (see "2.8.3 Stop
the program at the arbitrary position (breakpoint)").
Set Software Break
Sets a breakpoint (Software Break event) to the address at the caret position (see "2.8.3 Stop
(except [Simulator])
the program at the arbitrary position (breakpoint)").
Set Combination Break
Sets a break event (execution type) to the address at the caret position as one of the condition
[E1][E20]
for a combination break event (see "(1) Set a break event (execution type)")Note 1.
Set Read Break to
Sets a break event with read access condition to a variable at the caret or a selected variable
(global variable/static variable inside functions/file-internal static variable)/SFR (see "(1) Set a
break event (access type)").
R20UT2867EJ0100 Rev.1.00
Feb 01, 2014
Page 256 of 572
CubeSuite+ V2.02.00
Set Write Break to
APPENDIX A WINDOW REFERENCE
Sets a break event with write access condition to a variable at the caret or a selected variable
(global variable/static variable inside functions/file-internal static variable)/SFR (see "(1) Set a
break event (access type)").
Set R/W Break to
Sets a break event with read/write access condition to a variable at the caret or a selected
variable (global variable/static variable inside functions/file-internal static variable)/SFR (see "(1)
Set a break event (access type)").
Set Read Combination
Sets a break event with read access condition to the line at the caret or the selected variable
Break to
(global variable, static variable inside functions, or file-internal static variable)/SFR as one of the
[E1][E20]
condition for a combination break event (see "(1) Set a break event (access type)")Note 1.
Set Write Combination
Sets a break event with write access condition to the line at the caret or the selected variable
Break to
(global variable, static variable inside functions, or file-internal static variable)/SFR as one of the
[E1][E20]
condition for a combination break event (see "(1) Set a break event (access type)")Note 1.
Set R/W Combination
Sets a break event with read/write access condition to the line at the caret or the selected
Break to
variable (global variable, static variable inside functions, file-internal static variable)/SFR as one
[E1][E20]
of the condition for a combination break event (see "(1) Set a break event (access type)")Note 1.
Break Option
Opens the Property panel to set the break function.
Trace Settings
The following cascade menus are displayed to set the trace-related eventNote 2.
Note that events can be set only for lines for which events can be set (see "(1) Event area").
Start Tracing
Sets a trace start event to start collecting the trace data when an instruction of an address at the
caret position is executed (see "(1) Set a Trace event").
[Simulator]
In addition, the selecting of the [Use trace function] property in the [Trace] category on the
Property panel is automatically set to [Yes].
Stop Tracing
Sets a trace end event to stop collecting the trace data when an instruction of an address at the
caret position is executed (see "(1) Set a Trace event").
[Simulator]
In addition, the selecting of the [Use trace function] property in the [Trace] category on the
Property panel is automatically set to [Yes].
Record Reading Value
Sets a Point Trace event to record the access value as the trace data when a variable at the
caret or the selected variable (global variable, static variable inside functions, file-internal static
variable) or SFR is read accessed (see "(1) Set a Point Trace event").
Record Writing Value
Sets a Point Trace event to record the access value as the trace data when a variable at the
caret or the selected variable (global variable, static variable inside functions, file-internal static
variable) or SFR is write accessed (see "(1) Set a Point Trace event").
Record R/W Value
Sets a Point Trace event to record the access value as the trace data when a variable at the
caret or a selected variable (global variable/static variable inside functions/file-internal static
variable)/SFR is read/write accessed (see "(1) Set a Point Trace event").
Record Start R/W Value
Sets a trace start event to start collecting the trace data when a variable at the caret or the
[E1][E20]
selected variable (global variable, static variable inside functions, file-internal static variable) /
SFR is read/ write accessed (see "(1) Set a Trace event").
Record End R/W Value
Sets a trace end event to stop collecting the trace data when a variable at the caret or the
[E1][E20]
selected variable (global variable, static variable inside functions, file-internal static variable) /
SFR is read/ write accessed (see "(1) Set a Trace event").
Show Trace Result
Opens the Trace panel and displays the acquired trace data.
Trace Settings
Opens the Property panel to set the trace function.
R20UT2867EJ0100 Rev.1.00
Feb 01, 2014
Page 257 of 572
CubeSuite+ V2.02.00
APPENDIX A WINDOW REFERENCE
Timer Settings
The following cascade menus are displayed to set the timer-related event (see "2.12.2
[IECUBE][Simulator]
Measure execution time in the arbitrary section [IECUBE][Simulator]").
Note that events can be set only for lines for which events can be set (see "(1) Event area").
Start timer
Sets a timer start event to start measuring the execution time of the program when an
instruction of an address at the caret position is executed.
[Simulator]
In addition, the selecting of the [Use timer function] property in the [Timer]
[IECUBE][Simulator] category on the Property panel is automatically set to [Yes].
Stop timer
Sets a timer end event to stop measuring the execution time of the program when an instruction
of an address at the caret position is executed.
[Simulator]
In addition, the selecting of the [Use timer function] property in the [Timer]
[IECUBE][Simulator] category on the Property panel is automatically set to [Yes].
View Result of Timer
Opens the Events panel and displays only timer-related events.
Clear Coverage Information
Clears all the coverage measurement results currently being stored in the debug tool.
Note that this item appears only when the debug tool used supports the coverage function.
Edit Disassemble
Changes to the edit mode to edit the instruction of the line at the caret position (see "2.6.4
Perform line assembly").
This item is disabled during execution of a program.
Edit Code
Changes to the edit mode to edit the code of the line at the caret position (see "2.6.4 Perform
line assembly").
This item is disabled during execution of a program.
View
The following cascade menus to set the display contents in the disassemble area are displayed.
Show Offset
Displays the offset value of the label. The offset value from the nearest label is displayed when
a label is defined for the address.
Show Symbol
Displays the address value in the format "symbol + offset value" (default).
Note that when a symbol has been defined as the address value, only the symbol is displayed.
Show Function Name
Displays the name of the register by its function name (default).
Show Absolute Name
Displays the name of the register by its absolute name.
Settings Scroll Range...
Opens the Scroll Range Settings dialog box to set the scroll range for this panel.
Mixed Display
Sets to the mixed display mode and displays the correspondence between the disassembled
data and the source text (default).
Jump to Source
Opens the Editor panel and jumps to the source line corresponding to the address at the caret
position in this panel.
Jump to Memory
Opens the Memory panel (Memory1) and jumps to the memory value corresponding to the
address at the caret position in this panel.
Notes 1.
[E1][E20]
This item is displayed only when the selected microcontroller supports combination break events.
2.
[E1][E20][EZ Emulator]
This item is enabled only when the selected microcontroller incorporates the OCD trace function.
[Event area] (except [Simulator])
Hardware Break First
The type of break that can be set by a one click operation of the mouse is set as a hardware
breakpoint (this is reflected in the setting of the [First using type of breakpoint] property in the
[Break] category on the Property panel).
R20UT2867EJ0100 Rev.1.00
Feb 01, 2014
Page 258 of 572
CubeSuite+ V2.02.00
Software Break First
APPENDIX A WINDOW REFERENCE
The type of break that can be set by a one click operation of the mouse is set as a software
breakpoint (this is reflected in the setting of the [First using type of breakpoint] property in the
[Break] category on the Property panel).
R20UT2867EJ0100 Rev.1.00
Feb 01, 2014
Page 259 of 572
CubeSuite+ V2.02.00
APPENDIX A WINDOW REFERENCE
CPU Register panel
This panel is used to display the contents of the CPU register (general-purpose registers and control registers) and
change the CPU register values (see "2.9.2 Display/change the CPU register").
This panel appears only when connected to the debug tool.
Remarks 1.
This panel can be zoomed in and out by
in the tool bar, or by moving the mouse
wheel forward or backward while holding down the [Ctrl] key.
2.
When the separator line of each area in this panel is double-clicked, the width of the area changes to
the shortest possible size that can display the contents of the area.
Figure A-27. CPU Register Panel
[Toolbar]
(1)
(2)
This section describes the following.
- [How to open]
- [Description of each area]
- [Toolbar]
- [[File] menu (CPU Register panel-dedicated items)]
- [[Edit] menu (CPU Register panel-dedicated items)]
- [Context menu]
[How to open]
- From the [View] menu, select [CPU Register].
[Description of each area]
(1) [Register Name] area
The types of register are classified as categories (folders), and a list of the respective register names is displayed.
Note that neither category names nor register names can be edited and deleted.
The meanings of the icons are as follows:
R20UT2867EJ0100 Rev.1.00
Feb 01, 2014
Page 260 of 572
CubeSuite+ V2.02.00
APPENDIX A WINDOW REFERENCE
Indicates that the register name belonging to this category is displayed. When you double-click on the
icon, or click on the "-" mark, the category is closed and the register name is hidden.
Indicates that the register name belonging to this category is hidden. When you double-click on the icon,
or click on the "+" mark, the category is opened and the register name is displayed.
Indicates the name of the register. When you double-click on the icon, or click on the "+" or "-" marks, the
name of the register part is displayed or hidden.
Indicates the name of the register part.
Category names and register names displayed are as follows (number of "+" marks before register names
indicates the depth of the display level):
Table A-3. Category Names and Register Names in CPU Register Panel
Category Name
General-purpose
Register Name (Alias)
+ AX(RP0)
register
16
++ X(R0)
8
++ A(R1)
8
+ BC(RP1)
8
++ B(R3)
8
General-purpose register (current register bank)
16
++ E(R4)
8
++ D(R5)
8
+ HL(RP3)
Description
16
++ C(R2)
+ DE(RP2)
Control register
Bit Width
16
++ L(R6)
8
++ H(R7)
8
+ PC
20
Program counter
+ PSW
8
Program status word
++ IE
1
Interrupt enable flag
++ Z
1
Zero flag
++ RBS1
1
Register bank selection flag
++ AC
1
Auxiliary carry flag
++ RBS0
1
Register bank selection flag
++ ISP1
1
In service priority flag
++ ISP0
1
In service priority flag
++ CY
1
Carry flag
+ SP
16
Stack pointer
+ ES
8
ES register
+ CS
8
CS register
R20UT2867EJ0100 Rev.1.00
Feb 01, 2014
Page 261 of 572
CubeSuite+ V2.02.00
APPENDIX A WINDOW REFERENCE
Category Name
General-purpose
Register Name (Alias)
+ AX(RP0): Register bank n
register: Register
bank nNote
Bit Width
16
+ X(R0): Register bank n
8
++ A(R1): Register bank n
8
+ BC(RP1): Register bank n
16
++ C(R2): Register bank n
8
++ B(R3): Register bank n
8
+ DE(RP2): Register bank n
Description
General-purpose register (Register bank n)
16
++ E(R4): Register bank n
8
++ D(R5): Register bank n
8
+ HL(RP3): Register bank n
16
++ L(R6): Register bank n
8
++ H(R7): Register bank n
8
Note "n" indicates the number of the register bank (n = 0, 1, 2, 3).
This area is provided with the following functions.
(a) Registering watch-expression
CPU registers/categories can be registered in the Watch panel as watch-expressions.
See "(1) Register a watch-expression" for details on how to operate it.
Remarks 1.
When you have registered a watch-expression with a category as the object, all of the CPU
registers belonging to that category are registered as watch-expressions.
2.
A scope specification is automatically added to a registered watch-expression.
(2) [Value] area
The values of each CPU register are displayed and changed.
The radix of a data value can be selected by the button on the toolbar or the context menu item. In addition, a
display format adding the value in hexadecimal number constantly can also be selected as well.
The meanings of the colors of the CPU register values are as follows (character colors and background colors
depend on the configuration in the [General - Font and Color] category of the Option dialog box):
Display Example (Default)
Character color
Blue
Background color
Standard color
Character color
Brown
Background color
Cream
Description
The value of the CPU register that the user is changing
Press the [Enter] key to write to the target memory.
The value of the CPU register that has been changed because of the
execution of a program.
The highlighting is rest by executing again the program.
This area is provided with the following functions.
(a) Changing the CPU register value
To edit the CPU register value, select the value to edit, then change the value directly from the keyboard after
clicking again on it (press the [Esc] key to cancel the edit mode).
R20UT2867EJ0100 Rev.1.00
Feb 01, 2014
Page 262 of 572
CubeSuite+ V2.02.00
APPENDIX A WINDOW REFERENCE
After you edit the value of the CPU register, it is written to the target memory of the debug tool by pressing the
[Enter] key or moving the focus to outside the edit region.
(b) Saving the contents of the CPU register
The Save As dialog box can be opened by selecting the [File] menu >> [Save CPU Register Data As…], and
all the contents of this panel can be saved in a text file (*.txt) or CSV file (*.csv).
See "(4) Save the CPU register contents" for details on the method for saving the contents of the CPU register.
[Toolbar]
Acquires the latest data from the debug tool, and updates the contents of this panel.
This item is disabled during execution of a program.
Notation
The following buttons to change the notation of a data value are displayed.
Displays the value of the selected item (including sub-items) in the default notation (default).
Displays the value of the selected item (including sub-items) in hexadecimal number.
Displays the value of the selected item (including sub-items) in signed decimal number.
Displays the value of the selected item (including sub-items) in unsigned decimal number.
Displays the value of the selected item (including sub-items) in octal number.
Displays the value of the selected item (including sub-items) in binary number.
Displays the character string of the selected item (including sub-items) in ASCII code. If the character size is
2 bytes and above, it is displayed with the characters for each 1 byte arranged side-by-side.
Displays the value of the selected item in Float.
Note that when the value is not 4-byte data, displays it in the default notation.
Displays the value of the selected item in Double.
Note that when the value is not 8-byte data, displays it in the default notation.
Adds the value in hexadecimal number enclosing with "()" at the end of the value.
[[File] menu (CPU Register panel-dedicated items)]
The following items are exclusive for the [File] menu in the CPU Register panel (other items are common to all the
panels).
Note that all these items are disabled during execution of a program.
Save CPU Register Data
Overwrites the contents of this panel to the previously saved text file (*.txt)/CSV file (*.csv) (see
"(b) Saving the contents of the CPU register").
Note that when the file has never been saved or the file is write disabled, the same operation is
applied as the selection in [Save CPU Register Data As…].
Save CPU Register Data
Opens the Save As dialog box to newly save the contents of this panel to the specified text file (*.txt)/
As…
CSV file (*.csv) (see "(b) Saving the contents of the CPU register").
[[Edit] menu (CPU Register panel-dedicated items)]
The following items are exclusive for [Edit] menu in the CPU Register panel (all other items are disabled).
Cut
Deletes the selected character string and copies it to the clipboard.
This item becomes valid only when the character string is being edited.
R20UT2867EJ0100 Rev.1.00
Feb 01, 2014
Page 263 of 572
CubeSuite+ V2.02.00
Copy
APPENDIX A WINDOW REFERENCE
Copies the selected character string to the clipboard during editing.
If a line is selected, copies the register or the category to the clipboard.
The copied item can be pasted to the Watch panel.
Paste
Pasts the character string copied in the clipboard to the caret position.
This item becomes valid only when the character string is being edited.
Select All
Selects all the items of this panel.
Find…
Opens the Find and Replace dialog box with selecting the [Find in Files] tab.
Replace…
Opens the Find and Replace dialog box with selecting the [Replace in Files] tab.
[Context menu]
Register to Watch1
Copy
Registers the selected register or category to the Watch panel (Watch1).
Copies the selected character string to the clipboard during editing.
If a line is selected, copies the register or the category to the clipboard.
The copied item can be pasted to the Watch panel.
Notation
The following cascade menus to specify the notation of a data value are displayed.
AutoSelect
Displays the value of the selected item (including sub-items) in the default notation (default).
Hexadecimal
Displays the value of the selected item (including sub-items) in hexadecimal number.
Signed Decimal
Displays the value of the selected item (including sub-items) in signed decimal number.
Unsigned Decimal
Displays the value of the selected item (including sub-items) in unsigned decimal number.
Octal
Displays the value of the selected item (including sub-items) in octal number.
Binary
Displays the value of the selected item (including sub-items) in binary number.
ASCII
Displays the character string of the selected item (including sub-items) in ASCII code.
If the character size is 2 bytes and above, it is displayed with the characters for each 1 byte
arranged side-by-side.
Float
Displays the value of the selected item in Float.
Note that when the value is not 4-byte data, displays it in the default notation.
Double
Displays the value of the selected item in Double.
Note that when the value is not 8-byte data, displays it in the default notation.
Include Hexadecimal
Adds the value in hexadecimal number enclosing with "()" at the end of the value.
Value
R20UT2867EJ0100 Rev.1.00
Feb 01, 2014
Page 264 of 572
CubeSuite+ V2.02.00
APPENDIX A WINDOW REFERENCE
SFR panel
This panel is used to display the contents of the SFR and change the SFR values (see "2.9.3 Display/change the
SFR").
This panel appears only when connected to the debug tool.
Caution
The SFR that cause the microcontroller to operate when it is read is read-protected and therefore
cannot be read ("?" is displayed in the value).
To read the value of read-protected SFR, select [Force Read Value] from the context menu.
Remarks 1.
This panel can be zoomed in and out by
in the tool bar, or by moving the mouse
wheel forward or backward while holding down the [Ctrl] key.
2.
When the separator line of each area in this panel is double-clicked, the width of the area changes to
the shortest possible size that can display the contents of the area.
Figure A-28. SFR Panel
[Toolbar]
(1)
(2)
(3)
(4)
(5)
This section describes the following.
- [How to open]
- [Description of each area]
- [Toolbar]
- [[File] menu (SFR panel-dedicated items)]
- [[Edit] menu (SFR panel-dedicated items)]
- [Context menu]
[How to open]
- From the [View] menu, select [SFR].
R20UT2867EJ0100 Rev.1.00
Feb 01, 2014
Page 265 of 572
CubeSuite+ V2.02.00
APPENDIX A WINDOW REFERENCE
[Description of each area]
(1) Search area
This area is used to search for the SFR name.
Specifies the character strings to search (case-insensitive).
You can either type character strings directly from the key board (up to 512 characters), or select one
from the input history via the drop-down list (up to 10 items).
Searches up for the SFR name containing the string specified in the text box, and selects the SFR
that is found.
Searches down for the SFR name containing the string specified in the text box, and selects the SFR
that is found.
Remarks 1.
A hidden SFR name being classified with a category can be searched (the category is opened and
the SFR is selected).
2.
After typing character strings to search, to press the [Enter] key is the same function as clicking the
button, and to press the [Shift] + [Enter] key is the same function as clicking the
button.
(2) [SFR] area
The types of SFR are classified as categories (folders), and a list of the respective SFR name is displayed.
The meanings of the icons are as follows:
Indicates that the SFR name belonging to this category is displayed. When you double-click on the icon, or
click on the "-" mark, the category is closed and the SFR name is hidden.
Note that no categories exist by default. Perform Tree editing if you need a category.
Indicates that the SFR name belonging to this category is hidden. When you double-click on the icon, or
click on the "+" mark, the category is opened and the SFR name is displayed.
Note that no categories exist by default. Perform Tree editing if you need a category.
Indicates the name of the SFR.
Remark
The category names are sorted in character code order by clicking on the header part of this area (the
SFR names in the category are also similarly sorted).
This area is provided with the following functions.
(a) Tree editing
The each SFR can be categorized (by folders) and displayed in the tree view.
To create a category, Click the
button on the toolbar or select [Create Category] from the context menu
after moving the caret to a SFR name to create a category, and then input a desired name from the keyboard
(up to 1024 characters).
To delete a category, select the category then click the
button on the toolbar or select [Delete] from the
context menu. However, the categories that can be deleted are only the empty categories.
To rename the created category, select the category then do either one of the following.
- Click the name again, then directly rename the category name.
- Select the [Edit] menu >> [Rename], then directly rename the category name.
- Press the [F2] key, then directly rename the category name.
R20UT2867EJ0100 Rev.1.00
Feb 01, 2014
Page 266 of 572
CubeSuite+ V2.02.00
APPENDIX A WINDOW REFERENCE
By directly dragging and dropping the SFR in the created category, each SFR is displayed in the categorized
tree view.
Also, the display order of the categories and the SFR names (upper or lower position) can be changed easily
by drag and drop operation.
Cautions 1.
2.
Categories cannot be created within categories.
SFRs cannot be added or deleted.
(b) Registering a watch-expression
Variable names of C language, CPU registers, SFR, and assembler symbols can be registered in the Watch
panel as watch-expressions.
See "(1) Register a watch-expression" for details on how to operate it.
Remarks 1.
When you have registered a watch-expression with a category as the object, all of SFR
belonging to that category are registered as watch-expressions.
2.
A scope specification is automatically added to a registered watch-expression.
(3) [Value] area
The value of SFR is displayed and changed.
The radix of a data value can be selected by the button on the toolbar or the context menu item. In addition, a
display format adding the value in hexadecimal number constantly can also be selected as well.
The meanings of the marks and colors displayed as SFR values are as follows (character colors and background
colors depend on the configuration in the [General - Font and Color] category of the Option dialog box):
Display Example (Default)
Character color
Blue
Background color
Standard color
Character color
Brown
Background color
Cream
Description
The value of the SFR that the user is changing (press the [Enter] key to
write to the target memory).
The value of the SFR that has been changed because of the execution
of a program
To reset the highlighting, select the
button on the toolbar or [Reset
Color] from the context menu.
?
Character color
Gray
Background color
Standard color
The value of the SFR that is a read-protected objectNote
Note An SFR for which the microcontroller ends up being activated by a read operation is shown.
To read the value of read-protected SFR, select [Force Read Value] from the context menu.
Caution
The timing for acquiring the values differs in the case of a 1 byte/2 bytes SFR and that of 1 bit
SFRs that have been allocated to a 1 byte/2 bytes SFR. Owing to this, there are also cases
where the values differ even if the value of the same SFR is displayed.
Remark
The values are sorted in ascending order of the numerical values by clicking on the header part of this
area.
This area is provided with the following functions.
(a) Changing SFR values
To edit the SFR value, select the value to edit, then change the value directly from the keyboard after clicking
again on it (press the [Esc] key to cancel the edit mode).
R20UT2867EJ0100 Rev.1.00
Feb 01, 2014
Page 267 of 572
CubeSuite+ V2.02.00
APPENDIX A WINDOW REFERENCE
After you edit the value of the SFR, it is written to the register of the debug tool by pressing the [Enter] key, or
moving the focus to outside the edit region.
See "(4) Modify the SFR contents" for details on the method for changing the SFR value.
(b) Saving the contents of the SFR
The Save As dialog box can be opened by selecting the [File] menu >> [Save SFR Data As...], and all the
contents of the SFR can be saved in a text file (*.txt) or CSV file (*.csv).
See "(6) Save the SFR contents" for details on the method for saving the contents of the SFR.
(4) [Type (Byte Size)] area
The type information of each SFR is displayed in the following formats.
- <Type of SFR> [<Access attribute> <All accessible sizes>](<Size>)
Access attribute
One of the following is displayed as the access attribute.
R
Read only
W
Write only
R/W
Read/Write
All accessible sizes
All accessible sizes are demarcated by a comma and listed in order of the smallest size in bit units.
Size
The size of the SFR is displayed.
It is displayed by supplying the unit, in byte units in the event that it can be displayed in byte units,
and in bit units in the event that it can be displayed on in bit units.
Examples 1.
"The case of "SFR [R/W 1.8] (1 byte)"
An SFR that is readable/writable and 1 bit accessible/8 bit accessible, and whose size is 1 byte
2.
"The case of "SFR [R/W 1] (1 bit)"
An SFR that is readable/writable and 1 bit accessible, and whose size is 1 byte
Remark
The type information is sorted in the character code order by clicking on the header part of this area.
(5) [Address] area
The address that each SFR is mapped is displayed (hexadecimal number notation fixing).
However, in the case of the bit register, it is displayed by providing a bit offset value like the following examples.
Examples 1.
The case of "0xFF40"
This is allocated to the address "OxFF40"
2.
The case of "0xFF40.4"
This is allocated to bit 4 of the address "0xFF40.4" (bit register)
Remark
The addresses are sorted in ascending order of numerical values by clicking on the header part of this
area.
[Toolbar]
Acquires the latest data from the debug tool, and updates the contents of this panel.
Note that the values of read-protected SFR are not re-read.
This item is disabled during execution of a program.
R20UT2867EJ0100 Rev.1.00
Feb 01, 2014
Page 268 of 572
CubeSuite+ V2.02.00
APPENDIX A WINDOW REFERENCE
Resets highlighting of the selected SFR whose value has been changed by executing a program.
Note that this item is disabled during execution of a program.
Adds a new category (folder). Directly input the category name in the text box.
There are no restrictions on the number of categories that can be created anew (however, it is not possible to
create a category inside a category).
Note that this item is disabled during execution of a program.
Deletes the selected character string(s).
If an empty category is in a select state, its category is deleted (it is not possible to delete SFRs).
Notation
The following buttons to change the notation of a data value are displayed.
Displays the value of the selected item in hexadecimal number (default).
Displays the value of the selected item in signed decimal number.
Displays the value of the selected item in unsigned decimal number.
Displays the value of the selected item in octal number.
Displays the value of the selected item in binary number.
Displays the value of the selected item in ASCII code.
Adds the value in hexadecimal number enclosing with "()" at the end of the value of the selected item.
[[File] menu (SFR panel-dedicated items)]
The following items are exclusive for the [File] menu in the SFR panel (other items are common to all the panels).
Note that all these items are disabled during execution of a program.
Save SFR Data
Overwrites the contents of this panel to the previously saved text file (*.txt)/CSV file (*.csv) (see
"(b) Saving the contents of the SFR").
Note that when the file has never been saved or the file is write disabled, the same operation is
applied as the selection in [Save SFR Data As...].
Save SFR Data As...
Opens the Save As dialog box to newly save the contents of this panel to the specified text file
(*.txt)/CSV file (*.csv) (see "(b) Saving the contents of the SFR").
[[Edit] menu (SFR panel-dedicated items)]
The following items are exclusive for [Edit] menu in the SFR panel (all other items are disabled).
Cut
Deletes the selected character string(s) and copies them to the clipboard (it is not possible to cut
SFRs/categories).
Copy
Copies the contents of the selected range to the clipboard as character string(s).
If the SFR(s)/category(s) are selected, copies them to the clipboard.
The copied item can be pasted to the Watch panel.
Paste
If texts are in editing, pastes the contents of the clipboard to the caret position (it is not possible to
paste SFRs/categories).
Delete
Deletes the selected character string(s).
If an empty category is in a select state, its category is deleted (it is not possible to delete SFRs).
Select All
If texts are in editing, selects all the character strings.
If texts are not in editing, selects all the SFRs/categories.
Rename
Edits the name of the selected category.
Find...
Moves the focus to the text box in the Search area.
R20UT2867EJ0100 Rev.1.00
Feb 01, 2014
Page 269 of 572
CubeSuite+ V2.02.00
Move...
APPENDIX A WINDOW REFERENCE
Opens the Go to the Location dialog box to move the caret to the specified SFR.
[Context menu]
Register to Watch1
Registers the selected SFR or category to the Watch panel (Watch1).
Refresh
Acquires the latest data from the debug tool, and updates the contents of this panel.
Note that the values of read-protected SFR are not re-read.
This item is disabled during execution of a program.
Force Read Value
Forcibly reads once the value of the read-protected SFR.
Move...
Opens the Go to the Location dialog box.
Create Category
Adds a new category (folder). Directly input the category name in the text box.
There are no restrictions on the number of categories that can be created anew (however, it is not
possible to create a category inside a category).
Note that this item is disabled during execution of a program.
Copy
Copies the contents of the selected range to the clipboard as character string(s).
If the SFR(s)/category(s) are selected, copies them to the clipboard.
The copied item can be pasted to the Watch panel.
Delete
Deletes the selected character string(s).
If an empty category is in a select state, its category is deleted (it is not possible to delete SFRs).
Notation
The following cascade menus are displayed to specify the notation.
Hexadecimal number
Displays the value of the selected item in hexadecimal number (default).
Signed Decimal
Displays the value of the selected item in signed decimal number.
Unsigned decimal
Displays the value of the selected item in unsigned decimal number.
number
Octal
Displays the value of the selected item in octal number.
Binary
Displays the value of the selected item in binary number.
ASCII
Displays the value of the selected item in ASCII code.
Include Hexadecimal
Adds the value in hexadecimal number enclosing with "()" at the end of the value of the selected
Value
item.
Reset Color
Resets highlighting of the selected SFR whose value has been changed by executing a program.
R20UT2867EJ0100 Rev.1.00
Feb 01, 2014
Page 270 of 572
CubeSuite+ V2.02.00
APPENDIX A WINDOW REFERENCE
Local Variables panel
This panel is used to display the contents of the local variable and change the local variable values (see "2.9.5
Display/change local variables").
This panel appears only when connected to the debug tool.
Caution
Nothing is displayed on this panel during execution of a program. When the execution of a program
is stopped, items in each area are displayed.
Remarks 1.
This panel can be zoomed in and out by
in the tool bar, or by moving the mouse
wheel forward or backward while holding down the [Ctrl] key.
2.
When the separator line of each area in this panel is double-clicked, the width of the area changes to
the shortest possible size that can display the contents of the area.
Figure A-29. Local Variables Panel
[Toolbar]
(1)
(2)
(3)
(4)
(5)
This section describes the following.
- [How to open]
- [Description of each area]
- [Toolbar]
- [[File] menu (Local Variables panel-dedicated items)]
- [[Edit] menu (Local Variables panel-dedicated items)]
- [Context menu]
[How to open]
- From the [View] menu, select [Local Variable].
[Description of each area]
(1) Scope area
Select the scope of the local variable to be displayed from the following drop-down list.
R20UT2867EJ0100 Rev.1.00
Feb 01, 2014
Page 271 of 572
CubeSuite+ V2.02.00
APPENDIX A WINDOW REFERENCE
Item
Operation
Current
Displays local variables in the scope of the current PC value.
<Depth> <Function name() [file name#line
Displays local variables in the scope of the calling function.
number]>Note 1,2
After the program is executed, the scope that is selected is maintained as
long as the selected scope exists.
Notes 1.
2.
The calling functions displayed on theCall Stack panel are displayed.
When scope information that has lost its reliability, items in the list is shown in gray (the character color/
background color when showing "Invalid" depends on the configuration in the [General - Font and
Color] category of the Option dialog box).
(2) [Name] area
The local variable name or function name is displayed.
The argument of the function is also displayed as the local variable.
In addition, the hierarchical structure is displayed in tree format for arrays, pointer variables, and structures or
unions.
This area cannot be edited.
The meanings of the icons are as follows:
Indicates the variable.
Auto, Internal Static, and Register variables are also displayedNote.
In addition, the hierarchical structure is displayed in tree format for arrays, pointer variables, and structures or
unions.
If "+" mark exist at the top of the name, the next structure is expanded by clicking it (the mark changes to "-"
after the expansion).
Array
Pointer variables
All elements in the array
Variables that the pointer designates
If the pointer designates a pointer, add "+" mark and expand it by clicking the mark.
Note that if the pointer designates an unknown, "?" mark is displayed.
Structures/Unions
All the member of structures/unions
Indicates the argument.
Indicates the function.
Note When Auto variables are used to display local variables, accurate values cannot be displayed at a prologue
("{") or epilogue ("}") of a function. The Auto variable addresses are the relative addresses from the address
pointed to by the stack pointer (SP), so their addresses are not determined until the SP value is determined
in the function. The SP is manipulated via prologues or epilogues, so the accurate value cannot be
displayed.
This area is provided with the following functions.
(a) Registering watch-expression
Variable names of C language can be registered in the Watch panel as watch-expressions.
See "(1) Register a watch-expression" for details on how to operate it.
Remark
A scope specification is automatically added to a registered watch-expression.
R20UT2867EJ0100 Rev.1.00
Feb 01, 2014
Page 272 of 572
CubeSuite+ V2.02.00
APPENDIX A WINDOW REFERENCE
(b) Jump to memory
By selecting [Jump to Memory] from the context menu, the Memory panel (Memory1) opens with moving the
caret to the source line corresponding to the address where the selected local variable is disposed (if the
Memory panel (Memory1) is already open, the screen will jump to the panel).
(3) [Value] area
The value of the local variable is displayed and changed.
The notation of a data value can be selected by the button on the toolbar or the context menu item. In addition, a
display format adding the value in hexadecimal number constantly can also be selected as well.
The meanings of the marks and colors displayed as the values of the local variables are as follows (character
colors and background colors depend on the configuration in the [General - Font and Color] category of the Option
dialog box):
Display Example (Default)
Character color
Blue
Background color
Standard color
Character color
Brown
Background color
Cream
Description
The value of the local variable that the user is changing
Press the [Enter] key to write to the target memory.
The value of the local variable that have been changed because of the
execution of a programNote.
The highlighting is rest by executing again the program.
?
Character color
Gray
Background color
Standard color
The value of the local variable that could not be acquired.
Note Variables that the name stays same from the start point where the program started executing to the
breakpoint and their values are changed are the target.
This area is provided with the following functions.
(a) Changing the local variable/argument value
To edit the local variable value or the argument value, select the value to edit, then change the value directly
from the keyboard after clicking again on it (press the [Esc] key to cancel the edit mode).
After you edit the value of the local variable or the argument, it is written to the target memory of the debug tool
by pressing the [Enter] key or moving the focus to outside the edit region.
See "(2) Modify the contents of local variables" for details on the method for changing the local variable/
argument value.
(b) Saving the contents of the local variable
The Save As dialog box can be opened by selecting the [File] menu >> [Save Local Variables Data As...], and
all the contents of this panel can be saved in a text file (*.txt) or CSV file (*.csv).
See "(3) Save the contents of local variables" for details on the method for saving the contents of the local
variable.
(4) [Type (Byte Size)] area
The type name of the local variable is displayed. The notation accords with the description of C language.
For an array, an element number is displayed in "[]". For a function, its size (number of bytes) is displayed in "()".
This area cannot be edited.
R20UT2867EJ0100 Rev.1.00
Feb 01, 2014
Page 273 of 572
CubeSuite+ V2.02.00
APPENDIX A WINDOW REFERENCE
(5) [Address] area
The address of the local variable is displayed. When a variable is assigned to the register, the name of the register
is displayed.
This area cannot be edited.
[Toolbar]
These buttons below are disabled during execution of a program.
Acquires the latest data from the debug tool, and updates the contents of this panel.
Notation
The following buttons to specify the notation of values are displayed.
Displays values on this panel in the default notation according to the type of variable (default).
Displays values on this panel in hexadecimal number.
Displays values on this panel in decimal number.
Displays values on this panel in octal number.
Displays values on this panel in binary number.
Displays array indexes on this panel in decimal number (default).
Displays array indexes on this panel in hexadecimal number.
Displays values on this panel in Float.
Note that when the value is not 4-byte data, or has the type information, displays it in the default notation.
Displays values on this panel in Double.
Note that when the value is not 4-byte data, or has the type information, displays it in the default notation.
Adds the value in hexadecimal number enclosing with "()" at the end of the value.
Encoding
The following buttons to specify the encoding of character variables are displayed.
Displays character variables in ASCII code (default).
Displays character variables in Shift_JIS code.
Displays character variables in EUC-JP code.
Displays character variables in UTF-8 code.
Displays character variables in UTF-16 code.
[[File] menu (Local Variables panel-dedicated items)]
The following items are exclusive for the [File] menu in the Local Variables panel (other items are common to all the
panels).
Note that all these items are disabled during execution of a program.
Save Local Variables
Overwrites the contents of this panel to the previously saved text file (*.txt)/CSV file (*.csv) (see
Data
"(b) Saving the contents of the local variable").
Note that when the file has never been saved or the file is write disabled, the same operation is
applied as the selection in [Save Local Variables Data As...].
Save Local Variables
Opens the Save As dialog box to newly save the contents of this panel to the specified text file
Data As...
(*.txt)/CSV file (*.csv) (see "(b) Saving the contents of the local variable").
[[Edit] menu (Local Variables panel-dedicated items)]
The following items are exclusive for [Edit] menu in the Local Variables panel (all other items are disabled).
R20UT2867EJ0100 Rev.1.00
Feb 01, 2014
Page 274 of 572
CubeSuite+ V2.02.00
APPENDIX A WINDOW REFERENCE
Copy
Copies the contents of the selected line or the character string to the clipboard.
Select All
Selects all the items of this panel.
Rename
Changes to the edit mode to edit the selected local variable value (see "(2) Modify the contents of
local variables").
This item is disabled during execution of a program.
Find...
Opens the Find and Replace dialog box with selecting the [Find in Files] tab.
Replace...
Opens the Find and Replace dialog box with selecting the [Replace in Files] tab.
[Context menu]
Register to Watch1
Registers the selected local variable to the Watch panel (Watch1).
Copy
Copies the contents of the selected line or the character string to the clipboard.
Notation
The following cascade menus to specify the notation of values are displayed.
AutoSelect
Displays values on this panel in the default notation according to the type of variable (default).
Hexadecimal
Displays values on this panel in hexadecimal number.
Decimal
Displays values on this panel in decimal number.
Octal
Displays values on this panel in octal number.
Binary
Displays values on this panel in binary number.
Decimal Notation for
Displays array indexes on this panel in decimal number (default).
Array Index
Hexadecimal Notation
Displays array indexes on this panel in hexadecimal number.
for Array Index
Float
Displays values on this panel in Float.
Note that when the value is not 4-byte data, or has the type information, displays it in the default
notation.
Double
Displays values on this panel in Double.
Note that when the value is not 4-byte data, or has the type information, displays it in the default
notation.
Include Hexadecimal
Adds the value in hexadecimal number enclosing with "()" at the end of the value.
Value
Encoding
The following cascade menus to specify the encoding of character variables are displayed.
ASCII
Displays character variables in ASCII code (default).
Shift_JIS
Displays character variables in Shift_JIS code.
EUC-JP
Displays character variables in EUC-JP code.
UTF-8
Displays character variables in UTF-8 code.
UTF-16
Displays character variables in UTF-16 code.
Jump to Memory
Opens the Memory panel (Memory1) and jumps to the memory value corresponding to the
address of the selected line in this panel.
R20UT2867EJ0100 Rev.1.00
Feb 01, 2014
Page 275 of 572
CubeSuite+ V2.02.00
APPENDIX A WINDOW REFERENCE
Watch panel
This panel is used to display the contents of the registered watch-expressions and change their values (see "2.9.6
Display/change watch-expressions").
Up to a maximum of four of these panels can be opened. Each panel is identified by the names "Watch1", "Watch2",
"Watch3", and "Watch4" on the titlebar, and the watch-expressions can be registered/deleted/moved individually.
Watch-expressions can be registered in this panel as well as in the Editor panel, Disassemble panel, Memory panel,
CPU Register panel, Local Variables panel or SFR panel.
When the panel is closed with registered watch-expressions, the panel closes but the information on the registered
watch-expressions is retained. Therefore, if the same panel is opened again, it is opened with the watch-expressions
registered.
The display contents are automatically updated when the value of the watch-expression changes after a program is
executed (when the execution is done in steps, the display is updated after each step).
In addition, by enabling the Real-time display update function, it is also possible to update the display contents in realtime even while a program is being executed.
This panel appears only when connected to the debug tool.
Remarks 1.
This panel can be zoomed in and out by
in the tool bar, or by moving the mouse
wheel forward or backward while holding down the [Ctrl] key.
2.
When the separator line of each area in this panel is double-clicked, the width of the area changes to
the shortest possible size that can display the contents of the area.
Figure A-30. Watch Panel
[Toolbar]
(1)
(2)
(3)
(4)
(5)
This section describes the following.
- [How to open]
- [Description of each area]
- [Toolbar]
- [[File] menu (Watch panel-dedicated items)]
- [[Edit] menu (Watch panel-dedicated items)]
- [Context menu]
[How to open]
- From the [View] menu, select [Watch] >> [Watch1 - 4].
R20UT2867EJ0100 Rev.1.00
Feb 01, 2014
Page 276 of 572
CubeSuite+ V2.02.00
APPENDIX A WINDOW REFERENCE
[Description of each area]
(1) [Watch] area
All the registered watch-expressions are displayed in a list.
Clicking the title of the list in this area sorts the watch-expressions in the list in alphabetical order.
Categories (folders) can be created to categorize the watch-expressions and display them in the tree view (see "(a)
Tree editing").
The meanings of the icons are as follows:
Indicates that the watch-expression belonging to this category is displayed. When you double-click on
the icon, or click on the "-" mark, the category is closed and the watch-expression is hidden.
Indicates that the watch-expression belonging to this category is hidden. When you double-click on the
icon, or click on the "+" mark, the category is opened and the watch-expression is displayed.
Indicates that the watch-expression is a variable.
At the top of the watch-expression represents arrays, pointer type variables, and structures/unions, "+"/"" mark is displayed. Click the mark to Expand/shrink display.
Indicates that the watch-expression is a function.
Indicates that the watch-expression is an immediate value.
Indicates that the watch-expression is an expression.
Indicates that the watch-expression is SFR.
Indicates that the watch-expression is CPU register.
At the top of the watch-expression that has the lower level register (part of the register), "+"/"-" mark is
displayed. Click the mark to Expand/shrink display.
This area is provided with the following functions.
(a) Tree editing
Watch-expressions can be categorized (by folders) and displayed in the tree view.
To create a category, click the
button on the toolbar or select [Create Category] from the context menu
after moving the caret to the position to create a category, and then input a desired name from the keyboard.
To delete a category, select the category then click the
button on the toolbar or select [Delete] from the
context menu.
To rename the created category, select the category then do either one of the following.
- Click the name again, then directly rename the category name.
- Select the [Edit] menu >> [Rename], then directly rename the category name.
- Press the [F2] key, then directly rename the category name.
By directly dragging and dropping the registered watch-expression in the created category, each category is
displayed in the categorized tree view.
Also, the display order of the categories and the watch-expressions (upper or lower position) can be changed
easily by drag and drop operation.
Cautions 1.
2.
Categories cannot be created within categories.
Up to 64 categories can be created in one watch panel (if this restriction is violated, a
message appears).
Remark
Drag and drop the watch-expressions/categories in other watch panel (Watch1 to Watch4) to copy
them.
R20UT2867EJ0100 Rev.1.00
Feb 01, 2014
Page 277 of 572
CubeSuite+ V2.02.00
APPENDIX A WINDOW REFERENCE
(b) Expand/shrink display
At the top of the watch-expression represents arrays, pointer type variables, structures/unions, and registers
(with the name of the part), "+"/"-" mark is displayed. Click the mark to expand the contents ("+" mark is
changed to "-" after the expansion).
Watch-Expression
Array
Contents When Expanded
All elements in the array
Select [Encoding] >> [ASCII] from the context menu to display the value as a string (up to
256 characters). Note, however, that any characters that cannot be displayed in the
encoding will be shown as periods "." or "?".
Pointer type variable
Variables that the pointer designates
Structure/Union
All the member of structure/union
Register
Name of the bit/bit string that constructs register
Example) AX register
A register
X register
(c) Registering new watch-expression
There are three ways as follows to register new watch-expressions.
<1> Register from other panels
Do either one of the following to register watch-expressions in other panels.
- Drag and drop the target character string onto this area in the desired watch panel (Watch1 to
Watch4).
- Select [Register to Watch1] from the context menu after selecting the target character string or place
the caret on either of the target character string (the target is automatically determined).
- Select the [Edit] menu >> [Paste] in this area in the desired watch panel (Watch1 to Watch4) after
selecting the [Edit] menu >> [Copy] for the target character string.
The relationship between panels that can use this operation and targets that can be registered as watchexpressions is as follows:
Table A-4. Relationship between Panels and Targets That Can be Registered as Watch-Expressions
Panel Name
Editor panel
Targets That can be Registered as Watch-Expressions
Variable names of C language, CPU registers, SFR, and
assembler symbols
Disassemble panel
Variable names of C language, CPU registers, SFR, and
assembler symbols
CPU Register panel
CPU registersNote
Local Variables panel
Variable names of C language (local variables)
SFR panel
SFRNote
Note The scope-specification is automatically added to the registered watch-expression.
R20UT2867EJ0100 Rev.1.00
Feb 01, 2014
Page 278 of 572
CubeSuite+ V2.02.00
APPENDIX A WINDOW REFERENCE
<2> Directly register in the Watch panel
Click the
button on the toolbar or select [Add New Watch] from the context menu in the desired
watch panel (Watch1 to Watch4) to display an entry box for a new watch-expression in the bottom of this
area.
Directly input a watch-expression from the keyboard in the [Watch] area in the entry box then press the
[Enter] key.
The input format of the watch-expression is as follows:
Table A-5. Input Format of Watch-Expression
Watch-Expression
Value to Display
Variable name of C language
Value of C language variable
Watch-expression[Watch-expression]
Element of array
Watch-expression Member name
Member of structures/unions
Watch-expression -> Member name
Member of structures/unions that pointer
designates
*Watch-Expression
Value of pointer variable
CPU register name
Value of the CPU register
SFR name
SFR value
Label, EQU symbol and immediate
Values of label, EQU symbol and immediate
address
address
Bit symbol
Bit symbol value
Watch-expressions can be registered with specifying the scope. The scope specifications with watchexpression registration are as follows:
Table A-6. Scope Specification of C language Used with Watch-Expression Registration
Scope Specification
Load Module
Source File
Function
File Name
Name
Name
Variable Name
prog$file#func#var
prog
file
func
var
prog$file#var
prog
file
global
var
prog$var
prog
global
global
var
file#func#var
current
file
func
var
file#var
current
file
global
var
var
current
current
current
var
Table A-7. Scope Specification of CPU Register with Watch-Expression Registration
Scope Specification
Register Bank
Name of CPU Register
AX:RB0
Register bank 0
AX
AX:REG
Current register bank
AX
R20UT2867EJ0100 Rev.1.00
Feb 01, 2014
Page 279 of 572
CubeSuite+ V2.02.00
APPENDIX A WINDOW REFERENCE
Table A-8. Scope Specification of SFR with Watch-Expression Registration
Scope Specification
Name of SFR
P0:SFR
P0
P0
P0
Remarks 1.
A symbol name at the current caret position can be complemented by pressing the [Ctrl]
+ [Space] key in this area (see "2.19.2 Symbol name completion function").
2.
An immediate value is treated as an address. Note, however, that an immediate value
with operators cannot be used.
3.
An arithmetic expression with symbols cannot be used for a watch-expression.
4.
If the same name exists either in C language variables, CPU registers or SFRs, and it is
registered without specifying scopes, then its value will be displayed after the symbol is
determined in the following order.
Variable of C language > CPU registers > SFR
If "$" is specified at the top of a watch-expression, then its value will be displayed after
the symbol is determined in the following order.
CPU registers > SFR > Variable of C language
5.
If a local variable and a global variable exist with the same name, and its symbol name is
registered without specifying scopes, then its value will be displayed after the symbol is
determined based on the scope of the current PC value.
6.
When watch-expressions are registered from the SFR panel or the CPU Register panel,
the scope specification is automatically added.
7.
When only "AX" is specified as a watch-expression, the value of the AX register in the
current register bank is displayed.
<3> Register from other application
Select a character string of a variable of C language, CPU register, SFR or assembler symbol from a
external editor then do either one of the following.
- Drag and drop the target character string in this area in the desired watch panel (Watch1 to
Watch4).
- Select the [Edit] menu >> [Paste] in this area in the desired watch panel (Watch1 to Watch4) after
copying the target character string.
Caution
Up to 128 watch-expressions can be registered in one watch panel (if this restriction is
violated, a message appears).
Remarks 1.
Each watch-expression registered in each watch panel (Watch1 to Watch4) is managed in
each panel and saved as the user information of the project.
2.
More than one watch-expression with the same name can be registered.
3.
You can export registered watch-expressions to a file and import it so that the watchexpressions can be re-registered (see "(8) Export/import watch-expressions").
(d) Editing watch-expression
To edit the registered watch-expression, double-click the watch-expression to be edited to change the watchexpression to edit mode then directly edit from the keyboard (press the [Esc] key to cancel the edit mode).
After editing the watch-expression, press the [Enter] key to complete the editing.
R20UT2867EJ0100 Rev.1.00
Feb 01, 2014
Page 280 of 572
CubeSuite+ V2.02.00
APPENDIX A WINDOW REFERENCE
(e) Deleting watch-expression
To delete the registered watch-expression, select the watch-expression(s) to be deleted then click the
button on the toolbar or select [Delete] from the context menu.
(f) Setting of various events
Various events can be set to the selected watch-expression by selecting [Access Break] or [Trace Output]
from the context menu.
If an access event is set, the mark of the watch-expression is changed (the event mark of a break event is
displayed under the icon of the watch-expression in layers).
When an event is set, the detailed information about the set event is reflected in the Events panel.
Note that events are only set to the watch-expressions that are global variables, static variables inside
functions, or file-internal static variables.
See the following for details on how to set events.
- "2.8.5 Stop the program with the access to variables/SFRs"
- "2.11.4 Collect execution history only when the condition is met [IECUBE][Simulator]"
(g) Jump to the address with memory definition
By selecting [Jump to Memory] from the context menu, the Memory panel (Memory1) opens with moving the
caret to the address in which the selected watch-expression is defined (if the Memory panel (Memory1) is
already open, the screen will jump to the panel).
Note that this operation is disabled when more than one watch-expression is selected at the same time or the
CPU register/SFR is selected.
(2) [Value] area
The value of the registered watch-expression is displayed and changed (if the watch-expression is a function
pointer, the function name is displayed in this area).
Notations and encodes can be selected by the button on the toolbar or the context menu item. In addition, a
display format adding the value in hexadecimal number constantly can also be selected as well.
The default display format of the values is automatically decided depending on the type of the watch-expression.
Table A-9. Display Format of Watch-Expressions (Default)
Type of Watch-Expression
Display Format
char, signed char, unsigned char
ASCII code with hexadecimal number
short, signed short, short int, signed short int, int, signed,
Signed decimal number with hexadecimal number
signed int, long, signed long, long int, signed long int
unsigned short, unsigned short int, unsigned, unsigned
Unsigned decimal number with hexadecimal number
int, unsigned long, unsigned long int
float
Float (when the size is 4-byte) with hexadecimal number
double, long double
Double (when the size is 8-byte) with hexadecimal
number
Pointers to char, signed char, unsigned char
Characters
Encoding: ASCII
Pointers to other than char, signed char, unsigned char
Hexadecimal number
Arrays of char, signed char, unsigned char types
Characters
Encoding: ASCII
bit, boolean, _boolean
Unsigned decimal number with hexadecimal number
Enumeration type
Enumeration constant value with hexadecimal number
R20UT2867EJ0100 Rev.1.00
Feb 01, 2014
Page 281 of 572
CubeSuite+ V2.02.00
APPENDIX A WINDOW REFERENCE
Type of Watch-Expression
Display Format
Label, address of immediate value, EQU symbol
Signed decimal number with hexadecimal number
bit symbol
Unsigned decimal number with hexadecimal number
Others
Hexadecimal number
The meanings of the marks and colors displayed as the values of watch-expressions are as follows (character
colors and background colors depend on the configuration in the [General - Font and Color] category of the Option
dialog box):
Display Example (Default)
Character color
Blue
Background color
Standard color
Character color
Pink
Background color
Standard color
Character color
Brown
Background color
Cream
Description
The value of the watch-expression that the user is changing
Press the [Enter] key to write to the target memory.
The value of the watch-expression that is displayed with the Real-time
display update function
The value of the watch-expression that has been changed because of
the execution of a program
To reset the highlighting, select the
button on the toolbar or [Reset
Color] from the context menu.
?
Character color
Background color
Remarks 1.
Gray
Standard color
Variable that does not exist is registered as a watch-expression or the
value of the watch-expression cannot be retrieved (variable is out of the
scope)
The SFR that cause the microcontroller to operate when it is read is read-protected and therefore
cannot be read. To read the value of read-protected SFR, select [Force Read Value] from the
context menu.
2.
Each watch-expression acquires the value in the order it was registered.
As the timing to acquire a value is different, the values displayed may be different if the same SFR
is registered more than once.
3.
When a hexadecimal value is also given, then values in the specified notation and hexadecimal
values are read separately. For this reason, the values with the specified notion and the
hexadecimal values may differ due to the time lag between being read.
This area is provided with the following functions.
(a) Real-time display update function
Using the real-time display update function allows you to display/modify the value of the watch-expression not
only while the program is stopped, but also in execution.
See "(4) Display/modify the memory contents during program execution" for details on the real-time display
update function.
(b) Changing values of watch-expressions
To edit the value of the watch-expression, change the value directly from the keyboard after double-clicking on
the value to be edited (press the [Esc] key to cancel the edit mode).
After you edit the value of the watch-expression, it is written to the target memory of the debug tool by pressing
the [Enter] key, or moving the focus to outside the edit region.
See "(6) Modify the contents of watch-expressions" for detail on how to change values of watch-expressions.
R20UT2867EJ0100 Rev.1.00
Feb 01, 2014
Page 282 of 572
CubeSuite+ V2.02.00
APPENDIX A WINDOW REFERENCE
(c) Saving the contents of watch-expressions
By selecting the [File] menu >> [Save Watch Data As...], the Save As dialog box can be opened, and all the
contents of this panel can be saved in a text file (*.txt) or CSV file (*.csv).
See "(9) Save the contents of watch-expressions" for details on the method for saving the contents of watchexpressions.
(3) [Type (Byte Size)] area
The type information of watch-expressions with the following format is displayed.
Watch-Expression
Display Format
Single CPU register
<Types of CPU register> (<SizeNote 1>)
Single SFR
<SFR type> (<Access attribute> <Access type><SizeNote 1>)
Access attribute
R:
Read only
W:
Write only
R/W: Read/Write only
Access type
1:
Bit accessible
8:
Byte accessible
16:
Word accessible
Unknown
?
Others
<Watch-expression type that follow the C compiler's determinationNote 2> (<SizeNote 1>)
Notes 1.
The size of the watch-expression is displayed in bytes.
However, for bit SFR or C language bit field, the size is displayed in bits and "bits" is added to the end
of the number.
2.
Types to be treated are displayed when compiling the watch-expression.
(4) [Address] area
The address that each watch-expression is mapped is displayed (hexadecimal number notation fixing).
If the watch-expression is single CPU register or is unknown, "-" or "?" is displayed instead.
Remark
When the watch-expression is the bit SFR, the bit-offset value is also displayed.
Example When the bit register is allocated to bit 4 of the address "0xFF40"
Display example:0xFF40.4
(5) [Memo] area
The user can write comments for the watch-expressions/categories.
Each comment for a watch-expression/category written in this area is saved individually as the user information of
the project. Therefore, when any of the watch-expression/category is deleted, the comment corresponding to it is
also deleted.
Note that when arrays or register are displayed expanded, the comment cannot be input for each element.
To edit the comment, input the character strings directly from the keyboard after double-clicking on the item to be
edited (press the [Esc] key to cancel the edit mode).
Up to 256 character strings can be input (line feed code is ignored).
After editing the character strings, complete the editing by pressing the [Enter] key or moving the focus to outside
the edit region.
R20UT2867EJ0100 Rev.1.00
Feb 01, 2014
Page 283 of 572
CubeSuite+ V2.02.00
APPENDIX A WINDOW REFERENCE
[Toolbar]
Reacquires all the values of the registered watch-expression and updates the display.
Note that read-protected SFR values are not re-read.
Resets highlighting of the selected watch-expression whose value has been changed by executing a
program.
This item is disabled during execution of a program.
Registers a new watch-expression.
Directly input the watch-expression in the text box (see "(c) Registering new watch-expression")
Note that up to 128 watch-expressions can be registered in one watch panel.
Adds a new category (folder).
Directly input the category name in the text box.
Note that up to 64 categories can be created in one watch panel (categories cannot be created in categories).
Deletes the selected character string(s).
If the watch-expression(s)/category(s) are selected, deletes them (except when the expanded item of the
watch-expression is selected).
Notation
The following buttons to change the notation of a data value are displayed.
Displays the value of the selected watch-expression in the default notation (see "Table A-9. Display Format
of Watch-Expressions (Default)") according to the type of variable (default).
Displays the value of the selected item in hexadecimal number.
Displays the value of the selected item in signed decimal number.
Displays the value of the selected item in unsigned decimal number.
Displays the value of the selected item in octal number.
Displays the value of the selected item in binary number.
Displays the value of the selected item in ASCII code.
Displays the value of the selected item in Float.
Note that this item becomes valid only when the selected watch-expression value is 4-byte data.
Displays the value of the selected item in Double.
Note that this item becomes valid only when the selected watch-expression value is 8-byte data.
Adds the value in hexadecimal number enclosing with "()" at the end of the value of the selected item (except
the item displayed in hexadecimal number).
[[File] menu (Watch panel-dedicated items)]
The following items are exclusive for the [File] menu in the Watch panel (other items are common to all the panels).
Note that all these items are disabled during execution of a program.
Save Watch Data
Overwrites the contents of this panel to the previously saved text file (*.txt)/CSV file (*.csv) (see
"(c) Saving the contents of watch-expressions").
Note that when the file has never been saved or the file is write disabled, the same operation is
applied as the selection in [Save Watch Data As...].
Save Watch Data As...
Opens the Save As dialog box to newly save the contents of this panel to the specified text file
(*.txt)/CSV file (*.csv) (see "(c) Saving the contents of watch-expressions").
R20UT2867EJ0100 Rev.1.00
Feb 01, 2014
Page 284 of 572
CubeSuite+ V2.02.00
APPENDIX A WINDOW REFERENCE
[[Edit] menu (Watch panel-dedicated items)]
The following items are exclusive for [Edit] menu in the Watch panel (all other items are disabled).
Cut
Deletes the selected character string(s) and copies them to the clipboard.
If the watch-expression(s)/category(s) are selected, deletes them (except when the expanded item
of the watch-expression is selected).
Copy
Copies the contents of the selected range to the clipboard as character string(s).
If the watch-expression(s)/category(s) are selected, copies them to the clipboard (except when the
expanded item of the watch-expression is selected).
Paste
If texts are in editing, pastes the contents of the clipboard to the caret position.
If texts are not in editing and the watch-expression(s) are copied in the clipboard, registers them to
the caret position.
Delete
Deletes the selected character string(s).
If the watch-expression(s)/category(s) are selected, deletes them (except when the expanded item
of the watch-expression is selected).
Select All
If texts are in editing, selects all the character strings.
If texts are not in editing, selects all the watch-expressions/categories.
Rename
Renames the selected watch-expression/category.
Find...
Opens the Find and Replace dialog box with selecting the [Find in Files] tab.
Replace...
Opens the Find and Replace dialog box with selecting the [Replace in Files] tab.
[Context menu]
Access Break
This item becomes valid only when the selected watch-expression is the global variable, the static
variable inside functions, the file-internal static variable, or SFR.
The following cascade menus are displayed to set the access break event (see "(1) Set a break
event (access type)").
Set Read Break to
Sets a break event with read access condition to the selected watch-expression.
Set Write Break to
Sets a break event with write access condition to the selected watch-expression.
Set R/W Break to
Sets a break event with read/write access condition to the selected watch-expression.
Set Read Combination
Sets a break event with read access condition to the selected watch-expressionNote.
Break to
[E1][E20]
Set Write Combination
Sets a break event with write access condition to the selected watch-expressionNote.
Break to
[E1][E20]
Set R/W Combination
Sets a break event with read/write access condition to the selected watch-expressionNote.
Break to
[E1][E20]
Trace Output
This item becomes valid only when the selected watch-expression is a global variable, static
[IECUBE][Simulator]
variable inside functions, file-internal static variable, or SFR.
The following cascade menus are displayed to set the trace-related event (see "(1) Set a Point
Trace event" or "(1) Set a Trace event").
R20UT2867EJ0100 Rev.1.00
Feb 01, 2014
Page 285 of 572
CubeSuite+ V2.02.00
Record Reading Value
APPENDIX A WINDOW REFERENCE
Sets a Point Trace event to record the values in the trace memory when the selected watchexpression is accessed for read.
Record Writing Value
Sets a Point Trace event to record the values in the trace memory when the selected watchexpression is accessed for write.
Record R/W Value
Sets a Point Trace event to record the values in the trace memory when the selected watchexpression is accessed for read/write.
Record Start R/W Value
Sets a trace start event to start collecting the trace data when the selected watch-expression is
[E1][E20]
accessed for read/write.
Record End R/W Value
Sets a trace end event to stop collecting the trace data when the selected watch-expression is
[E1][E20]
accessed for read/write.
Trace
Opens the Trace panel and displays the acquired trace data.
Periodic Updating
The following cascade menus are displayed to set for the real-time display update function (see
"(a) Real-time display update function").
Periodic Updating
Opens the Property panel to set for the real-time display update function.
Options
Refresh
Reacquires all the values of the registered watch-expression and updates the display.
Note that the values of read-protected SFR are not re-read.
Force Read Value
Forcibly reads once the values of the read-protected SFR.
This item is disabled during execution of a program.
Add New Watch
Registers a new watch-expression. Directly input the watch-expression in the text box (see "(c)
Registering new watch-expression")
Note that up to 128 watch-expressions can be registered in one watch panel.
Create Category
Adds a new category (folder). Directly input the category name in the text box.
Note that up to 64 categories can be created in one watch panel (categories cannot be created in
categories).
Delete
Deletes the selected character string(s).
If the watch-expression(s)/category(s) are selected, deletes them (except when the expanded item
of the watch-expression is selected).
Cut
Deletes the selected character string(s) and copies them to the clipboard.
If the watch-expression(s)/category(s) are selected, deletes them (except when the expanded item
of the watch-expression is selected).
Copy
Copies the contents of the selected range to the clipboard as character string(s).
If the watch-expression(s)/category(s) are selected, copies them to the clipboard (except when the
expanded item of the watch-expression is selected).
Paste
If texts are in editing, pastes the contents of the clipboard to the caret position.
If texts are not in editing and the watch-expression(s) are copied in the clipboard, registers them to
the caret position.
Rename
Renames the selected watch-expression/category.
Import Watch
Opens the Open Watch Expression Data File dialog box to import watch-expressions (see "(8)
Expression...
Export/import watch-expressions").
Notation
The following cascade menus are displayed to specify the notation.
R20UT2867EJ0100 Rev.1.00
Feb 01, 2014
Page 286 of 572
CubeSuite+ V2.02.00
AutoSelect
APPENDIX A WINDOW REFERENCE
Displays the value of the selected watch-expression in the default notation (see "Table A-9.
Display Format of Watch-Expressions (Default)") according to the type of variable (default).
Hexadecimal number
Displays the value of the selected item in hexadecimal number.
Signed Decimal
Displays the value of the selected item in signed decimal number.
Unsigned decimal
Displays the value of the selected item in unsigned decimal number.
number
Octal
Displays the value of the selected item in octal number.
Binary
Displays the value of the selected item in binary number.
ASCII
Displays the value of the selected item in ASCII code.
Include Hexadecimal
Adds the value in hexadecimal number enclosing with "()" at the end of the value of the selected
Value
item (except the item displayed in hexadecimal number).
Float
Displays the value of the selected item in Float.
Note that when the selected watch-expression value is not 4-byte data, or has the type
information, displays it in the default notation (see "Table A-9. Display Format of WatchExpressions (Default)").
Double
Displays the value of the selected item in Double.
Note that when the selected watch-expression value is not 8-byte data, or has the type
information, displays it in the default notation (see "Table A-9. Display Format of WatchExpressions (Default)").
Decimal Notation for
Displays array indexes on this panel in decimal number (default).
Array Index
Hexadecimal Notation
Displays array indexes on this panel in hexadecimal number.
for Array Index
Encoding
The following cascade menus are displayed to specify the character code.
ASCII
Displays the value of the selected item in ASCII code (default).
Shift_JIS
Displays the value of the selected item in Shift_JIS code.
EUC-JP
Displays the value of the selected item in EUC-JP code.
UTF-8
Displays the value of the selected item in UTF-8 code.
UTF-16
Displays the value of the selected item in UTF-16 code.
Size Notation
The following cascade menus are displayed to specify the size notation.
1 Bytes
Displays the value of the selected item as 8-bit data.
2 Bytes
Displays the value of the selected item as 16-bit data.
4 Bytes
Displays the value of the selected item as 32-bit data.
8 Bytes
Displays the value of the selected item as 64-bit data.
Jump to Memory
Opens the Memory panel (Memory1) and jumps to the address which the selected watchexpression is defined (see "(g) Jump to the address with memory definition").
Reset Color
Resets highlighting of the selected watch-expression whose value has been changed by executing
a program.
This item is disabled during execution of a program.
Caution
[E1][E20]
This item is displayed only when the selected microcontroller supports combination break events.
R20UT2867EJ0100 Rev.1.00
Feb 01, 2014
Page 287 of 572
CubeSuite+ V2.02.00
APPENDIX A WINDOW REFERENCE
Call Stack panel
This panel is used to display the call stack information for the function call (see "2.10.1 Display call stack information").
This panel appears only when connected to the debug tool.
Cautions 1.
Nothing is displayed on this panel during execution of a program.
When the program is stopped, items in each area are displayed.
2.
Except for [Simulator]
If step execution is performed in source level, CubeSuite+ determines whether an interrupt is
being processed via the NP, EP, and ID flags in the PSW register. For this reason, if the above
register or flags are changed (e.g. when using multiple interrupts), then call stack information
may be incorrect.
Remark
This panel can be zoomed in and out by
in the tool bar, or by moving the mouse wheel
forward or backward while holding down the [Ctrl] key.
Figure A-31. Call Stack Panel
[Toolbar]
(1)
(2)
This section describes the following.
- [How to open]
- [Description of each area]
- [Toolbar]
- [[File] menu (Call Stack panel-dedicated items)]
- [[Edit] menu (Call Stack panel-dedicated items)]
- [Context menu]
[How to open]
- From the [View] menu, select [Call Stack].
[Description of each area]
(1) [Depth] area
The depth of the call is displayed.
R20UT2867EJ0100 Rev.1.00
Feb 01, 2014
Page 288 of 572
CubeSuite+ V2.02.00
APPENDIX A WINDOW REFERENCE
The line at the current PC position becomes 0 and incremented numbers from 1 is added to the calling function in
the order.
(2) [Call Stack] area
The current source position and the call stack information pushed on the stack (position of the calling function and
arguments of a each function, etc.) are displayed.
The display format in this area differs depending on the selection condition of the
/
button on the toolbar,
or of [Show Parameter]/[Show Module File Name] from the context menu.
Condition
Display Format
- Display arguments
<Function>(<Argument>=<Argument ValueNote>, ...)[<Module file name>$<File
- Display module file name
name>#<Line number>] (default)
- Display arguments
<Function>(<Argument>=<Argument valueNote>, ...)[<File Name>#<Line number>]
- Do not display module file name
- Do not display arguments
<Function>()[<Module file name>$<File name>#<Line number>]
- Display module file name
- Do not display arguments
<Function>()[<File name>#<Line number>]
- Do not display module file name
Note When the argument value is character string, up to 20 characters can be displayed.
Remarks 1.
When the stack data older than the one that has lost the reliability is acquired, the line including
that information is shown in gray (the character color/background color when showing "Invalid"
depends on the configuration in the [General - Font and Color] category of the Option dialog box).
2.
Array arguments are passed as pointers rather than arrays (C language specification). For this
reason, if the argument is an array, it is displayed as a pointer.
This area is provided with the following functions.
(a) Jump to the source line/disassemble line
By selecting [Jump to Source] from the context menu, the Editor panel is opened with moving the caret to the
source line corresponding to the calling function at the current caret position (if the Editor panel is already
open, the screen will jump to the panel).
In addition, similarly by selecting [Jump to Disassemble], the Disassemble panel (Disasemmble1) is opened
with moving the caret to the address corresponding to the calling function at the current caret position (if the
Disassemble panel is already open, the screen will jump to the panel (Disassemble1)).
Remark
It is possible to jump to the target source line by double-clicking on that line as well.
(b) Display of local variables
By selecting [Jump to Local Variable at This Time] from the context menu, the Local Variables panel is opened
to display the local variables indicated by the currently selected line.
(c) Saving the contents of call stack information
By selecting the [File] menu >> [Save Call Stack Data As...], the Save As dialog box can be opened, and all the
contents of this panel can be saved in a text file (*.txt) or CSV file (*.csv).
See "(4) Save the contents of call stack information" for details on the method for saving the contents of call
stack information.
R20UT2867EJ0100 Rev.1.00
Feb 01, 2014
Page 289 of 572
CubeSuite+ V2.02.00
APPENDIX A WINDOW REFERENCE
[Toolbar]
The buttons below are disabled during execution of a program.
Acquires the latest data from the debug tool, and updates the contents of this panel.
Notation
The following buttons to specify the notation of values are displayed.
Displays values on this panel in the default notation according to the type of variable (default).
Displays values on this panel in hexadecimal number.
Displays values on this panel in decimal number.
Displays values on this panel in octal number.
Displays values on this panel in binary number.
Encoding
The following buttons to specify the encoding of character variables are displayed.
Displays character variables in ASCII code (default).
Displays character variables in Shift_JIS code.
Displays character variables in EUC-JP code.
Displays character variables in UTF-8 code.
Displays character variables in UTF-16 code.
Displays the call stack information with the module file name (default).
Displays the call stack information with the parameters (arguments) of the function call (default).
[[File] menu (Call Stack panel-dedicated items)]
The following items are exclusive for the [File] menu in the Call Stack panel (other items are common to all the panels).
Note that all these items are disabled during execution of a program.
Save Call Stack Data
Overwrites the contents of this panel to the previously saved text file (*.txt)/CSV file (*.csv) (see
"(c) Saving the contents of call stack information").
Note that when the file has never been saved or the file is write disabled, the same operation is
applied as the selection in [Save Call Stack Data As...].
Save Call Stack Data As...
Opens the Save As dialog box to newly save the contents of this panel to the specified text file
(*.txt)/CSV file (*.csv) (see "(c) Saving the contents of call stack information").
[[Edit] menu (Call Stack panel-dedicated items)]
The following items are exclusive for [Edit] menu in the Call Stack panel (all other items are disabled).
Copy
Copies the contents of the selected line to the clipboard.
Select All
Selects all the items of this panel.
Find...
Opens the Find and Replace dialog box with selecting the [Find in Files] tab.
Replace...
Opens the Find and Replace dialog box with selecting the [Replace in Files] tab.
[Context menu]
Copy
Copies the contents of the selected line to the clipboard.
Show Module File Name
Displays the call stack information with the module file name (default).
R20UT2867EJ0100 Rev.1.00
Feb 01, 2014
Page 290 of 572
CubeSuite+ V2.02.00
APPENDIX A WINDOW REFERENCE
Show Parameter
Displays the call stack information with the parameters (arguments) of the function call (default).
Notation
The following cascade menus to specify the notation of values are displayed.
AutoSelect
Displays values on this panel in the default notation according to the type of variable (default).
Hexadecimal
Displays values on this panel in hexadecimal number.
Decimal
Displays values on this panel in decimal number.
Octal
Displays values on this panel in octal number.
Binary
Displays values on this panel in binary number.
Encoding
The following cascade menus to specify the encoding of character variables are displayed.
ASCII
Displays character variables in ASCII code (default).
Shift_JIS
Displays character variables in Shift_JIS code.
EUC-JP
Displays character variables in EUC-JP code.
UTF-8
Displays character variables in UTF-8 code.
UTF-16
Displays character variables in UTF-16 code.
Jump to Disassemble
Opens the Disassemble panel (Disassemble1) and jumps to the address corresponding to the
calling function of the selected line in this panel.
Jump to Source
Opens the Editor panel and jumps to the source line corresponding to the calling function of the
selected line in this panel.
Jump to Local Variable at
Opens the Local Variables panel to display the local variable corresponding to the selected line.
This Time
R20UT2867EJ0100 Rev.1.00
Feb 01, 2014
Page 291 of 572
CubeSuite+ V2.02.00
APPENDIX A WINDOW REFERENCE
Trace panel
This panel is used to display trace data recording the execution history of the program (see "2.11 Collect Execution
History of Programs").
The trace data displays by mixing the disassembled text and source text by default, but it is also possible to display
either one of these by selecting the Display mode.
After the execution of the program is stopped, the display position is automatically updated such that the latest trace
data is displayed.
This panel appears only when connected to the debug tool.
Cautions 1.
[E1][E20][EZ Emulator]
The trace function is supported only when the selected microcontroller incorporates the OCD
trace function. For details on the OCD trace function, see "Table 2-12. Operation
Specifications of OCD Trace Function".
2.
[Simulator]
4 bytes of the final address of the code flash area (when a code flash area is 0x0 - 0x1FFFFF,
0x1FFFC - 1FFFFF corresponds to it) and the RAM area which can be fetched cannot be fetched
(a message of "Stopped by accessing to no map area." will appear).
Remarks 1.
When the separator line of each area in this panel is double-clicked, the width of the area changes to
the shortest possible size that can display the contents of the area.
2.
This panel can be zoomed in and out by
in the tool bar, or by moving the mouse
wheel forward or backward while holding down the [Ctrl] key.
Figure A-32. Trace Panel
[Toolbar]
(1)
(2)
(3)
(4)
(5)
(6)
This section describes the following.
- [How to open]
- [Description of each area]
- [Toolbar]
- [[File] menu (Trace panel-dedicated items)]
- [[Edit] menu (Trace panel-dedicated items)]
R20UT2867EJ0100 Rev.1.00
Feb 01, 2014
Page 292 of 572
CubeSuite+ V2.02.00
APPENDIX A WINDOW REFERENCE
- [Context menu]
[How to open]
- From the [View] menu, select [Trace].
- On the Editor panel/Disassemble panel, select [Trace Settings] >> [Show Trace Result] from the context menu.
[Description of each area]
(1) [Number] area
The trace number corresponding to the trace frame is displayed.
(2) [Time (h:min:s,ms,μs,ns)] area [IECUBE][Simulator]
This area displays the time required from the execution start of the program to the execution start of an instruction
of each frame or generation of memory access cause.
The time is displayed in units of "hours, minutes, seconds, milliseconds, microseconds and nanoseconds".
If overflow occurs, this area is displayed in invalid color (gray).
Remarks 1.
[IECUBE]
The precision of the time depends on the setting of the [Rate of frequency division of trace time
tag] property on the [Trace] category on the [Debug Tool Settings] tab of the Property panel.
2.
[Simulator]
The question of whether to set the time display as an integrated value or differential value depends
on the setting of the [Accumulate trace time] property on the [Trace] category on the [Debug Tool
Settings] tab of the Property panel.
(3) [Line/Address] area
The address of the assemble code or the line number of a source file is displayed.
The notation of a data value can be selected by the button on the toolbar or the context menu item.
The display formats are as follows:
Type of Display Line
Display Format
Instruction (disassemble results)
<Address>
Source text
<File name>#<Line number>
Other than above
Remark
-
Since the following execution histories are not displayed, the line numbers displayed are not
consecutive numbers.
- CPU register access
- Operand access
- Invalid fetch
(4) [Source/Disassemble] area
The collected trace data is displayed as follows.
The items displayed in this area differ depending on the selection of the display mode (see "(a) Display mode").
R20UT2867EJ0100 Rev.1.00
Feb 01, 2014
Page 293 of 572
CubeSuite+ V2.02.00
APPENDIX A WINDOW REFERENCE
Figure A-33. Display Contents of [Source/Disassemble] Area (Default)
Label
Source text
Offset value
Instruction (disassemble results)
Break cause
Label
The label is displayed when a label is defined for the address.
Offset value
The offset value from the nearest label is displayed when a label is defined for the
address.
Source text
The corresponding source text is displayed when the Mixed display mode or Source
display mode is selected.
However, when a place where no debugging information is present is executed, "<No
Debug Information>" is displayed.
[IECUBE][Simulator]
When the value of a variableNote 1 or an SFR that is accessed during execution of a
source line can be analyzed, that value is displayed in the following format at the end
of the source line.
- <<<Variable name = Variable value>>>
- <<<SFR name = SFR value>>>
Example: a=b; <<<a=5>>>
The results of the Point Trace are displayed as same as format above.
Instruction (disassemble results)
The corresponding instructions are displayed as the result of disassembling when the
Mixed display mode or Disassemble display mode is selectedNote 2.
The mnemonics are shown highlighted.
Break cause
The reason why the program has broken down is displayed.
[IECUBE][Simulator]
Reset cause
The reason why CPU reset has occurred is displayed.
[IECUBE]
Notes 1.
[IECUBE][Simulator]
When there is a memory access, a symbol will be interpreted as a variable and displayed only if a
symbol is assigned to the accessed address. Note, however, that only variables of up to 2 bytes are
supported. If multiplication or other code is processed by the standard libraries, the label of the SADDR
area used by the standard library may be shown.
2.
At a frame for which not all the trace data was fetched, "(LOST)" is displayed. In this case, the
corresponding line is shown in error color (the error color depends on the configuration in the [General Font and Color] category of the Option dialog box).
This area is provided with the following functions.
R20UT2867EJ0100 Rev.1.00
Feb 01, 2014
Page 294 of 572
CubeSuite+ V2.02.00
APPENDIX A WINDOW REFERENCE
(a) Display mode
It is possible to select the following three display modes by selection of a button on the toolbar or the context
menu.
Display Mode
Displayed Content
Mixed display mode
Displays the instruction (disassemble results), labels, source text (corresponding
source line), point trace results, reset causes [IECUBE], and break causes (default).
Disassemble display mode
Displays the instruction (disassemble results), labels, point trace results, reset
causes [IECUBE], and break causes.
Source display mode
Displays the source text (corresponding source line) reset causes [IECUBE], and
break causes.
However, when a place where no debugging information is present is executed,
"<No Debug Information>" is displayed.
(b) Jumping to source line or disassemble
By selecting [Jump to Source] from the context menu, the Editor panel opens with moving the caret to the
source line corresponding to the line at the current caret position (if the Editor panel is already open, the
screen will jump to the panel).
In addition, similarly by selecting [Jump to Disassemble], the Disassemble panel (Disasemmble1) is opened
with moving the caret to the address corresponding to the fetch address of the line at the current caret position
(if the Disassemble panel is already open, the screen will jump to the panel (Disassemble1)).
(c) Linking with other panels
By clicking the
/
button on the toolbar, or selecting [Window Connecting] >> [Connect Source
Window]/[Connect Disassemble Window] from the context menu, it is possible to link and display the
corresponding places on the Editor panel/Disassemble panel, with the address of the caret position on this
panel used as the pointer (no movement of the focus is done).
(d) Pop-up display
By hovering the mouse cursor over a line, all the area (item) data corresponding to that line is pop-up
displayed in tandem shape.
(e) Saving trace data
The Data Save dialog box can be opened by selecting the [File] menu >> [Save Trace Data As...], and the
contents of this panel can be saved in a text file (*.txt) or CSV file (*.csv).
See "2.11.9 Save the contents of execution history" for details on the method for saving trace data.
(5) [Address] area [IECUBE][Simulator]
The target address of memory access is displayed.
However, in the event of access to SFR, the SFR name is displayed instead of the address (when a plurality is
accessed these are displayed in the following lines).
The radix of a data value can be selected by the button on the toolbar or the context menu item.
(6) [Data] area [IECUBE][Simulator]
The accessed data value and the access type at that time are displayed.
However, CPU register access is not displayed.
The notation of a data value can be selected by the button on the toolbar or the context menu item.
The display format of the data value and the access type are as follows (character colors and background colors
depend on the configuration in the [General - Font and Color] category of the Option dialog box):
R20UT2867EJ0100 Rev.1.00
Feb 01, 2014
Page 295 of 572
CubeSuite+ V2.02.00
APPENDIX A WINDOW REFERENCE
Display Example (Default)
RData value
WData value
RWData value
VECTData value
Remark
Memory Access Type
Character color
Standard color
Background color
Palegreen
Character color
Standard color
Background color
Orange
Character color
Standard color
Background color
Paleturquoise
Character color
Standard color
Background color
Palegreen
Read access
Write access
Read and write access
Vector read access
[IECUBE]
If SFR/memory is accessed via DMA, "DMA" will be shown immediately after the data value.
[Toolbar]
Acquires the latest data from the debug tool, and updates the contents of this panel.
This item is disabled while the tracer is running.
Clears the trace memory and the display of this panel (initialized).
This item is disabled while the tracer is running.
Starts the tracer operation.
[IECUBE][Simulator]
The content currently being displayed in this panel is cleared.
This item is disabled while the tracer is running.
Stops the tracer operation.
[IECUBE][Simulator]
The contents of trace data newly acquired are displayed.
This item is disabled while the tracer is stopped.
Opens the Trace Search dialog box.
Notation
The following buttons to change the notation of a data value are displayed.
This item is disabled while the tracer is running.
Displays values on this panel in hexadecimal number (default).
Displays values on this panel in decimal number.
Displays values on this panel in octal number.
Displays values on this panel in binary number.
Links with the Editor panel.
[IECUBE][Simulator]
Links with the Disassemble panel.
[IECUBE][Simulator]
Sets to the Mixed display mode as the display mode (default).
[IECUBE][Simulator]
This item is disabled while the tracer is running.
Sets to the Disassemble display mode as the display mode.
[IECUBE][Simulator]
This item is disabled while the tracer is running.
Sets to the Source display mode as the display mode.
[IECUBE][Simulator]
This item is disabled while the tracer is running.
R20UT2867EJ0100 Rev.1.00
Feb 01, 2014
Page 296 of 572
CubeSuite+ V2.02.00
APPENDIX A WINDOW REFERENCE
[[File] menu (Trace panel-dedicated items)]
The following items are exclusive for the [File] menu in the Trace panel (other items are common to all the panels).
Note that all these items are disabled during execution of a program.
Save Trace Data
Overwrites the contents of this panel to the previously saved text file (*.txt)/CSV file (*.csv) (see
"(e) Saving trace data").
Note that when the file has never been saved or the file is write disabled, the same operation is
applied as the selection in [Save Trace Data As...].
This item is disabled while the tracer is running.
Save Trace Data As...
Opens the Data Save dialog box to newly save the contents of this panel to the specified text file
(*.txt)/CSV file (*.csv) (see "(e) Saving trace data").
This item is disabled while the tracer is running.
[[Edit] menu (Trace panel-dedicated items)]
The following items are exclusive for [Edit] menu in the Trace panel (all other items are disabled).
Copy
Copies the contents of the selected line to the clipboard (multiple line selections impossible).
This item is disabled while the tracer is running.
Find...
Opens the Trace Search dialog box.
[Context menu]
Clear Trace
Clears the trace memory and the display of this panel (initialized).
This item is disabled while the tracer is running.
Start Trace
Starts the tracer operation.
[IECUBE][Simulator]
The content currently being displayed in this panel is cleared.
This item is disabled while the tracer is running.
Stop Trace
Stops the tracer operation.
[IECUBE][Simulator]
The contents of trace data newly acquired are displayed.
This item is disabled while the tracer is stopped.
Find...
Opens the Trace Search dialog box.
This item is disabled while the tracer is running.
Copy
Copies the contents of the selected line to the clipboard (multiple line selections impossible).
This item is disabled while the tracer is running.
Mixed Display
Sets to the Mixed display mode as the display mode.
This item is disabled while the tracer is running.
Disassemble View
Sets to the Disassemble display mode as the display mode.
This item is disabled while the tracer is running.
Source View
Sets to the Source display mode as the display mode.
This item is disabled while the tracer is running.
Notation
The following cascade menus are displayed to specify the notation.
This item is disabled while the tracer is running.
Hexadecimal number
Displays values on this panel in hexadecimal number (default).
Decimal
Displays values on this panel in decimal number.
Octal
Displays values on this panel in octal number.
Binary
Displays values on this panel in binary number.
R20UT2867EJ0100 Rev.1.00
Feb 01, 2014
Page 297 of 572
CubeSuite+ V2.02.00
APPENDIX A WINDOW REFERENCE
Window Connecting
The following cascade menus are displayed to link with other panels (see "(c) Linking with other
[IECUBE][Simulator]
panels").
Connect Source
Links with the Editor panel.
Window
Connect Disassemble
Links with the Disassemble panel.
Window
Jump to Disassemble
Opens the Disassemble panel (Disassemble1) and jumps to the fetch address corresponding to
[IECUBE][Simulator]
the line at the caret position in this panel.
Jump to Source
Opens the Editor panel and jumps to the source line corresponding to the line at the caret position
[IECUBE][Simulator]
in this panel.
Jump to Memory
Opens the Memory panel and jumps to the memory value corresponding to the line at the caret
[IECUBE][Simulator]
position in this panel.
R20UT2867EJ0100 Rev.1.00
Feb 01, 2014
Page 298 of 572
CubeSuite+ V2.02.00
APPENDIX A WINDOW REFERENCE
Events panel
This panel is used to display the detailed information about the events that are set on the Editor panel/Disassemble
panel/Watch panel. On this panel, you can change the setting state of the event between valid/invalid and delete the
event (see "2.15 Manage Events").
This panel appears only when connected to the debug tool.
Remarks 1.
The available event types depend on the type of the selected microcontroller and of the debug tool in
use. Refer to the descriptions under "See ..." sentences in the category "Description" in "Table A-11.
Event Type". Alternatively, see "(1) Maximum number of enabled events".
2.
The events that have been set on the Function List panel or Variable List panel of the analyze tool
(Program Analyzer) are also managed on this panel.
3.
This panel can be zoomed in and out by
in the tool bar, or by moving the mouse
wheel forward or backward while holding down the [Ctrl] key.
4.
When the separator line of each area in this panel is double-clicked, the width of the area changes to
the shortest possible size that can display the contents of the area.
Figure A-34. Events Panel
[Toolbar]
(1)
(2)
(3)
This section describes the following.
- [How to open]
- [Description of each area]
- [Toolbar]
- [[Edit] menu (Events panel-dedicated items)]
- [Context menu]
[How to open]
- From the [View] menu, select [Event].
- [IECUBE][Simulator]
On the Editor panel/Disassemble panel, select [Timer Settings] >> [View Result of Timer] from the context menu.
R20UT2867EJ0100 Rev.1.00
Feb 01, 2014
Page 299 of 572
CubeSuite+ V2.02.00
APPENDIX A WINDOW REFERENCE
[Description of each area]
(1) [Name] area
A list of the event names that have currently been set is displayed in the following format.
(a)
Remark
(b)
(c)
It is possible to limit the event to be displayed by clicking the button on the toolbar (see "[Toolbar]").
(a) Check box
The setting state of the event is displayed/changed.
Note that the Event mark is changed depending on the setting state of the event.
Valid state
Event occurs when the specified condition is met.
It is possible to set the event to an invalid state by removing the check.
Invalid state
Event does not occur when the specified condition is met.
It is possible to set the event to a valid state by removing the check.
Suspended state
The conditions that have been specified cannot be set with the program of the debugging target.
It is not possible to operate the check box.
Remarks 1.
Both of the Timer Start event and Timer Stop event is must be set for the Timer Result event.
Therefore, it is not possible to set a particular event to a valid state by only the setting of one of
these (at the same time as both events are set, they are treated as grouped events as a Timer
Result).
2.
It is not possible to set the Run-Break Timer event to an invalid/suspended state.
3.
The setting of the Unconditional Trace event and the Trace event to valid or invalid state is
exclusively controlled. Therefore, the Unconditional Trace event, which is a built-in event, is
valid state by default, but if either a trace start event/trace end event is set, it automatically
becomes invalid state, and the Trace event, which is a event name that is collectively called
with a trace start event and a trace end event, becomes valid state. Conversely, if the set
Trace event is invalid state, the Unconditional Trace event automatically becomes valid state.
(b) Event mark
The event mark shows the type of event, and in addition shows the current setting state.
The meanings of the marks displayed are as follows:
Table A-10. Event Mark
Event Type
Valid State
Invalid State
Suspended
Note
State
Hardware Break
-
Software Break
-
Conbination Break
-
R20UT2867EJ0100 Rev.1.00
Feb 01, 2014
Page 300 of 572
CubeSuite+ V2.02.00
Event Type
APPENDIX A WINDOW REFERENCE
Valid State
Invalid State
Suspended
Note
State
Break at start of function
A break event that can be set via the
analyze tool.
Access break to variable
Unconditional Trace
Run-Break Timer
None
None
-
None
-
Trace
Displayed on only the Events panel
Displayed on only the Editor panel/
Trace start
Disassemble panel
Trace end
Timer Result
Displayed on only the Events panel
Displayed on only the Editor panel/
Timer start
Disassemble panel
Timer end
Point Trace
-
Printf (Action event)
Setting of two or more
Note 1
Note 2
Note 3
events
Displayed on only the Editor panel/
Disassemble panel
Notes 1.
There is one or more event with valid state.
2.
There is no event with valid state and at least one event with invalid state.
3.
All the set events are suspended state.
(c) Event name
The event type and ID number are displayed as the event name.
A number from 0001 is automatically provided as the ID number for each event (no renumbering of the ID
number is done even in the event that an event that has been set once is deleted).
Event types that are displayed are as follows:
Table A-11. Event Type
Event Type
Description
Hardware Break
Breaks the program when the condition is met while the debug tool monitors
(BreakNote 1)
the break condition all the time during program execution.
-> See "2.8.3 Stop the program at the arbitrary position (breakpoint)"
-> See "2.8.4 Stop the program at the arbitrary position (break event)"
-> See "2.8.5 Stop the program with the access to variables/SFRs"
Software Break
Breaks the program when the instruction, which an address code to break is
(BreakNote 1)
rewritten for the break instruction, is executed.
-> See "2.8.3 Stop the program at the arbitrary position (breakpoint)"
Combination Break
Breaks the program when, while the debug tool successively is checking
plural break conditions during program execution, the combination condition
is met.
-> See "2.8.4 Stop the program at the arbitrary position (break event)"
-> See "2.8.5 Stop the program with the access to variables/SFRs"
Break at start of function
This event type is a Hardware Break (execution type) that is set in the
Function panel of the analyze tool (Program Analyzer).
R20UT2867EJ0100 Rev.1.00
Feb 01, 2014
Page 301 of 572
CubeSuite+ V2.02.00
APPENDIX A WINDOW REFERENCE
Event Type
Access break to variable
Description
This event type is a Hardware Break (access type) that is set in the Variable
panel of the analyze tool (Program Analyzer).
Unconditional Trace
Automatically collects the trace data with start of a program execution, and
stops collecting the trace data with stop of the program execution.
This event cannot be deleted because of the built-in eventNote 2 (this event is
set to a Valid state by default).
-> See "2.11.2 Collect execution history until stop of the execution"
Run-Break Timer
Automatically measures the execution time of a program with start of the
program execution, and stops the measurement with stop of the program
execution. This event cannot be deleted because of the built-in eventNote 2
(this event is set to a Valid state by default).
-> See "2.12.1 Measure execution time until stop of the execution"
Trace
Starts/stops collecting the trace data when the condition specified with a trace
start event and a trace end event is met (this event is displayed when either a
trace start event or a trace end event is set).
-> See "2.11.3 Collect execution history in the arbitrary section"
Timer Result
Starts/stops measuring the execution time of a program when the condition
specified with a timer start event and a timer end event is met (this event is
displayed when either a timer start event or a timer end event is set).
-> See "2.12.2 Measure execution time in the arbitrary section
[IECUBE][Simulator]"
Point Trace
Records the information as the trace data only when accessing the specified
variable or SFR during execution of a program.
-> See "2.11.4 Collect execution history only when the condition is met
[IECUBE][Simulator]"
Printf
Executes printf command in software processing after temporary stopping a
program in execution at an arbitrary position (action event).
-> See "2.14.1 Inset printf"
Notes 1.
A breakpoint that is set by a one click operation of the mouse is displayed "Break" (see "(1) Set a
breakpoint").
2.
This is set in the debug tool by default.
(2) [Detail Information] area
Detailed information about each event is displayed.
The contents of the information that is displayed differ depending on the event type as follows:
Caution
For an access-related event to which the detailed event conditions have been set via the Detail
dialog box (for access events), "[Refer To A Detail Dialog]" may be displayed in this area. If this
is the case, refer to the contents of the Detail dialog box (for access events).
R20UT2867EJ0100 Rev.1.00
Feb 01, 2014
Page 302 of 572
CubeSuite+ V2.02.00
APPENDIX A WINDOW REFERENCE
Table A-12. Detailed Information with Event Type
Displayed ContentNote 1
Event Type
Hardware Break
(Condition: execution)
Format1
<Condition to occur> <File name#Line number> <Address>
Example
Before Execution
main.c#39
0x100
After Execution
sub.c#100
0x200
-
0x300
Before Execution
Execution
main.c#39
Format2
<Condition to occur> <Symbol + Offset> <Address>
Example
Before Execution
funcA + 0x10
0x100
After Execution
funcB + 0x20
0x200
Before Execution
Hardware Break
0x300 [Simulator]
Format1
-
0x300
<Condition to occur> <File name#Variable name> <Address(range)>
<Comparison condition> <Comparison value>
(Condition: access)
Example
Format2
Read
main.c#variable1
0x100 - 0x101 == 0x5
Write
sub.c#variable2
0x200 - 0x200 == 0x7
Read/Write
sub2.c#variable3
0x300 - 0x303 == 0x8
<Condition to occur> <File name#Function name#Variable name>
<Address(range)> <Comparison condition> <Comparison value>
Example
Read
main.c#func1#variable1
0x100 - 0x101 == 0x10
Format3
<Condition to occur> <Variable name> <Address(range)> <Comparison
condition> <Comparison value>
Software Break
Combination Break
Example
Write
variable1
0x100 - 0x101 == 0x10
Format1
<Condition to occur> <File name#Line number> <Address>
Example
Before Execution
main.c#40
0x102
Before Execution
sub.c#101
0x204
Format2
<Condition to occur> <Symbol + Offset> <Address>
Example
Before Execution
Format
(Condition: execution/access)
funcA + 0x12 0x102
<Combination condition>
<Detailed information of combination break event>
Example
OR
- After execution main.c#100 0x300
- After execution funcA + 0x10 0x100
- Write sub.c#variable2 0x200 - 0x200 == 0x7
- Read/Write sub2.c#variable3 0x300 - 0x303 ==0x8
Unconditional Trace
Run-Break Timer
Format
-
Example
-
Format
Total: <Total execution time>
Example
Total: 1000ms
Total: OVERFLOW
R20UT2867EJ0100 Rev.1.00
Feb 01, 2014
Page 303 of 572
CubeSuite+ V2.02.00
APPENDIX A WINDOW REFERENCE
Displayed ContentNote 1
Event Type
Trace
Format
<Start/End> <Detailed information of trace start/trace end event>
(Condition: execution)
Example
Timer Result
Total of Start/End: <Total number of trace start/trace end events> Note 2
Format
Total of Start/End: 4
- Start After Execution
main.c#1000x300
- Start After Execution
funcA + 0x1000x300
- End
After Execution
main.c#2000x100
- End
After Execution
funcA + 0x100x100
Total:<Total execution time > Total of Start/End: <Total number of timer
start event/timer end event>Note 2
(Condition: execution)
- <Total execution time> <Pass Count> <Average> <Max> <Min>
- <Start/End> <Detailed information of timer start event/timer end event>
Example
Total: 10ms
Total of Start/End: 4
- Total: 10ms
Pass Count: 5
Max: 4ms
Point Trace
(Condition: access)
Average: 2ms
Min: 1ms
- Start After Execution
main.c#1000x300
- Start After Execution
funcA + 0x300x100
- End
After Execution
main.c#1000x300
- End
After Execution
funcA + 0x500x100
Format1
<Condition to occur> <Variable name> <Variable address>
Example
Read
Format2
<Condition to occur> <File name#Variable name> <Variable address>
Example
Write
Format3
variable1 0x100
sub.c#variable2
0x200
<Condition to occur> <File name#Function name#Variable name>
<Variable address>
Example
Printf
Format
sub.c#func1#variabl3 0x300
<Condition to occur> <File name#Line number> <Address> <Setting of Printf
event>
(Action event)
Example
Notes 1.
Read/Write
Before Execution
main.c#39
0x100 aaa, bbb, ccc
After Execution
sub.c#100
0x200 Result of aaa : aaa
Following are the details on the display format.
<Condition to
Displays one of the following conditions.
occur>
For other than [Simulator]
Execution:
Before Execution or After Execution
Access:
Read, Write, Read/Write
[Simulator]
R20UT2867EJ0100 Rev.1.00
Feb 01, 2014
Execution:
Execution
Access:
Read, Write, Read/Write
Page 304 of 572
CubeSuite+ V2.02.00
<File name#Line
number>
APPENDIX A WINDOW REFERENCE
Shows the line number of the source. Display format is the same as the watch type
scope specification expression. For those events set in the Disassemble panel,
display <Line number> in the format <Symbol + offset> in the condition below.
- Line information exists and the specified position that the event is set not the top of
the line information
- Line information does not exist and symbol information exists.
Show <Line number> in "-" in the following condition.
- Line information and symbol information does not exist.
<Variable name>
Shows the variable name in the source file. Display format is the same as the watch
type scope specification expression.
<Comparison
Condition to compare (==) is shown. If the comparison value is not specified,
condition>
comparison condition is not shown.
<Comparison value>
Comparison value is shown. If the comparison value is not specified, comparison
condition is not shown.
<Address>
Address in the memory area is shown (only in hex number).
<Combination
One of the following conditions is displayed:
condition>
OR, Sequential
<Start/End>
Shows whether the contents of the detailed information is start event or the stop event.
<Pass Count>
Shows the measurement result of the pass count of the timer.
If a timer overflow occurs (see "2.12.3 Measurable time ranges"), or if the illegal value
was acquired, "OVERFLOW" is displayed.
If measurements have not been performed yet, "Not measured" is displayed.
<Total>
Shows the measurement result of the timer total execution time.
The unit is either of ns/μs,/ms/s/min/clock (if, however, the unit is in "min", a value in "s"
unit also appears).
If a timer overflow occurs (see "2.12.3 Measurable time ranges"), or if the illegal value
was acquired, "OVERFLOW" is displayed.
If measurements have not been performed yet, "Not measured" is displayed.
<Average>
Shows the measurement result of average execution of the timer.
The unit is either of ns/μs,/ms/s/min/clock (if, however, the unit is in "min", a value in "s"
unit also appears).
If a timer overflow occurs (see "2.12.3 Measurable time ranges"), or if the illegal value
was acquired, "OVERFLOW" is displayed.
If measurements have not been performed yet, "Not measured" is displayed.
<Max>
Shows the measurement result of the maximum execution time of the timer.
The unit is either of ns/μs,/ms/s/min/clock (if, however, the unit is in "min", a value in "s"
unit also appears).
If a timer overflow occurs (see "2.12.3 Measurable time ranges"), or if the illegal value
was acquired, "OVERFLOW" is displayed.
If measurements have not been performed yet, "Not measured" is displayed.
<Min>
Shows the measurement result of the minimum execution time of the timer.
The unit is either of ns/μs,/ms/s/min/clock (if, however, the unit is in "min", a value in "s"
unit also appears).
If a timer overflow occurs (see "2.12.3 Measurable time ranges"), or if the illegal value
was acquired, "OVERFLOW" is displayed.
If measurements have not been performed yet, "Not measured" is displayed.
<Set print event>
Shows the variable expression and the character strings specified in the Action Events
dialog box.
R20UT2867EJ0100 Rev.1.00
Feb 01, 2014
Page 305 of 572
CubeSuite+ V2.02.00
2.
APPENDIX A WINDOW REFERENCE
Click this line to display the detailed information of the lower lines.
(3) [Comment] area
The user can write comments for each event that has been set.
To input comments, click on this area, or select [Edit Comment] form the context menu after selecting the event in
which you want to input comments, and then input directly the desired text from the keyboard (the edit mode is
cancelled by pressing down the [Esc] key).
After editing the comments, complete the editing by pressing the [Enter] key or moving the focus to outside the edit
region. Up to a maximum of 256 characters can be inputted for the comments, and this is saved as the settings of
the user during use.
[Toolbar]
Deletes the selected event and event condition.
Note that it is not possible to delete the built-in events (Unconditional Trace event and Run-Break
Timer event).
Displays events related to Hardware Break (default).
Displays events related to Software Break (default).
(except [Simulator])
Displays events related to the traceNote 1 (default).
Displays events related to the timer (default).
[IECUBE][Simulator]
Displays events related to the action event (Printf event) (default).
Displays events related to the built-in event (Unconditional Trace event/Run-Break Timer event)
(default).
Opens the Editor panel and jumps to the source line corresponding to the address where the
selected eventNote 2 is being set.
Opens the Disassemble panel and jumps to the disassemble results corresponding to the
address where the selected eventNote 2 is being set.
Opens the Memory panel and jumps to the memory corresponding to the address where the
selected eventNote 2 is being set.
Notes 1.
[E1][E20][EZ Emulator]
This button is only available when the selected microcontroller incorporates the OCD trace function.
2.
Events other than Trace events, Timer Result events and built-in events (Unconditional Trace events/RunBreak Timer events) can be objects of this button.
[[Edit] menu (Events panel-dedicated items)]
The following items are exclusive for [Edit] menu in the Events panel (all other items are disabled).
Delete
Deletes the selected event and event condition.
Note that it is not possible to delete the built-in events (Unconditional Trace event and Run-Break
Timer event).
Select All
Selects all the events displayed on the panel.
Find...
Opens the Find and Replace dialog box with selecting [Find in Files] tab.
Replace...
Opens the Find and Replace dialog box with selecting [Replace in Files] tab.
R20UT2867EJ0100 Rev.1.00
Feb 01, 2014
Page 306 of 572
CubeSuite+ V2.02.00
APPENDIX A WINDOW REFERENCE
[Context menu]
Enable Event
Enables the selected event (valid state).
Note that this item is disabled if the selected event is a valid state.
Disable Event
Disables the selected event (invalid state).
Note that this item is disabled if the selected event is an invalid state.
Delete
Deletes the selected event.
Note that it is not possible to delete the built-in events (Unconditional Trace event and Run-Break
Timer event).
Select All
Selects all the events of this panel.
View Select
The following cascade menus are displayed to limit the event type to be displayed.
All of the items have been selected by default.
Hardware Break
Displays events related to Hardware Break.
Software Break
Displays events related to Software Break.
Timer Event
Displays events related to the timer.
Trace Event
Displays events related to the traceNote 1.
Action Event
Displays events related to action events (Printf events).
Built-in Event
Displays events related to built-in events (Unconditional Trace event or Run-Break Timer event).
Timer Settings
The following cascade menus are displayed to do the settings related to the timer.
Note that this item is enabled only when a timer-related event has been selected.
Init Timer
Initializes the timer used by the selected event (except for Run-Break Timer).
Nanosecond
Displays the result of a selected event measured by a timer in nanosecond (ns) units.
Microsecond
Displays the result of a selected event measured by a timer in microsecond (μs) units.
Millisecond
Displays the result of a selected event measured by a timer in millisecond (ms) units.
Second
Displays the result of a selected event measured by a timer in second (s) units.
Minute
Displays the result of a selected event measured by a timer in minute (min) units.
Clock
Displays the result of a selected event measured by a timer in clock units.
Jump to Memory
Opens the Memory panel (Memory1) and jumps to the memory corresponding to the address
where the selected eventNote 2 is being set.
Jump to Disassemble
Opens the Disassemble panel (Disassemble1) and jumps to the disassemble results
corresponding to the address where the selected eventNote 2 is being set.
Jump to Source
Opens the Editor panel and jumps to the source line corresponding to the address where the
selected eventNote 2 is being set.
Edit Condition...
Opens one of the following dialog box to edit the selected event
- For an execution-related event
Detail dialog box (for execution events)
- For an access-related event
Detail dialog box (for access events)
- For a Combination Break event
Combination Condition dialog box [E1][E20]
- For an action event (Printf event)
Action Events dialog box
Edit Comment
Sets to the edit mode to input comments for the selected event.
When comments are already present, all of that character string is set to a select state.
R20UT2867EJ0100 Rev.1.00
Feb 01, 2014
Page 307 of 572
CubeSuite+ V2.02.00
Notes 1.
APPENDIX A WINDOW REFERENCE
[E1][E20][EZ Emulator]
This button is only available when the selected microcontroller incorporates the OCD trace function.
2.
Events other than Trace events, Timer Result events and built-in events (Unconditional Trace events/RunBreak Timer events) can be objects of this button.
R20UT2867EJ0100 Rev.1.00
Feb 01, 2014
Page 308 of 572
CubeSuite+ V2.02.00
APPENDIX A WINDOW REFERENCE
Output panel
This panel is used to display operation logs for various components (debug tool, design tool, build tool, etc.) provided
by CubeSuite+, in addition to results of batch searches by the Find and Replace dialog box and a Printf event (see
"2.14.1 Inset printf").
The messages are classified by the message origination tool and displayed on the individual tabs.
Remark
This panel can be zoomed in and out by
in the tool bar, or by moving the mouse wheel
forward or backward while holding down the [Ctrl] key.
Figure A-35. Output Panel
(1)
(2)
This section describes the following.
- [How to open]
- [Description of each area]
- [[File] menu (Output panel-dedicated items)]
- [[Edit] menu (Output panel-dedicated items)]
- [Context menu]
[How to open]
- From the [View] menu, select [Output].
[Description of each area]
(1) Message area
The output messages of each tool, search results and results by a Printf event are displayed.
In the case of search results (batch search), every time a search is performed, a new message will be displayed
after the previous message is cleared (except for the [All Messages] tab).
The colors of message display differ with the type of message as shown below (character colors and background
colors depend on the configuration in the [General - Font and Color] category of the Option dialog box).
Message Type
Normal message
Warning message
R20UT2867EJ0100 Rev.1.00
Feb 01, 2014
Display Example (Default)
Character color
Black
Background color
White
Character color
Blue
Background color
Standard color
Description
Displayed with information notices
Displayed with warnings about operations
Page 309 of 572
CubeSuite+ V2.02.00
APPENDIX A WINDOW REFERENCE
Message Type
Display Example (Default)
Error message
Character color
Background color
Description
Red
Displayed when there is a critical error, or
when execution is not possible due to a
Light gray
operational mistake
This area is provided with the following functions.
(a) Tag jump
By double-clicking on the output message, the Editor panel is opened and the number of the corresponding
line in the corresponding file is displayed.
This allows you to jump from error messages that are output when building, etc. to the corresponding error line
in the source file.
(b) Help display
If there is a caret on the line where a warning message or error message is being displayed, you can select
[Help for Message] from the context menu. You can also display help for that line's message by pressing the
[F1] key.
(c) Saving a log
The Save As dialog box can be opened by selecting the [File] menu >> [Save Output-tab name As...], and the
contents that are displayed on the currently selected tab can be saved in a text file (*.txt) (messages on
deselected tabs will not be saved).
(2) Tab selection area
Select the tab that indicates the origin of message.
The following tabs are available for the debug tool.
Tab Name
Description
All Messages
Displays operation logs for all components (debug tool, design tool, build tool, etc.) provided
by CubeSuite+ in order of output.
Debug Tool
Displays messages output from the debug tool.
Display only operation logs for the debug tool out of those for various components (debug tool,
design tool, build tool, etc.) provided by CubeSuite+.
Find and Replace
Caution
Displays the batch search results from the Find and Replace dialog box.
Even if a new message is output on a deselected tab, tab selection will not automatically switch.
In this case, "*" mark will be added in front of the tab name, indicating that a new message has
been output.
[[File] menu (Output panel-dedicated items)]
The following items are exclusive for the [File] menu in the Output panel (other items are common to all the panels).
Note that all these items are disabled during execution of a program.
Save Output-tab name
Overwrites the contents that are displayed on the currently selected tab to the preciously saved text file
(see "(c) Saving a log").
Note that when the file has never been saved or the file is write disabled, the same operation is
applied as the selection in [Save Output-tab name As...].
This item is disabled while building.
R20UT2867EJ0100 Rev.1.00
Feb 01, 2014
Page 310 of 572
CubeSuite+ V2.02.00
APPENDIX A WINDOW REFERENCE
Save Output-file name
Opens the Save As dialog box to newly save the contents that are displayed on the currently selected
As...
tab to the specified text file (*.txt) (see "(c) Saving a log").
[[Edit] menu (Output panel-dedicated items)]
The following items are exclusive for [Edit] menu in the Output panel (all other items are disabled).
Copy
Copies the contents of the selected range to the clipboard as character string(s).
Select All
Selects all the messages displayed on the currently selected tab.
Find...
Opens the Find and Replace dialog box with selecting [Quick Find] tab.
Replace...
Opens the Find and Replace dialog box with selecting [Replace in Files] tab.
[Context menu]
Copy
Copies the contents of the selected range to the clipboard as character string(s).
Select All
Selects all the messages displayed on the currently selected tab.
Clear
Deletes all the messages displayed on the currently selected tab.
Tag Jump
Opens the Editor panel and jumps to the number of the corresponding line in the corresponding file
of the message at the caret position.
Stop Searching
Cancels the search currently being executed.
This item is disabled when a search is not being executed.
Help for Message
Displays help for the massage on the current caret position.
This item only applies to warning messages and error messages.
R20UT2867EJ0100 Rev.1.00
Feb 01, 2014
Page 311 of 572
CubeSuite+ V2.02.00
APPENDIX A WINDOW REFERENCE
Memory Mapping dialog box
This dialog box is used to set the memory mapping for each type of memory.
Caution
If you are not connected to a debug tool, then only memory mapping areas added by user is
displayed.
Connecting to a debug tool (see "2.4.1 Connect to the debug tool") will display details for each
memory type.
Figure A-36. Memory Mapping Dialog Box (for Other Than [Simulator])
(1)
(2)
[Function buttons]
Figure A-37. Memory Mapping Dialog Box [Simulator]
(1)
(2)
[Function buttons]
R20UT2867EJ0100 Rev.1.00
Feb 01, 2014
Page 312 of 572
CubeSuite+ V2.02.00
APPENDIX A WINDOW REFERENCE
This section describes the following.
- [How to open]
- [Description of each area]
- [Function buttons]
[How to open]
- On the [Debug Tool Settings] tab of the Property panel, click the [...] button displayed by selecting one of the values
of the [Memory mappings] property in the [Memory] category.
Caution
This dialog box cannot be opened during execution of a program.
[Description of each area]
(1) Added memory mapping specification area
Specify the information for a memory mapping newly added.
(a) [Memory type]
Select the memory type for the memory mapping to be added from the following drop-down list.
The item selected by default differs depending on the debug tool to use.
Emulation ROM area
Adds the Emulation ROM area.
[Simulator]
The simulator alternate ROM is used.
Emulation RAM area
Adds the Emulation RAM area.
[Simulator]
The simulator alternate RAM is used.
Target memory area
Adds the target memory area.
I/O protection area
Adds the I/O protection areaNote.
Note The I/O protected area is an area protected from access by the debug function.
The address range set to I/O protected area cannot be accessed from the Memory panel (i.e., it can
only be accessed via executing the load module). I/O protected area mapping is only possible within
the target memory area.
Remark
External memory area and guarded areas (areas where access is prohibited) are treated as nonmapped areas. For this reason, if a mapping overlaps a guarded area, then a message will inform
the user that the mapping overlaps a non-mapped area.
See the manual of our microcontroller for details onfor details onfor details on the mapping
information of external memory areas and guarded areas.
Mapping attributes and their sizes that can be set are as follows:
Table A-13. Settable Mapping Attribute
Attribute
Debug Tool
IECUBE
E1/E20
Simulator
EZ Emulator
Emulation ROM area
-
-
Emulation RAM area
-
-
R20UT2867EJ0100 Rev.1.00
Feb 01, 2014
Page 313 of 572
CubeSuite+ V2.02.00
APPENDIX A WINDOW REFERENCE
Attribute
Debug Tool
IECUBE
E1/E20
Simulator
EZ Emulator
Note
Target memory area
I/O protection area
: Valid (Mapping unit: 2 bytes)
: Invalid
Note The target memory area can be mapped to a total of four.
(b) [Address range]
Specify the start address and end address for the memory mapping to be added.
Directly input a hexadecimal number into the text box for each.
In the case of the following settings, however, new memory mappings cannot be added. Clicking the [Add]
button in this area causes an error message to be displayed.
- If the specified address range duplicates a separate memory area when [Target memory area] is selected
as the memory type
- If the specified address range cannot be put into a single target memory area when [I/O protection area] is
selected as the memory type
(c) [Access width] (except [Simulator])
Select the access width of the memory mapping to be added from the following drop-down list (direct input is
not possible).
In the case where [I/O protection area] is selected as the memory type, the access width must be set to the
same value as the access width of the target memory area.
8bits
Sets the access width of the memory mapping to be added to 8 bits (default).
16bits
Sets the access width of the memory mapping to be added to 16 bitsNote.
Note When being added to memory mapping, fractions in the address value specified as the ending address
are automatically rounded up to multiples of 2.
(d) Button
Button
Add
Function
Adds the content specified in this area to memory mapping.
The added memory mapping is displayed in the [Memory mapped list] area.
The changes will not take effect until the [OK] button is clicked.
(2) [Memory mapped list] area
(a) List display
Information about the memory mapping added in the Added memory mapping specification area and the
microcontroller's internal memory mapping is displayed. This area cannot be edited.
R20UT2867EJ0100 Rev.1.00
Feb 01, 2014
Page 314 of 572
CubeSuite+ V2.02.00
APPENDIX A WINDOW REFERENCE
Memory type
Displays the following memory types.
- Internal ROM areaNote 1
- Mirror area
- Internal RAM area
- DataFlash areaNote 2 (except [Simulator])
- Other RAM area
- SFR area
- Target memory area
- Emulation ROM area [Simulator]
- Emulation RAM area [Simulator]
- Non-map area
- I/O protection area
Address range
Displays the address range as <Start address> - <End address>.
Display is fixed as "0x"-prefixed hexadecimal numbers.
Size
Displays size as a decimal number (unit: bytes/KbytesNote 3).
Access width
Displays the access width (unit: bits).
Notes 1.
This item does not appear when the selected microcontroller is a ROMless product.
In the case that internal emulation ROM area exists in the emulator, however, "Internal ROM area"
will be displayed only when the [Size of internal ROM [KBytes]] property of the [Internal ROM/RAM]
category is set to a value greater than "0" in the [Connect Settings] tab of the Property panel.
2.
This item appears only when the selected microcontroller incorporates the data flash memory.
3.
Only in the case of multiple of 1024, displays in kilobyte units.
(b) Button
Button
Function
Remove
Deletes the memory mapping selected in this area.
The memory areas that can be deleted are the Target memory area, I/O protection area,
Emulation ROM area [Simulator], or the Emulation RAM area [Simulator] (the microcontroller's
internal memory mapping cannot be deleted).
In the case where you have attempted to delete a target memory area that is specified as an I/O
protection area, however, a message will be displayed. The selected target memory area and
the I/O protection area mapped to that area will both be deleted only if you click the [OK] button.
[Function buttons]
Button
Function
OK
Sets the currently specified memory mapping to the debug tool and closes this dialog box.
Cancel
Cancels memory mapping changes and closes this dialog box.
Help
Displays the help for this dialog box.
R20UT2867EJ0100 Rev.1.00
Feb 01, 2014
Page 315 of 572
CubeSuite+ V2.02.00
APPENDIX A WINDOW REFERENCE
Download Files dialog box
This dialog box is used to select files for downloading and configure download conditions (see "2.5 Download/Upload
Programs").
Note that files specified as build targets in a project (main project or sub-project) are automatically registered as
download targets (they can be unregistered).
Caution
This dialog box cannot be opened during execution of a program.
Figure A-38. Download Files Dialog Box
(2)
(1)
[Function buttons]
This section describes the following.
- [How to open]
- [Description of each area]
- [Function buttons]
[How to open]
- On the [Download File Settings] tab of the Property panel, click the [...] button displayed by selecting the
[Download files] property in the [Download] category.
[Description of each area]
(1) [Download file list] area
(a) List display
Displays a list of files to download. The names of files specified as build targets in a project (main project or
sub-project) are displayed by default (they can be removed).
Files are downloaded in the order that they are displayed here.
To add a new file to be downloaded, click the [Add] button in this area, then in the [Download file property]
area, specify the download conditions of the file to add.
R20UT2867EJ0100 Rev.1.00
Feb 01, 2014
Page 316 of 572
CubeSuite+ V2.02.00
APPENDIX A WINDOW REFERENCE
(b) Button
Button
Up
Function
Moves the selected file up one row in the list.
Clicking this for the top file in the list has no effect.
Down
Moves the selected file down one row in the list.
Clicking this for the bottom file in the list has no effect.
Add
Adds an empty item "-" to the list, and selects it.
Specify the download conditions of the file to add in the [Download file property] area.
Note that this button will be disabled if 20 files have already been registered.
Remove
Removes the selected file from the list.
Note, however, that this button is disabled if the selected file is a project build target.
Remarks 1.
2.
By hovering the mouse cursor over a file name, the pass information of the file is pop-up displayed.
By dragging a file name with the mouse, the display order in the list can be changed.
Note, however, that the order of a project build target cannot be changed.
(2) [Download file property] area
(a) [Download file information]
This area is used to display or edit the download conditions of the file selected in the [Download file list] area.
It can also be used to specify the download conditions of new download files added via the [Add] button.
File
Specify the name of the file to download.
Default
File name (but it will be blank for newly added files)
Modifying
Directly enter from the keyboard, or specify with the Select Download File
dialog box opened by clicking the [...] buttonNote 1 appears at right by
selecting this item.
Available values
See "Table 2-1. Type of Files That Can be Downloaded"
Up to 259 characters
File type
Specify the type of the file to download.
Default
Load module file
Modifying
Select from the drop-down list.
Available values
Either of the following
- Load module file
- Hex file
- Binary data file
Offset
Specify the offset from the address at which the file's download is to start.
Note that this item appears only when [File type] is set to [Hex file].
R20UT2867EJ0100 Rev.1.00
Feb 01, 2014
Default
0
Modifying
Directly enter from the keyboard.
Available values
0x0 to 0xFFFFFF in hexadecimal number
Page 317 of 572
CubeSuite+ V2.02.00
APPENDIX A WINDOW REFERENCE
Start address
Specify the address at which to start the file's download.
Note that this item appears only when [File type] is set to [Binary data file].
Download object
Default
0
Modifying
Directly enter from the keyboard.
Available values
0x0 to 0xFFFFFF in hexadecimal number
Specify whether to download the object information from the specified file.
Note that this item appears only when [File type] is set to [Load module file].
Default
Yes
Modifying
Select from the drop-down list.
Available values
Yes
Downloads object information.
No
Does not download object information.
Download symbol
Specify whether to download the symbol information from the specified fileNote 2.
information
Note that this item appears only when [File type] is set to [Load module file].
Default
Yes
Modifying
Select from the drop-down list.
Available values
Yes
Downloads symbol information.
No
Does not download symbol information.
Generate the
Select whether to generate the information for the Symbol name completion function when
information for
downloadingNote 3.
input completion
Note that this item appears only when [File type] is set to [Load module file].
Default
Yes
Modifying
Select from the drop-down list.
Available values
Yes
Generates the information for the symbol name
completion function. (i.e. uses the symbol name
completion function.)
No
Does not generate the information for the symbol name
completion function. (i.e. does not use the symbol name
completion function.)
Notes 1.
When a file specified as build target in the project is selected in the [Download file list] area, or
when the program is executing, the [...] button does not appear.
2.
If the symbol information have not been downloaded, the source level debugging cannot be
performed.
3.
When [Yes] is selected, the time taken for downloading and the memory usage on the host
machine will increase. We recommend selecting [No] in this item if you do not intend to use the
symbol name completion function.
[Function buttons]
Button
Function
OK
Finishes configuring the download files, and closes this dialog box.
Cancel
Cancels any changes to the download files, and closes this dialog box.
Help
Displays the help for this dialog box.
R20UT2867EJ0100 Rev.1.00
Feb 01, 2014
Page 318 of 572
CubeSuite+ V2.02.00
APPENDIX A WINDOW REFERENCE
Text Edit dialog box
This dialog box is used to input/modify character strings.
Figure A-39. Text Edit Dialog Box
(1)
[Function buttons]
This section describes the following.
- [How to open]
- [Description of each area]
- [Function buttons]
[How to open]
- On the [Hook Transaction Settings] tab of the Property panel, click the [...] button displayed by selecting one of the
property in the [Hook Transaction Settings] category.
[Description of each area]
(1) [Text] area
Input/modify character strings in this area.
[Function buttons]
Button
Function
OK
Sets the input character strings to the caller panel/dialog box and closes this dialog box.
Cancel
Closes this dialog box.
Help
Displays the help for this dialog box.
R20UT2867EJ0100 Rev.1.00
Feb 01, 2014
Page 319 of 572
CubeSuite+ V2.02.00
APPENDIX A WINDOW REFERENCE
Action Events dialog box
This tab is used to configure action events (see "2.14 Set an Action into Programs").
This dialog box appears only when connected to the debug tool.
Caution
Also see "2.15.7 Notes for setting events" for details on Printf events (e.g. limits on the number of
enabled events).
Figure A-40. Action Events Dialog Box
(1)
(2)
[Function buttons]
This section describes the following.
- [How to open]
- [Description of each area]
- [Function buttons]
[How to open]
- On the Editor panel, move the caret to the line where you wish to set an action event, then select [Register Action
Event...] from the context menu.
- On the Disassemble panel, move the caret to the address where you wish to set an action event, then select
[Register Action Event...] from the context menu.
- On the Events panel, select an action event, then select [Edit Condition...] from the context menu.
[Description of each area]
(1) Tab selection area
Select a tab to switch the type of an action event to be set.
This dialog box has the following two tabs.
R20UT2867EJ0100 Rev.1.00
Feb 01, 2014
Page 320 of 572
CubeSuite+ V2.02.00
APPENDIX A WINDOW REFERENCE
- [Printf event] tab
Caution
If this dialog box is opened by selecting [Edit Condition...] from the context menu, this area
does not appear.
(2) Event condition setting area
Use this area to configure detailed condition of an action event.
For details on how to setup an action event, see the section explaining the corresponding tab.
[Function buttons]
Button
Function
OK
Finishes configuring the action event, and sets it at the position specified in this dialog box.
Cancel
Cancels the action event settings and closes this dialog box.
Help
Displays the help for this dialog box.
R20UT2867EJ0100 Rev.1.00
Feb 01, 2014
Page 321 of 572
CubeSuite+ V2.02.00
APPENDIX A WINDOW REFERENCE
[Printf event] tab
Use this tab to configure Printf events as action events (see "2.14 Set an Action into Programs").
A Printf event momentarily stops the execution of the program at a specified location, and executes the printf command
via software processing. When a Printf event is set, the program momentarily stops immediately before executing the
command at the location where this event is set, and the value of the variable expression specified in this dialog box is
output to the Output panel.
This dialog box appears only when connected to the debug tool.
Figure A-41. Action Events Dialog Box: [Printf event] Tab
(1)
(2)
(3)
[Function buttons]
This section describes the following.
- [How to open]
- [Description of each area]
- [Function buttons]
[How to open]
- On the Editor panel, move the caret to the line where you wish to set a Printf event, then select [Register Action
Event...] from the context menu.
- On the Disassemble panel, move the caret to the address where you wish to set a Printf event, then select
[Register Action Event...] from the context menu.
- On the Events panel, select a Printf event, then select [Edit Condition...] from the context menu.
[Description of each area]
(1) [Output string] area
Type in the string to add to the Output panel directly via the keyboard (up to 1024 characters).
R20UT2867EJ0100 Rev.1.00
Feb 01, 2014
Page 322 of 572
CubeSuite+ V2.02.00
APPENDIX A WINDOW REFERENCE
Note that the output string can only be one line (spaces allowed).
(2) [Variable expression] area
Specify the variable expression(s) for the Printf event.
Type a variable expression directly into the text box (up to 1024 characters).
You can specify up to 10 variable expressions for a single Printf event by separating them with commas (",").
If this dialog box opens with a variable expression selected in the Editor panel /Disassemble panel, the selected
variable expression appears as the default.
The basic input format that can be specified as variable expressions and the values output by Printf event are as
follows:
Table A-14. Relationship between Variable Expressions and Output Value (Printf Event)
Variable Expression
Output Value
Variable name of C language
Value of C language variable
Variable expression [Variable expression]
Element of array
Variable expression.Member name
Member of structure/union
Variable expression -> Member name
Member of structure/union that pointer designates
*Variable expression
Value of pointer variable
CPU register name
Value of the CPU register
SFR name
SFR value
Label name, EQU symbol name and immediate
Values of label, EQU symbol and immediate address
address
Bit symbol
Bit symbol value
Caution
A variable expression including an arithmetic expression (e.g. "+"/"-") cannot be specified.
Remark
A symbol name at the current caret position can be complemented by pressing the [Ctrl] + [Space] key
in this text box (see "2.19.2 Symbol name completion function").
(3) [Address] area
Specify the address at which to set the Printf event.
You can either type an address expression directly into the text box (up to 1024 characters), or select them from
the input history via the drop-down list (up to 10 items). The address of the location currently being specified is
displayed by default.
Remark
A symbol name at the current caret position can be complemented by pressing the [Ctrl] + [Space] key
in this text box (see "2.19.2 Symbol name completion function").
Note that the output result format by the Printf event in the Output panel are as follows:
Figure A-42. Output Result Format of Printf Event
Specified-characters
Variable-expression-1 = Value-1, Variable-expression-2 = Value-2, ...
Specified characters
Characters specified with [Output string]
Variable expression 1 - 10
Characters specified with [Variable expression]
R20UT2867EJ0100 Rev.1.00
Feb 01, 2014
Page 323 of 572
CubeSuite+ V2.02.00
APPENDIX A WINDOW REFERENCE
Value 1 - 10
Value of variable corresponds to " Variable expression 1 - 10 ".
The value is displayed in the default notation (see "Table A-9. Display Format of WatchExpressions (Default)") according to the type of the variable (note, however, that "?" will be
displayed if the specified variable expression cannot be obtained). Moreover, the value in
hexadecimal number enclosing with "()" is also displayed (note, however, that "-" will be
displayed if the value cannot be displayed in that notation).
[Function buttons]
Button
OK
Function
Finishes configuring the Printf event, and sets it at the caret position in the Editor panel/
Disassemble panel.
Cancel
Cancels the Printf event settings and closes this dialog box.
Help
Displays the help for this dialog box.
R20UT2867EJ0100 Rev.1.00
Feb 01, 2014
Page 324 of 572
CubeSuite+ V2.02.00
APPENDIX A WINDOW REFERENCE
Encoding dialog box
This dialog box is used to select a file-encoding.
Figure A-43. Encoding Dialog Box
(1)
[Function buttons]
This section describes the following.
- [How to open]
- [Description of each area]
- [Function buttons]
[How to open]
- From the [File] menu, open the Open File dialog box by selecting [Open with Encoding...], and then click the
[Open] button in the dialog box.
[Description of each area]
(1) [Available encodings]
Select the encoding to be set from the drop-down list.
The encoding of the selected file is selected by default.
[Function buttons]
Button
Function
OK
Opens the selected file in the Open File dialog box using a selected file encoding.
Cancel
Not open the selected file in the Open File dialog box and closes this dialog box.
Help
Displays the help for this dialog box.
R20UT2867EJ0100 Rev.1.00
Feb 01, 2014
Page 325 of 572
CubeSuite+ V2.02.00
APPENDIX A WINDOW REFERENCE
Save Settings dialog box
This dialog box is used to specify the encoding and the new line code of the file being edited in the Editor panel.
Remark
The target file name is displayed on the title bar.
Figure A-44. Save Settings Dialog Box
(1)
(2)
(3)
[Function buttons]
This section describes the following.
- [How to open]
- [Description of each area]
- [Function buttons]
[How to open]
- With the Editor panel in focus, select [File name Save Settings…] from the [File] menu.
[Description of each area]
(1) [Encode] area
Select the encoding to be set from the drop-down list.
The items of the drop-down list are displayed according to the following sequence.
Note that the same encoding and encoding which are not supported by the current OS will not be displayed.
- Current encoding of the file (default)
- Default encoding of the current OS
- Most recently used encodings (maximum 4)
- Popular encodings for current locale
(e.g. for United States locale it will be:
- Western European (Windows)
- Unicode (UTF-8)
- All other encodings supported by the OS (in alphabetical order)
(2) [New line code] area
Specify the new line code to be set from the drop-down list.
Either of the following can be selected.
- Windows (CR LF)
- Macintosh (CR)
- Unix (LF)
R20UT2867EJ0100 Rev.1.00
Feb 01, 2014
Page 326 of 572
CubeSuite+ V2.02.00
APPENDIX A WINDOW REFERENCE
An active newline entry is selected by default.
(3) [Reload the file with these settings]
Reloads the file with the specified encoding and new line code when the [OK] button is clicked.
Does not reload the file when the [OK] button is clicked (default).
[Function buttons]
Button
OK
Function
Sets the selected encoding and newline code to the target file and closes this dialog box.
If [Reload the file with these settings] is selected, sets the selected encoding and newline code to
the target file and reloads the file. And then closes this dialog box.
Cancel
Cancels the setting and closes this dialog box.
Help
Displays the help for this dialog box.
R20UT2867EJ0100 Rev.1.00
Feb 01, 2014
Page 327 of 572
CubeSuite+ V2.02.00
APPENDIX A WINDOW REFERENCE
Bookmarks dialog box
This dialog box is used to display the position where a bookmark is to be set or to delete a bookmark.
Figure A-45. Bookmarks Dialog Box
(1)
[Function buttons]
The following items are explained here.
- [How to open]
- [Description of each area]
- [Function buttons]
[How to open]
- Click the
button on the bookmark toolbar.
- From the [Edit] menu, select [Bookmark] >> [List Bookmarks...].
- On the Editor panel, select [Bookmark] >> [List Bookmarks...] from the context menu.
[Description of each area]
(1) Bookmark list area
Display a list of bookmarks that have been registered.
The bookmarks are listed alphabetically by file name for [Bookmark]. Bookmarks in the same file are listed in line
number order.
When a bookmark is added to the Editor panel, a bookmark function is added.
In the bookmark list area, double-clicking on a line moves a caret to the corresponding position for the bookmark.
(a) [File]
Display a file name (without any path) registered as a bookmark.
(b) [Line Number]
Display a line number registered as a bookmark.
(c) [Path]
Display a file path registered as a bookmark.
(d) Buttons
View
Moves a caret to the selected position for the bookmark.
However, this button is disabled when no bookmark is selected, two or more bookmarks are
selected, or no bookmark is registered.
R20UT2867EJ0100 Rev.1.00
Feb 01, 2014
Page 328 of /401
CubeSuite+ V2.02.00
Remove
APPENDIX A WINDOW REFERENCE
Removes a selected bookmark. When two or more bookmarks are selected, all of those selected
are removed.
However, this button is disabled when no bookmark is selected or no bookmark is registered.
Remove All
Removes all the registered bookmarks.
This button is disabled when no bookmark is registered.
Caution
Registered bookmarks are not deleted even if the Editor panel is closed.
Note, however, that if the Editor panel in which a file that has never been saved is being
displayed is closed, then registered bookmarks will be deleted.
[Function buttons]
Button
Previous
Function
Moves a caret to the position of the bookmark previous to the selected bookmark.
This button is disabled in the following cases.
- A bookmark shown in the first line has been selected.
- No bookmark is selected.
- Two or more bookmarks are selected.
- No bookmark is registered.
- Only one bookmark is registered.
Next
Moves a caret to the position of the bookmark next to the selected bookmark.
This button is disabled in the following cases.
- A bookmark shown in the last line has been selected.
- No bookmark is selected.
- Two or more bookmarks are selected.
- No bookmark is registered.
- Only one bookmark is registered.
Close
Closes this dialog box.
Help
Displays the help for this dialog box.
R20UT2867EJ0100 Rev.1.00
Feb 01, 2014
Page 329 of /401
CubeSuite+ V2.02.00
APPENDIX A WINDOW REFERENCE
Column Number Settings dialog box
This dialog box is used to set the number of view columns of memory values on the Memory panel.
Figure A-46. Column Number Settings Dialog Box
(1)
[Function buttons]
This section describes the following.
- [How to open]
- [Description of each area]
- [Function buttons]
[How to open]
- On the Memory panel, select [View] >> [Column Number Settings…] from the context menu.
[Description of each area]
(1) [Column Number] area
Directly enter a decimal value as the number of columns you want to display.
The settable range depends on [Size Notation] currently being set on the Memory panel, as follows:
Size Notation
Settable Range
4 Bits
2 - 512rNote
1 Byte
1 - 256
2 Bytes
1 - 128
4 Bytes
1 - 64
8 Bytes
1 - 32
Note Only an even number is specifiable (if an odd number is specified, then it will be changed to a value one
greater than such odd number).
[Function buttons]
Button
Function
OK
Displays memory values in the specified number of columns.
Cancel
Cancels the settings and closes this dialog box.
Help
Displays the help for this dialog box.
R20UT2867EJ0100 Rev.1.00
Feb 01, 2014
Page 330 of 572
CubeSuite+ V2.02.00
APPENDIX A WINDOW REFERENCE
Address Offset Settings dialog box
This dialog box is used to set an offset value of the start address in the address area on the Memory panel.
Figure A-47. Address Offset Settings Dialog Box
(1)
[Function buttons]
This section describes the following.
- [How to open]
- [Description of each area]
- [Function buttons]
[How to open]
- On the Memory panel, select [View] >> [Address Offset Value Settings...] from the context menu.
[Description of each area]
(1) [Address Offset Value] area
Directly enter a hexadecimal value as an offset value for the address display.
The settable range depends on the number of bytes of the memory currently being displayed in a line on the
Memory panel, as follows:
- Settable range:
0x0 - ("Set value of [Size Notation]" x "The number of view columns") -1
Example When "Set value of [Size Notation]" is 1 byte and "The number of view columns" is 16 columns:
Offset Value
0x0 (default)
Displayed Content of Address Area
0000
0010
0020
0x1
0001
0011
0021
0x2
0002
0012
0022
[Function buttons]
Button
Function
OK
Displays memory addresses with the specified offset value.
Cancel
Cancels the settings and closes this dialog box.
Help
Displays the help for this dialog box.
R20UT2867EJ0100 Rev.1.00
Feb 01, 2014
Page 331 of 572
CubeSuite+ V2.02.00
APPENDIX A WINDOW REFERENCE
Memory Initialize dialog box
This dialog box is used to initialize memory (see "(6) Modify the memory contents in batch (initialize)").
The memory area in the specified address range is repeatedly overwritten with the specified initial data pattern.
Figure A-48. Memory Initialize Dialog Box
(1)
(2)
[Function buttons]
This section describes the following.
- [How to open]
- [Description of each area]
- [Function buttons]
[How to open]
- On the Memory panel, select [Fill…] from the context menu.
[Description of each area]
(1) Range specification area
Specify the range of memory address to initialize via the [Start address/symbol] and [End address/symbol]. You
can either type address expressions directly into the text boxes (up to 1024 characters), or select them from the
input history via the drop-down list (up to 10 items).
The results of calculating the address expressions you have entered are treated as start and end addresses,
respectively.
Note that address values greater than the microcontroller address space cannot be specified.
Caution
You cannot specify the range of address aligned across the different endian area.
Remark
A symbol name at the current caret position can be complemented by pressing the [Ctrl] + [Space] key
in each text box (see "2.19.2 Symbol name completion function").
(2) [Initialize data] area
Specify the initial value(s) with which to overwrite the memory.
You can either type the initial value into the text box directly in hexadecimal number (the value need not start with
"0x"), or select one from the input history via the drop-down list (up to 10 items).
You can specify more than one initial value. Specify up to 16 values of up to 4 bytes (8 characters) each,
separated by spaces.
Each initial value is parsed from the end of the string, with each two characters interpreted as a byte.
If the string has an odd number of characters, then the first character is interpreted as one byte.
Note that if a initial value consists of more than one byte, then the target memory is overwritten with the value
converted into an array of bytes of the specified address range's endian, as follows.
R20UT2867EJ0100 Rev.1.00
Feb 01, 2014
Page 332 of 572
CubeSuite+ V2.02.00
APPENDIX A WINDOW REFERENCE
Input Character Strings
How Data is Overwritten (in Bytes)
(Initial Value)
Little Endian
Big Endian
1
01
01
0 12
00 12
00 12
00 012 345
00 12 00 45 03
00 00 12 03 45
000 12 000345
00 00 12 45 03 00
00 00 12 00 03 45
[Function buttons]
Button
OK
Function
The memory area in the specified address range is repeatedly overwritten with the specified initial
data pattern. If the end address is reached in the middle of the pattern, then writing ends at that
point.
Cancel
Cancels the memory initialization and closes this dialog box.
Help
Displays the help for this dialog box.
R20UT2867EJ0100 Rev.1.00
Feb 01, 2014
Page 333 of 572
CubeSuite+ V2.02.00
APPENDIX A WINDOW REFERENCE
Memory Search dialog box
This dialog box is used to search memory (see "(5) Search the memory contents").
Search in either the Memory value area or Character strings area where the caret was located in the Memory panel
immediately before this dialog box opened.
Figure A-49. Memory Search Dialog Box
(1)
(2)
(3)
[Function buttons]
This section describes the following.
- [How to open]
- [Description of each area]
- [Function buttons]
[How to open]
- On the Memory panel, select [Find…] from the context menu.
[Description of each area]
(1) [Search Data] area
Specify data to search.
You can either type a value directly into the text box (up to 256 bytes), or select one from the input history via the
drop-down list (up to 10 items).
If the search is performed in the Memory value area of the Memory panel, the value must be entered in the same
display format (notation and size) as that area.
If the search is performed in the Character strings area, then the target of the search must be a string. The
specified string is converted into the encoding format displayed in that area, and searched for.
If a memory value was selected immediately prior to opening this dialog box, then that value will appear as default.
(2) [Search Range] area
Select the range to search from the following drop-down list.
Specify address range
Searches in the address range specified in the [Address] area.
Memory mapping
Searches within the selected memory mapping range.
This list item displays the memory mappings set in the Memory Mapping dialog box (except
the non-mapped area).
Display format: <memory type> <address range> <size>
R20UT2867EJ0100 Rev.1.00
Feb 01, 2014
Page 334 of 572
CubeSuite+ V2.02.00
APPENDIX A WINDOW REFERENCE
(3) [Address] area
This item is only enabled if [Specify address range] is selected in the [Search Range] area.
Specify the range of memory address to search via the start and end addresses. You can either type address
expressions directly into the text boxes (up to 1024 characters), or select them from the input history via the dropdown list (up to 10 items).
The results of calculating the address expressions you have entered are treated as start and end addresses,
respectively.
Note that if an address value greater than the microcontroller address space is specified, the high-order address
value is masked.
In addition, an address value greater than the value expressed within 32 bits cannot be specified.
Remarks 1.
A symbol name at the current caret position can be complemented by pressing the [Ctrl] + [Space]
key in each text box (see "2.19.2 Symbol name completion function").
2.
If the start address field is left blank, it is treated as if "0x0" were specified.
3.
If the end address field is left blank, then it is treated as if the maximum value in the
microcontroller's address space were specified.
[Function buttons]
Button
Search Backward
Function
Searches upward within the range specified in the [Address] area or the [Search Range] area.
The location found by the search is selected in the Memory panel.
Note that if an illegal value is specified or while the program is being executed, a message will
appear, and the memory search will not be performed.
If focus moves to this dialog box while the memory panel is hidden or another panel has focus,
then this button will be disabled.
Search Forward
Searches downward within the range specified in the [Address] area or the [Search Range] area.
The location found by the search is selected in the Memory panel.
Note that if an illegal value is specified or while the program is being executed, a message will
appear, and the memory search will not be performed.
If focus moves to this dialog box while the memory panel is hidden or another panel has focus,
then this button will be disabled.
Cancel
Cancels the memory search and closes this dialog box.
Help
Displays the help for this dialog box.
R20UT2867EJ0100 Rev.1.00
Feb 01, 2014
Page 335 of 572
CubeSuite+ V2.02.00
APPENDIX A WINDOW REFERENCE
Print Address Range Settings dialog box
This dialog box is used to specify the address range to print the contents of the Disassemble panel.
Figure A-50. Print Address Range Settings Dialog Box
(1)
[Function buttons]
This section describes the following.
- [How to open]
- [Description of each area]
- [Function buttons]
[How to open]
- On the Disassemble panel, select [Print...] from the [File] menu.
[Description of each area]
(1) Range specification area
Select a range to print from the following option buttons.
(a) [Current display area] (default)
Prints only the contents of the Disassemble panel currently being displayed.
(b) [Current selected area]
Prints only the range currently being selected in the Disassemble panel.
Note, however, that this option button will be disabled when nothing is selected in the Disassemble panel.
(c) [Range of specified]
Specify the range of address to print via [Start address] and [End address]. You can either type address
expressions directly into the text boxes (up to 1024 characters), or select them from the input history via the
drop-down list (up to 10 items).
Remark
A symbol name at the current caret position can be complemented by pressing the [Ctrl] + [Space]
key in each text box (see "2.19.2 Symbol name completion function").
R20UT2867EJ0100 Rev.1.00
Feb 01, 2014
Page 336 of 572
CubeSuite+ V2.02.00
APPENDIX A WINDOW REFERENCE
[Function buttons]
Button
OK
Function
Closes this dialog box and opens the Windows dialog box to print the contents of the
specified range of the Disassemble panel.
Cancel
Cancels the range specification and closes this dialog box.
Help
Displays the help for this dialog box.
R20UT2867EJ0100 Rev.1.00
Feb 01, 2014
Page 337 of 572
CubeSuite+ V2.02.00
APPENDIX A WINDOW REFERENCE
Print Preview window
This window is used to preview the file currently being displayed in the Editor panel before printing.
Remark
This window can be zoomed in and out by moving the mouse wheel forward or backward while holding
down the [Ctrl] key.
Figure A-51. Print Preview Window
[Toolbar]
(1)
The following items are explained here.
- [How to open]
- [Description of each area]
- [Toolbar]
- [Context menu]
[How to open]
- Focus the Editor panel, and then select [Print Preview] from the [File] menu.
[Description of each area]
(1) Preview area
This window displays a form showing a preview of how and what is printed.
The file name (fully qualified path) and the page number are displayed at the page header and page footer.
The display differs according to whether the debug tool is or is not connected, and when it is connected, to whether
the display is in normal display mode or mixed display mode. Note, however, that columns that are hidden on the
Editor panel are not displayed (these columns are not printed).
[Toolbar]
Opens the Print dialog box provided by Windows to print the current Editor panel as shown by the print preview form.
R20UT2867EJ0100 Rev.1.00
Feb 01, 2014
Page 338 of 572
CubeSuite+ V2.02.00
APPENDIX A WINDOW REFERENCE
Copies the selection into the clipboard.
Increases the size of the content.
Decreases the size of the content.
Displays the preview at 100-percent zoom (default).
Fits the preview to the width of this window.
Displays the whole page.
Displays facing pages.
[Context menu]
Increase Zoom
Increases the size of the content.
Decrease Zoom
Decreases the size of the content.
R20UT2867EJ0100 Rev.1.00
Feb 01, 2014
Page 339 of 572
CubeSuite+ V2.02.00
APPENDIX A WINDOW REFERENCE
Trace Search dialog box
This dialog box is used to search trace data (see "2.11.8 Search the trace data").
The search can be performed at the instruction or source level.
Figure A-52. Trace Search Dialog Box
(1)
(2)
[Function buttons]
This section describes the following.
- [How to open]
- [Description of each area]
- [Function buttons]
[How to open]
- On the Trace panel, select
button on the toolbar.
- On the Trace panel, select [Find…] from the context menu.
[Description of each area]
(1) Tab selection area
Select a tab to switch the level of the search.
This dialog box has the following two tabs.
- [Instruction Level] tab
- [Source Level] tab
(2) Search parameter setup area
Use this area to configure detailed search parameters.
R20UT2867EJ0100 Rev.1.00
Feb 01, 2014
Page 340 of 572
CubeSuite+ V2.02.00
APPENDIX A WINDOW REFERENCE
For details on the window elements and how to configure the parameters for a particular tab, see the section for the
tab in question.
[Function buttons]
Button
Search Backward
Function
Searches upward (in the direction of larger to smaller numbers) within the specified range.
Search matches are selected in the Trace panel.
Note that if an illegal value is specified or while the program is being executed, a message will
appear, and the trace data search will not be performed.
If focus moves to this dialog box while the Trace panel is hidden or another panel has focus, then
this button will be disabled.
Search Forward
Searches forward (in the direction of smaller to larger numbers) within the specified range.
Search matches are selected in the Trace panel.
Note that if an illegal value is specified or while the program is being executed, a message will
appear, and the trace data search will not be performed.
If focus moves to this dialog box while the Trace panel is hidden or another panel has focus, then
this button will be disabled.
Cancel
Cancels the trace data search and closes this dialog box.
Help
Displays the help for this dialog box.
R20UT2867EJ0100 Rev.1.00
Feb 01, 2014
Page 341 of 572
CubeSuite+ V2.02.00
APPENDIX A WINDOW REFERENCE
[Instruction Level] tab
Use this tab to search the acquired trace data at the instruction level.
Caution
If the Trace panel is set to Source display mode, then performing an instruction level search via this
tab will not perform the target search correctly. In order to perform an instruction level search, set
the mode to Mixed display mode or Disassemble display mode.
Figure A-53. Trace Search Dialog Box: [Instruction Level] Tab
(1)
(2)
[Function buttons]
This section describes the following.
- [How to open]
- [Description of each area]
- [Function buttons]
[How to open]
- On the Trace panel, select
button on the toolbar.
- On the Trace panel, select [Find…] from the context menu.
[Description of each area]
(1) [Search condition] area
(a) [Fetch Address]
Specify the fetch address if it is a required search parameter.
R20UT2867EJ0100 Rev.1.00
Feb 01, 2014
Page 342 of 572
CubeSuite+ V2.02.00
APPENDIX A WINDOW REFERENCE
You can either type address expressions directly into the text boxes, or select them from the input history via
the drop-down lists (up to 10 items).
The fetch address can also be specified as a range. In this case, specify a range by specifying address
expressions in both the left and right text boxes.
If the right-hand text box is blank or contains the text [(Input value when range is specified)], then the fixed
address specified in the left-hand text box will be searched.
Note that if an address value greater than the microcontroller address space is specified, the high-order
address value is masked.
In addition, an address value greater than the value expressed within 32 bits cannot be specified.
(b) [Mnemonic]
Specify the mnemonic if it is a required search parameter.
The specified character strings in this area are searched within the [Source/Disassemble] area of the Trace
panel.
You can either type a mnemonic directly into the text boxes, or select one from the input history via the dropdown list (up to 10 items).
Searches are case-insensitive, and partial matches are also allowed.
(c) [Access Address] [IECUBE][Simulator]
Specify the access address if it is a required search parameter.
You can either type address expressions directly into the text boxes, or select them from the input history via
the drop-down lists (up to 10 items).
The access address can also be specified as a range. In this case, specify a range by specifying address
expressions in both the left and right text boxes.
If the right-hand text box is blank or contains the text [(Input value when range is specified)], then the fixed
address specified in the left-hand text box will be searched.
Note that if an address value greater than the microcontroller address space is specified, the high-order
address value is masked.
In addition, an address value greater than the value expressed within 32 bits cannot be specified.
(d) [Access Status] [IECUBE][Simulator]
This item is only enabled if a value for [Access Address] [IECUBE][Simulator] is specified.
Select the access type from the following drop-down list.
Select [No Specification] if you do not wish to limit access types.
(No Specification)
Read/Write
Read
Write
Vector Read
DMA
(e) [Data] [IECUBE][Simulator]
This item is only enabled if a value for [Access Address] [IECUBE][Simulator] is specified.
Specify the access data.
You can either type the data directly into the text boxes (in hexadecimal number), or select it from the input
history via the drop-down list (up to 10 items).
R20UT2867EJ0100 Rev.1.00
Feb 01, 2014
Page 343 of 572
CubeSuite+ V2.02.00
APPENDIX A WINDOW REFERENCE
The data can also be specified as a range. In this case, specify a range by specifying data in both the left and
right text boxes.
If the right-hand text box is blank or contains the text [(Input value when range is specified)], then the fixed data
specified in the left-hand text box will be searched.
(2) [Search range] area
(a) [Number]
Specify the range within the trace data to search via the number displayed in the [Number] area of the Trace
panel.
Specify the starting number in the left text box, and the ending number in the right text box ("0" to "last number"
are specified by default).
You can either type the numbers directly into the text boxes (in base-10 format), or select them from the input
history via the drop-down lists (up to 10 items).
If the left-hand text box is left blank, it is treated as if "0" were specified.
If the right-hand text box is left blank, it is treated as if the last number were specified.
[Function buttons]
Button
Search Backward
Function
Searches upward (in the direction of larger to smaller numbers) within the specified range.
Search matches are selected in the Trace panel.
Note that if an illegal value is specified, a message will appear, and the trace data search will not
be performed.
If focus moves to this dialog box while the Trace panel is hidden or another panel has focus, then
this button will be disabled.
Search Forward
Searches forward (in the direction of smaller to larger numbers) within the specified range.
Search matches are selected in the Trace panel.
Note that if an illegal value is specified, a message will appear, and the trace data search will not
be performed.
If focus moves to this dialog box while the Trace panel is hidden or another panel has focus, then
this button will be disabled.
Cancel
Cancels the trace data search and closes this dialog box.
Help
Displays the help for this dialog box.
R20UT2867EJ0100 Rev.1.00
Feb 01, 2014
Page 344 of 572
CubeSuite+ V2.02.00
APPENDIX A WINDOW REFERENCE
[Source Level] tab
Use this tab to search the acquired trace data at the source level.
Caution
If the Trace panel is set to Disassemble display mode, then performing an source level search via
this tab will not perform the target search correctly. In order to perform an source level search, set
the mode to Mixed display mode or Source display mode.
Figure A-54. Trace Search Dialog Box: [Source Level] Tab
(1)
(2)
(3)
[Function buttons]
This section describes the following.
- [How to open]
- [Description of each area]
- [Function buttons]
[How to open]
- On the Trace panel, select
button on the toolbar.
- On the Trace panel, select [Find…] from the context menu.
[Description of each area]
(1) [Search object] area
Select the search object from the following option buttons.
The execution part is retrieved specifying
Finds the execution location in the specified source line (default).
the source line
Only [Source and Line] will be enabled as a search parameter.
R20UT2867EJ0100 Rev.1.00
Feb 01, 2014
Page 345 of 572
CubeSuite+ V2.02.00
APPENDIX A WINDOW REFERENCE
The execution part is retrieved specifying
Finds the execution location in the specified function.
the function
Only [Function Name] will be enabled as a search parameter.
The execution part is retrieved specifying
Finds the location at which the specified global variable was accessed.
the global variable
Only [Variable Name] [IECUBE][Simulator], [Kind] [IECUBE][Simulator] and
[IECUBE][Simulator]
[Value] [IECUBE][Simulator] will be enabled as a search parameters.
(2) [Search condition] area
(a) [Source and Line]
This item is only enabled if [The execution part is retrieved specifying the source line] is selected.
The specified character strings in this area are searched within the [Line/Address] area of the Trace panel.
You can either type the character strings of the source line to be find directly into the text box, or select them
from the input history via the drop-down list (up to 10 items).
Searches are case-insensitive, and only complete matches are retrieved.
Examples 1.
main.c#40
2.
main.c
3.
main
(b) [Function Name]
This item is only enabled if [The execution part is retrieved specifying the function] is selected.
You can either type the function name to be find directly into the text box, or select it from the input history via
the drop-down list (up to 10 items).
Searches are case-insensitive, and only complete matches are retrieved.
(c) [Variable Name] [IECUBE][Simulator]
This item is only enabled if [The execution part is retrieved specifying the global variable] is selected.
You can either type the variable name to be find directly into the text box, or select it from the input history via
the drop-down list (up to 10 items).
Searches are case-insensitive, and only complete matches are retrieved.
(d) [Kind] [IECUBE][Simulator]
This item is only enabled if [The execution part is retrieved specifying the global variable] is selected.
Select the access type ([Reference/Substitution], [Reference], or [Substitution]) from the drop-down list.
(e) [Value] [IECUBE][Simulator]
This item is only enabled if [The execution part is retrieved specifying the global variable] is selected.
Specify the accessed variable value in hexadecimal number.
You can either type a variable value directly into the text box, or select one from the input history via the dropdown list (up to 10 items).
The variable value can also be specified as a range. In this case, specify a range by specifying variable values
in both the left and right text boxes.
If the right-hand text box is blank, then access locations with the fixed variable values specified in the left-hand
text box will be searched for.
R20UT2867EJ0100 Rev.1.00
Feb 01, 2014
Page 346 of 572
CubeSuite+ V2.02.00
APPENDIX A WINDOW REFERENCE
(3) [Search range] area
(a) [Number]
Specify the range within the trace data to search via the number displayed in the [Number] area of the Trace
panel.
Specify the starting number in the left text box, and the ending number in the right text box ("0" to "last number"
are specified by default).
You can either type the numbers directly into the text boxes (in base-10 format), or select them from the input
history via the drop-down lists (up to 10 items).
If the left-hand text box is left blank, it is treated as if "0" were specified.
If the right-hand text box is left blank, it is treated as if the last number were specified.
[Function buttons]
Button
Search Backward
Function
Searches upward (in the direction of larger to smaller numbers) within the specified range.
Search matches are selected in the Trace panel.
Note that if an illegal value is specified, a message will appear, and the trace data search will not
be performed.
If focus moves to this dialog box while the Trace panel is hidden or another panel has focus, then
this button will be disabled.
Search Forward
Searches forward (in the direction of smaller to larger numbers) within the specified range.
Search matches are selected in the Trace panel.
Note that if an illegal value is specified, a message will appear, and the trace data search will not
be performed.
If focus moves to this dialog box while the Trace panel is hidden or another panel has focus, then
this button will be disabled.
Cancel
Cancels the trace data search and closes this dialog box.
Help
Displays the help for this dialog box.
R20UT2867EJ0100 Rev.1.00
Feb 01, 2014
Page 347 of 572
CubeSuite+ V2.02.00
APPENDIX A WINDOW REFERENCE
Combination Condition dialog box [E1][E20]
This dialog box is used to display and modify detailed information on the combination break event selected in the
Events panel.
Figure A-55. Combination Condition Dialog Box
(1)
(2)
(3)
(4)
[Function buttons]
This section describes the following.
- [How to open]
- [Description of each area]
- [Function buttons]
[How to open]
- On the Events panel, move the caret to the combination break event [E1][E20], then select [Edit Condition...] from
the context menu.
[Description of each area]
(1) Tab selection area
In this product version, the [Break] tab is displayed in this area.
(2) [Combination] area
Select the combination condition from the following drop-down list.
OR
The condition is satisfied when one of the events listed in the [Object event] area is encountered
(default).
Sequential
The condition is satisfied when the events listed in the [Object event] area are encountered in the
specified sequence.
R20UT2867EJ0100 Rev.1.00
Feb 01, 2014
Page 348 of 572
CubeSuite+ V2.02.00
Caution
APPENDIX A WINDOW REFERENCE
When [OR] is selected, up to two break events can be specified.
When [Sequential] is selected, break event can be specified for the 1st to 2nd position.
(3) [Object event] area
(a) Display of the list
This area lists the detailed information on the object events to be combined.
When [Sequential] is specified in the [Combination] area, numbers are allocated to each item from the top of
the list to indicate the order in which the conditions are to be satisfied.
(b) Buttons
The following buttons are enabled only when [Sequential] is selected in the [Combination] area.
Button
Function
Up
Moves the event serial number upward in the target event list.
Down
Moves the event serial number downward in the target event list.
R Event
This button is always invalid.
(4) [Reset event] area
(a) Display of the list
This area is always invalid.
[Function buttons]
Button
OK
Function
Applies the detailed settings specified in the dialog box to the combination break and closes this
dialog box.
Cancel
Cancels the save and closes this dialog box.
Help
Displays the help for this dialog box.
R20UT2867EJ0100 Rev.1.00
Feb 01, 2014
Page 349 of 572
CubeSuite+ V2.02.00
APPENDIX A WINDOW REFERENCE
Detail dialog box (for execution events)
This dialog box is used to display and modify detailed information on an execution-related event selected in the Events
panel.
Note that the execution-related events refer to the following events in the Events panel.
- Hardware Break event (execution type)
- Execution-related break event in detailed information on Combination Break event [E1][E20]
- Execution-related event as start and end condition in detailed information on Trace event
- Execution-related event as start and end condition in detailed information on Timer Result event [IECUBE][Simulator]
Figure A-56. Detail Dialog Box (for Execution Events) [IECUBE]
[Toolbar]
(1)
(2)
[Function buttons]
Figure A-57. Detail Dialog Box (for Execution Events) [E1][E20][EZ Emulator]
[Toolbar]
(1)
(2)
[Function buttons]
Figure A-58. Detail Dialog Box (for Execution Events) [Simulator]
[Toolbar]
(1)
(2)
[Function buttons]
R20UT2867EJ0100 Rev.1.00
Feb 01, 2014
Page 350 of 572
CubeSuite+ V2.02.00
APPENDIX A WINDOW REFERENCE
This section describes the following.
- [How to open]
- [Description of each area]
- [Toolbar]
- [Function buttons]
[How to open]
- On the Events panel, move the caret to any one of the following events, and then select [Edit Condition...] from the
context menu.
- Hardware Break event (execution type)
- Execution-related break event in detailed information on Combination Break event [E1][E20]
- Execution-related event as start and end condition in detailed information on Trace event
- Execution-related event as start and end condition in detailed information on Timer Result event
[IECUBE][Simulator]
[Description of each area]
(1) Event conditions setting area
(a) [Address Condition]
Specify the address condition.
Compare condition
Specify the condition to compare address.
[IECUBE]
Default
Specified address (==)
Modifying
Select from the drop-down list
Available
Specified address (==)
[Simulator]
values
Specifies the address with [Address].
Greater than or equal to (>=)
Less than or equal to (<=)
Inside the range (<=Values<=)
Outside the range !(<=Values<=)
Address
Specifies the range with [Start address] and
[End address].
Specify the address.
[IECUBE][Simulator]
This item appears only when [Specified address (==)], [Greater than or equal to (>=)] or
[Less than or equal to (<=)] is selected in [Compare condition].
Default
The current set value
Modifying
Directly enter from the keyboard.
Available
Address expression within the valid range
values
R20UT2867EJ0100 Rev.1.00
Feb 01, 2014
Page 351 of 572
CubeSuite+ V2.02.00
APPENDIX A WINDOW REFERENCE
Start address
Specify the start address.
[IECUBE]
[IECUBE][Simulator]
[Simulator]
This item appears only when [Inside the range (<=Values<=)] or [Outside the range
!(<=Values<=)] is selected in [Compare condition].
Default
The current set value
Modifying
Directly enter from the keyboard.
Available
Address expression within the valid range
values
End address
Specify the end address.
[IECUBE]
[IECUBE][Simulator]
[Simulator]
This item appears only when [Inside the range (<=Values<=)] or [Outside the range
!(<=Values<=)] is selected in [Compare condition].
Default
The current set value
Modifying
Directly enter from the keyboard.
Available
Address expression within the valid range
values
Use the address
mask
Specify whether to specify an address mask.
Default
No
Modifying
Select from the drop-down list
Available
Yes
Specifies an address mask.
No
Does not specify an address mask.
[Simulator]
values
Mask value
Specify the value of address mask.
[Simulator]
This item appears only when [Use the address mask] is set to [Yes].
Default
The current set value
Modifying
Directly enter from the keyboard.
Available
Hexadecimal number up to five digits
values
(b) [Pass Count] [IECUBE][Simulator]
Specify the pass count condition.
Pass count
Specify a pass count.
The relevant event occurs when the event condition is met as many times as the specified
pass count.
Default
1
Modifying
Directly enter from the keyboard.
Available
1 to 65535 in decimal number
values
Caution
[IECUBE]
A value other than "1" cannot be specified as the pass count condition for an executionrelated event (before execution).
(2) Description area
This area displays a simple description of the item selected in the Event conditions setting area.
R20UT2867EJ0100 Rev.1.00
Feb 01, 2014
Page 352 of 572
CubeSuite+ V2.02.00
APPENDIX A WINDOW REFERENCE
[Toolbar]
Displays all categories in the Event conditions setting area.
Hides categories in the Event conditions setting area and rearranges only setting items in the ascending
order
This button is always invalid.
[Function buttons]
Button
OK
Function
Applies detailed settings made in this dialog box to execution-related events and closes this dialog
box.
Cancel
Cancels the save and closes this dialog box.
Help
Displays the help for this dialog box.
R20UT2867EJ0100 Rev.1.00
Feb 01, 2014
Page 353 of 572
CubeSuite+ V2.02.00
APPENDIX A WINDOW REFERENCE
Detail dialog box (for access events)
This dialog box is used to display and modify detailed information on an access-related event selected in the Events
panel.
Note that the access-related events refer to the following events in the Events panel.
- Hardware Break event (access type)
- Access-related break event in detailed information on Combination Break event [E1][E20]
- Access-related event as start and end condition [E1][E20] in detailed information on Trace event
- Access-related event in detailed information on Point Trace event
Figure A-59. Detail Dialog Box (for Access Events) [IECUBE]
[Toolbar]
(1)
(2)
[Function buttons]
Figure A-60. Detail Dialog Box (forAccess Events) [E1][E20][EZ Emulator]
[Toolbar]
(1)
(2)
[Function buttons]
R20UT2867EJ0100 Rev.1.00
Feb 01, 2014
Page 354 of 572
CubeSuite+ V2.02.00
APPENDIX A WINDOW REFERENCE
Figure A-61. Detail Dialog Box (forAccess Events) [Simulator]
[Toolbar]
(1)
(2)
[Function buttons]
This section describes the following.
- [How to open]
- [Description of each area]
- [Toolbar]
- [Function buttons]
[How to open]
- On the Events panel, move the caret to any one of the following events, and then select [Edit Condition...] from the
context menu.
- Hardware Break event (access type)
- Access-related break event in detailed information on Combination Break event [E1][E20]
- Access-related event as start and end condition [E1][E20] in detailed information on Trace event
- Access-related event in detailed information on Point Trace event
[Description of each area]
(1) Event conditions setting area
(a) [Address]
Specify the address condition.
R20UT2867EJ0100 Rev.1.00
Feb 01, 2014
Page 355 of 572
CubeSuite+ V2.02.00
Compare condition
[IECUBE]
APPENDIX A WINDOW REFERENCE
Specify the condition to compare address.
Default
The current set value
Modifying
Select from the drop-down list
Available
Specified address (==)
[Simulator]
values
Specifies the address with [Address].
Greater than or equal to (>=)
Less than or equal to (<=)
Inside the range (<=Values<=)
Outside the range !(<=Values<=)
Address
Specifies the range with [Start address]
and [End address].
Specify the address.
[IECUBE][Simulator]
This item appears only when [Specified address (==)], [Greater than or equal to (>=)] or
[Less than or equal to (<=)] is selected in [Compare condition].
Default
The current set value
Modifying
Directly enter from the keyboard.
Available
Address expression within the valid range
values
Start address
Specify the start address.
[IECUBE]
[IECUBE][Simulator]
[Simulator]
This item appears only when [Inside the range (<=Values<=)] or [Outside the range
!(<=Values<=)] is selected in [Compare condition].
Default
The current set value
Modifying
Directly enter from the keyboard.
Available
Address expression within the valid range
values
End address
Specify the end address.
[IECUBE]
[IECUBE][Simulator]
[Simulator]
This item appears only when [Inside the range (<=Values<=)] or [Outside the range
!(<=Values<=)] is selected in [Compare condition].
Default
The current set value
Modifying
Directly enter from the keyboard.
Available
Address expression within the valid range
values
Use the address
mask
Specify whether to specify an address mask.
Default
No
Modifying
Select from the drop-down list
Available
Yes
Specifies an address mask.
No
Does not specify an address mask.
[Simulator]
values
R20UT2867EJ0100 Rev.1.00
Feb 01, 2014
Page 356 of 572
CubeSuite+ V2.02.00
APPENDIX A WINDOW REFERENCE
Mask value
Specify the value of address mask.
[Simulator]
This item appears only when [Use the address mask] is set to [Yes].
Default
The current set value
Modifying
Directly enter from the keyboard.
Available
Hexadecimal number up to five digits
values
(b) [Data Condition]
Specify the data condition.
Access type
Specify the type of access.
Default
The current set value
Modifying
Select from the drop-down list
Available
Read
Sets a read access as the type of access.
Write
Sets a write access as the type of access.
Read/Write
Sets a read and a write access as the type of access.
values
Access size
Specify the access size.
Default
The current set value
Modifying
Select from the drop-down list
Available
No conditions
values
Compare condition
Sets no access size.
True for all access sizes.
1byte
Sets 1-byte as the access size.
2byte
Sets 2-byte as the access size.
Specify the condition to compare the data.
Default
The current set value
Modifying
Select from the drop-down list
Available
No conditions
Specifies no data value.
Specified value (==)
Specifies the data with [Compare data].
values
Any other value (!=)
[IECUBE][Simulator]
Greater than or equal to (>=)
[IECUBE][Simulator]
Less than or equal to (<=)
[IECUBE][Simulator]
Inside the range (<=Values<=)
Specifies the range with [Lower data] and
[IECUBE][Simulator]
[Upper data].
Outside the range !(<=Values<=)
[IECUBE][Simulator]
R20UT2867EJ0100 Rev.1.00
Feb 01, 2014
Page 357 of 572
CubeSuite+ V2.02.00
Compare data
APPENDIX A WINDOW REFERENCE
Specify the data to compare.
This item appears only when [Specified value (==)], [Any other value (!=)], [Greater than or
equal to (>=)] or [Less than or equal to (<=)] is selected in [Compare condition].
Default
The current set value
Modifying
Directly enter from the keyboard.
Available
Hexadecimal number up to five digits
values
Lower data
Specify the lower data for the range in [Compare condition].
[IECUBE]
This item appears only when [Inside the range (<=Values<=)] or [Outside the range
[Simulator]
!(<=Values<=)] is selected in [Compare condition].
Default
The current set value
Modifying
Directly enter from the keyboard.
Available
Hexadecimal number up to five digits
values
Upper data
Specify the upper data for the range in [Compare condition].
[IECUBE]
This item appears only when [Inside the range (<=Values<=)] or [Outside the range
[Simulator]
!(<=Values<=)] is selected in [Compare condition].
Default
The current set value
Modifying
Directly enter from the keyboard.
Available
Hexadecimal number up to five digits
values
Use the data mask
Specify whether to specify a data mask.
Default
No
Modifying
Select from the drop-down list
Available
Yes
Specifies a data mask.
No
Does not specify a data mask.
values
Mask value
Specify the value of data mask.
This item appears only when [Use the data mask] is set to [Yes].
Default
The current set value
Modifying
Directly enter from the keyboard.
Available
Hexadecimal number up to five digits
values
(c) [Pass Count] [IECUBE][Simulator]
Specify the pass count condition.
Pass count
Specify a pass count.
The relevant event occurs when the event condition is met as many times as the specified
pass count.
Default
1
Modifying
Directly enter from the keyboard.
Available
1 to 65535 in decimal number
values
R20UT2867EJ0100 Rev.1.00
Feb 01, 2014
Page 358 of 572
CubeSuite+ V2.02.00
APPENDIX A WINDOW REFERENCE
(2) Description area
This area displays a simple description of the item selected in the Event conditions setting area.
[Toolbar]
Displays all categories in the Event conditions setting area.
Hides categories in the Event conditions setting area and rearranges only setting items in the ascending
order
This button is always invalid.
[Function buttons]
Button
Function
OK
Applies detailed settings made in this dialog box to access-related events and closes this dialog box.
Cancel
Cancels the save and closes this dialog box.
Help
Displays the help for this dialog box.
R20UT2867EJ0100 Rev.1.00
Feb 01, 2014
Page 359 of 572
CubeSuite+ V2.02.00
APPENDIX A WINDOW REFERENCE
Scroll Range Settings dialog box
This dialog box is used to set the scroll range of the vertical scroll bar on the Memory panel/Disassemble panel.
By setting the appropriate range, it is possible to improve the operability of a mouse (e.g. dragging) because the size of
the vertical scroll bar on the panel is changed suitably.
Caution
After setting a scroll range via this dialog box, the scroll range is not updated automatically even if
the address evaluated by the address expression is changed because of such as a line assembly.
Remark
It is possible to move outside the scroll range by using the [Page Up]/[Page Down]/[Up]/[Down] key, a
button at either end of the scroll bar or a menu item related to the jump function.
Figure A-62. Scroll Range Setting Dialog Box
(1)
(2)
[Function buttons]
This section describes the following.
- [How to open]
- [Description of each area]
- [Function buttons]
[How to open]
- On the Memory panel, click the
button from [View] on the toolbar.
- On the Memory panel, select the [View] menu >> [Settings Scroll Range...] from the context menu.
- On the Disassemble panel, click the
button from [View] on the toolbar.
- On the Disassemble panel, select the [View] menu >> [Settings Scroll Range...] from the context menu.
[Description of each area]
(1) [Start address] area
Specify the start address of the range of scrolling.
You can either type an address expression directly into the text box (up to 1024 characters), or select it from the
input history via the drop-down list (up to 10 items).
Note that the setting of the scroll range is not performed if "All" is selected in the drop-down list at this time (the
scroll range is not limited).
Remark
A symbol name at the current caret position can be complemented by pressing the [Ctrl] + [Space] key
in this text box (see "2.19.2 Symbol name completion function").
(2) [End address] area
Specify the end address of the range of scrolling.
R20UT2867EJ0100 Rev.1.00
Feb 01, 2014
Page 360 of 572
CubeSuite+ V2.02.00
APPENDIX A WINDOW REFERENCE
You can either type an address expression directly into the text box (up to 1024 characters), or select it from the
input history via the drop-down list (up to 10 items).
Note that this area becomes invalid if [Start address] is specified with [All].
Remark
A symbol name at the current caret position can be complemented by pressing the [Ctrl] + [Space] key
in this text box (see "2.19.2 Symbol name completion function").
[Function buttons]
Button
OK
Function
Sets the specified scroll range for the target panel.
Moves the caret to the start address, from the beginning of the area displayed in the
target panel.
Cancel
Cancels the jump and closes this dialog box.
Help
Displays the help for this dialog box.
R20UT2867EJ0100 Rev.1.00
Feb 01, 2014
Page 361 of 572
CubeSuite+ V2.02.00
APPENDIX A WINDOW REFERENCE
Go to Line dialog box
This dialog box is used to move the caret to a specified line number, symbol, or address.
Figure A-63. Go to Line Dialog Box
(1)
[Function buttons]
This section describes the following.
- [How to open]
- [Description of each area]
- [Function buttons]
[How to open]
- Focus the Editor panel, and then select [Go to...] from the [Edit] menu.
- On the Editor panel, select [Go to…] from the context menu.
[Description of each area]
(1) [Line number (valid line range) or symbol] area
Directly enter the line number (decimal number), symbol nameNote 1 or addressNote 2 to which you want to move the
caret.
"(valid line range)" shows the range of valid lines in the current file.
By default, the number of the line where the caret is currently located in the Editor panel is displayed.
Notes 1.
Note the following, when specifying a symbol name:
- Only a function name can be specified as a symbol name.
- Run and complete a build.
- If an error in building occurs, the information before the error occurred is used.
2.
Note the following, when specifying an address:
- Only a hexadecimal value with prefix "0x" or "0X" can be specified (a decimal value is treated as a
line number).
- Run and complete a build.
- If an error in building occurs, the information before the error occurred is used.
[Function buttons]
Button
Function
OK
Places the caret at the start of the specified source line.
Cancel
Cancels the jump and closes this dialog box.
Help
Displays the help for this dialog box.
R20UT2867EJ0100 Rev.1.00
Feb 01, 2014
Page 362 of 572
CubeSuite+ V2.02.00
APPENDIX A WINDOW REFERENCE
Go to the Location dialog box
This dialog box is used to move the caret to a specified position.
Figure A-64. Go to the Location Dialog Box
(1)
[Function buttons]
This section describes the following.
- [How to open]
- [Description of each area]
- [Function buttons]
[How to open]
- Focus the Disassemble panel, and then select [Go to...] from the [Edit] menu.
- Focus the SFR panel, and then select [Go to...] from the [Edit] menu.
- On the Disassemble panel, select [Go to…] from the context menu.
- On the SFR panel, select [Go to…] from the context menu.
[Description of each area]
(1) [Address/Symbol], or [SFR] area
Specify the location to which the caret jumps.
You can either type a location directly into the text box (up to 1024 characters), or select one from the input history
via the drop-down list (up to 10 items).
The data to specify various depending on the target panel, as follows:
Target Panel
Data Specified
Disassemble panel
Address expression
SFR panel
SFR name
Remark
If this dialog box is opened from the Disassemble panel, a symbol name at the current caret position
can be complemented by pressing the [Ctrl] + [Space] key in this text box (see "2.19.2 Symbol name
completion function").
[Function buttons]
Button
Function
OK
Moves the caret to the specified location, from the beginning of the area displayed in the target panel.
Cancel
Cancels the jump and closes this dialog box.
Help
Displays the help for this dialog box.
R20UT2867EJ0100 Rev.1.00
Feb 01, 2014
Page 363 of 572
CubeSuite+ V2.02.00
APPENDIX A WINDOW REFERENCE
Data Save dialog box
This dialog box is used to save data displayed in the Disassemble panel, Memory panel, or Trace panel, and save
uploaded data (see "2.5.3 Execute uploading").
This dialog box appears only when connected to the debug tool.
Figure A-65. Data Save Dialog Box
(1)
(2)
(3)
[Function buttons]
This section describes the following.
- [How to open]
- [Description of each area]
- [Function buttons]
[How to open]
- With the Disassemble panel in focus, select [Save Disassemble Data As…] form the [File] menu.
- With the Memory panel in focus, select [Save Memory Data As…] form the [File] menu.
- With the Trace panel in focus, select [Save Trace Data As…] form the [File] menu.
- From the [Debug] menu, select [Upload…].
[Description of each area]
(1) [File Name] area
Specify the name of the file to save.
You can either type a filename directly into the text box (up to 259 characters), or select one from the input history
via the drop-down list (up to 10 items).
You can also specify the file by clicking the […] button, and selecting a file via the Select Data Save File dialog box.
(2) [File Type] area
Select the format in which to save the file from the following drop-down list.
The available file formats will differ as follows depending on the type of data being saved.
(a) When saving the displayed content of a panel
Text files (*.txt)
Text format (default)
CSV (Comma-Separated Variables) (*.csv)
CSV formatNote
R20UT2867EJ0100 Rev.1.00
Feb 01, 2014
Page 364 of 572
CubeSuite+ V2.02.00
APPENDIX A WINDOW REFERENCE
Note The data is saved with entries separated by commas (,).
If the data contains commas, each entry is surrounded by double quotes ("") in order to avoid illegal
formatting.
(b) When saving upload data
Displayed List Items
File Format
Intel Hex format (Extension) (*.hex)
Intel expanded Hex format
Intel Hex format (Flash Programmer) (*.hex)Note
Intel expanded Hex format
[IECUBE][E1][E20]
(for flash programmer)
Motorola Hex format (S0, S2, S8 - 24bit-address) (*.hex)
Motorola S type format
Motorola Hex format (S0, S2, S8 - 24bit-address) (Flash Programmer) (*.hex) Note
Motorola S type format
[IECUBE][E1][E20]
(for flash programmer)
Extended Tektronix Hex format (*.hex)
Expanded Tektronix Hex format
Binary data (*.bin)
Binary format
Note [IECUBE][E1][E20]
This item is displayed only when the selected microcontroller incorporates the data flash memory.
Remark
See "2.5.3 Execute uploading" for details on uploading.
(3) [Save Range xxx] area
Specify the range of data to save.
You can either type ranges directly into the text boxes, or select them from the input history via the drop-down lists
(up to 10 items).
The method of specifying the ranges will differ as follows depending on the type of data to be saved.
Type of Data
Disassemble panel
Description
Specify the range of addresses to save via the start and end addresses.
Ranges can be entered as base-16 numbers or as address expressions.
When a range is selected in the panel, that range is specified by default.
When there is no selection, then the range currently visible in the panel is specified.
Memory panel
Specify the range of memory to save via the start and end addresses.
Ranges can be entered as base-16 numbers or as address expressions.
When a range is selected in the panel, that range is specified by default.
When there is no selection, then the range currently visible in the panel is specified.
Trace panel
- Specifying a range to save
Specify the trace range to save via the start and end trace numbersNote.
Ranges can only be entered as base-10 numbers.
- Saving all trace data
From the drop-down list to the left, select [All Trace Data]. The text box to the right is
disabled. All currently acquired trace data will be saved.
The range currently visible in the panel is specified by default.
Upload data
Specify the range of memory to save via the start and end addresses.
Ranges can be entered as base-16 numbers or as address expressions.
Note These are the numbers shown in the [Number] area of the Trace panel.
R20UT2867EJ0100 Rev.1.00
Feb 01, 2014
Page 365 of 572
CubeSuite+ V2.02.00
Remark
APPENDIX A WINDOW REFERENCE
A symbol name at the current caret position can be complemented by pressing the [Ctrl] + [Space] key
in each text box (see "2.19.2 Symbol name completion function").
[Function buttons]
Button
Function
Save
Saves the data to a file with the specified filename, in the specified format.
Cancel
Cancels the save and closes this dialog box.
Help
Displays the help for this dialog box.
R20UT2867EJ0100 Rev.1.00
Feb 01, 2014
Page 366 of 572
CubeSuite+ V2.02.00
APPENDIX A WINDOW REFERENCE
Progress Status dialog box
This dialog box is used to display the progress of long processes.
This dialog box closes automatically when the currently executing process completes.
Figure A-66. Progress Status Dialog Box
(1)
(2)
[Function buttons]
This section describes the following.
- [How to open]
- [Description of each area]
- [Function buttons]
[How to open]
- This dialog box appears automatically when a message is displayed during a long process.
[Description of each area]
(1) Message display area
Displays messages during processing (cannot be edited).
(2) Progress bar
The amount of progress made toward completing the current progress is indicated by the length of the bar.
The dialog box will automatically close when the progress reaches 100% (the length of the bar reaches the right
end).
[Function buttons]
Button
Cancel
Function
Cancels the currently executing process, and closes this dialog box.
Note that this button will be disabled if the currently executing process cannot be interrupted.
R20UT2867EJ0100 Rev.1.00
Feb 01, 2014
Page 367 of 572
CubeSuite+ V2.02.00
APPENDIX A WINDOW REFERENCE
Option dialog box
This dialog box is used to configure the CubeSuite+ environment.
All settings made via this dialog box are saved as preferences for the current user.
Figure A-67. Option Dialog Box
(1)
(2)
[Function buttons]
This section describes the following.
- [How to open]
- [Description of each area]
- [Function buttons]
[How to open]
- From the [Tool] menu, select [Options...].
[Description of each area]
(1) Category selection area
Select the items to configure from the following categories.
Category
Description
[General - Startup and Exit] category
Configure startup and shutdown.
[General - Display] category
Configure messages from the application.
[General - External Text Editor] category
Configure the external text editor.
[General - Font and Color] category
Configure the fonts and colors shown on each panel.
[General - External Tools] category
Configure the startup of external tools.
[General - Project] category
Configure the project.
[General - Build/Debug] category
Configure building and debugging.
[General - PythonConsole] category
Configure the phthon console.
R20UT2867EJ0100 Rev.1.00
Feb 01, 2014
Page 368 of 572
CubeSuite+ V2.02.00
APPENDIX A WINDOW REFERENCE
Category
Description
[General - Text Editor] category
Configure the text editor.
[General - Update] category
Configure updating.
[Others - User Information] category
Configure user information.
Remark
See "CubeSuite+ Integrated Development Environment User's Manual: Start" for details on the
categories other than [General - Font and color]/[General - Build/Debug].
(2) Setting area
This area is used to configure the various options for the selected category.
For details about configuration for a particular category, see the section for the category in question.
[Function buttons]
Button
Initialize All Settings
Function
Restores all settings on this dialog box to their default values.
Note, however, that newly added items in the [General - External Tools] category will not be
removed.
OK
Applies all setting and closes this dialog box.
Cancel
Ignores the setting and closes this dialog box.
Apply
Applies all setting (does not close this dialog box).
Help
Displays the help for this dialog box.
R20UT2867EJ0100 Rev.1.00
Feb 01, 2014
Page 369 of 572
CubeSuite+ V2.02.00
APPENDIX A WINDOW REFERENCE
[General - Font and Color] category
Use this category to configure general settings relating to fonts and colors on each panel.
Figure A-68. Option Dialog Box ([General - Font and Color] Category)
(1)
(2)
(3)
(4)
The following items are explained here.
- [How to open]
- [Description of each area]
[How to open]
- From the [Tool] menu, select [Options...].
[Description of each area]
(1) Color options area
Use this area to configure the colors.
(a) [Setting place] area
Select a location from the list for which the color will be specified.
The relationships between the list items and default color settings are as follows:
Item
DefaultNote
Example
Description
Font color
Black
Background
White
Standard display colors on all windows and panels
color
Warning
R20UT2867EJ0100 Rev.1.00
Feb 01, 2014
Font color
Blue
Background
Default
color
color
Display colors of warning messages on the Output panel,
as well as display colors for file names with "warnings
included" on the Project Tree panel
Page 370 of 572
CubeSuite+ V2.02.00
Item
Error
APPENDIX A WINDOW REFERENCE
Example
Font color
Background
Description
Red
Whitesmoke
color
Reserved
word
Comment
String literal
Control code
Highlight
Changed
value
Font color
Maroon
Background
Default
color
color
Font color
Green
Background
Default
color
color
Font color
Gray
Background
Default
color
color
Font color
Darkcyan
Background
Default
color
color
Font color
White
Background
Mediumviol
color
etred
Font color
Sienna
Background
Lightyellow
color
Edit value
Current PC
Display colors of warning messages on the Output panel,
as well as display colors for file names with "errors
included" on the Project Tree panel
Display colors of reserved words on the Editor panel for
compilers/assemblers used
Display colors of comment parts (for C source files, "/* to */
") on the Editor panel
Display colors of string literals on the Editor panel
Display colors of control characters on the Output panel
Display colors of highlighted spots in plug-in products, etc.
Display colors on the Memory panel, CPU Register panel,
Local Variables panel, SFR panel and Watch panel of
spots whose values have been changed by program
execution
Font color
Blue
Background
Default
color
color
Font color
Black
Background
Gold
Display colors on the Memory panel, CPU Register panel,
Local Variables panel, SFR panel and Watch panel of
spots whose values have been forcibly changed by user
Display colors on the Editor panel and Disassemble panel
of a line where the current PC position exists
color
Breakpoint
Font color
Black
Background
Lightsalmon
Display colors on the Editor panel and Disassemble panel
of a line where breakpoints are set
color
Update
periodic
Read or
Font color
Deeppink
Display colors on the Memory panel and Watch panel of areas
whose display is set to be updated in real time
Background
Default
color
color
Font color
Default
Display colors on the Memory panel and Trace panel of
color
spots that have been read or fetched
fetch
Background
Palegreen
color
Write
Font color
Background
Default
Display colors on the Memory panel and Trace panel of
color
spots that have been written
Orange
color
R20UT2867EJ0100 Rev.1.00
Feb 01, 2014
Page 371 of 572
CubeSuite+ V2.02.00
Item
APPENDIX A WINDOW REFERENCE
Example
Read and
Font color
write
Lost
Description
Default
Display colors on the Memory panel and Trace panel of
color
spots that have been read and written
Background
Paletur-
color
quoise
Font color
White
Background
Lightgray
color
Coverage
Font color
100%
Background
Display colors on the Analysis Chart panel of the analyze
tool (Program Analyzer) of sections where acquisition of
graph data has failed
Default
Display colors on the Editor panel and Disassemble panel
color
of lines whose code coverage rates are 100 %
Lightgreen
color
Coverage 1 -
Font color
99%
Background
Default
Display colors on the Editor panel and Disassemble panel
color
of lines whose code coverage rates are 1 to 99 %
Lightpink
color
Coverage
Font color
0%
Background
Default
Display colors on the Editor panel and Disassemble panel
color
of lines whose code coverage rates are 0 % (unexecuted)
Lightgray
color
Invalid
Font color
Gray
Background
Default
color
color
Display colors on the Memory panel of areas that are not
memory-mapped, and of file names that are not actually
present on the Project Tree panel
Note The [Default] text and background colors depends on the Windows settings of the host computer. Here,
we use the Windows defaults, which are black text and white background.
(b) [Use default color]
Display items selected via the [Setting place] area using the standard text color.
Display items selected via the [Setting place] area with a user-defined text color.
The [Font color...] button is enabled.
(c) [Use default background color]
Display items selected via the [Setting place] area using the standard background color.
Display items selected via the [Setting place] area with a user-defined background color.
The [Background Color...] button is enabled.
(d) Buttons
Font Color...
The Edit Colors Dialog Box opens. Specify the text color of the item selected via the
[Setting place] area.
Note, however, that this button will be disabled if the [Use default color] check box is
selected.
R20UT2867EJ0100 Rev.1.00
Feb 01, 2014
Page 372 of 572
CubeSuite+ V2.02.00
Background Color...
APPENDIX A WINDOW REFERENCE
The Edit Colors Dialog Box opens. Specify the background color of the item selected
via the [Setting place] area.
Note, however, that this button will be disabled if the [Use default background color]
check box is selected.
Reset Selected Item Colors
Reset the color information for the item selected via the [Setting place] area to the
defaults.
Figure A-69. Edit Colors Dialog Box
(2) [Display example] area
Display sample text using the color and font settings from the Color options area.
By default the string "AaBbCc" is shown, but you can type an arbitrary string directly into the text box.
(3) [Font settings for text editor] area
Click the [Font...] button to open the Font Dialog Box and configure the fonts for your text editor.
Figure A-70. Font Dialog Box
R20UT2867EJ0100 Rev.1.00
Feb 01, 2014
Page 373 of 572
CubeSuite+ V2.02.00
APPENDIX A WINDOW REFERENCE
(4) Buttons
Import...
Opens the Open Option Setting File dialog box to reflect the set contents that were saved in a file
to this category.
Export...
Opens the Save Option Setting File dialog box to save the set contents of this category to a file.
Initialize Settings
Returns all currently displayed setting to their default values.
R20UT2867EJ0100 Rev.1.00
Feb 01, 2014
Page 374 of 572
CubeSuite+ V2.02.00
APPENDIX A WINDOW REFERENCE
[General - Build/Debug] category
Use this category to configure general setting relating to building and debugging.
Figure A-71. Option Dialog Box ([General - Build/Debug] Category)
(1)
(2)
(3)
(4)
(5)
(6)
(7)
(8)
(9)
The following items are explained here.
- [How to open]
- [Description of each area]
[How to open]
- From the [Tool] menu, select [Options...].
[Description of each area]
(1) [Enable Rapid Build]
Enable the rapid build Note feature (default).
Do not use the rapid build feature.
Note This feature automatically begins a build when the source file being edited is saved.
Enabling this feature makes it possible to perform builds while editing source files.
If this feature is used, we recommend saving frequently after editing source files.
(a) [Observe registered files changing]
Start a rapid build when a source file registered in the project is edited or saved by an external text editor or
the like.
Do not start a rapid build when a source file registered in the project is edited or saved by an external text
editor or the like (default).
R20UT2867EJ0100 Rev.1.00
Feb 01, 2014
Page 375 of 572
CubeSuite+ V2.02.00
Remark
APPENDIX A WINDOW REFERENCE
This item is only enabled if the [Enable Rapid Build] check box is selected.
Cautions 1.
The rapid build will not finish if this item is selected, and the files to be built have been
registered for automatic editing or overwriting (e.g. by commands executed before or
after the build). If the rapid build does not finish, unselect this item, and stop the rapid
build.
2.
If this item is selected, a file that is registered in the project but does not exist (a file
grayed out) will not be observed even if it is registered again by the Explorer, etc.
To observe the file, reload the project file, or select this item again after unselecting this
item and closing this dialog box.
(2) [Show dependency files in project tree]
Displays the group of files on which the source file depends as a project tree.
Does not display the group of files on which the source file depends as a project tree (default).
(3) [Output quality record file when build is successful]
Outputs a quality record file if the build is successful.
Does not output a quality record file if the build is successful (default).
Remarks 1.
The quality report file is not output when a rapid build is executed, a debug-dedicated project is
built, and compiling or assembling is executed in file units.
2.
The following information item is output to the quality report file.
- Time and date on which the file is created
- Log of the build results
- Information on the command file which is used during building
- Information on the detailed version of this product or the current project
3.
The quality report file is output with the file name "QuarityReport(project-name.build-modename).text" to the project folder of each project.
If a file having the same name exists, it will be overwritten.
It is also shown on the project tree, under the Build tool generated files node.
(4) [Stop build when the number of error exceed the limit]
Stops the build if the total number of errors at the build reaches the number specified in [Upper limit].
Does not stop the build even if the total number of errors at the build reaches the number specified in [Upper
limit] (default).
(a) [Upper limit]
Specify the upper limit of the number of errors.
Either enter a number between 1 and 10000 directly via the keyboard, or specify a number via the
buttons.
The default is 100.
Clicking the [OK]/[Apply] button without specifying any number restores this item to the number that have been
saved previously.
Remark
This item is only enabled if the [Stop build when the number of error exceed the limit] check box is
selected.
R20UT2867EJ0100 Rev.1.00
Feb 01, 2014
Page 376 of 572
CubeSuite+ V2.02.00
APPENDIX A WINDOW REFERENCE
(5) [Timing of updating dependencies]
At the first build
Updates dependencies immediately before executing the first build after opening the project
(default).
At every build
Updates dependencies immediately before executing the build.
(6) [Observe downloaded load module files changing]
Watches changes made to the load module files downloaded to the debug tool, so that when changes are made,
a message dialog box is displayed for confirmation of whether or not to execute a download.
Does not watch changes made to the load module files downloaded to the debug tool (default).
(7) [Add source files automatically (for the "Debug Only" project only)]
Automatically adds the source files to the project tree when the load-module files are downloaded to the debug
tool in the debug-dedicated project (default).
Does not automatically add the source files to the project tree when the load-module files are downloaded to the
debug tool in the debug-dedicated project
Caution
This function is valid only when the load module files have been added to the Download files
node of the project tree. If the load module files have been added via the [Download File
Settings] tab in the Property panel of the debug tool, then the source files will not be added to
the project tree.
(8) [Enable Break Sound]
Beeps when the execution of a program is halted due to a break event (Hardware or Software break).
Does not beep when the execution of a program is halted due to a break event (Hardware or Software break)
(default).
(9) Buttons
Initialize Settings
R20UT2867EJ0100 Rev.1.00
Feb 01, 2014
Returns all currently displayed setting to their default values.
Page 377 of 572
CubeSuite+ V2.02.00
APPENDIX A WINDOW REFERENCE
Select Download File dialog box
This dialog box is used to select a downloaded file.
Figure A-72. Select Download File Dialog Box
(1)
(2)
(3)
[Function buttons]
(4)
This section describes the following.
- [How to open]
- [Description of each area]
- [Function buttons]
[How to open]
- On the [Download file property] area in the Download Files dialog box, click the [...] button on the [File] property.
[Description of each area]
(1) [Look in] area
Select the folder which contains the file you want to download.
(2) List of files area
This area displays a list of files matching the conditions selected in the [Look in] and [Files of type] areas.
(3) [File name] area
Specify the name of a file you want to download.
(4) [Files of type] area
Select the type of a file to download (file type).
Load module file (*.lmf)
Load module format (default)
Hex file (*.hex;*.hxb;*.hxf)
Hex format
R20UT2867EJ0100 Rev.1.00
Feb 01, 2014
Page 378 of 572
CubeSuite+ V2.02.00
APPENDIX A WINDOW REFERENCE
Binary data file (*.bin)
Binary format
All files (*.*)
All file formats
[Function buttons]
Button
Function
Open
Adds the specified file to the Download Files dialog box.
Cancel
Closes the dialog box.
R20UT2867EJ0100 Rev.1.00
Feb 01, 2014
Page 379 of 572
CubeSuite+ V2.02.00
APPENDIX A WINDOW REFERENCE
Open Watch Expression Data File dialog box
This dialog box is used to select a file that imports watch-expressions to the Watch panel.
Figure A-73. Open Watch Expression Data File Dialog Box
(1)
(2)
(3)
[Function buttons]
(4)
This section describes the following.
- [How to open]
- [Description of each area]
- [Function buttons]
[How to open]
- On the Watch panel, select [Import Watch Expression...] from the context menu.
[Description of each area]
(1) [Look in] area
Select the folder which contains the file you want to import.
(2) List of files area
This area displays a list of files matching the conditions selected in the [Look in] and [Files of type] areas.
(3) [File name] area
Specify the name of a file you want to import.
(4) [Files of type] area
The following type of the file (file type) is shown.
Importable CSV(Comma-Separated Variables) (*.csv)
R20UT2867EJ0100 Rev.1.00
Feb 01, 2014
CSV format to enable import
Page 380 of 572
CubeSuite+ V2.02.00
APPENDIX A WINDOW REFERENCE
[Function buttons]
Button
Function
Open
Imports the specified file to the Watch panel.
Cancel
Closes the dialog box.
R20UT2867EJ0100 Rev.1.00
Feb 01, 2014
Page 381 of 572
CubeSuite+ V2.02.00
APPENDIX A WINDOW REFERENCE
Open File dialog box
This dialog box is used to open a file.
Figure A-74. Open File Dialog Box
(1)
(2)
(3)
[Function buttons]
(4)
The following items are explained here.
- [How to open]
- [Description of each area]
- [Function buttons]
[How to open]
- From the [File] menu, select [Open File...] or [Open with Encoding...].
[Description of each area]
(1) [Look in] area
Select the folder which contains the file you want to open.
When you first open this dialog box, the folder is set to "C:\Documents and Settings \user-name\My Documents".
The second and subsequent times, this defaults to the last folder that was selected.
(2) List of files area
This area displays a list of files matching the conditions selected in the [Look in] and [Files of type] areas.
(3) [File name] area
Specify the name of a file you want to open.
(4) [Files of type] area
Select the type of the file you want to open (file type).
All files (*.*)
R20UT2867EJ0100 Rev.1.00
Feb 01, 2014
All formats
Page 382 of 572
CubeSuite+ V2.02.00
APPENDIX A WINDOW REFERENCE
Project File(*.mtpj)
Project file
Project File for e2 studio (*.rcpc)
Project file for e2 studio
Project File for CubeSuite(*.cspj)
Project file for CubeSuite
Workspace File for HEW(*.hws)
Workspace file for HEW
Project File for HEW(*.hwp)
Project file for HEW
Workspace File for PM+(*.prw)
Workspace file for PM+
Project File for PM+(*.prj)
Project file for PM+
C source file (*.c)
C language source file
Header file (*.h; *.inc)
Header file
Assemble file (*.asm)
Assembler source file
Link directive file (*.dir; *.dr)
Link directive file
Variable and function information file (*.vfi)
Variable and function information file
Map file (*.map)
Map file
Symbol table file (*.sym)
Symbol table file
Hex file (*.hex; *.hxb; *.hxf)
Hex file
Python script file (*.py)
Python script file
System configuration file (*.cfg)
System configuration file
Text file (*.txt)
Text format
[Function buttons]
Button
Open
Function
- When this dialog box is opened by [Open File...] from the [File] menu
Opens the specified file.
- When this dialog box is opened by [Open with Encoding...] from the [File] menu
Opens the Encoding dialog box.
Cancel
R20UT2867EJ0100 Rev.1.00
Feb 01, 2014
Closes this dialog box.
Page 383 of 572
CubeSuite+ V2.02.00
APPENDIX A WINDOW REFERENCE
Save As dialog box
This dialog box is used to save the contents of the panel into a specified file.
Figure A-75. Save As Dialog Box
(1)
(2)
(3)
[Function buttons]
(4)
This section describes the following.
- [How to open]
- [Description of each area]
- [Function buttons]
[How to open]
- With the Editor panel in focus, select [Save file name As...] from the [File] menu.
- With the CPU Register panel in focus, select [Save CPU Register Data As...] from the [File] menu.
- With the Watch panel in focus, select [Save Watch Data As...] from the [File] menu.
- With the SFR panel in focus, select [Save SFR As...]. from the [File] menu.
- With the Call Stack panel in focus, select [Save Call Stack Data As...] from the [File] menu.
- With the Local Variables panel in focus, select [Save Local Variable Data As...] from the [File] menu.
- With the Output panel in focus, select [Save tab name As...] from the [File] menu.
[Description of each area]
(1) [Save in] area
Select the folder in which you want to save the file, from the drop-down list.
(2) List of files area
This area displays a list of files matching the conditions selected in the [Save in] and [Save as type] areas.
(3) [File name] area
Specify a file name under which you want to save.
R20UT2867EJ0100 Rev.1.00
Feb 01, 2014
Page 384 of 572
CubeSuite+ V2.02.00
APPENDIX A WINDOW REFERENCE
(4) [Save as type] area
(a) In the Editor panel
The following file types are displayed depending on the file being edited.
C source file (*.c)
C language source file
Header file (*.h;*.inc)
Header file
Assemble file (*.asm)
Assembly language source file
Link directive file (*.dr;*.dir)
Link directive file
Link order specification file (*.mtls)
Link order specification file
Variable and function information file (*.vfi)
Function information file
Map file (*.map)
Map file
Symbol table file (*.sym)
Symbol table file
Hex file (*.hex;*hxb;*hxf)
Hex file
Python script file (*.py)
Python script file
System configuration file (*.cfg)
System configuration file
Preprocess list file(*.ppl)
Preprocess list file
Cross reference list file (*.xrf)
Cross reference list file
Assemble list file (*.prn)
Assemble list file
List file (*.lst)
List file
Error list file (*.cer)/(*.ecc)/(*.eoc)/(*.elk)/(*.elv)/(*.er)/(*.era)/
Error list file
(*.erp)/(*.her)
Text file (*.txt)
Text format
CSV (Comma-Separated Variables)(*.csv)Note 1
CSV formatNote 2
Notes 1.
This item appears only when this dialog box was opened from the Editor panel in the Mixed display
mode.
2.
The data is saved with entries separated by commas (,).
If the data contains commas, each entry is surrounded by double quotes (" ") in order to avoid
illegal formatting. Moreover, "0x" is added to the address and code information.
(b) In the CPU Register panel/Watch panel/SFR panel/Call Stack panel/Local Variables panel
The following file types are displayed.
Select the format in which to save the file from the drop-down list.
Text file (*.txt)
Text format (default)
CSV (Comma-Separated Variables)(*.csv)
CSV formatNote 1
Importable CSV (Comma-Separated Variables)(*.csv)Note 2
CSV formatNote 1 to enable import
Notes 1.
The data is saved with entries separated by commas (,).
If the data contains commas, each entry is surrounded by double quotes (" ") in order to avoid
illegal formatting.
2.
This item appears only when this dialog box was opened from the Watch panel.
R20UT2867EJ0100 Rev.1.00
Feb 01, 2014
Page 385 of 572
CubeSuite+ V2.02.00
APPENDIX A WINDOW REFERENCE
(c) In the Output panel
The following file types are displayed.
The contents can be saved only in text format.
Text file (*.txt)
Text format (default)
[Function buttons]
Button
Function
Save
Saves the file with the specified name.
Cancel
Closes the dialog box.
R20UT2867EJ0100 Rev.1.00
Feb 01, 2014
Page 386 of 572
CubeSuite+ V2.02.00
APPENDIX A WINDOW REFERENCE
Select Data Save File dialog box
This dialog box is used to select a file in which to save the data.
Figure A-76. Select Data Save File Dialog Box
(1)
(2)
(3)
[Function buttons]
(4)
This section describes the following.
- [How to open]
- [Description of each area]
- [Function buttons]
[How to open]
- On the [File Name] area in the Data Save dialog box, click the [...] button.
[Description of each area]
(1) [Look in] area
Select the folder which contains the file you want to save.
(2) List of files area
This area displays a list of files matching the conditions selected in the [Look in] and [Files of type] areas.
(3) [File name] area
Specify the name of a file you want to save.
(4) [Files of type] area
Select the type of the file (file type).
The available file formats will differ as follows depending on the type of data being saved.
R20UT2867EJ0100 Rev.1.00
Feb 01, 2014
Page 387 of 572
CubeSuite+ V2.02.00
APPENDIX A WINDOW REFERENCE
(a) Saving the data displayed in a panel
Text files (*.txt)
Text format (default)
CSV (Comma-Separated Variables)(*.csv)
CSV formatNote
Note The data is saved with entries separated by commas (,).
If the data contains commas, each entry is surrounded by double quotes (" ") in order to avoid illegal
formatting.
(b) Saving upload data
See "Table 2-2. Type of Files That Can be Uploaded".
[Function buttons]
Button
Function
Open
Specifies the specified file in the Data Save dialog box.
Cancel
Closes the dialog box.
R20UT2867EJ0100 Rev.1.00
Feb 01, 2014
Page 388 of 572
CubeSuite+ V2.02.00
APPENDIX A WINDOW REFERENCE
Open Option Setting File dialog box
This dialog box is used to select a option setting file to import to the [General - Font and Color] category of the Option
dialog box.
Figure A-77. Open Option Setting File Dialog Box
(1)
(2)
(3)
[Function buttons]
(4)
The following items are explained here.
- [How to open]
- [Description of each area]
- [Function buttons]
[How to open]
- On the [General - Font and Color] category of the Option dialog box, click the [Import...] button.
[Description of each area]
(1) [Look in] area
Select the folder which contains the option setting file you want to open.
When you first open this dialog box, the folder is set to "C:\Documents and Settings \user-name\My Documents".
The second and subsequent times, this defaults to the last folder that was selected.
(2) List of files area
This area displays a list of files matching the conditions selected in the [Look in] and [Files of type] areas.
(3) [File name] area
Specify the name of a option setting file you want to open.
(4) [Files of type] area
The following type of the file (file type) is shown.
R20UT2867EJ0100 Rev.1.00
Feb 01, 2014
Page 389 of 572
CubeSuite+ V2.02.00
APPENDIX A WINDOW REFERENCE
Option Setting File (*.mtpu)
Option setting file
[Function buttons]
Button
Open
Function
Imports the specified file to the [General - Font and Color] category of the Option dialog
box.
Cancel
R20UT2867EJ0100 Rev.1.00
Feb 01, 2014
Closes this dialog box.
Page 390 of 572
CubeSuite+ V2.02.00
APPENDIX A WINDOW REFERENCE
Save Option Setting File dialog box
This dialog box is used to save the set contents of the [General - Font and Color] category of the Option dialog box to
a option setting file.
Figure A-78. Save Option Setting File Dialog Box
(1)
(2)
(3)
[Function buttons]
(4)
This section describes the following.
- [How to open]
- [Description of each area]
- [Function buttons]
[How to open]
- On the [General - Font and Color] category of the Option dialog box, click the [Export...] button.
[Description of each area]
(1) [Save in] area
Select the folder in which you want to save the option setting file.
When you first open this dialog box, the folder is set to "C:\Documents and Settings \user-name\My Documents".
The second and subsequent times, this defaults to the last folder that was selected.
(2) List of files area
This area displays a list of files matching the conditions selected in the [Save in] and [Save as type] areas.
(3) [File name] area
Specify the name of a option setting file under which you want to save.
(4) [Save as type] area
The following type of the file (file type) is shown.
R20UT2867EJ0100 Rev.1.00
Feb 01, 2014
Page 391 of 572
CubeSuite+ V2.02.00
APPENDIX A WINDOW REFERENCE
Option Setting File (*.mtpu)
Option setting file
[Function buttons]
Button
Function
Save
Saves the option setting file with the specified name.
Cancel
Closes the dialog box.
R20UT2867EJ0100 Rev.1.00
Feb 01, 2014
Page 392 of 572
CubeSuite+ V2.02.00
APPENDIX A WINDOW REFERENCE
Select Simulator Configuration File dialog box [Simulator]
This dialog box is used to select the simulator configuration file to perform use customization (adding of user models) of
the simulator.
Figure A-79. Select Simulator Configuration File Dialog Box
(1)
(2)
(3)
[Function buttons]
(4)
This section describes the following.
- [How to open]
- [Description of each area]
- [Function buttons]
[How to open]
- On the [Connect Settings] tab of the Property panel, click the [...] button displayed by selecting the [Simulator
configuration file] property in the [Configuration] category.
[Description of each area]
(1) [Look in] area
Select the folder which contains the simulator configuration file.
(2) List of files area
This area displays a list of files matching the conditions selected in the [Look in] and [Files of type] areas.
(3) [File name] area
Specify the name of the simulator configuration file to be used.
(4) [Files of type] area
Select the type of the file (file type).
Note that it is fixed to "Simulator Configuration File(*.cfg)".
R20UT2867EJ0100 Rev.1.00
Feb 01, 2014
Page 393 of 572
CubeSuite+ V2.02.00
APPENDIX A WINDOW REFERENCE
[Function buttons]
Button
Function
Open
Uses the specified simulator configuration file.
Cancel
Closes the dialog box.
R20UT2867EJ0100 Rev.1.00
Feb 01, 2014
Page 394 of 572
CubeSuite+ V2.02.00
APPENDIX A WINDOW REFERENCE
Simulator GUI window
This window appears automatically by default after connecting to the debug tool when a microcontroller whose
Simulator supports peripheral function simulations is selected and [Simulator] is selected as the debug tool to use (see
"2.18 Use the Simulator GUI [Simulator]").
In Simulator GUI, other windows (Signal Data Editor window, Timing Chart window, I/O Panel window, and Serial window) are manipulated from this window.
Cautions 1.
When a microcontroller whose Simulator does not support peripheral function simulations
(instruction simulation version) is selected, this window cannot be opened.
2.
This window and windows opened from it cannot be docked to the CubeSuite+ Main window.
3.
The help for this window will not be displayed even if the [F1] key on the keyboard is pressed
when no window opened from this window is opened.
To open the help for this window, select the [Help] menu >> [Main Window] on this window.
4.
The [x] button on this window's titlebar is invalid (it is invalid even if using the Aero function of
Windows Vista). If you wish to close this window, perform the configuration of the Property
panel (see "2.18 Use the Simulator GUI [Simulator]").
In addition, do not use the [Alt] + [F4] key to close this window.
Remark
The language of titlebar/menubar of this window and windows opened from it depends on the setting of
[Regional and Language Options] in [Control Panel] of the host machine used (if this setting is set to
[Japan]/[Japanese], their titlebar/menubar are displayed in Japanese).
Figure A-80. Simulator GUI Window
[Menubar]
[Toolbar]
[Window display area]
This section describes the following.
- [Menubar]
- [Toolbar]
- [Window display area]
[Menubar]
(1) [File] menu
(2) [Edit] menu
R20UT2867EJ0100 Rev.1.00
Feb 01, 2014
Page 395 of 572
CubeSuite+ V2.02.00
APPENDIX A WINDOW REFERENCE
(3) [View] menu
(4) [Parts] menu
(5) [Figure] menu
(6) [Option] menu
(7) [Simulator] menu
(8) [Window] menu
(9) [Help] menu
(1) [File] menu
New File...
Opens a new window for the Simulator GUI window.
Same operation as the
Open...
Opens the files handled in the Simulator GUI window.
Same operation as the
Close
Save
button.
button.
Closes the window currently having the focus.
Overwrites the contents of the window currently having the focus to the file handled in
the Simulator GUI window.
Same operation as the
Save As...
button.
Saves the contents of the window currently having the focus to the specified file.
(2) [Edit] menu
This menu varies depending on the window currently having the focus.
For details on this menu items, see "[Dedicated menu]" section in the Signal Data Editor window, Timing Chart window, I/O Panel window, or Serial window.
(3) [View] menu
This menu varies depending on the window currently having the focus.
For details on this menu items, see "[Dedicated menu]" section in the Signal Data Editor window, Timing Chart window, I/O Panel window, or Serial window.
(4) [Parts] menu
This menu is added when the I/O Panel window is opened.
For details on this menu items, see the [Parts] menu/[Parts] toolbar.
(5) [Figure] menu
This menu is added when the I/O Panel window is opened.
For details on this menu items, see the [Figure] menu/[Figure] toolbar.
(6) [Option] menu
ToolBar
Switches on/off display of the toolbar corresponding to the cascade menu.
Simulator Standard
Selects whether the [Simulator Standard] toolbar is displayed or not.
Simulator Tools
Selects whether the [Simulator Tool] toolbar is displayed or not.
Signal Data Editor
Selects whether the [Signal Data Editor] toolbar is displayed or not.
Timing Chart
Selects whether the [Timing Chart] toolbar is displayed or not.
Parts
Selects whether the [Parts] toolbar is displayed or not.
Figure
Selects whether the [Figure] toolbar is displayed or not.
R20UT2867EJ0100 Rev.1.00
Feb 01, 2014
Page 396 of 572
CubeSuite+ V2.02.00
Customize...
APPENDIX A WINDOW REFERENCE
Opens the Customize dialog box.
(7) [Simulator] menu
Signal Data Editor
Opens the Signal Data Editor window.
Same operation as the
Timing Chart
Opens the Timing Chart window.
Same operation as the
I/O Panel
button.
button.
Opens the I/O Panel window.
Same operation as the
Serial
button.
Opens the Serial window.
Same operation as the
button.
(8) [Window] menu
Close All
Closes all windows, except this window.
Cascade
Cascade display of the windows in this window.
Tile
Cascade display of the windows in this window.
Arrange Icons
Rearranges the icons in this window.
(9) [Help] menu
Main Window
Displays the help for this window.
Current Window
Displays the help for the current window.
[Toolbar]
(1) [Simulator Standard] toolbar
(2) [Simulator Tool] toolbar
(3) [Signal Data Editor] toolbar
(4) [Timing Chart] toolbar
(5) [Parts] toolbar
(6) [Figure] toolbar
(1) [Simulator Standard] toolbar
Opens a new window for the Simulator GUI window.
Opens the files handled in the Simulator GUI window.
Overwrites the contents of the window currently having the focus to the file handled in the Simulator GUI window.
Undoes the immediately preceding operation.
Restores the status undone by the
button.
Cuts the selected range and saves it to the clipboard.
Copies the selected range and saves it to the clipboard.
Pastes the clipboard contents.
R20UT2867EJ0100 Rev.1.00
Feb 01, 2014
Page 397 of 572
CubeSuite+ V2.02.00
APPENDIX A WINDOW REFERENCE
Opens the Search Data dialog box.
Displays the contents of the help.
(2) [Simulator Tool] toolbar
Opens the Signal Data Editor window.
Opens the Timing Chart window.
Opens the Serial window.
Opens the I/O Panel window.
(3) [Signal Data Editor] toolbar
This toolbar can be used when the Signal Data Editor window has the focus.
For details on this toolbar, see the [Signal Data Editor toolbar].
(4) [Timing Chart] toolbar
This toolbar can be used when the Timing Chart window has the focus.
For details on this toolbar, see the [Timing Chart toolbar].
(5) [Parts] toolbar
This toolbar can be used when the I/O Panel window has the focus.
For details on this toolbar, see the [Parts] menu/[Parts] toolbar.
(6) [Figure] toolbar
This toolbar can be used when the I/O Panel window has the focus.
For details on this toolbar, see the [Figure] menu/[Figure] toolbar.
[Window display area]
This area is used to display various windows (Signal Data Editor window, Timing Chart window, I/O Panel window, or
Serial window).
The displayed window can be changed in size or an icon can be created in this area.
R20UT2867EJ0100 Rev.1.00
Feb 01, 2014
Page 398 of 572
CubeSuite+ V2.02.00
APPENDIX A WINDOW REFERENCE
Customize dialog box
This dialog box is used to set or change the color and fonts for the Signal Data Editor window, Timing Chart window or
Serial window.
Figure A-81. Customize Dialog Box: [Color] Tab (For Timing Chart Window)
(1)
[Function buttons]
Figure A-82. Customize Dialog Box: [Font] Tab
(1)
[Function buttons]
This section describes the following.
- [How to open]
- [[Color] tab]
- [[Font] tab]
- [Function buttons]
R20UT2867EJ0100 Rev.1.00
Feb 01, 2014
Page 399 of 572
CubeSuite+ V2.02.00
APPENDIX A WINDOW REFERENCE
[How to open]
- With the Signal Data Editor window, Timing Chart window or Serial window in focus, select [Customize...] from the
[Option] menu.
[[Color] tab]
(1) Color setting area
Set and change the color of each part in the window.
List
The parts for which color change is possible are displayed in list form.
The parts displayed differ depending on the target window.
Color
The currently set color of the part is displayed when that part is selected from the list.
[Change...] button
The color currently set for the relevant part of each listed item can be changed.
[[Font] tab]
(1) Font setting area
Set and change the text font of each part in the window.
List
The parts for which font change is possible are displayed in list form.
Font
The current font name of the part is displayed, when that part is selected from the list.
Size
The current font size of the part is displayed, when that part is selected from the list.
[Change...] button
The font currently set for the relevant part of each listed item can be changed.
[Function buttons]
Button
Function
OK
Validates the settings and closes this dialog box.
Cancel
Cancels the settings and closes this dialog box.
Apply
Cannot be selected.
Help
Displays the help for this dialog box.
R20UT2867EJ0100 Rev.1.00
Feb 01, 2014
Page 400 of 572
CubeSuite+ V2.02.00
APPENDIX A WINDOW REFERENCE
Signal Data Editor window
This window is used to create and edit the signal data that is input to input pins.
The created signal data can be input to the input pin during simulation by selecting the [Edit] menu >> [Signal Input].
This data can also be saved to the signal data file (*.wvi) by selecting the [File] menu >> [Save]/[Save As...] or by saving
the project file.
The saved file contents can be restored by selecting the [File] menu >> [Open...] or by loading the project file.
Cautions 1.
If the saved signal data file is opened or the project file is opened while Simulator GUI is running with a microcontroller different from the one used when the signal data file was created,
the settings of pins that are not provided in the microcontroller will not be restored.
2.
The main clock and sub clock cannot be input from this window. Set the main clock/sub clock
oscillation frequency on the [Connect Settings] tab in the Property panel.
3.
If inputting of signals is started during program break, the signals will actually be input when
the program is resumed from the break.
Remarks 1.
The following data can be displayed or edited in this window:
- Newly created signal data
- Previously created signal data files
- File of signal data previously obtained by performing simulation and saving the results as output signal data
2.
On the titlebar of this window, "Project file name + Serial number (from 0).wvi" is displayed when the
project file has been loaded. However, after having loaded a project file of PM+, then if you save a file
as the project file of CubeSuite+, "Project file name + CS+ Serial number (from 0).wvi" is displayed on
the titlebar.
Figure A-83. Signal Data Editor Window
(1)
(2)
This section describes the following.
- [How to open]
- [Description of each area]
- [Dedicated menu (Signal Data Editor window)]
R20UT2867EJ0100 Rev.1.00
Feb 01, 2014
Page 401 of 572
CubeSuite+ V2.02.00
APPENDIX A WINDOW REFERENCE
- [Signal Data Editor toolbar]
- [Context menu]
- [Operation]
[How to open]
- Click the
button
- Select [Signal Data Editor] from the [Simulator] menu.
[Description of each area]
(1) Information bar
It can be specified whether this area is displayed or not, by selecting the [View] menu >> [Information Bar].
Select the unit of the wait time from the drop-down list.
The wait time unit can be changed by selecting the [Edit] menu >> [Time unit].
If this button is clicked while the program is running, signal input starts.
If this button is clicked while the program is stopped, signal input starts automatically
the next time the program execution is started.
If this button is clicked while the program is running, signal input is stopped.
If this button is clicked while the program is stopped, signal input does not start automatically even if the program execution is started.
The current signal input line (line highlighted with yellow) is returned to the beginning.
(2) Client area
Pin area
Data area
Wait area
Mark area
Line number area
Pin area
Displays the input pin names.
The input pin to be used is selected via the Select Pin dialog box opened by clicking the
button on the toolbar or selecting the [Edit] menu >> [Select Pin...].
Data input to pins can be enabled/disabled by selecting the [Edit] menu >> [Pin Status].
Line number area
Displays line number.
This area is used when performing editing in line units.
Note that up to 1,048,576 (= 1M) lines can be specified as the signal data.
R20UT2867EJ0100 Rev.1.00
Feb 01, 2014
Page 402 of 572
CubeSuite+ V2.02.00
Mark area
APPENDIX A WINDOW REFERENCE
Displays the loop information for the specified input value.
The loop information is specified by selecting from the context menu or the [Edit] menu >>
[Mark] in the relevant field.
The following marks are displayed after the loop information has been specified.
Loop start location (endless loop)
Loop start location (with loop count)
Loop end location
Wait area
Displays as "wait time" the timing at which the specified input value is input to the pins.
The wait time is specified by directly writing numeric values in the relevant field.
Note that numeric values (decimal code) from 0 to 4,294,967,295 can be specified (values
that exceed 4,294,967,295 can be set by using one more line).
The wait time unit can be changed by selecting the [Edit] menu >> [Time unit].
Data area
Displays the input value input to the pins.
The input value is specified by directly writing numeric value in the relevant field.
Note that the input rules differ as follows according to the pin type.
Digital pins
Analog pins
Any one of the following one character
0
LOW signal
1
HIGH signal
Z
Hi-Z signal (case insensitive)
A decimal value from 0 to 5000 (unit: mV)
[Dedicated menu (Signal Data Editor window)]
(1) [Edit] menu
Undo
Cannot be selected.
Redo
Cannot be selected.
Cut
Cuts the selected range and saves it to the clipboard.
Copy
Copies the selected range and copies it to the clipboard.
Paste
Pastes the contents of the clipboard to the selected location.
Delete
Deletes the selected range.
Select All
Selects all display data.
Find
Cannot be selected.
Select Pin...
Opens the Select Pin dialog box. The pin(s) for which input signal data is to be created or
edited is (are) selected in this dialog box.
Time unit
Selects the wait time unit.
main clock
Main clock (default)
usec
Microsecond
msec
Millisecond
Pin Status
Selects the input status of the selected pin.
Valid
Enables data input to the pin (default).
Invalid
Disables data input to the pin.
R20UT2867EJ0100 Rev.1.00
Feb 01, 2014
Page 403 of 572
CubeSuite+ V2.02.00
Mark
APPENDIX A WINDOW REFERENCE
Sets a mark to the selected Mark area.
Loop Start
Sets the loop start mark.
Loop End
Sets the loop end mark.
Loop Dialog
Opens the Loop dialog box. Sets the details of loop information.
Signal Input
Inputs signal data to the simulator.
Start
Starts signal input.
Stop
Stops signal input.
Reset
Returns the current signal input line to the beginning.
(2) [View] menu
Information Bar
Selects whether the information bar is displayed or not.
(3) [Option] menu
Customize...
Opens the Customize dialog box.
[Signal Data Editor toolbar]
Opens the Select Pin dialog box.
The pin(s) for which input signal data is to be created or edited is (are) selected in this dialog box.
If this button is clicked while the program is running, signal input starts.
If this button is clicked while the program is stopped, signal input starts automatically the next time
the program execution is started.
If this button is clicked while the program is running, signal input is stopped.
If this button is clicked while the program is stopped, signal input does not start automatically even if
the program execution is started.
The current signal input line (line highlighted with yellow) is returned to the beginning.
[Context menu]
The following context menus are available at each area in the Client area.
(1) Pin area
Valid
Enables data input to the pin (default).
Invalid
Disables data input to the pin.
Select Pin...
Opens the Select Pin dialog box. The pin(s) for which input signal data is to be created or
edited is (are) selected in this dialog box.
(2) Line number
Cut
Cuts the selected range and saves it to the clipboard.
Copy
Copies the selected range and copies it to the clipboard.
Paste
Pastes the contents of the clipboard to the selected location.
R20UT2867EJ0100 Rev.1.00
Feb 01, 2014
Page 404 of 572
CubeSuite+ V2.02.00
Delete
APPENDIX A WINDOW REFERENCE
Deletes the selected range.
(3) Mark area
Cut
Cuts the selected cell and saves it to the clipboard.
Copy
Copies the selected cell and copies it to the clipboard.
Paste
Pastes the contents of the clipboard to the selected location.
Delete
Deletes the selected cell.
Loop Start
Sets the loop start mark.
Loop End
Sets the loop end mark.
Loop Dialog
Opens the Loop dialog box. Sets the details of loop information.
(4) Wait area
Cut
Cuts the data in the selected cell and saves it to the clipboard. The data in the selected cell
becomes 0.
Copy
Copies the data in the selected cell and copies it to the clipboard.
Paste
Pastes the contents of the clipboard to the selected location.
Delete
Deletes the data in the selected cell. The data in the selected cell becomes 0.
(5) Data area
Cut
Cuts the data in the selected cell and saves it to the clipboard. The data in the selected cell
becomes "Z" (Hi-Z).
Copy
Copies the data in the selected cell and copies it to the clipboard.
Paste
Pastes the contents of the clipboard to the selected location.
Delete
Deletes the data in the selected cell. The data in the selected cell becomes "Z" (Hi-Z).
Start Signal Input
Starts signal input.
Stop Signal Input
Stops signal input.
Reset Signal Input
Returns the current signal input line to the beginning.
[Operation]
(1) Pin selection
(2) Creating signal data
(3) Data copy and paste
(4) Single-line editing
(5) Signal input
(6) Operation at CPU reset
(1) Pin selection
To create the signal data, it is first necessary to select the pin to be used.
Open the Select Pin dialog box by clicking the
button on the toolbar or selecting the [Edit] menu >> [Select
Pin...], and select the pin to be used. Once a pin is selected, its name is displayed in Pin area.
R20UT2867EJ0100 Rev.1.00
Feb 01, 2014
Page 405 of 572
CubeSuite+ V2.02.00
APPENDIX A WINDOW REFERENCE
(2) Creating signal data
Create the signal data input to each pin.
(a) Setting of input value
In the Data area, specify the value that is input to each pin (see "Data area").
(b) Setting of input timing
In the Wait area, specify the timing at which the input value is input to each pin as "wait time" (see "Wait area").
(c) Setting of the loop information
When loop processing for the signal data specified in step (a) and (b) is needed, specify the loop information.
To specify the loop information, select [Loop Start] from the context menu on the loop start position in the Mark
area, and select [Loop End] on the loop stop position.
At this time, the loop count can be specified. In this case, specify the loop count via the Loop dialog box
opened by selecting [Loop Dialog...] from the context menu.
The corresponding loop information marks are displayed if the setting of the loop information is completed (see
"Mark area").
(3) Data copy and paste
The set values in Mark area/Wait area/Data area can be copied and pasted.
However, copied data can be pasted only in the same area.
Copy
When one or more (a range of) cells are selected, these cells can be copied by selecting the
[Edit] menu >> [Copy] (or pressing the [Ctrl] + [C] key).
Paste
When one or more (a range of) cells are selected, these cells can be pasted by selecting the
[Edit] menu >> [Paste] (or pressing the [Ctrl] + [V] key).
When multiple (a range of) cells are selected, the copied data is pasted to the cells repeatedly.
(4) Single-line editing
Single lines can be edited by selecting Line number area.
The method is the same as that described in "(3) Data copy and paste".
Data pasted during line paste (insertion) is inserted immediately before the selected line.
(5) Signal input
Input the created signal data to the input pins of the simulator while simulation is executed.
At this time, the line whose signal is currently being input (current line) is highlighted in yellow during program
breaks (this can be changed via [Inputted current line] item in the Customize dialog box), in order to display signal
input progress.
There are the following types of signal data input operations:
Signal input start
Click the
button, or select the [Edit] menu >> [Signal Input] >> [Start].
As a result, signal input starts from the current signal input line (highlighted line).
Signal input stop
Click the
button, or select the [Edit] menu >> [Signal Input] >> [Stop].
This stops signal input.
Signal reset
Click the
button, or select the [Edit] menu >> [Signal Input] >> [Reset].
This returns the current signal input line to the beginning. If signal reset was performed during
signal input, input continues from the beginning.
R20UT2867EJ0100 Rev.1.00
Feb 01, 2014
Page 406 of 572
CubeSuite+ V2.02.00
Remark
APPENDIX A WINDOW REFERENCE
The signal data input to the selected pin can be controlled by selecting the [Edit] menu >> [Pin Status]
>> [Valid]/[Invalid].
(6) Operation at CPU reset
When CPU reset occurs, the current signal input line returns to the beginning.
If a CPU reset occurs during signal input, input continues from the beginning (same operation as the
R20UT2867EJ0100 Rev.1.00
Feb 01, 2014
button).
Page 407 of 572
CubeSuite+ V2.02.00
APPENDIX A WINDOW REFERENCE
Loop dialog box
This dialog box is used to perform detailed settings (loop start/stop and loop count) related to the loop information in the
Signal Data Editor window.
Figure A-84. Loop Dialog Box
(1)
[Function buttons]
This section describes the following.
- [How to open]
- [Description of each area]
- [Function buttons]
[How to open]
On the Signal Data Editor window, any one of the following:
- Double-click the Mark area.
- Select the Mark area, then select [Mark] >> [Loop Dialog...] from the [Edit] menu.
[Description of each area]
(1) Loop information setting area
Start of Loop
Select this check box to set the Start of Loop.
Endless loop
Select this option button to set the Endless Loop.
Loop count
Select this option button to set the Loop Count.
Sets the count value by spin button.
End of Loop
0
Skip loop
1 to 99
Perform loop the specified count.
Select this check box to set the End of Loop.
[Function buttons]
Button
Function
OK
Validates the settings and closes this dialog box.
Cancel
Cancels the settings and closes this dialog box.
R20UT2867EJ0100 Rev.1.00
Feb 01, 2014
Page 408 of 572
CubeSuite+ V2.02.00
APPENDIX A WINDOW REFERENCE
Select Pin dialog box
This dialog box is used when selecting pins displayed in the Signal Data Editor window and the Timing Chart window.
The pin information set in this dialog box can be saved as a pin information file (*.pin) by clicking the [Save] button.
Moreover, the saved file contents can be restored by clicking the [Load] button.
Figure A-85. Select Pin Dialog Box
(1)
[Function buttons]
This section describes the following.
- [How to open]
- [Description of each area]
- [Function buttons]
[How to open]
On the Signal Data Editor window/Timing Chart window, any one of the following:
- Click the
button.
- Select [Select Pin...] from the [Edit] menu.
[Description of each area]
(1) Connection pins setting area
Up to 256 pins can be selected by using the scrollbar located on the right side of the pin name setting area.
Pin Name
This area is used to specify the pin name to be connected.
The connection pins can be specified either via direct input or through selection
from the drop-down list.
Analog
Select this check box to use the specified pin as an analog pin.
Function Name
This area is used to set a function name for the pin name.
When a character string is input in this area, this character string is displayed as a
function name in the pin name part. If nothing is specified, the pin name is displayed.
Remark
For the pin names that can be specified, see the user's manual of the microcontroller that is used.
R20UT2867EJ0100 Rev.1.00
Feb 01, 2014
Page 409 of 572
CubeSuite+ V2.02.00
APPENDIX A WINDOW REFERENCE
[Function buttons]
Button
OK
Function
Validates the settings and closes this dialog box.
The pin name (or display name) is applied in the Pin field of the window from where this dialog box
was called up.
Save
Saves the display contents to the pin information file (*.pin).
Load
Loads the pin setting information of the specified file (*.pin).
Clear
Deletes the settings.
Cancel
Cancels the settings and closes this dialog box.
R20UT2867EJ0100 Rev.1.00
Feb 01, 2014
Page 410 of 572
CubeSuite+ V2.02.00
APPENDIX A WINDOW REFERENCE
Timing Chart window
This window is used to display the output signals and input signals for pins in the form of a timing chart.
This window allows time measurement in main clock units.
The browsed signal data can be saved to the timing chart file (*.wvo) by selecting the [File] menu >> [Save]/[Save
As...]. Moreover, the saved file contents can be restored by selecting [File] menu >> [Open...].
If the project file is saved, signal data is not saved but information of the set pins is saved. (Solely saving the project file
is sufficient if saving of the measurement result is unnecessary.)
Cautions 1.
If the saved timing chart file is opened or the project file is opened while Simulator GUI is running with a microcontroller different from the one used when the timing chart file was created,
the settings of pins that are not provided in the microcontroller will not be restored.
2.
The main clock and sub clock waveforms cannot be displayed in this window. In addition, when
using the external bus interface function, the waveforms of pins used for the external bus interface function cannot be displayed.
Figure A-86. Timing Chart Window
(1)
(2)
This section describes the following.
- [How to open]
- [Description of each area]
- [Dedicated menu (Timing Chart window)]
- [Timing Chart toolbar]
- [Context menu]
- [Operation]
[How to open]
- Click the
button.
- Select [Timing Chart] from the [Simulator] menu.
[Description of each area]
(1) Information bar
It can be specified whether this area is displayed or not, by selecting the [View] menu >> [Information Bar].
Clock/time count from simulation start until marker A location.
R20UT2867EJ0100 Rev.1.00
Feb 01, 2014
Page 411 of 572
CubeSuite+ V2.02.00
APPENDIX A WINDOW REFERENCE
Clock/time count from simulation start until marker B location.
Clock/time count between markers A and B. (Displayed as absolute value.)
Select from the drop-down list the time unit for the location information of markers A and B.
This item can also be set by using [Time unit] in the [Edit] menu or [Time unit] from the context menu.
Selects the waveform data display magnification ratio from the drop-down list.
If a part of waveform data may be lost as a result of changing the display magnification ratio, the
confirmation dialog box is displayed.
Remarks 1.
Up to 4,294,967,262 clocks can be counted from the simulation start up to the marker position.
When the count reaches the maximum value, the counter is cleared to 0 and starts counting again.
2.
The menu for setting the magnify ratio appears dimmed during program execution, so changing
the ratio is unavailable.
(2) Client area
Marker area
Waveform area
Pin area
Pin Name area
Displays the names of the pins for which timing chart display is performed. Pin selection is
performed by selecting the [Edit] menu >> [Select Pin...] to open the Select Pin dialog box.
Marker area
Displays the 2 marker headers. These markers can be moved by dragging them with the
mouse over this area.
Maker A
Maker B
Waveform area
Performs timing chart display for the data of the pins specified in the Pin area.
The following color distinctions are used according to the signal by default.
Remarks 1.
Green
The HIGH and LOW signals of the pins
Red
High-impedance signals
Blue
Unsampled signals
When the buffer is full, the data will be overwritten by the latest data starting from the oldest data
because the buffer storing the pin data is in a ring buffer format.
The upper limit of the buffer size is one of the following.
- The number of pin change points:
4,096
- The number of clocks:
2,147,483,631
- Horizontal draw width:
134,217,711 pixels
R20UT2867EJ0100 Rev.1.00
Feb 01, 2014
Page 412 of 572
CubeSuite+ V2.02.00
2.
APPENDIX A WINDOW REFERENCE
The colors and fonts can be changed via the Customize dialog box opened by selecting the
[Option] menu >> [Customize...].
[Dedicated menu (Timing Chart window)]
(1) [Edit] menu
Clear
Deletes all the waveform data.
Find...
Opens the Search Data dialog box.
Waveform data search is performed in this dialog box.
Search backward
Searches for the change point of the selected pin in the backward direction (toward the left).
Search forward
Searches for the change point of the selected pin in the forward direction (toward the right).
Select Pin...
Opens the Select Pin dialog box. The pin for which the waveform data is to be displayed is
selected in this dialog box.
Time unit
Selects the time unit.
main clock
Main clock (default)
usec
Microsecond
msec
Millisecond
(2) [View] menu
Waveform
Switches on/off display of the Maker area and Waveform area.
Information Bar
Switches on/off display of the information bar.
Zoom
Selects the waveform data display magnification ratio from a cascade menu.
If a part of waveform data may be lost as a result of changing the display magnification ratio,
the confirmation dialog box is displayed.
x 1/32
Sets the magnification ratio to 1/32.
x 1/16
Sets the magnification ratio to 1/16.
x 1/8
Sets the magnification ratio to 1/8.
x 1/4
Sets the magnification ratio to 1/4.
x 1/2
Sets the magnification ratio to 1/2.
x1
Sets the magnification ratio to 1.
x2
Sets the magnification ratio to 2.
x4
Sets the magnification ratio to 4.
x8
Sets the magnification ratio to 8.
x 16
Sets the magnification ratio to 16.
x 32
Sets the magnification ratio to 32.
(3) [Option] menu
Customize...
R20UT2867EJ0100 Rev.1.00
Feb 01, 2014
Opens the Customize dialog box.
Page 413 of 572
CubeSuite+ V2.02.00
APPENDIX A WINDOW REFERENCE
[Timing Chart toolbar]
Deletes all the waveform data.
Searches for the change point of the selected pin in the backward direction (toward the left).
Searches for the change point of the selected pin in the forward direction (toward the right).
Opens the Select Pin dialog box. The pin for which the waveform data is to be displayed is
selected in this dialog box.
Selects the waveform data display magnification ratio from the drop-down list.
If a part of waveform data may be lost as a result of changing the display magnification ratio, the
confirmation dialog box is displayed.
[Context menu]
The following context menus are available in the Client area.
Clear
Deletes all the waveform data.
Find...
Opens the Search Data dialog box.
Waveform data search is performed in this dialog box.
Search backward
Searches for the change point of the selected pin in the backward direction (toward the left).
Search forward
Searches for the change point of the selected pin in the forward direction (toward the right).
Select Pin...
Opens the Select Pin dialog box. The pin for which the waveform data is to be displayed is
selected in this dialog box.
Waveform
Switches on/off display of the Maker area and Waveform area.
Time unit
Selects the time unit.
Zoom
Selects the waveform data display magnification ratio.
If a part of waveform data may be lost as a result of changing the display magnification ratio, the
confirmation dialog box is displayed.
Move MakerA
Moves marker A to the cursor location. The same action can be accomplished by pressing the
[Shift] key + left-clicking.
Move MakerB
Moves market B to the cursor location. The same action can be accomplished by pressing the
[Ctrl] key + left-clicking.
[Operation]
(1) Pin selection
(2) Display of timing chart
(3) Clearing of timing chart
(4) Timing measurement for timing chart
(5) Data search function
(6) Operation at reset
(1) Pin selection
To display the timing chart, it is first necessary to select the pin to be displayed.
Open the Select Pin dialog box by selecting the [Edit] menu >> [Select Pin...] and select the pin to be edited. Once
a pin is selected, its name is displayed in the Pin Name area.
R20UT2867EJ0100 Rev.1.00
Feb 01, 2014
Page 414 of 572
CubeSuite+ V2.02.00
APPENDIX A WINDOW REFERENCE
(2) Display of timing chart
The waveforms of the selected pins are displayed in timing chart form through execution of the program.
Remark
The simulation speed can be increased by hiding the timing chart.
To hide the timing chart, select the [View] menu >> [Waveform] (deselect this item).
When the timing chart is hidden, the Maker area and Waveform area appear dimmed and "Display
OFF" is displayed in the center.
(3) Clearing of timing chart
Timing chart display is cleared by selecting the [Edit] menu >> [Clear].
(4) Timing measurement for timing chart
The timing between two points can be measured by marking 2 locations using markers A and B.
The time of each marker and the time between markers are displayed in the information bar.
Each marker can be placed at the target position by dragging the marker head. Moreover, it can also be placed at
the position of the current mouse cursor by selecting [Move MarkerA]/[Move MarkerB] from the context menu.
The marker that is clicked last becomes the selected marker and can be subjected to the Data search function.
Figure A-87. Maker A And Maker B
A
B
Selected markers
A
B
Unselected makers
(5) Data search function
There are two data search functions for timing charts.
(a) Simple search
Simple search is a function used to search change points for one pin.
Select the name of the pin for which the search is to be performed in the Pin area and then select the [Edit]
menu >> [Search backward] or [Search forward].
As a result, the selected marker moves to the data position at which the change point was detected.
(b) Detailed search
In the case of detailed search, search using a combination of data of multiple pins can be executed.
The search data is set in theSearch Data dialog box displayed by selecting the [Edit] menu >> [Find...].
The selected marker moves to the data position that was hit, similarly to simple search results.
(6) Operation at reset
If CPU reset or Simulator GUI reset occurs, the displayed waveforms of the timing chart are all cleared.
R20UT2867EJ0100 Rev.1.00
Feb 01, 2014
Page 415 of 572
CubeSuite+ V2.02.00
APPENDIX A WINDOW REFERENCE
Search Data dialog box
This dialog box is used to search the signal data displayed in the Timing Chart window in detail.
Cautions 1.
2.
Analog I/O signals cannot be searched.
This dialog box cannot be opened during program execution.
Figure A-88. Search Data Dialog Box
(1)
(1)
[Function buttons]
This section describes the following.
- [How to open]
- [Description of each area]
- [Function buttons]
[How to open]
On the Timing Chart window, any one of the following:
- Click the
button.
- Select [Find...] from the [Edit] menu.
[Description of each area]
(1) Search pin setting area
When multiple search conditions have been specified, the signal data that meets all these search conditions is
searched.
Up to 48 search conditions can be specified by using the scrollbar located on the right side.
Pin Name
This area is used to specify the pin name to be searched.
The pins can be specified either via direct input or through selection from the drop-down list.
Inputting noting makes an area off-limit to data search and input in the corresponding [Search
Data] is disabled.
R20UT2867EJ0100 Rev.1.00
Feb 01, 2014
Page 416 of 572
CubeSuite+ V2.02.00
APPENDIX A WINDOW REFERENCE
Search Data
Selects the data from drop-down list. The data is searched for the pin to be specified.
Direction
------
Don't care
Rising Edge
Searches the rising edge of signal data.
Falling Edge
Searches the falling edge of signal data.
Rise/Fall Edge
Searches the rising/falling edge of the signal data.
High
Searches the signal data that is HIGH.
Low
Searches the signal data that is LOW.
Hi Z
Searches the signal data that is high impedance.
Selects the data search direction by selecting one of the exclusive option buttons. When the
[Next] button is clicked, the search is performed in the direction specified in this area.
Backward
Forward
Searches the data backward (data older than the current location).
Searches the data forward (data newer than the current location).
(default)
[Function buttons]
Button
Next
Function
Searches in the direction specified. When this button is clicked again following search completion,
the next data is searched.
Cancel
Stops the data search and closes the dialog box.
R20UT2867EJ0100 Rev.1.00
Feb 01, 2014
Page 417 of 572
CubeSuite+ V2.02.00
APPENDIX A WINDOW REFERENCE
I/O Panel window
This window is used to configure a dummy target system, and manipulate created connected parts.
A dummy target system can be constructed by creating and setting connected parts (figure objects and part objects) in
this window. The connected parts for which settings have been performed can be moved to any location within the window, and you can manipulate them during simulation to control signal processing.
Information about parts that are placed in the window can be saved to the I/O panel file (*.pnl) by selecting the [File]
menu >> [Save]/[Save As...] or by saving the project file.
The saved file contents can be restored by selecting the [File] menu >> [Open...] or by loading the project file.
Cautions 1.
If the saved I/O panel file is opened while Simulator GUI is running with a microcontroller different from the one used when the file was created, information of the parts connected to the pins
that are not provided in the microcontroller will not be restored (the [Pin Name] item in the property dialog boxes for parts remains blank).
2.
If inputting of signals is started (by an event such as clicking a button) during program break,
the signal level will change in actuality when the program is resumed from the break.
Remark
On the titlebar of this window, "Project file name + Serial number (from 0).pnl" is displayed when the project
file has been loaded. However, after having loaded a project file of PM+, then if you save a file as the
project file of CubeSuite+, "Project file name + CS+ Serial number (from 0).pnl" is displayed on the titlebar.
Figure A-89. I/O Panel Window
(1)
This section describes the following.
- [How to open]
- [Description of each area]
- [Dedicated menu/toolbar (I/O Panel window)]
- [Context menu]
- [Operation]
[How to open]
- Click the
button.
- Select [I/O Panel...] from the [Simulator] menu.
R20UT2867EJ0100 Rev.1.00
Feb 01, 2014
Page 418 of 572
CubeSuite+ V2.02.00
APPENDIX A WINDOW REFERENCE
[Description of each area]
(1) Client area
This area is used to create and set connected parts (figure objects and part objects) in order to construct a dummy
target system (see "[Operation]").
[Dedicated menu/toolbar (I/O Panel window)]
The menu items and buttons on the toolbar, which are used to perform operations related to this window, are described
below.
(1) [Edit] menu
Select this menu to perform basic editing actions on created objects.
Undo
Undoes the immediately preceding operation, such as object move.
Undo can restore up to 5 previous changes.
Redo
Restores the status undone by the [Undo] command.
Cut
Cuts the selected range and saves it to the clipboard.
Copy
Pastes the contents of the clipboard.
Paste
Pastes the contents of the clipboard.
Delete
Deletes the selected range.
Select All
Selects all the objects in the window.
Group
Groups the selected objects.
UnGroup
Ungroups the selected objects.
Bring to Front
Brings the selected object to the front.
Send to Back
Sends the selected object to the back.
Bring Forward
Brings the selected object one panel forward.
Send Backward
Sends the selected object one panel backward.
(2) [View] menu
Select this menu to switch the toolbar/status bar display status in this window, or to show/hide various types of
information in this window.
ToolBar
Switches on and off the display of two toolbars (Figure/Object).
StatusBar
Switches on and off display of the status bar.
Parts List...
Opens the Parts List dialog box.
A list of all the figure/part objects in this window is displayed.
Grid
Shows/hides the window grid.
Properties
Opens the property dialog box of the selected figure/part object.
(3) [Parts] menu/[Parts] toolbar
This menu and toolbar are used to select connected parts (part objects) provided by Simulator GUI when newly
creating or placing parts (see "(3) Creating part objects").
In this menus, similar operations can be performed using the buttons on the [Parts] toolbar.
R20UT2867EJ0100 Rev.1.00
Feb 01, 2014
Page 419 of 572
CubeSuite+ V2.02.00
Menu Item
APPENDIX A WINDOW REFERENCE
Button
Button
e.g.)
Function
Digital input switch
A button can be connected to any pin. A digital input value can be given to the connected pin by clicking the displayed button.
Analog Button
e.g.)
Analog input switches
A button can be connected to any pin. An analog input value can be given to the connected pin by clicking the displayed button.
Key Matrix
e.g.)
A key matrix consists of multiple pins connected in a matrix array, wherein each contact represents a key, and clicking a key results in a specific state.
A key matrix can be connected to any pin, and data can be input using multiple keys.
Level Gauge
e.g.)
Used for inputting analog data such as power supply voltage. Any data within a given
range can be set.
Any value within a specified range can be assigned to a pin connected to an A/D converter.
LED
e.g.)
Light Emitting Diode
An LED can be connected to any pin, and the output from the pin can be indicated by
switching the LED on or off.
7-Segment LED
e.g.)
A product that consists of 7 LEDs configured to represent a numeric figure.
When the output from the pin assigned to the digit signal is active, the corresponding
7-segment LED switches on or off.
14-Segment LED
e.g.)
Matrix LED
e.g.)
A product that consists of 14 LEDs configured to represent an alphabetic character.
When the output from the pin assigned to the digit signal is active, the corresponding
14-segment LED switches on or off.
A product that consists of multiple LEDs arranged in a matrix array.
When the output from an assigned pin is active, the corresponding 14-segment LED
switches on or off.
Buzzer
e.g.)
Pull up / Pull down...
A buzzer connected to a pin indicates the output information from the connected pin
with a bitmap.
Opens the Pull up/Pull down dialog box.
Whether a pin is connected to a pull-up/down resistor can be specified via this dialog
box.
(4) [Figure] menu/[Figure] toolbar
This menu and toolbar are used to set the operation mode of this window, and select connected parts (figure
objects) when newly creating or placing parts (see "(2) Creating figure objects").
In this menus, similar operations can be performed using the buttons on the [Figure] toolbar.
R20UT2867EJ0100 Rev.1.00
Feb 01, 2014
Page 420 of 572
CubeSuite+ V2.02.00
Menu Item
APPENDIX A WINDOW REFERENCE
Button
Select
Function
Changes this window's operation mode to the Edit mode.
The cursor shape changes into an arrow, enabling the edit of objects.
Simulation Mode
Changes this window's operation mode to the Simulation mode.
The cursor shape changes into a hand, enabling simulation of input to connected parts
(part objects).
Line
Changes the cursor shape into a cross (+), enabling the drawing of lines.
Rectangle
Changes the cursor shape into a cross (+), enabling the drawing of rectangles.
Rounded Rectan-
Changes the cursor shape into a cross (+), enabling the drawing of rectangles with
gle
rounded corners.
Ellipse
Changes the cursor shape into a cross (+), enabling the drawing of ellipses.
Polygon
Changes the cursor shape into a cross (+), enabling the drawing of polygons.
Fan-shaped
Changes the cursor shape into a cross (+), enabling the drawing of fan shapes.
Text
Changes the cursor shape into a cross (+), enabling the drawing of text.
Paste Bitmap...
-
Color of Line...
Pastes the selected bitmap file in this window
Opens the Color dialog box below.
The color of the lines of the selected object can be changed to the selected color in this
dialog box.
Color of Fill...
Opens the Color dialog box.
The color used for the selected object can be changed to the selected color in this dialog
box.
R20UT2867EJ0100 Rev.1.00
Feb 01, 2014
Page 421 of 572
CubeSuite+ V2.02.00
Menu Item
Font...
APPENDIX A WINDOW REFERENCE
Button
-
Function
Opens the Font dialog box below
The font of the selected object can be changed to the selected font in this dialog box.
Style of Line
Selects the line style from a cascade menu. The lines of the selected object are changed.
16pt
Sets the line thickness to 16 pt.
12pt
Sets the line thickness to 12 pt.
8pt
Sets the line thickness to 8 pt.
4pt
Sets the line thickness to 4 pt.
2pt
Sets the line thickness to 2 pt.
1pt
Sets the line thickness to 1 pt.
No line
Does not draw lines.
Dotted Line Style
Selects the dotted line style from a cascade menu. The lines of the selected object are
changed.
Solid Line
Draw solid lines.
Dash Line
Draw dashed lines.
Dotted Line
Draw dotted lines.
DashDot Line
Draw DashDot lines.
DashDotDot Line
Draw DashDotDot lines.
[Context menu]
In the Edit mode, the following context menus are available.
Copy
Copies the selected objects.
Paste
Pastes the contents of the clipboard.
Delete
Deletes the selected objects.
Group
Selects from a cascade menu.
R20UT2867EJ0100 Rev.1.00
Feb 01, 2014
Page 422 of 572
CubeSuite+ V2.02.00
APPENDIX A WINDOW REFERENCE
Group
Groups the selected objects.
Ungroup
Ungroups the selected objects.
Order
Selects from a cascade menu.
Bring to Front
Brings the selected object to the front.
Send to Back
Sends the selected object to the back.
Bring Forward
Brings the selected object one panel forward.
Send Backward
Sends the selected object one panel backward.
Properties
Opens the property dialog box of the selected figure/part object.
[Operation]
How to create objects (figure objects and part objects) to construct a dummy target system, and manipulate them is as
follows:
(1) Edit mode
(2) Creating figure objects
(3) Creating part objects
(4) Placing objects
(5) Inputting text
(6) List display of objects
(7) The detailed setting for objects
(8) Simulation mode
(1) Edit mode
Change the operation mode of this window to "edit mode" to create objects.
The edit mode can be set by any one of the following methods.
- Select the [Figure] menu >> [Select].
- Click the
button on the toolbar.
- Select the [Edit] menu >> [Select All].
(2) Creating figure objects
(a) Line
Select the [Figure] menu >> [Line] or click the
button on the toolbar.
-> The mouse cursor changes to a cross (+) shape and line drawing becomes possible.
Drag the cursor from the line start position to the end position.
-> The line start position and the line end position are connected by a straight line. (The line thickness and
shape are the default settings.)
(b) Rectangle/Rounded rectangle/Fan shape
Select the [Figure] menu >> [Rectangle]/[Rounded Rectangle]/[Ellipse]/[Fan-shaped] or click the
/
/
/
button on the toolbar.
-> The mouse cursor changes to a cross (+) shape and each drawings becomes possible.
Drag the mouse cursor from the top left corner to the bottom right corner of the drawing area (rectangular area).
-> The corresponding figure is displayed in the drawing area, with the mouse position forming the lower
right corner.
Drop the figure to fix its size.
R20UT2867EJ0100 Rev.1.00
Feb 01, 2014
Page 423 of 572
CubeSuite+ V2.02.00
APPENDIX A WINDOW REFERENCE
-> Rectangles are drawn in the same size as the rectangular area, and other figure shapes are drawn in a
size that fits in the rectangular area. (The line thickness and shape are the default settings.)
(c) Polygon
Select the [Figure] menu >> [Polygon] or click the
button on the toolbar.
-> The mouse cursor changes to a cross (+) shape and polygon drawing becomes possible.
Click at each position marking an apex of the polygon.
-> The apexes are linked by a straight line in the order in which they were clicked.
Drawing of the polygon is completed by double-clicking.
-> The line thickness and shape are the default settings.
(d) Pasting a bitmap
You can use an arbitrary bitmap file as a figure object.
Select the [Figure] menu >> [Paste Bitmap], and then select the bitmap file (*.bmp) to be pasted.
-> The corresponding bitmap file is pasted in the default position in this window.
(e) Changing the figure object style
The color or line style of the created figure object can be changed by any one of the following methods.
- Specify with the [Style] tab of the Object Properties dialog box opened by double-clicking the figure object.
- Select the [Figure] menu >> [Color of Line]/[Color of Fill]/[Style of Line]/[Dotted Line Style] or click the
/
/
/
button on the toolbar.
(3) Creating part objects
You can create part objects by using connected parts provided by Simulator GUI.
(a) Selecting a part object
Select the part object to be created from the [Parts] menu or the toolbar.
-> The mouse cursor changes to a cross (+) shape.
Click any location.
-> The corresponding part object is created and placed with the clicked location as the top left corner
(default size).
(b) Changing the part object style
The style of the created part object can be changed via the [Style] tab of the corresponding property dialog box
opened by double-clicking the part object.
For details on the modifiable items, see the section of the property dialog box which is corresponding to the
part object (the items differ depending on the part object).
(4) Placing objects
(a) Grid display
A grid is displayed by selecting the [View] menu >> [Grid].
(b) Selecting objects
The selected types and methods are indicated below.
The selected object(s) is displayed surrounded by a tracker indicating its selected status.
- Single selection
Click the object to be selected.
- Multiple selections
Click the objects to be selected while pressing the [Shift] key.
R20UT2867EJ0100 Rev.1.00
Feb 01, 2014
Page 424 of 572
CubeSuite+ V2.02.00
APPENDIX A WINDOW REFERENCE
- Range selection
Drag from the top left corner of the area including the object to be selected, and drop at the lower right corner.
- Select all
Select [Edit] menu>> [Select All].
(c) Moving objects
After selecting the object to be moved (multiple selections possible), then drag and drop it at the move destination.
Remark
Objects can be moved using the arrow keys on the keyboard.
If more than half of the part bitmap is hidden when the window size is reduced, however, the
selected part cannot be moved by using the arrow keys.
Here, the part (14-segment LED in this
Here, the part (14-segment LED in this case)
case) can be moved using the arrow keys.
cannot be moved using the arrow keys.
(d) Changing object size
After selecting the object whose size is to be changed, then drag the tracker displayed.
(e) Cut/Copy/Paste/Delete/Group/UnGroup an object
After selecting the object, select the corresponding item from the [Edit] menu.
(f) Changing object sequence (Bring to Front/Send to Back/Bring Forward/Send Backward)
After selecting the object, select the corresponding item from the [Edit] menu.
(5) Inputting text
Select [Figure] menu >> [Text] or click the
button on the toolbar.
-> The mouse cursor changes to a cross (+) shape.
Drag the mouse cursor from the top left corner of the character drawing area (rectangular area) to the lower right
corner.
-> This rectangular area serves as the character drawing area.
Click in the character drawing area.
-> The cursor is displayed and character input becomes possible.
(6) List display of objects
Fugure objects and part objects created in this window can be displayed as a list by selecting the [View] menu >>
[Parts List], in addition to display in this window.
R20UT2867EJ0100 Rev.1.00
Feb 01, 2014
Page 425 of 572
CubeSuite+ V2.02.00
APPENDIX A WINDOW REFERENCE
(7) The detailed setting for objects
Each created object requires the detailed setting (pin connection information, etc.) in accordance with the target
system to be used.
(a) Figure objects
The detailed setting can be performed via the [Object Connection] tab of the Object Properties dialog box
opened by double-clicking the target figure object.
By connecting a object to an output pin, show/hide of the object can be switched depending on the output status of the connected pin.
(b) Part objects
The detailed setting can be performed via the [xxx Connection] tab of the property dialog box opened by double-clicking the target part object.
For details on the setable items, see the section of the property dialog box which is corresponding to the part
object (the items differ depending on the part object).
(8) Simulation mode
The part objects whose settings have been completed can be manipulated during simulation (input values can be
fed to the simulator). Accordingly you can check the I/O results from these displayed part objects in this window.
Change the operation mode of this window to "simulation mode" to manipulate part objects.
The simulation mode can be set by any one of the following methods (the mouse cursor changes to a hand shape).
- Select the [Figure] menu >> [Simulation Mode].
- Click the
Remark
button on the toolbar.
For details on input operation, see the section of the property dialog box which is corresponding to the
part object
R20UT2867EJ0100 Rev.1.00
Feb 01, 2014
Page 426 of 572
CubeSuite+ V2.02.00
APPENDIX A WINDOW REFERENCE
Parts Button Properties dialog box
This property dialog box is used to set or change the pin connection information of buttons, which are one of the connection parts in the I/O Panel window.
Input to the simulator can be done from pin-connected buttons in the Simulation mode.
There are two types of button display styles, figure and bitmap. These styles can be changed on the [[Style] tab].
Figure A-90. Parts Button Properties Dialog Box: [Button Connection] Tab
(1)
[Function buttons]
Figure A-91. Parts Button Properties Dialog Box: [Style] Tab
(1)
(2)
[Function buttons]
R20UT2867EJ0100 Rev.1.00
Feb 01, 2014
Page 427 of 572
CubeSuite+ V2.02.00
APPENDIX A WINDOW REFERENCE
This section describes the following.
- [How to open]
- [[Button Connection] tab]
- [[Style] tab]
- [Function buttons]
- [Operation]
[How to open]
On the I/O Panel window, any one of the following:
- Double-click a part object "Button".
- Select [Properties...] form the context menu on a part object "Button".
- Select a part object "Button", and then select [Properties...] form the [View] menu.
[[Button Connection] tab]
(1) Pin connection information setting area
Label
This area is used to specify the part name. The part name input here is displayed on the button. Moreover, it is also displayed in the Parts List dialog box as the label.
Pin Name
This area is used to specify the pin name to be connected. The connection pins can be specified either via direct input or through selection from the drop-down list.
Active Level
Type
The active state is selected with a option button, as follows:
LOW
Sets the active level to LOW.
HIGH
Sets the active level to HIGH (default).
Button types are selected using option buttons, as follows:
Push
Makes the button a Push button (default).
The [Hold Time] item must be specified.
Toggle
Makes the button a Toggle button.
Group
Makes the button a Group button.
The [Group Name] item must be specified.
Group Name
This area is used to input the button's group name. Input to this area is possible only when
[Group] has been selected in [Type].
Hold Time
Specify the time (hold time) for which the input value is to be held (default: 0.5msec). The
settable range is from 0.001 to 999 (msec).
Input to this area is possible only when [Push] has been selected in [Type].
default
Remark
Specify the button status after CPU reset.
Not change at reset.
Maintains the button status after CPU reset.
inactive
Buttons are non-depressed after CPU reset (default).
active
Buttons are depressed after CPU reset.
For the pin names that can be specified, see the user's manual of the microcontroller that is used.
R20UT2867EJ0100 Rev.1.00
Feb 01, 2014
Page 428 of 572
CubeSuite+ V2.02.00
APPENDIX A WINDOW REFERENCE
[[Style] tab]
(1) Style information setting area
Figure
Select this option button to display the button with the following specified figure.
Shape
Select the figure shape. Two shapes can be selected: rectangle and ellipse.
shadow
Cannot be selected.
Line
Specify and change the figure line, as follows.
You can change the color of figure line by clicking the pull-down button.
Thickness
Specifies the line thickness.
Specification is made either using a spin button or through direct input.
A value from 1 to 100 can be specified.
Fill up
Active
Specifies the color of the line during active display.
Inactive
Specifies the color of the line during inactive display.
Specify and change the figure filling, as follows.
You can change the color of figure filling by clicking the pull-down button.
Bitmap
Active
Specifies the fill color during active display.
Inactive
Specifies the fill color during inactive display.
Select this option button to display the button with the following specified bitmap (default).
Selection list
Select a bitmap to be used from the selection list.
The selectable bitmaps appear in the selection list.
[Add] button
Opens the Entry Bitmap dialog box below to add a new bitmap to the selection list.
The bitmap file to be added can be specified either through file selection using the [...]
button, or through direct input.
[Delete] button
Deletes the currently selected bitmap from the selection list.
Note that only the bitmap that have been added by user can be deleted.
(2) Preview area
This area displays the style of the button currently being specified.
[Function buttons]
Button
Function
OK
Validates the settings and closes this dialog box.
Cancel
Cancels the settings and closes this dialog box.
Apply
Cannot be selected.
Help
Displays the help for this dialog box.
R20UT2867EJ0100 Rev.1.00
Feb 01, 2014
Page 429 of 572
CubeSuite+ V2.02.00
APPENDIX A WINDOW REFERENCE
[Operation]
In the Simulation mode, by clicking the displayed button, data can be input to the pin connected to the button.
The input format differs depending on the button type (push, toggle, group).
Figure A-92. Connected Parts Display Example (Button)
Push button
Clicking this button causes the active value to be loaded to the connected pin.
The active value is held during the hold time, after which it changes to the original value.
Toggle button
Clicking this button loads the active value to the connected pin.
The active value is held during the hold time, after which it changes to the original value.
Group button
Clicking this button loads the active value to the connected pin.
The value of the Group button having the same group name returns to the original value.
R20UT2867EJ0100 Rev.1.00
Feb 01, 2014
Page 430 of 572
CubeSuite+ V2.02.00
APPENDIX A WINDOW REFERENCE
Analog Button Properties dialog box
This property dialog box is used to set or change the pin connection information of analog buttons, which are one of the
connection parts in the I/O Panel window.
Input to the simulator can be done from pin-connected analog buttons in the Simulation mode.
There are two types of analog button display styles, figure and bitmap. These styles can be changed on the [[Style]
tab].
Figure A-93. Analog Button Properties Dialog Box: [Analog Button Connection] Tab
(1)
[Function buttons]
Figure A-94. Analog Button Properties Dialog Box: [Style] Tab
(1)
(2)
[Function buttons]
R20UT2867EJ0100 Rev.1.00
Feb 01, 2014
Page 431 of 572
CubeSuite+ V2.02.00
APPENDIX A WINDOW REFERENCE
This section describes the following.
- [How to open]
- [[Analog Button Connection] tab]
- [[Style] tab]
- [Function buttons]
- [Operation]
[How to open]
On the I/O Panel window, any one of the following:
- Double-click a part object "Analog Button".
- Select [Properties...] form the context menu on a part object "Analog Button".
- Select a part object "Analog Button", and then select [Properties...] form the [View] menu.
[[Analog Button Connection] tab]
(1) Pin connection information setting area
Label
This area is used to specify the part name. The part name input here is displayed on the button. Moreover, it is also displayed in the Parts List dialog box as the label.
Pin Name
This area is used to specify the pin name to be connected. The connection pins can be specified either via direct input or through selection from the drop-down list.
Active
Specify the active state.
Check box
Analog buttons are created by the number of selected check boxes.
Label
Directly input the name to be displayed on each analog button.
Voltage(mV)
Directly input the voltage to be input when each analog button is
clicked, in mV units.
Arrange
Specify the button arrangement using the option button.
This setting is available if two or more analog buttons have been created in the Active area.
This setting is ignored if there is only one analog button or no analog buttons have been created.
default
Row
Analog buttons will be arranged horizontally (default).
Column
Analog buttons will be arranged vertically.
Maintains the analog button operation after CPU reset.
Not change at reset.
Maintains the analog button status immediately before CPU reset,
after CPU reset.
inactive
All of the analog buttons are non-depressed after CPU reset
(default).
Active is 'xxx'yyy(mV)
The analog button specified with "'xxx'(yyymV) " is depressed after
CPU reset.
Inactive
Remark
Specify the input level when no analog buttons are depressed.
For the pin names that can be specified, see the user's manual of the microcontroller that is used.
R20UT2867EJ0100 Rev.1.00
Feb 01, 2014
Page 432 of 572
CubeSuite+ V2.02.00
APPENDIX A WINDOW REFERENCE
[[Style] tab]
(1) Style information setting area
Figure
Select this option button to display the analog button with the following specified figure.
Shape
Select the figure shape. Two shapes can be selected: rectangle and ellipse.
shadow
Cannot be selected.
Line
Specify and change the figure line, as follows.
You can change the color of figure line by clicking the pull-down button.
Thickness
Specifies the line thickness.
Specification is made either using a spin button or through direct input.
A value from 1 to 100 can be specified.
Fill up
Active
Specifies the color of the line during active display.
Inactive
Specifies the color of the line during inactive display.
Specify and change the figure filling, as follows.
You can change the color of figure filling by clicking the pull-down button.
Bitmap
Active
Specifies the fill color during active display.
Inactive
Specifies the fill color during inactive display.
Select this option button to display the analog button with the following specified bitmap (default).
Selection list
Select a bitmap to be used from the selection list.
The selectable bitmaps appear in the selection list.
[Add] button
Opens the Entry Bitmap dialog box below to add a new bitmap to the selection list.
The bitmap file to be added can be specified either through file selection using the [...]
button, or through direct input.
[Delete] button
Deletes the currently selected bitmap from the selection list.
Note that only the bitmap that have been added by user can be deleted.
(2) Preview area
This area displays the style of the analog button currently being specified.
[Function buttons]
Button
Function
OK
Validates the settings and closes this dialog box.
Cancel
Cancels the settings and closes this dialog box.
Apply
Cannot be selected.
Help
Displays the help for this dialog box.
R20UT2867EJ0100 Rev.1.00
Feb 01, 2014
Page 433 of 572
CubeSuite+ V2.02.00
APPENDIX A WINDOW REFERENCE
[Operation]
In the Simulation mode, while an analog button is depressed, the specified analog voltage value is input to the specified
pin.
Clicking the depressed analog button again restores the button to its original state.
Figure A-95. Connected Parts Display Example (Analog Button)
R20UT2867EJ0100 Rev.1.00
Feb 01, 2014
Page 434 of 572
CubeSuite+ V2.02.00
APPENDIX A WINDOW REFERENCE
Parts Key Properties dialog box
This property dialog box is used to set or change the pin connection information of a key matrix, which is one of the
connection parts in the I/O Panel window.
Input to the simulator can be done from pin-connected keys in the Simulation mode.
A key matrix consisting of input pins and output pins of up to 16 x 16 can be set.
Either figure or bitmap can be selected as the key matrix display style. These styles can be changed on the [[Style] tab].
Caution
When connecting a key matrix to pins, also perform the Pull up/Pull down settings for the connection pins. When a key is pressed, the output value of the output pin connected to that key is input to
the input pin connected to that key. The value when the key is not pressed is the value specified in
the Pull up/Pull down dialog box.
If the Pull up/Pull down settings are not performed, the input pin becomes the high-impedance
state. Consequently, the operation of the function that is connected to the input pin becomes undefined.
Figure A-96. Parts Key Properties Dialog Box: [Key Matrix Connection] Tab
(1)
[Function buttons]
R20UT2867EJ0100 Rev.1.00
Feb 01, 2014
Page 435 of 572
CubeSuite+ V2.02.00
APPENDIX A WINDOW REFERENCE
Figure A-97. Parts Key Properties Dialog Box: [Style] Tab
(2)
(1)
[Function buttons]
This section describes the following.
- [How to open]
- [[Key Matrix Connection] tab]
- [[Style] tab]
- [Function buttons]
- [Operation]
[How to open]
On the I/O Panel window, any one of the following:
- Double-click a part object "Key matrix".
- Select [Properties...] form the context menu on a part object "Key matrix".
- Select a part object "Key matrix", and then select [Properties...] form the [View] menu.
[[Key Matrix Connection] tab]
(1) Pin connection information setting area
Label
This area is used to specify the part name. The part name input here is also displayed in the
Parts List dialog box as the label.
R20UT2867EJ0100 Rev.1.00
Feb 01, 2014
Page 436 of 572
CubeSuite+ V2.02.00
Pin Name
APPENDIX A WINDOW REFERENCE
This area is used to specify the pin name to be connected (input pins and output pins). The
connection pins can be specified either via direct input or through selection from the dropdown list.
This area can be used to set 16 x 16 pins using the scrollbar.
In0 - In15
Specify input pins.
Out0 - Out15
Specify output pins.
N00 - Nff
This area is where the text strings displayed on the keys of the key
matrix are specified. Text strings of any length can be specified.
The default description string (N number) is not displayed on the
keys.
Hold Time
Specify the time (hold time) for which the input value is to be held (default: 0.5msec). The
settable range is from 0.001 to 999 (msec).
Moreover, when multiple keys for input to the same input pin are pressed during the hold time,
only the key that was clicked last is valid.
default
Remark
Specify the key matrix operation after CPU reset.
Not change at reset.
The key matrix status does not change after CPU reset.
inactive
No key matrix buttons are depressed after CPU reset (default).
For the pin names that can be specified, see the user's manual of the microcontroller that is used.
[[Style] tab]
(1) Style information setting area
Figure
Select this option button to display the key matrix with the following specified figure.
Shape
Select the figure shape. Two shapes can be selected: rectangle and ellipse.
shadow
Cannot be selected.
Line
Specify and change the figure line, as follows.
You can change the color of figure line by clicking the pull-down button.
Thickness
Specifies the line thickness.
Specification is made either using a spin button or through direct input.
A value from 1 to 100 can be specified.
Fill up
Active
Specifies the color of the line during active display.
Inactive
Specifies the color of the line during inactive display.
Specify and change the figure filling, as follows.
You can change the color of figure filling by clicking the pull-down button.
R20UT2867EJ0100 Rev.1.00
Feb 01, 2014
Active
Specifies the fill color during active display.
Inactive
Specifies the fill color during inactive display.
Page 437 of 572
CubeSuite+ V2.02.00
Bitmap
APPENDIX A WINDOW REFERENCE
Select this option button to display the key matrix with the following specified bitmap (default).
Selection list
Select a bitmap to be used from the selection list.
The selectable bitmaps appear in the selection list.
[Add] button
Opens the Entry Bitmap dialog box below to add a new bitmap to the selection list.
The bitmap file to be added can be specified either through file selection using the [...]
button, or through direct input.
[Delete] button
Deletes the currently selected bitmap from the selection list.
Note that only the bitmap that have been added by user can be deleted.
(2) Preview area
This area displays the style of the key matrix currently being specified.
[Function buttons]
Button
Function
OK
Validates the settings and closes this dialog box.
Cancel
Cancels the settings and closes this dialog box.
Apply
Cannot be selected.
Help
Displays the help for this dialog box.
[Operation]
In the Simulation mode, the following operation can be done.
(1) Inputting multiple keys simultaneously
(2) Locking the key input value
(1) Inputting multiple keys simultaneously
To enter two keys, simultaneously press the key to be input and right-click the mouse to enter the wait status.
Then, click the other key. This releases the wait status and enables simultaneous input of both keys. Multiple keys
can be simultaneously input by setting the wait status for multiple keys, but if input is to be performed to the same
input pin, the key that was input last is valid.
(2) Locking the key input value
To enter two keys, simultaneously press the key to be input and right-click the mouse to enter the wait status.
Then, click the other key. This releases the wait status and enables simultaneous input of both keys. Multiple keys
can be simultaneously input by setting the wait status for multiple keys, but if input is to be performed to the same
input pin, the key that was input last is valid
R20UT2867EJ0100 Rev.1.00
Feb 01, 2014
Page 438 of 572
CubeSuite+ V2.02.00
APPENDIX A WINDOW REFERENCE
Figure A-98. Connected Parts Display Example (Key Matrix)
R20UT2867EJ0100 Rev.1.00
Feb 01, 2014
Page 439 of 572
CubeSuite+ V2.02.00
APPENDIX A WINDOW REFERENCE
Parts Level Gauge Properties dialog box
This property dialog box is used to set or change the pin connection information of level gauge, which are one of the
connection parts in the I/O Panel window.
Input to the simulator can be done from pin-connected level gauge in the Simulation mode.
Note that the connection pin must be an analog input pin.
There are two types of level gauge display styles, slide and dial. These styles can be changed on the [[Style] tab].
Figure A-99. Parts Level Gauge Properties Dialog Box: [Level Gauge Connection] Tab
(1)
[Function buttons]
Figure A-100. Parts Level Gauge Properties Dialog Box: [Style] Tab
(2)
(1)
[Function buttons]
R20UT2867EJ0100 Rev.1.00
Feb 01, 2014
Page 440 of 572
CubeSuite+ V2.02.00
APPENDIX A WINDOW REFERENCE
This section describes the following.
- [How to open]
- [Level Gauge Connection] tab]
- [[Style] tab]
- [Function buttons]
- [Operation]
[How to open]
On the I/O Panel window, any one of the following:
- Double-click a part object "Level Gauge".
- Select [Properties...] form the context menu on a part object "Level Gauge".
- Select a part object "Level Gauge", and then select [Properties...] form the [View] menu.
[Level Gauge Connection] tab]
(1) Pin connection information setting area
Label
This area is used to specify the part name. The part name input here is also displayed in the
Parts List dialog box as the label.
Pin Name
This area is used to specify the pin name to be connected. The connection pins can be specified either via direct input or through selection from the drop-down list.
Maximum input
This area is used to set the maximum level gauge input value (default: 5000mV).
The settable range is from 0 to 65535.
The operation range of the level gauge displayed in the I/O Panel window is determined by
this specified value.
When CPU reset
Specify the level gauge operation after CPU reset.
before CPU Reset
Maintains the level gauge status of immediately before CPU reset,
after CPU reset.
Set default voltage
The level gauge is set to the specified value after CPU reset (default).
Specify the value in mV units.
Input a value from 0 to "Maximum input:". (default: 0 mV)
Remark
For the pin names that can be specified, see the user's manual of the microcontroller that is used.
[[Style] tab]
(1) Style information setting area
Slide
Select this option button to display the level gauge with the side-type.
Form
Select the slide direction (vertical or horizontal) from the drop-down list.
Color
This area is used to specify or change the slide color.
You can change the color by clicking the pull-down button.
R20UT2867EJ0100 Rev.1.00
Feb 01, 2014
Page 441 of 572
CubeSuite+ V2.02.00
Dial
APPENDIX A WINDOW REFERENCE
Select this option button to display the level gauge with the dial-type (default).
Color of Mark
This area is used to specify or change the color of the mark indicating the operating
point.
You can change the color by clicking the pull-down button.
Selection list
Select a bitmap to be used from the selection list.
The selectable bitmaps appear in the selection list.
[Add] button
Opens the Entry Bitmap dialog box below to add a new bitmap to the selection list.
The bitmap file to be added can be specified either through file selection using the [...]
button, or through direct input.
[Delete] but-
Deletes the currently selected bitmap from the selection list.
ton
Note that only the bitmap that have been added by user can be deleted.
(2) Preview area
This area displays the style of the level gauge currently being specified.
[Function buttons]
Button
Function
OK
Validates the settings and closes this dialog box.
Cancel
Cancels the settings and closes this dialog box.
Apply
Cannot be selected.
Help
Displays the help for this dialog box.
[Operation]
In the Simulation mode, analog input from the level gauge is performed through manipulation of the displayed slider or
dial.
The value specified in [Maximum input] is the maximum value that can be input.
Input is enabled by selecting the [Figure] menu >> [Simulation Mode].
Figure A-101. Connected Parts Display Example (Level Gauge)
R20UT2867EJ0100 Rev.1.00
Feb 01, 2014
Page 442 of 572
CubeSuite+ V2.02.00
Dial-type level gauge
APPENDIX A WINDOW REFERENCE
The displayed analog value changes as the operating point (red circle) on the dial is moved by
dragging it with the mouse. When this analog value has become the value that is to be input,
release the operating point. As a result, the displayed analog value is input. The operating point
can also be moved by clicking the desired location on the dial.
Slide-type level gauge
The displayed analog value changes as the slider button is moved by dragging it with the mouse.
When this analog value has become the value that is to be input, release the button. As a result,
the displayed analog value is input. The button can also be moved by clicking the desired location
on the slider.
Caution
If you drag and drop the dial's operation point (red circle) or the slider's knob away from the level
gauge, then the voltage displayed in the level gauge will change, but the voltage actually output by
the level gauge will not change. Make sure to always drag and drop over the level gauge.
R20UT2867EJ0100 Rev.1.00
Feb 01, 2014
Page 443 of 572
CubeSuite+ V2.02.00
APPENDIX A WINDOW REFERENCE
Parts Led Properties dialog box
This property dialog box is used to set or change the pin connection information of LED, which are one of the connection parts in the I/O Panel window.
A pin-connected LED displays the information output from the simulator through lit/unlit display in the Simulation mode.
There are two types of LED display styles, figure and bitmap. These styles can be changed on the [[Style] tab].
Figure A-102. Parts Led Properties Dialog Box: [LED Connection] Tab
(1)
[Function buttons]
Figure A-103. Parts Led Properties Dialog Box: [Style] Tab
(1)
(2)
[Function buttons]
R20UT2867EJ0100 Rev.1.00
Feb 01, 2014
Page 444 of 572
CubeSuite+ V2.02.00
APPENDIX A WINDOW REFERENCE
This section describes the following.
- [How to open]
- [[LED Connection] tab]
- [[Style] tab]
- [Function buttons]
- [Operation]
[How to open]
On the I/O Panel window, any one of the following:
- Double-click a part object "LED".
- Select [Properties...] form the context menu on a part object "LED".
- Select a part object "LED", and then select [Properties...] form the [View] menu.
[[LED Connection] tab]
(1) Pin connection information setting area
Label
This area is used to specify the part name. The part name input here is also displayed in the
Parts List dialog box as the label.
Pin Name
This area is used to specify the pin name to be connected (output pin). The connection pins
can be specified either via direct input or through selection from the drop-down list.
Active Level
Remark
The active state is selected with a option button, as follows:
LOW
Sets the active level to LOW.
HIGH
Sets the active level to HIGH (default).
For the pin names that can be specified, see the user's manual of the microcontroller that is used.
[[Style] tab]
(1) Style information setting area
Figure
Select this option button to display the LED with the following specified figure.
Shape
Select the figure shape. Two shapes can be selected: rectangle and ellipse.
shadow
Cannot be selected.
Line
Specify and change the figure line, as follows.
You can change the color of figure line by clicking the pull-down button.
Thickness
Specifies the line thickness.
Specification is made either using a spin button or through direct input.
A value from 1 to 100 can be specified.
Fill up
Active
Specifies the color of the line during active display.
Inactive
Specifies the color of the line during inactive display.
Specify and change the figure filling, as follows.
You can change the color of figure filling by clicking the pull-down button.
R20UT2867EJ0100 Rev.1.00
Feb 01, 2014
Active
Specifies the fill color during active display.
Inactive
Specifies the fill color during inactive display.
Page 445 of 572
CubeSuite+ V2.02.00
Bitmap
APPENDIX A WINDOW REFERENCE
Select this option button to display the LED with the following specified bitmap (default).
Selection list
Select a bitmap to be used from the selection list.
The selectable bitmaps appear in the selection list.
[Add] button
Opens the Entry Bitmap dialog box below to add a new bitmap to the selection list.
The bitmap file to be added can be specified either through file selection using the [...]
button, or through direct input.
[Delete] button
Deletes the currently selected bitmap from the selection list.
Note that only the bitmap that have been added by user can be deleted.
(2) Preview area
This area displays the style of the LED currently being specified.
[Function buttons]
Button
Function
OK
Validates the settings and closes this dialog box.
Cancel
Cancels the settings and closes this dialog box.
Apply
Cannot be selected.
Help
Displays the help for this dialog box.
[Operation]
In the Simulation mode, the output status (active/inactive) of the connected pins is displayed in real-time using two
types of bitmaps or figures.
Figure A-104. Connected Parts Display Example (LED)
When active:
When inactive:
R20UT2867EJ0100 Rev.1.00
Feb 01, 2014
Page 446 of 572
CubeSuite+ V2.02.00
APPENDIX A WINDOW REFERENCE
Parts Segment LED Properties dialog box
This property dialog box is used to set or change the pin connection information of 7-segment LED and 14-segment
LED, which are one of the connection parts in the I/O Panel window.
A LED connected to pins displays the information output from the simulator in the Simulation mode.
The segment LED display styles can be changed on the [[Style] tab].
Figure A-105. Parts Segment LED Properties Dialog Box: [SegmentLED Connection] Tab
(1)
(3)
(2)
[Function buttons]
Figure A-106. Parts Segment LED Properties Dialog Box: [Style] Tab
(1)
[Function buttons]
R20UT2867EJ0100 Rev.1.00
Feb 01, 2014
Page 447 of 572
CubeSuite+ V2.02.00
APPENDIX A WINDOW REFERENCE
This section describes the following.
- [How to open]
- [[SegmentLED Connection] tab]
- [[Style] tab]
- [Function buttons]
- [Operation]
[How to open]
On the I/O Panel window, any one of the following:
- Double-click a part object "7-segment LED"/"14-segment LED".
- Select [Properties...] form the context menu on a part object "7-segment LED"/"14-segment LED".
- Select a part object "7-segment LED"/"14-segment LED", and then select [Properties...] form the [View] menu.
[[SegmentLED Connection] tab]
(1) Pin connection information setting area
Label
This area is used to specify the part name. The part name input here is also displayed in the
Parts List dialog box as the label.
Grid type
Select the grid signal allocation method from the following.
As a result of the selection, the setting in the Digit signal setting area changes.
Digit
Connects each segment LED to 1 grid pin. Digit signal settings are performed in the Digit signal setting area (default).
16 digits can be specified for the digit signal. A segment LED of up to 16
digits can be created with 1 segment LED part.
Customize
Cannot be selected.
(2) Segment signal setting area
Segment Signal
This area is used to specify the pins (output pins) to be connected to the
segment signals of the 7-segment LED/14-segment LED, as well as their active level.
Figure
This area displays the bitmap of the 7-segment LED/14-segment LED at the
top left. When "Pin Name:" is input, the corresponding location is indicated.
Pin Name
The connection pins can be specified either via direct input or through selection from the drop-down list.
The number of segment pins to be connected is 8 in the case of a 7-segment
LED, and 15 in the case of a 14-segment LED. Connection to all the segment
pins is possible by using the scroll bar on the right side.
Active Level
Remark
The active status can be selected with a option button, as follows:
LOW
Sets the active level to LOW.
HIGH
Sets the active level to HIGH (default).
For the pin names that can be specified, see the user's manual of the microcontroller that is used.
R20UT2867EJ0100 Rev.1.00
Feb 01, 2014
Page 448 of 572
CubeSuite+ V2.02.00
APPENDIX A WINDOW REFERENCE
(3) Digit signal setting area
Digit Signal
This area is used to specify 7-segment LED/14-segment LED digits, grid signal connection
pins (output pins), and their active level. The connection method changes as follows according to what is specified for [Grid type].
- When [Digit] selected
Perform digit signal setting. The maximum number of digit pins that can be connected is 16.
Connection to all the digit pins can be done by using the scroll bar on the right side of the
area.
- When [Customize] selected
Cannot be selected.
Pin Name
The connection pins can be specified either via direct input or through
selection from the drop-down list. As the setting signal, specify the connection pins in a series from the lowermost digit.
Active Level
Remark
The active status can be selected with a option button, as follows:
LOW
Sets the active level to LOW.
HIGH
Sets the active level to HIGH (default).
For the pin names that can be specified, see the user's manual of the microcontroller that is used.
[[Style] tab]
(1) Style information setting area
Full up LED
This area is used to set and change related to the filling of each cell of the object are performed. You can change the color by clicking the pull-down button.
Frame Line of LED
Active Color
Specifies the fill color during active display.
Inactive Color
Specifies the fill color during inactive display.
This area is used to set and change related to the frame of each cell of the object are performed.
Color of Line
Specifies and changes the line color.
You can change the color by clicking the pull-down button.
Dotted/Solid Line
Specifies and changes the line shape (dotted/solid).
The desired line shape can be selected from the drop-down list.
The line shape can be specified only when the line thickness is "1" in
[Thickness of Line].
Thickness of Line
Specifies and changes the line thickness.
The desired line thickness can be specified either via direct input or
through selection from the spin button.A value in the range of 1 to 100
(decimal) can be specified.
R20UT2867EJ0100 Rev.1.00
Feb 01, 2014
Page 449 of 572
CubeSuite+ V2.02.00
APPENDIX A WINDOW REFERENCE
[Function buttons]
Button
Function
OK
Validates the settings and closes this dialog box.
Cancel
Cancels the settings and closes this dialog box.
Apply
Cannot be selected.
Help
Displays the help for this dialog box.
[Operation]
In the Simulation mode, as the results of 1 simulation, the output information of the connection pins is received and display is performed accordingly. When both the digit/grid signals and segment signals are active output, the segment LED
of the corresponding digit/grid light.
Figure A-107. Connected Parts Display Example (7-segment LED)
R20UT2867EJ0100 Rev.1.00
Feb 01, 2014
Page 450 of 572
CubeSuite+ V2.02.00
APPENDIX A WINDOW REFERENCE
Parts Matrix Led Properties dialog box
This property dialog box is used to set or change the pin connection information of matrix LED, which are one of the
connection parts in the I/O Panel window.
A pin-connected matrix LED displays the information output from the simulator through lit/unlit display in the Simulation
mode.
There are two types of matrix LED display styles, figure and bitmap. These styles can be changed on the [[Style] tab].
Figure A-108. Parts Matrix Led Properties Dialog Box: [Matrix LED Connection] Tab
(1)
(2)
(3)
[Function buttons]
Figure A-109. Parts Matrix Led Properties Dialog Box: [Style] Tab
(1)
(2)
[Function buttons]
R20UT2867EJ0100 Rev.1.00
Feb 01, 2014
Page 451 of 572
CubeSuite+ V2.02.00
APPENDIX A WINDOW REFERENCE
This section describes the following.
- [How to open]
- [[Matrix LED Connection] tab]
- [[Style] tab]
- [Function buttons]
- [Operation]
[How to open]
On the I/O Panel window, any one of the following:
- Double-click a part object "Matrix LED".
- Select [Properties...] form the context menu on a part object "Matrix LED".
- Select a part object "Matrix LED", and then select [Properties...] form the [View] menu.
[[Matrix LED Connection] tab]
(1) [Label]
Label
This area is used to specify the part name. The part name input here is also displayed in the
Parts List dialog box as the label.
(2) Row direction signals setting area
Row Signal
This area is used to specify the output pins connected to the matrix LED row direction signals
and their active level.
Pin Name
A maximum of 16 pins can be connected. Connection to all the row direction signals can be done by using the scrollbar located on the right side of
the pin name input area.
Active Level
Remark
The active status can be selected with a option button, as follows:
LOW
Sets the active level to LOW.
HIGH
Sets the active level to HIGH (default).
For the pin names that can be specified, see the user's manual of the microcontroller that is used.
(3) Column direction signals setting area
Column Signal
This area is used to specify the output pins connected to the matrix LED column direction signals and their active level.
Pin Name
The connection pins can be specified either via direct input or through
selection from the drop-down list.A maximum of 16 pins can be connected.
Connection to all the column direction signals can be done by using the
scrollbar located on the right side of the pin name input area.
Active Level
Remark
The active status can be selected with a option button, as follows:
LOW
Sets the active level to LOW.
HIGH
Sets the active level to HIGH (default).
For the pin names that can be specified, see the user's manual of the microcontroller that is used.
R20UT2867EJ0100 Rev.1.00
Feb 01, 2014
Page 452 of 572
CubeSuite+ V2.02.00
APPENDIX A WINDOW REFERENCE
[[Style] tab]
(1) Style information setting area
Figure
Select this option button to display the matrix LED with the following specified figure.
Shape
Select the figure shape. Two shapes can be selected: rectangle and ellipse.
shadow
Cannot be selected.
Line
Specify and change the figure line, as follows.
You can change the color of figure line by clicking the pull-down button.
Thickness
Specifies the line thickness.
Specification is made either using a spin button or through direct input.
A value from 1 to 100 can be specified.
Fill up
Active
Specifies the color of the line during active display.
Inactive
Specifies the color of the line during inactive display.
Specifiy and change the figure filling, as follows.
You can change the color of figure filling by clicking the pull-down button.
Bitmap
Active
Specifies the fill color during active display.
Inactive
Specifies the fill color during inactive display.
Select this option button to display the matrix LED with the following specified bitmap (default)
Selection list
Select a bitmap to be used from the selection list.
The selectable bitmaps appear in the selection list.
[Add] button
Opens the Entry Bitmap dialog box below to add a new bitmap to the selection list.
The bitmap file to be added can be specified either through file selection using the [...]
button, or through direct input.
[Delete] button
Deletes the currently selected bitmap from the selection list.
Note that only the bitmap that have been added by user can be deleted.
(2) Preview area
This area displays the style of the matrix LED currently being specified.
[Function buttons]
Button
Function
OK
Validates the settings and closes this dialog box.
Cancel
Cancels the settings and closes this dialog box.
Apply
Cannot be selected.
R20UT2867EJ0100 Rev.1.00
Feb 01, 2014
Page 453 of 572
CubeSuite+ V2.02.00
APPENDIX A WINDOW REFERENCE
Button
Help
Function
Displays the help for this dialog box.
[Operation]
In the Simulation mode, as the results of 1 simulation, the output information of the connection pins is received and display is performed accordingly. When the matrix intersection of a row pin and column pin is active, the corresponding LED
lights.
Figure A-110. Connected Parts Display Example (Matrix LED)
R20UT2867EJ0100 Rev.1.00
Feb 01, 2014
Page 454 of 572
CubeSuite+ V2.02.00
APPENDIX A WINDOW REFERENCE
Parts Buzzer Properties dialog box
This property dialog box is used to set or change the pin connection information of a buzzer, which is one of the connection parts in the I/O Panel window.
The pin-connected buzzer displays the information output from the connected pins as a bitmap in the Simulation mode.
The buzzer output can be checked as "display".
There are two types of buzzer display styles, figure and bitmap. These styles can be changed on the [[Style] tab].
Figure A-111. Parts Buzzer Properties Dialog Box: [Buzzer Connection] Tab
(1)
[Function buttons]
Figure A-112. Parts Buzzer Properties Dialog Box: [Style] Tab
(1)
(2)
[Function buttons]
R20UT2867EJ0100 Rev.1.00
Feb 01, 2014
Page 455 of 572
CubeSuite+ V2.02.00
APPENDIX A WINDOW REFERENCE
This section describes the following.
- [How to open]
- [[Buzzer Connection] tab]
- [[Style] tab]
- [Function buttons]
- [Operation]
[How to open]
On the I/O Panel window, any one of the following:
- Double-click a part object "Buzzer".
- Select [Properties...] form the context menu on a part object "Buzzer".
- Select a part object "Buzzer", and then select [Properties...] form the [View] menu.
[[Buzzer Connection] tab]
(1) Pin connection information setting area
Label
This area is used to specify the part name. The part name input here is also displayed in the
Parts List dialog box as the label.
Pin Name
This area is used to specify the pin name to be connected (output pin). The connection pins
can be specified either via direct input or through selection from the drop-down list.
Active Level
Output Form
Remark
The active state is selected with a option button, as follows:
LOW
Sets the active level to LOW.
HIGH
Sets the active level to HIGH (default).
This item is not allowed to change.
For the pin names that can be specified, see the user's manual of the microcontroller that is used.
R20UT2867EJ0100 Rev.1.00
Feb 01, 2014
Page 456 of 572
CubeSuite+ V2.02.00
APPENDIX A WINDOW REFERENCE
[[Style] tab]
(1) Style information setting area
Figure
Select this option button to display the buzzer with the following specified figure.
Shape
Select the figure shape. Two shapes can be selected: rectangle and ellipse.
shadow
Cannot be selected.
Line
Specify and change the figure line, as follows.
You can change the color of figure line by clicking the pull-down button.
Thickness
Specifies the line thickness.
Specification is made either using a spin button or through direct input.
A value from 1 to 100 can be specified.
Fill up
Active
Specifies the color of the line during active display.
Inactive
Specifies the color of the line during inactive display.
Specify and change the figure filling, as follows.
You can change the color of figure filling by clicking the pull-down button.
Bitmap
Active
Specifies the fill color during active display.
Inactive
Specifies the fill color during inactive display.
Select this option button to display the buzzer with the following specified bitmap (default).
Selection list
Select a bitmap to be used from the selection list.
The selectable bitmaps appear in the selection list.
[Add] button
Opens the Entry Bitmap dialog box below to add a new bitmap to the selection list.
The bitmap file to be added can be specified either through file selection using the [...]
button, or through direct input.
[Delete] button
Deletes the currently selected bitmap from the selection list.
Note that only the bitmap that have been added by user can be deleted.
(2) Preview area
This area displays the style of the buzzer currently being specified.
[Function buttons]
Button
Function
OK
Validates the settings and closes this dialog box.
Cancel
Cancels the settings and closes this dialog box.
Apply
Cannot be selected.
R20UT2867EJ0100 Rev.1.00
Feb 01, 2014
Page 457 of 572
CubeSuite+ V2.02.00
APPENDIX A WINDOW REFERENCE
Button
Help
Function
Displays the help for this dialog box.
[Operation]
In the Simulation mode, the active level output of the connected pins can be expressed as a bitmap.
The following bitmaps are displayed according to the pin's output value (active/inactive).
Figure A-113. Connected Parts Display Example (Buzzer)
When active:
When inactive:
R20UT2867EJ0100 Rev.1.00
Feb 01, 2014
Page 458 of 572
CubeSuite+ V2.02.00
APPENDIX A WINDOW REFERENCE
Pull up/Pull down dialog box
This dialog box is used to set or change the pin connection information of the pull-up/pull-down resistors, which are one
of the connection parts of the I/O Panel window.
The setting method for these connection parts differs from those for other parts. The connection information of all the
pins is managed as a group in this dialog box.
Figure A-114. Pull up/Pull down Dialog Box
(1)
[Function buttons]
This section describes the following.
- [How to open]
- [Description of each area]
- [Function buttons]
[How to open]
- With the I/O Panel window in focus, click the
button or select [Pull up/Pull down...] from the [Parts] menu.
[Description of each area]
(1) Connection information display area
Pin name
Displays the names of the pins that can be connected to pull-up/pull-down resistors.
Pull Up/Pull Down
Displays the connected status of the pins.
R20UT2867EJ0100 Rev.1.00
Feb 01, 2014
Pull Up
Indicates pull-up resistor is connected.
Pull Down
Indicates pull-down resistor connected.
-
Indicates no pull-up/pull-down resistor connected.
Page 459 of 572
CubeSuite+ V2.02.00
APPENDIX A WINDOW REFERENCE
Buttons
Changes the pin connection information of the pull-up/pull-down resistors.
[Pull Up]
Connects the pins selected to pull-up resistors.
When connection is completed, "Pull Up" is displayed.
[Pull Down]
Connects the pins selected to pull-down resistors.
When connection is completed, "Pull Down" is displayed.
[Disconnect]
Cancels the connected status of the pins selected.
When connection is completed, "-" is displayed.
[Function buttons]
Button
Function
OK
Validates the settings and closes this dialog box.
Cancel
Cancels the settings and closes this dialog box.
R20UT2867EJ0100 Rev.1.00
Feb 01, 2014
Page 460 of 572
CubeSuite+ V2.02.00
APPENDIX A WINDOW REFERENCE
Object Properties dialog box
This property dialog box is used to set or change the connection information fed to the pins of figure object (including
text and bitmap) of the I/O Panel window.
Show/hide can be switched for each pin-connected object by the output status of the connected pins in the Simulation
mode.
The default status of each signal is active HIGH. Display styles can be changed on the [[Style] tab].
Figure A-115. Object Properties Dialog Box: [Object Connection] Tab
(1)
[Function buttons]
Figure A-116. Object Properties Dialog Box: [Style] Tab
(1)
[Function buttons]
R20UT2867EJ0100 Rev.1.00
Feb 01, 2014
Page 461 of 572
CubeSuite+ V2.02.00
APPENDIX A WINDOW REFERENCE
This section describes the following.
- [How to open]
- [[Object Connection] tab]
- [[Style] tab]
- [Function buttons]
[How to open]
On the I/O Panel window, any one of the following:
- Double-click a figure object.
- Select [Properties...] form the context menu on a figure object.
- Select a figure object, and then select [Properties...] form the [View] menu.
[[Object Connection] tab]
(1) Pin connection information setting area
Pin Connect
Select the method for connecting objects and output pins by clicking the corresponding option
buttons, and specify the output pin name.
As a result of the connection, figure display is switched by the ON/OFF status of the connected output pin.
No Connection
The object and pin are not connected (default).
Objects not connected to pins are always in the displayed status.
Static Connection
Connects the figure to 1 output pin.
The connection pin can be specified in [Pin Name] either via direct
input or through selection from the drop-down list. During simulation,
the object is displayed when the specified output signal data is active.
Dynamic Connec-
Connects the figure to 2 output pins.
tion
The connection pin can be specified in [Pin Name1] and [Pin Name2]
either via direct input or through selection from the drop-down list.
During simulation, the object is displayed when the specified output
signal 1 data and the specified output signal 2 data are both active.
Active Level
Remark
The common active status of each output signal can be selected from the option buttons.
LOW
Sets the active level to LOW.
HIGH
Sets the active level to HIGH (default).
For the pin names that can be specified, see the user's manual of the microcontroller that is used.
R20UT2867EJ0100 Rev.1.00
Feb 01, 2014
Page 462 of 572
CubeSuite+ V2.02.00
APPENDIX A WINDOW REFERENCE
[[Style] tab]
(1) Style information setting area
Specifies and changes settings related to each object fillingNote, as follows:
Fill up
The area to be filled differs according to the object.
- Line
Not applicable
- Rectangle, Ellipse, Rounded Rectangle
Inside area enclosed by contour lines
- Polygon
Inside area enclosed by lines linking apexes
- Text
Inside text box
- Bitmap
Inside figure drawing area
Color
Specifies and changes settings of color
You can change the color by clicking the pull-down button.
Line
This area is used to perform settings and changes related to the lines of objects.
The definition of line for each type of object is provided below.
- Line
All areas of the object
- Rectangle,Ellipse,Rounded Rectangle
Contour line of the figure
- Polygon
Lines that link the apexes of the polygon
- Text
Contour lines of the text box
- Bitmap
Contour lines of figure drawing area
Color
Specifies and changes the line color.
You can change the color by clicking the pull-down button.
Dotted/
Specifies and changes line shapes (dotted line/solid line).
Solid
The desired line shape can be selected from the drop-down list.
Note that this item can be changed only when [Thickness] is set to "1".
Thickness
Specifies and changes the line thickness.
The desired line thickness can be specified either via direct input or through
selection from the spin button.
A value in the range of 1 to 100 (decimal) can be specified.
Note At this time, if the object that have been pasted from a bitmap file, it becomes invisible.
[Function buttons]
Button
Function
OK
Validates the settings and closes this dialog box.
Cancel
Cancels the settings and closes this dialog box.
Apply
Cannot be selected.
R20UT2867EJ0100 Rev.1.00
Feb 01, 2014
Page 463 of 572
CubeSuite+ V2.02.00
APPENDIX A WINDOW REFERENCE
Button
Help
Function
Displays the help for this dialog box.
R20UT2867EJ0100 Rev.1.00
Feb 01, 2014
Page 464 of 572
CubeSuite+ V2.02.00
APPENDIX A WINDOW REFERENCE
Parts List dialog box
This dialog box displays all the figure objects created in the I/O Panel window as well as the pin connection status of
part objects.
The pin connection settings for each object can be changed in the property dialog box, which can be opened by double-clicking the relevant object listed in this dialog box, or selecting the relevant object listed in this dialog box and then
selecting the [View] menu >> [Properties...].
Figure A-117. Parts List Dialog Box
(1)
[Function buttons]
This section describes the following.
- [How to open]
- [Description of each area]
- [Function buttons]
[How to open]
- With the I/O Panel window in focus, select [Parts List...] form the [View] menu.
[Description of each area]
(1) Pin connection status display area
Label
Displays the label (name) attached to the object. Nothing is displayed for objects that do not
have a label.
R20UT2867EJ0100 Rev.1.00
Feb 01, 2014
Page 465 of 572
CubeSuite+ V2.02.00
APPENDIX A WINDOW REFERENCE
Parts
Displays the part category.
Pin Name
rectangle
Straight line, rectangle, ellipse, rounded rectangle, fan shape
polygon
Polygon
text
Text
bitmap
Bitmap
button
Push button, pull button, group button
analog button
Analog button
key
Key matrix
level gauge
Level gauge
led
LED
7segment led
7-segment LED
14segment led
14-segment LED
matrix led
Matrix LED
buzzer
Buzzer
groups
Grouped part
Displays the pins connected to parts.
"-" is displayed for parts that are connected to multiple pins, and a blank is displayed for parts
that are unconnected.
Active Level
Displays the active value set for the part.
"-" is displayed for parts that are connected to multiple pins, and a blank is displayed for parts
that are unconnected.
[Function buttons]
Button
Close
Function
Closes the this dialog box.
R20UT2867EJ0100 Rev.1.00
Feb 01, 2014
Page 466 of 572
CubeSuite+ V2.02.00
APPENDIX A WINDOW REFERENCE
Serial window
This window is used to communicate with the serial interface provided in the CPU.
Since this window operates as the serial interface of the remote node of the CPU, transmission data from CPU turns
into reception data in this window, and transmission data from this window turns into reception data in the CPU.
The following two types of files can be handled in this window.
The transmission/reception data displayed in the top area in this window can be saved to the serial log data file (*.log)
(CSV format) by selecting the [File] menu >> [Save]/[Save As...].
Moreover, the transmission data created in the lower part of this window can be saved to the serial transmission data
file (*.ser) (CSV format) by clicking the [Save] button (the contents can be restored by clicking the [Load] button).
Saving/restoring the created data can also be performed by saving/loading the project file. In this case, however, data
is not saved as a CSV format text file but saved into the project file.
Cautions 1.
If the saved serial transmission data file is opened or the project file is opened while Simulator
GUI is running with a microcontroller different from the one used when the file was created, the
settings of the serial interface that are not provided in the microcontroller will not be restored.
2.
Multiple instances of this window can be opened. After opening this window, select the serial
interface to be verified in the Serial selection area.
Figure A-118. Serial Window
(1)
(2)
(3)
This section describes the following.
- [How to open]
- [Description of each area]
- [Dedicated menu (Serial window)]
- [Context menu]
R20UT2867EJ0100 Rev.1.00
Feb 01, 2014
Page 467 of 572
CubeSuite+ V2.02.00
APPENDIX A WINDOW REFERENCE
[How to open]
- Click the
button.
- Select [Serial] from the [Simulator] menu.
[Description of each area]
(1) Serial selection area
Select the serial interface to be used.
Select the serial interface to be used from the list of provided serial interfaces (drop-down
list)Note.
Select from the drop-down list the time information unit applied to [Wait] in the Serial editor area.
The time information unit can be changed by selecting the [Edit] menu >> [Time unit].
Note Once selected, the serial interface cannot be changed.
If you wish to change the serial interface, open the another Serial window newly.
(2) Log display area
Displays the transmission/reception data.
The display timing is when all the bits constituting the data have been received or sent.
Only data from which the start bit, stop bit, and parity bit have been deleted is displayed in this area.
The notation of data can be changed by selecting the [View] menu>> [Numeric Representation] >> [Binary]/[Hexadecimal].
Log display is cleared upon debugger or simulator reset.
Time
Displays the time from the completion of reception/transmission of the previous data until
completion of reception/transmission of the current data.
The time information unit is specified by selecting the [Edit] menu >> [Time unit].
Send Data
Displays the data sent by this window (data received by the CPU).
Receive Data
Displays the data received by this window (data sent by the CPU).
Status
Displays the status during data reception.
When an error occurs, one of the following marks is displayed. When everything is normal,
nothing is displayed.
P
Parity error (mismatching parity bit)
F
Framing error (stop bit not detected)
(3) Serial editor area
This area is where the transmission data is created.
This area can be shown or hidden by selecting the [View] menu >> [Serial Editor].
No.
This is a number assigned sequentially from the beginning. It cannot be directly written.
The maximum number is 9,999 lines.
Wait
Specifies the time from the completion of transmission of the immediately previous data until the start of
transmission of next data.Valid during transmission using the [Auto send] button.
The time information unit is the unit selected by selecting the [Edit] menu >> [Time unit].
The wait value is input by placing the cursor in the Wait field to be edited and double-clicking.
One wait value can be written per operation.
R20UT2867EJ0100 Rev.1.00
Feb 01, 2014
Page 468 of 572
CubeSuite+ V2.02.00
Data
APPENDIX A WINDOW REFERENCE
This area is used to edit transmission data.
Data can be directly input by placing the cursor in the data field and double-clicking.
Data suffixed by "0x" is treated as hexadecimal data, and data suffixed by "0b" is treated as binary data. The
default code is the hexadecimal code.
If a bit length different from that specified in the Format (UART) dialog box or Format (CSI) dialog box is
specified, data from the lower bit is valid.
One data can be written per operation.
Button
Format
Opens the Format (UART) dialog box or Format (CSI) dialog box.
All Clear
Clears all Serial editor area.
Load
Loads the contents of the previously saved serial transmission data file (*.ser) and restores
them in the Serial editor area.
A file created for UART cannot be loaded as a file for CSI and vice versa.
Save
Saves the contents of the Serial editor area to the specified serial transmission data file
(*.ser).
Send
Sends one of the data selected in the Serial editor area.
The next data becomes selected upon completion of transmission.
If no data is selected, the first data is sent.
Auto Send
Makes the data selected in the Serial editor area the first data, and automatically transfers
from the data to the bottom of the area. The data transmission time interval is the time specified for Wait.
Caution
The help for this window will not be displayed even if the [F1] key on the keyboard is pressed
while the cursor is placed in this area.
Remark
When the CSI selected in this window is set to master mode, the clock must be supplied for reception.
To perform reception, transmission of dummy data is therefore required.
[Dedicated menu (Serial window)]
(1) [Edit] menu
Insert
Inserts a new line immediately before the selected line.
Cut
Cuts the selected range and saves it to the clipboard.
Copy
Copies the selected range and copies it to the clipboard.
Paste
Pastes the contents of the clipboard to the selected location.
Delete
Deletes the selected range.
Time unit
Selects the time unit.
main clock
Main clock (default)
usec
Microsecond
msec
Millisecond
Format...
Opens the Format (UART) dialog box or Format (CSI) dialog box.
(2) [View] menu
Serial Editor
R20UT2867EJ0100 Rev.1.00
Feb 01, 2014
Selects whether Serial editor area is displayed or not.
Page 469 of 572
CubeSuite+ V2.02.00
APPENDIX A WINDOW REFERENCE
Numeric Representation
Changes the notation of the Log display area display method.
Binary
Displays binary numbers.
Hexadecimal
Displays hexadecimal numbers.
(3) [Option] menu
Customize...
Opens the Customize dialog box.
[Context menu]
The following context menus are available in the Serial editor area.
Insert
Inserts a new line immediately before the selected line.
Cut
Cuts the selected range and saves it to the clipboard.
Copy
Copies the selected range and copies it to the clipboard.
Paste
Pastes the contents of the clipboard to the selected location.
Delete
Deletes the selected range.
R20UT2867EJ0100 Rev.1.00
Feb 01, 2014
Page 470 of 572
CubeSuite+ V2.02.00
APPENDIX A WINDOW REFERENCE
Format (UART) dialog box
This dialog box is used to set the serial format for the asynchronous serial interface (UART).
Figure A-119. Format (UART) Dialog Box
(1)
[Function buttons]
This section describes the following.
- [How to open]
- [Description of each area]
- [Function buttons]
[How to open]
On the Serial window with the UART serial interface, any one of the following:
- Click the [Format] button.
- Select [Format...] from the [Edit] menu
[Description of each area]
(1) Serial format setting area
Baudrate
Directly input the serial baud rate value as an integer. (Unit: bps)
Transfer Direction
Select the transfer direction.
Data bit length
MSB first
Sets MSB first as the transfer direction.
LSB first
Sets LSB first as the transfer direction (default).
Select the bit length of the transmission data from the drop-down list, or specify it through
direct input (default:7).
Stop bit length
Select the stop bit length from the drop-down list (default:1).
Parity
Select the parity information (none parity (default) /odd parity/even parity/0 parity).
R20UT2867EJ0100 Rev.1.00
Feb 01, 2014
Page 471 of 572
CubeSuite+ V2.02.00
APPENDIX A WINDOW REFERENCE
Repeat
Select this item to repeat data transfer when the [Auto Send] button in the Serial window has
been clicked.
Following transmission of the last data during automatic transmission,
returns to the beginning of the data and performs automatic transmission.
Following transmission of the last data during automatic transmission, stops
transmission (default).
Remark
For the selectable range, see the user's manual of the microcontroller that is used.
[Function buttons]
Button
Function
OK
Validates the settings and closes this dialog box.
Cancel
Cancels the settings and closes this dialog box.
R20UT2867EJ0100 Rev.1.00
Feb 01, 2014
Page 472 of 572
CubeSuite+ V2.02.00
APPENDIX A WINDOW REFERENCE
Format (CSI) dialog box
This dialog box is used to specify the serial format for the 3-wire serial interface (CSI).
Figure A-120. Format (CSI) Dialog Box
(1)
[Function buttons]
This section describes the following.
- [How to open]
- [Description of each area]
- [Function buttons]
- [Transmission/reception when 3-wire serial interface (CSI) is selected]
[How to open]
On the Serial window with the CSI serial interface, any one of the following:
- Click the [Format] button.
- Select [Format...] from the [Edit] menu
[Description of each area]
(1) Serial format setting area
Master, Slave
Select the transfer mode.
Master
Operates this window as a master.
Setting of [Transfer Clock] is required for generating the clock during communication.
Slave
Operates this window as a slave (default).
Communication is performed using the clock of the serial interface provided
in the CPU.
Transfer Clock
Directly input the transfer clock value (unit: kHz).
Values with decimals can also be set. This item must be set when master is selected.
R20UT2867EJ0100 Rev.1.00
Feb 01, 2014
Page 473 of 572
CubeSuite+ V2.02.00
Transfer Direction
Data bit length
APPENDIX A WINDOW REFERENCE
Select the transfer direction.
MSB first
Sets MSB first as the transfer direction (default).
LSB first
Sets LSB first as the transfer direction.
Select the bit length of the transmission data from the drop-down list, or specify it through
direct input (default: 8).
Data Phase
Select the transmission/reception timing to set the data phase. The data clock phase is set in
combination with "Clock Phase" as shown in "Table A-15. Data Clock Phase Settings".
Normal
Transmits/receives data at the normal 3-wire serial transmission/reception
timing (default).
Precede
Transmits/receives data at a timing half a clock of the operation clock earlier
than the normal 3-wire serial transmission/reception timing.
Clock Phase
Select the transmission/reception clock waveform to set the clock phase. The data clock
phase is set in combination with "Data Phase" as shown in "Table A-15. Data Clock Phase
Settings".
Normal
Operates on the normal 3-wire serial clock.
Transfer starts at the falling edge of the clock (default).
Reverse
Operates on the reverse clock of the normal 3-wire serial clock. Transfer
starts at the rising edge of the clock.
Repeat
Select this item to repeat data transfer when the [Auto Send] button in the Serial window has
been clicked.
Following transmission of the last data during automatic transmission,
returns to the beginning of the data and performs automatic transmission.
Following transmission of the last data during automatic transmission, stops
transmission.
Remark
For the selectable range, see the user's manual of the microcontroller that is used.
Table A-15. Data Clock Phase Settings
Data
Clock
Phase
Phase
Setting
Setting
Normal
Normal
Precede
Normal
R20UT2867EJ0100 Rev.1.00
Feb 01, 2014
Data Clock Phase
Page 474 of 572
CubeSuite+ V2.02.00
Data
Clock
Phase
Phase
Setting
Setting
Normal
Reverse
Precede
Reverse
APPENDIX A WINDOW REFERENCE
Data Clock Phase
[Function buttons]
Button
Function
OK
Validates the settings and closes this dialog box.
Cancel
Cancels the settings and closes this dialog box.
[Transmission/reception when 3-wire serial interface (CSI) is selected]
The Serial window when CSI serial interface is selected always operates in the transmission/reception mode regardless of whether [Master] or [Slave] is selected in this dialog box.
When [Master] is selected
Data is transmitted or received immediately after clicking the [Send] button or the [Auto Send]
button in the Serial editor area.
When [Slave] is selected
Data becomes ready to be transmitted or received after clicking the [Send] button or the [Auto
Send] button in the Serial editor area.
Data starts to be transmitted or received when the CSI clock signal is received in the data transmission/reception ready status. This ready status is released when data transmission or reception is completed. (Even if the CSI clock is received, data is not transmitted or received in other
than the data transmission/reception ready status.)
Accordingly, when only wanting to reception data in the Serial window when "Slave" is selected, execute as follows
(Reception setting when CSI serial slave is selected):
(1) Set [Repeat]
Set the [Repeat] check box in the [Format (CSI)] dialog box.
R20UT2867EJ0100 Rev.1.00
Feb 01, 2014
Page 475 of 572
CubeSuite+ V2.02.00
APPENDIX A WINDOW REFERENCE
(2) Set Wait time
Set the Wait time to 0 as a dummy setting in the Serial window.
(3) Click the [Auto Send] button
R20UT2867EJ0100 Rev.1.00
Feb 01, 2014
Page 476 of 572
CubeSuite+ V2.02.00
APPENDIX B USER OPEN INTERFACE
APPENDIX B USER OPEN INTERFACE
Appendix B provides detailed explanations of the user open interface that is one of the functions provided by Simulator
GUI.
B.1
Overview
Simulator GUI provides two ways of creating an environment where a target system, as well as a CPU (CPU core +
internal peripherals), can be simulated.
One is the I/O Panel window, via which a user-friendly simulation environment can be organized through GUI manipulation, by supplying standard components for connection and their manipulation environment.
The other is to create the simulation environment of the target system that uses the user open interface to be explained
in this appendix. In this environment, functions that cannot be realized on the I/O Panel window can be used if the user
programs an external user model.
Figure B-1. Programming Image of User Model
CPU
User Model
programming
R20UT2867EJ0100 Rev.1.00
Feb 01, 2014
Page 477 of 572
CubeSuite+ V2.02.00
B.1.1
APPENDIX B USER OPEN INTERFACE
Types of interface functions
Simulator GUI's user open interface supplies the following types of interface functions (see "B.4 Supplied Interface
Functions").
Table B-1. Types of Functions Supplied by User Open Interface
Type
Basic interface functions
Description
Basic function of simulation
- Initialization notification
- Reset notification, etc.
Time interface functions
Cyclic timer function for time-series processing of the user model
- Setting of timer
- Clearing of timer
- Notification of timer time, etc.
Pin interface functions
Pin I/O function
- Signal output to pin
- Notification of signal input to pin
External bus interface functionsNote
Slave function of external bus
- External bus read access notification
- External bus write access notification, etc.
Serial interface functions
Serial transmission/reception function
- Transmission of serial data
- Notification of reception of serial data, etc.
Signal output unit interface functions
Function to output signals in accordance with signal data file
- Signal output in accordance with signal data file, etc.
Note When using the external bus interface function, the external memory area to use must be set to [Target memory
area] with the [Memory Type] area of the Memory Mapping dialog box.
B.1.2
Interface methods
Simulator GUI's user open interface has the following interface methods.
(1) C language interface
The user open interface consists of a C language API (Application Program Interface) function set.
Therefore, program the user model in C language.
(2) Callback function method
The user open interface uses the callback function method as a means to call a program from the system.
The callback function method is that a program (user model) is called by the system (CPU) when it is necessary.
This method uses the pointer to the function which is defined on the program (user model). The system (CPU) calls
the user program (user model) by using this pointer.
While the provided API functions call the system from the program, the callback function is used to call the program
from the system, such as when inputting a signal to a pin.
R20UT2867EJ0100 Rev.1.00
Feb 01, 2014
Page 478 of 572
CubeSuite+ V2.02.00
APPENDIX B USER OPEN INTERFACE
(3) Event-driven method
The user open interface uses an event-driven method in which processing is described in accordance with occurrence of events.
Therefore, a callback function prepared on the user model side is called if an event such as initialization of simulation, resetting the CPU, signal output to a pin, or access to the external bus occurs on the Simulator GUI side. In
addition, a time interface (= timer function) provided to perform time-series processing of a user model
also calls a callback function prepared on the user model side when the specified time has elapsed.
B.1.3
Development environment
Use the following development tools to perform programming with the Simulator GUI's user open interface and create a
DLL file.
- Microsoft Visual C++ (Ver. 6.00 or later)
R20UT2867EJ0100 Rev.1.00
Feb 01, 2014
Page 479 of 572
CubeSuite+ V2.02.00
B.2
APPENDIX B USER OPEN INTERFACE
Creating User Model
This section describes how to create a user model.
B.2.1
Program configuration
The following figure shows the program configuration when the Simulator GUI's user open interface is used to expand
a system.
Figure B-2. Program Configuration
[Expanded simulation block]
(other user models)
Pin connection
[Simulator GUI]
(CPU core +
User model
User open interface
CPU simulation block
Pin connection
processing module
User open interface
(UserModel.dll)
internal peripheral blocks)
External bus
connection
Simulation interface
: Created by user
To expand a system, a user model must be created first.
Because the user model operates in conjunction with the simulation system, it interfaces with the user open interface
processing module. This interface is the user open interface.
The user model generates resources such as pins and external bus slaves via the user open interface during configuration (processing to configure the simulator that is performed when Simulator GUI is started). By connecting the pins
and external bus slaves to the pins and external bus masters of the CPU simulation block, signals can be input to or output from the pins of the CPU simulation block and the external bus can be accessed from the CPU simulation block.
The generated pins and external bus slaves can also be connected to the expansion simulation block (other user models), as well as to the CPU simulation block.
R20UT2867EJ0100 Rev.1.00
Feb 01, 2014
Page 480 of 572
CubeSuite+ V2.02.00
B.2.2
APPENDIX B USER OPEN INTERFACE
Outline of programming
The user model is programmed in the dynamic link library (DLL) format of WIN32.
The template of a program file is shown below.
Figure B-3. Template of Program File
[System]
During configurationNote 1
[UserModel.c]
(1)
#include "suo.h"
(2)
SuoUserEntry void MakeUserModel (const char *option)
{
(3)
-------------------------------------Generation of interface
Initialization notificationNote 2
--------------------------------------
Reset notification
Registration of callback function
Time notification
--------------------------------------
Pin input
}
External bus access
void CallbackFunc(...)
{
Other
(4)
-------------------------------------Time setting
Callback processing
Pin output
--------------------------------------
Other
Notes 1.
2.
}
"Configuration" means simulator configuration processing that is executed when Simulator GUI is started.
An initialization notification is reported only once, immediately after Simulator GUI is started when simulator
configuration processing has been completed.
(1) File name
Indicates the file name of the user model to be created.
The file name can be determined freely (the suffix for a C language file is "*.c").
(2) Include file
Indicates a include file.
To use the user open interface, the system header file "suo.h" must be included.
(3) MakeUserModel function
Indicates the MakeUserModel function that is called from the system during configuration of Simulator GUI.
Note that the name of this function must be "MakeUserModel".
[Syntax]
SuoUserEntry void MakeUserModel(const char *option);
R20UT2867EJ0100 Rev.1.00
Feb 01, 2014
Page 481 of 572
CubeSuite+ V2.02.00
APPENDIX B USER OPEN INTERFACE
The following two types of processing are described in this function.
(a) Interface generation
Because Simulator GUI connects pins and buses during configuration processing when it is started, resources
such as pins and buses that are to be connected during configuration must be generated.
To do this, call a function that generates an interface in the MakeUserModel function and generate an interface
(see "B.4 Supplied Interface Functions"). The necessary resources will be also generated.
(b) Registering callback function
Callback functions can be registered as necessary.
Caution
When describing a callback function for initialization, be sure to register it at this time; otherwise callback will not function. This is because initialization notification is reported
immediately after the MakeUserModell function is called.
(4) Callback function
Indicates a callback function.
Two or more callback functions, such as those for initialization notification, reset notification, time notification, pin
input, and external bus access, can be created. Describe processing in accordance with the callback contents in
the callback function (see "B.5 User-Defined Functions").
A callback function that has been created must be registered in advance so that it can be called from the system
(see "B.4 Supplied Interface Functions"). The name of a callback function can be determined freely, and the format of the function differs depending on the type of callback.
R20UT2867EJ0100 Rev.1.00
Feb 01, 2014
Page 482 of 572
CubeSuite+ V2.02.00
B.2.3
APPENDIX B USER OPEN INTERFACE
Example of program file (UserModel.c)
#include "suo.h"
#include <memory.h>
void Init(void);
void InputP00(SuoHandle handle, int pinValue);
void ReadBUS1(SuoHandle handle, unsigned long addr, int accessSize, unsigned char data[]);
void WriteBUS1(SuoHandle handle, unsigned long addr, int accessSize, const unsigned char data[]);
SuoHandle p00;
SuoHandle p01;
SuoHandle bus1;
unsigned char mem[0x100];
/* MakeUserModel */
SuoUserEntry void MakeUserModel(const char *option)
{
SuoCreatePin("P00", &p00);
SuoCreatePin("P01", &p01);
SuoCreateExtbus("BUS1", 0x200000, 0x100, &bus1);
SuoSetInitCallback(Init);
SuoSetInputDigitalPinCallback(p00, InputP00);
SuoSetReadExtbusCallback(bus1, ReadBUS1);
SuoSetWriteExtbusCallback(bus1, WriteBUS1);
}
/* callbacks */
void Init(void)
{
memset(mem, 0, 0x100);
}
void InputP00(SuoHandle handle, int pinValue)
{
SuoOutputDigitalPin(p01, pinValue);
}
void ReadBUS1(SuoHandle handle, unsigned long addr, int accessSize, unsigned char data[])
{
memcpy(data, &mem[addr-0x200000], accessSize);
}
void WriteBUS1(SuoHandle handle, unsigned long addr, int accessSize, const unsigned char data[])
{
memcpy(&mem[addr-0x200000], data, accessSize);
}
R20UT2867EJ0100 Rev.1.00
Feb 01, 2014
Page 483 of 572
CubeSuite+ V2.02.00
B.2.4
APPENDIX B USER OPEN INTERFACE
Compilation and linking
Create a UserModel.dll by compiling and linking the created UserModel.c and suolink.cpp.
Figure B-4. Flow of Compilation and Linking
Include
suo.h
UserModel.c
suolink.cpp
Compile & Link
UserModel.dll
: Created by user
File Name
suo.h
Description
This is a system header file for the user open interface.
This file is included by the program (UserModel.c) but is not compiled.
Note that "suo.h" is stored in the following folder by default.
- Install-folder \CubeSuite+\DebugTools\DebugTool78K0RSimulator\useropen\sys
suolink.cpp
This is a file that performs dynamic link processing with the user open interface processing module of the
system.
Note that "suolink.cpp" is stored in the following folder by default.
- Install-folder \CubeSuite+\DebugTools\DebugTool78K0RSimulator\useropen\sys
UserModel.c
This is the source file of the user model to be created.
The file name can be determined freely.
UserModel.dll
This is a binary file of the user model (DLL file).
The file name can be determined freely.
Caution
To execute a DLL file in an environment in which Microsoft Visual C++ is not installed, the DLL file
must be created using the release version.
R20UT2867EJ0100 Rev.1.00
Feb 01, 2014
Page 484 of 572
CubeSuite+ V2.02.00
B.3
APPENDIX B USER OPEN INTERFACE
Embedding User Model
This section describes how to embed the created user model (UserModel.dll) in Simulator GUI.
To embed the user model in Simulator GUI, use a simulator configuration file (*.cfg).
Therefore, when using Simulator GUI embedding the created user model, you need to specify [Yes] with the [Use simulator configuration file] property in the [Configuration] category on the [Connect Settings] tab of the Property panel, and
then specify the configuration file to be used with the [Simulator configuration file] property in the category same as
above.
B.3.1
Description in simulator configuration file
Describe the user model generation processing, processing to connect pins and an external buses and so on in the
simulator configuration file.
(1) User model generation processing
(2) Pin connection
(3) External bus connection
(4) Other processing
(1) User model generation processing
UserModel1 = Device("USEROPEN", "UserModel1.dll UserOption1");
(a) UserModel1
UserModel1 is a variable that indicates the generated user model. The variable name can be determined
freely by user.
(b) Device function
The Device function is used to create a user model.
(c) "USEROPEN"
"USEROPEN" is a user open interface processing module (system module).
(d) UserModel1.dll
UserModel1.dll is the binary file (DLL format) of the user model to be created in "B.2 Creating User Model".
The file name can be determined freely by user.
Specify a absolute path or relative path from the folder where the simulator configuration file exists as the file
path.
Caution
Do not use single-byte spaces for specifying the path name; otherwise, the user model will
not be created.
(e) UserOption1
UserOption1 is an option character string for UserModel1.dll. This character string is passed to the "option"
parameter of the MakeUserModel function as is.
R20UT2867EJ0100 Rev.1.00
Feb 01, 2014
Page 485 of 572
CubeSuite+ V2.02.00
APPENDIX B USER OPEN INTERFACE
(2) Pin connection
wire1 =
Wire(1);
--- (a)
wire1 += cpu.Port("PinName1");
--- (b)
wire1 += UserModel1.Port("UserPinName1");
--- (c)
(a) Generation of a wire
Generate a wire (= line that connects pins) by using the Wire function.
Be sure to specify "1" for the argument of the Wire function.
wire1 is a variable that indicates the generated wire. The variable name can be determined freely.
(b) Connection of the wire and CPU
Connect one end of the wire to a pin of the CPU.
Specify the name of the external CPU pin to be connected by using uppercase characters, as "PinName1"
(note that lowercase characters cannot be used). Enclose the pin name between double quotation marks ("").
(c) Connection of the wire and user model
Connect the other end of the wire to a pin of the user model.
Specify the name of the user model pin to be connected as "UserPinName1" (pin name generated in the
MakeUserModel function). Enclose the pin name between double quotation marks ("").
Add this line to connect two or more user model pins to the same wire.
(3) External bus connection
extbus1 =
BUS(n);
--- (a)
extbus1 += cpu.BusMasterIF("EXTBUS");
--- (b)
extbus1 += UserModel1.BusSlaveIF("UserExtbusName1");
--- (c)
(a) Generation of a bus
Generate a bus by using the BUS function.
Argument n of the BUS function is the data bus bit width. This may be 8, 16, or 32.
extbus1 is a variable that indicates the generated bus. The variable name can be determined freely.
(b) Connection of the bus and CPU
Connect one end of the bus to the external bus master of the CPU.
Specify the external bus master "EXTBUS" for the argument.
(c) Connection of the bus and user model
Connect the other end of the bus to the external bus of the user model.
Specify the name of the external bus of the user model to be connected as "UserExtbusName1" (the external
bus name generated in the MakeUserModel function). Enclose the external bus name between double quotation marks ("").
Add this line to connect two or more user model external buses.
(4) Other processing
In addition to the above, the formulaic connections for the main clock notification pin and the reset notification pin
shown below is required to operate the user open interface.
R20UT2867EJ0100 Rev.1.00
Feb 01, 2014
Page 486 of 572
CubeSuite+ V2.02.00
clock1 =
APPENDIX B USER OPEN INTERFACE
--- (a)
Wire(1);
clock1 += cpu.DebuggerPseudoPort("debugger_pseudo_pin_main_clkout");
--- (b)
clock1 += UserModel1.Port("gui_pseudo_pin_clock_notice");
--- (c)
reset1 =
--- (d)
Wire(1);
reset1 += cpu.DebuggerPseudoPort("debugger_pseudo_pin_reset_notice");
--- (e)
reset1 += UserModel1.Port("gui_pseudo_pin_reset_notice");
--- (f)
(a) Generation of a wire
Generate a wire (= line that connects pins) by using the Wire function.
Be sure to specify "1" for the argument of the Wire function.
clock1 is a variable that indicates the generated wire. The variable name can be determined freely.
(b) Connection of the wire and main clock notification pin
Connect one end of the wire to Simulator GUI's main clock notification pin.
Specify "debugger_pseudo_pin_main_clkout" for the argument.
(c) Connection of the wire and user model
Connect the other end of the wire to a pin of the user model.
Specify "gui_pseudo_pin_clock_notice" for the argument.
(d) Generation of a wire
Generate a wire (= line that connects pins) by using the Wire function.
Be sure to specify "1" for the argument of the Wire function.
reset1 is a variable that indicates the generated wire. The variable name can be determined freely.
(e) Connection of the wire and reset notification pin
Connect one end of the wire to Simulator GUI's reset notification pin.
Specify "debugger_pseudo_pin_reset_notice" for the argument.
(f) Connection of the wire and user model
Connect the other end of the wire to a pin of the user model.
Specify "gui_pseudo_pin_reset_notice" for the argument.
B.3.2
Example of simulator configuration file
An example of the simulator configuration file is shown below.
In this example, the following connection processing is performed.
Type of Connection
Pin
External bus
CPU
User Model (SampleModel.dll)
"P00/INTP0"
P00 pin
"P00"
Pin manipulating P00
"P30/TXD1"
Serial output pin
"RXD"
Serial input pin
"P31/RXD1"
Serial input pin
"TXD"
Serial output pin
"EXTBUS"
External bus master
"EXTBUS1"
External bus slave 1
"EXTBUS"
External bus master
"EXTBUS2"
External bus slave 2
R20UT2867EJ0100 Rev.1.00
Feb 01, 2014
Page 487 of 572
CubeSuite+ V2.02.00
APPENDIX B USER OPEN INTERFACE
cpu = CPU('a');
# -------------------------------------------------------------# SampleModel description
# -------------------------------------------------------------# Generate SampleModel.dll
model = Device("USEROPEN", "SampleModel.dll -a -b");
# Connect PIN (CPU.P00-MODEL.P00)
wire_P00 =
Wire(1);
wire_P00 += cpu.Port("P00/INTP0");
wire_P00 += model.Port("P00");
# Connect PIN (CPU.TXD1-MODEL.RXD)
wire_RXD =
Wire(1);
wire_RXD += cpu.Port("P30/TXD1");
wire_RXD += model.Port("RXD");
# Connect PIN (CPU.RXD1-MODEL.TXD)
wire_TXD =
Wire(1);
wire_TXD += cpu.Port("P31/RXD1");
wire_TXD += model.Port("TXD");
# Connect BUS (CPU.EXTBUS-MODEL.EXTBUS1)
extbus =
BUS(32);
extbus += cpu.BusMasterIF("EXTBUS");
extbus += model.BusSlaveIF("EXTBUS1");
extbus += model.BusSlaveIF("EXTBUS2");
# Connect Pseudo PIN
wire_clock =
Wire(1);
wire_clock += cpu.DebuggerPseudoPort("debugger_pseudo_pin_main_clkout");
wire_clock += model.Port("gui_pseudo_pin_clock_notice");
wire_reset =
Wire(1);
wire_reset += cpu.DebuggerPseudoPort("debugger_pseudo_pin_reset_notice");
wire_reset += model.Port("gui_pseudo_pin_reset_notice");
R20UT2867EJ0100 Rev.1.00
Feb 01, 2014
Page 488 of 572
CubeSuite+ V2.02.00
B.4
APPENDIX B USER OPEN INTERFACE
Supplied Interface Functions
This section describes the interface functions supplied by Simulator GUI as the user open interface.
B.4.1
Overview
The supplied interface functions are listed below.
Table B-2. List of Supplied Interface Functions
Type
Basic interface functions
Time interface functions
Pin interface functions
External bus interface
functionsNote
Function Name
Outline of Function
SuoSetInitCallback
Registers initialization callback.
SuoSetResetCallback
Registers reset callback.
SuoGetMainClock
Acquires the cycle of the main clock for simulation.
SuoCreateTimer
Generates timer interface.
SuoGetTimerHandle
Acquires timer handle.
SuoSetTimer
Sets cyclic timer.
SuoKillTimer
Stops cyclic timer.
SuoSetNotifyTimerCallback
Registers timer time notification callback.
SuoCreatePin
Generates pin interface.
SuoGetPinHandle
Acquires pin interface handle.
SuoOutputDigitalPin
Outputs digital pin value.
SuoOutputAnalogPin
Outputs analog pin value.
SuoOutputHighImpedance
Outputs high-impedance for the pin.
SuoSetInputDigitalPinCallback
Registers digital pin value input callback.
SuoSetInputAnalogPinCallback
Registers analog pin value input callback.
SuoSetInputHighImpedanceCallback
Registers pin high-impedance state report callback.
SuoCreateExtbus
Generates external bus interface.
SuoGetExtbusHandle
Acquires external bus interface handle.
SuoSetReadExtbusCallback
Registers external bus read access callback.
SuoSetWriteExtbusCallback
Registers external bus write access callback.
R20UT2867EJ0100 Rev.1.00
Feb 01, 2014
Page 489 of 572
CubeSuite+ V2.02.00
Type
Serial interface functions
APPENDIX B USER OPEN INTERFACE
Function Name
Outline of Function
SuoCreateSerialUART
Generates serial interface (UART type).
SuoCreateSerialCSI
Generates serial interface (CSI type).
SuoGetSerialHandle
Acquires serial interface handle.
SuoSetSerialParameterUART
Sets serial parameter (UART type).
SuoSetSerialParameterCSI
Sets serial parameter (CSI type).
SuoGetSerialParameterUART
Acquires serial parameter (UART type).
SuoGetSerialParameterCSI
Acquires serial parameter (CSI type).
SuoSendSerialData
Performs serial transmission (1 data).
SuoSendSerialDataList
Performs serial transmission (more than one data).
SuoSendSerialFile
Performs serial transmission (serial transmission data
file).
Signal output unit
interface functions
SuoSetNotifySentSerialCallback
Registers serial transmission end notification callback.
SuoSetReceiveSerialCallback
Registers serial reception callback.
SuoCreateWave
Generates signal output unit interface.
SuoGetWaveHandle
Acquires signal output unit interface handle.
SuoSendWaveFile
Performs transmission via signal output unit.
SuoSetNotifySentWaveCallback
Registers signal output unit transmission end notification
callback.
Note When using the external bus interface function, the external memory area to use must be set to [Target memory
area] with the [Memory Type] area of the Memory Mapping dialog box.
R20UT2867EJ0100 Rev.1.00
Feb 01, 2014
Page 490 of 572
CubeSuite+ V2.02.00
B.4.2
APPENDIX B USER OPEN INTERFACE
Basic interface functions
The basic interface functions that are supplied by Simulator GUI are as follows:
Function Name
Outline of Function
SuoSetInitCallback
Registers initialization callback.
SuoSetResetCallback
Registers reset callback.
SuoGetMainClock
Acquires the cycle of the main clock for simulation.
R20UT2867EJ0100 Rev.1.00
Feb 01, 2014
Page 491 of 572
CubeSuite+ V2.02.00
APPENDIX B USER OPEN INTERFACE
SuoSetInitCallback
Registers initialization callback.
Caution
A callback function is not executed unless this function is called in the MakeUserModel function.
[Syntax]
#include
void
"suo.h"
SuoSetInitCallback(SuoInitCallback func);
[Argument(s)]
Argument
func
Description
Pointer to the user-defined function that performs initialization processing (see "InitFunc")
[Return value]
None
[Description]
- This function registers the user-defined function that performs initialization processing.
- The function registered by this function is called only once, when Simulator GUI is started.
- If NULL is specified for func, registration is canceled.
[Example]
#include
"suo.h"
void InitFunc(void);
/* MakeUserModel */
SuoUserEntry void MakeUserModel(const char *option)
{
.........
SuoSetInitCallback(InitFunc);
/* Set initialize function */
}
/* Initialize function */
void InitFunc(void){
.........
}
R20UT2867EJ0100 Rev.1.00
Feb 01, 2014
Page 492 of 572
CubeSuite+ V2.02.00
APPENDIX B USER OPEN INTERFACE
SuoSetResetCallback
Registers reset callback.
[Syntax]
#include
void
"suo.h"
SuoSetResetCallback(SuoResetCallback func);
[Argument(s)]
Argument
func
Description
Pointer to the user-defined function that performs reset processing (see "ResetFunc")
[Return value]
None
[Description]
- This function registers the user-defined function that performs reset processing.
- The registered function is called when the CPU is reset.
- If NULL is specified for func, registration is canceled.
[Example]
#include
"suo.h"
void ResetFunc(void);
void func1(void)
{
.........
SuoSetResetCallback(ResetFunc);
/* Set reset function */
}
/* Reset function */
void ResetFunc(void){
.........
}
R20UT2867EJ0100 Rev.1.00
Feb 01, 2014
Page 493 of 572
CubeSuite+ V2.02.00
APPENDIX B USER OPEN INTERFACE
SuoGetMainClock
Acquires the cycle of the main clock for simulation.
Caution
This function cannot be called in the MakeUserModel function. It can only be called in a callback
function.
[Syntax]
#include
int
"suo.h"
SuoGetMainClock(unsigned long* time);
[Argument(s)]
Argument
time
Description
Location where the main clock cycle value (unit: pS) is to be stored.
[Return value]
Macro
Description
SUO_NOERROR
Normal completionNormal completion
Error number
Exit with error (abend) (see "B.4.8 Error numbers")
[Description]
- This function is used to acquire the cycle of the main clock for the simulation environment currently being executed.
[Example]
#include
"suo.h"
unsigned long time;
void func1(void)
{
.........
SuoGetMainClock(&time);
/* Get main clock */
}
R20UT2867EJ0100 Rev.1.00
Feb 01, 2014
Page 494 of 572
CubeSuite+ V2.02.00
B.4.3
APPENDIX B USER OPEN INTERFACE
Time interface functions
The time interface functions that are supplied by Simulator GUI are as follows:
Function Name
Outline of Function
SuoCreateTimer
Generates timer interface.
SuoGetTimerHandle
Acquires timer handle.
SuoSetTimer
Sets cyclic timer.
SuoKillTimer
Stops cyclic timer.
SuoSetNotifyTimerCallback
Registers timer time notification callback.
R20UT2867EJ0100 Rev.1.00
Feb 01, 2014
Page 495 of 572
CubeSuite+ V2.02.00
APPENDIX B USER OPEN INTERFACE
SuoCreateTimer
Generates timer interface.
Caution
This function can only be called in the MakeUserModel function. An error occurs if it is called at any
other timing.
[Syntax]
#include
int
"suo.h"
SuoCreateTimer(const char* timerName, SuoHandle* handle);
[Argument(s)]
Argument
Description
timerName
Name of the timer
handle
Location where the handle of the timer interface is to be stored
[Return value]
Macro
Description
SUO_NOERROR
Normal completion
Error number
Exit with error (abend) (see "B.4.8 Error numbers")
[Description]
- This function generates a timer interface.
- The generated timer interface is associated with the name specified for timerName.
- If this function is successful, the handle of the generated timer interface can be obtained. The timer interface can
then be controlled by specifying this handle.
- The handle can also be obtained by using the SuoGetTimerHandle function.
[Example]
#include
"suo.h"
SuoHandle hTim1;
SuoUserEntry void MakeUserModel(const char *option)
{
.........
SuoCreateTimer("TIM1", &hTim1);
/* Create "TIM1" */
}
R20UT2867EJ0100 Rev.1.00
Feb 01, 2014
Page 496 of 572
CubeSuite+ V2.02.00
APPENDIX B USER OPEN INTERFACE
SuoGetTimerHandle
Acquires timer handle.
[Syntax]
#include
"suo.h"
SuoHandle
SuoGetTimerHandle(const char* timerName);
[Argument(s)]
Argument
timerName
Description
Name of the timer
[Return value]
Macro
Description
Handle of the specified
Normal completion
timer interface
NULL
Exit with error (abend)
[Description]
- This function is used to obtain the handle of the specified timer interface.
- Specify the name specified by the SuoCreateTimer function as timerName (if a different name is specified, NULL is
returned).
[Example]
#include
"suo.h"
SuoHandle hTim1;
void func1(void)
{
.........
hTim1 = SuoGetTimerHandle("TIM1");
/* Get handle of "TIM1" */
}
R20UT2867EJ0100 Rev.1.00
Feb 01, 2014
Page 497 of 572
CubeSuite+ V2.02.00
APPENDIX B USER OPEN INTERFACE
SuoSetTimer
Sets cyclic timer.
Caution
This function cannot be called in the MakeUserModel function. It can only be called in a callback
function.
[Syntax]
#include
int
"suo.h"
SuoSetTimer(SuoHandle handle, int timeUnit, unsigned long timeValue);
[Argument(s)]
Argument
Description
handle
Handle of the timer interface
timeUnit
Time unit (specify any of the following)
timeValue
- SUO_MAINCLK :
Main clock cycle units
- SUO_USEC :
Microsecond units
Timer cycle time
[Return value]
Macro
Description
SUO_NOERROR
Normal completion
Error number
Exit with error (abend) (see "B.4.8 Error numbers")
[Description]
- This function sets a cyclic timer for the specified timer interface.
- The cycle time is specified by the value of timeValue in units of timeUnit ("0" cannot be specified for timeValue.
- The timer starts operating immediately after this function is called. The timer continues operating until it is stopped
by the SuoKillTimer function.
- If a timer notification function has been registered by the SuoSetNotifyTimerCallback function, the timer notification
function is called in each cycle.
- If this function is called for the timer that is currently operating, the timer is reset and starts operating with the specified cycle time.
R20UT2867EJ0100 Rev.1.00
Feb 01, 2014
Page 498 of 572
CubeSuite+ V2.02.00
APPENDIX B USER OPEN INTERFACE
[Example]
#include
"suo.h"
SuoHandle hTim1;
void func1(void)
{
.........
SuoSetTimer(hTim1, SUO_USEC, 20);
/* Invoke 20us cyclic timer */
}
R20UT2867EJ0100 Rev.1.00
Feb 01, 2014
Page 499 of 572
CubeSuite+ V2.02.00
APPENDIX B USER OPEN INTERFACE
SuoKillTimer
Stops cyclic timer.
Caution
This function cannot be called in the MakeUserModel function. It can only be called in a callback
function.
[Syntax]
#include
int
"suo.h"
SuoKillTimer(SuoHandle handle);
[Argument(s)]
Argument
handle
Description
Handle of the timer interface
[Return value]
Macro
Description
SUO_NOERROR
Normal completion
Error number
Exit with error (abend) (see "B.4.8 Error numbers")
[Description]
- This function stops the cyclic timer of the specified timer interface.
- If the timer is operating, the timer is stopped. If the timer is stopped, nothing is done (in this case, an error does
not occur).
[Example]
#include
"suo.h"
SuoHandle hTim1;
void func1(void)
{
.........
SuoKillTimer(hTim1);
/* Stop timer */
}
R20UT2867EJ0100 Rev.1.00
Feb 01, 2014
Page 500 of 572
CubeSuite+ V2.02.00
APPENDIX B USER OPEN INTERFACE
SuoSetNotifyTimerCallback
Registers timer time notification callback.
[Syntax]
#include
int
"suo.h"
SuoSetNotifyTimerCallback(SuoHandle handle, SuoNotifyTimerCallback func);
[Argument(s)]
Argument
Description
handle
Handle of the timer interface
func
Pointer to the user-defined function that reports the time of the timer (see "NotifyTimerFunc")
[Return value]
Macro
Description
SUO_NOERROR
Normal completion
Error number
Exit with error (abend) (see "B.4.8 Error numbers")
[Description]
- This function registers a user-defined function that performs processing when the time of the timer is reported.
- The registered function is called in every timer cycle of the specified timer interface.
- If NULL is specified for func, registration is canceled.
[Example]
#include
"suo.h"
void NotifyTimerFunc(SuoHandle handle);
SuoHandle hTim1;
void func1(void)
{
.........
SuoSetNotifyTimerCallback(hTim1, NotifyTimerFunc);
/* Set notify-timer function */
}
/* Notify-timer function */
void NotifyTimerFunc(SuoHandle handle)
{
.........
}
R20UT2867EJ0100 Rev.1.00
Feb 01, 2014
Page 501 of 572
CubeSuite+ V2.02.00
B.4.4
APPENDIX B USER OPEN INTERFACE
Pin interface functions
The pin interface functions that are supplied by Simulator GUI are as follows:
Function Name
Outline of Function
SuoCreatePin
Generates pin interface.
SuoGetPinHandle
Acquires pin interface handle.
SuoOutputDigitalPin
Outputs digital pin value.
SuoOutputAnalogPin
Outputs analog pin value.
SuoOutputHighImpedance
Outputs high-impedance for the pin.
SuoSetInputDigitalPinCallback
Registers digital pin value input callback.
SuoSetInputAnalogPinCallback
Registers analog pin value input callback.
SuoSetInputHighImpedanceCallback
Registers pin high-impedance state report callback.
R20UT2867EJ0100 Rev.1.00
Feb 01, 2014
Page 502 of 572
CubeSuite+ V2.02.00
APPENDIX B USER OPEN INTERFACE
SuoCreatePin
Generates pin interface.
Caution
This function can only be called in the MakeUserModel function. An error occurs if it is called at any
other timing.
[Syntax]
#include
int
"suo.h"
SuoCreatePin(const char* pinName, SuoHandle* handle);
[Argument(s)]
Argument
Description
pinName
Name of the pin
handle
Location where the handle of the pin interface is to be stored
[Return value]
Macro
Description
SUO_NOERROR
Normal completion
Error number
Exit with error (abend) (see "B.4.8 Error numbers")
[Description]
- This function generates a pin interface.
- The generated pin interface is associated with the name specified for pinName. Also, the pin specified as pinName is generated.
- If this function is successful, the handle of the generated pin interface can be obtained. The pin interface can then
be controlled by specifying this handle.
The handle can also be obtained by using the SuoGetPinHandle function.
[Example]
#include
"suo.h"
SuoHandle hPinP00;
SuoHandle hPinABC;
SuoUserEntry void MakeUserModel(const char *option)
{
.........
SuoCreatePin("P00", &hPinP00);
/* Create "P00" */
SuoCreatePin("ABC", &hPinABC);
/* Create "ABC" */
}
R20UT2867EJ0100 Rev.1.00
Feb 01, 2014
Page 503 of 572
CubeSuite+ V2.02.00
APPENDIX B USER OPEN INTERFACE
SuoGetPinHandle
Acquires pin interface handle.
[Syntax]
#include
"suo.h"
SuoHandle
SuoGetPinHandle(const char* pinName);
[Argument(s)]
Argument
pinName
Description
Name of the pin
[Return value]
Macro
Description
Handle of the specified
Normal completion
pin interface
NULL
Exit with error (abend)
[Description]
- This function is used to obtain the handle of the specified pin interface.
- Specify the name of a function specified by the SuoCreatePin function as pinName (if a different name is specified,
NULL is returned).
[Example]
#include
"suo.h"
SuoHandle hPinP00;
void func1(void)
{
.........
hPinP00 = SuoGetPinHandle("P00");
/* Get handle of "P00" */
}
R20UT2867EJ0100 Rev.1.00
Feb 01, 2014
Page 504 of 572
CubeSuite+ V2.02.00
APPENDIX B USER OPEN INTERFACE
SuoOutputDigitalPin
Outputs digital pin value.
Caution
This function cannot be called in the MakeUserModel function. It can only be called in a callback
function.
[Syntax]
#include
int
"suo.h"
SuoOutputDigitalPin(SuoHandle handle, int pinValue);
[Argument(s)]
Argument
Description
handle
Handle of the pin interface
pinValue
Digital output value (specify any of the following)
- SUO_HIGH (=1):
HIGH value
- SUO_LOW (=0):
LOW value
[Return value]
Macro
Description
SUO_NOERROR
Normal completion
Error number
Exit with error (abend) (see "B.4.8 Error numbers")
[Description]
- This function outputs a digital data signal specified with pinValue to the specified pin interface.
- To output an analog data signal, use the SuoOutputAnalogPin function.
[Example]
#include
"suo.h"
SuoHandle hPinP00;
void func1(void)
{
.........
SuoOutputDigitalPin(hPinP00, SUO_HIGH);
/* Output HIGH */
}
R20UT2867EJ0100 Rev.1.00
Feb 01, 2014
Page 505 of 572
CubeSuite+ V2.02.00
APPENDIX B USER OPEN INTERFACE
SuoOutputAnalogPin
Outputs analog pin value.
Caution
This function cannot be called in the MakeUserModel function. It can only be called in a callback
function.
[Syntax]
#include
int
"suo.h"
SuoOutputAnalogPin(SuoHandle handle, double pinValue);
[Argument(s)]
Argument
Description
handle
Handle of the pin interface
pinValue
Analog output value (unit: V)
[Return value]
Macro
Description
SUO_NOERROR
Normal completion
Error number
Exit with error (abend) (see "B.4.8 Error numbers")
[Description]
- This function outputs an analog data signal specified with pinValue to the specified pin interface.
- Specify pinValue in V (volts), as floating-point data.
- To output a digital data signal, use the SuoOutputDigitalPin function.
[Example]
#include
"suo.h"
SuoHandle hPinP00;
void func1(void)
{
.........
SuoOutputAnalogPin(hPinP00, 3.5);
/* Output 3.5V */
}
R20UT2867EJ0100 Rev.1.00
Feb 01, 2014
Page 506 of 572
CubeSuite+ V2.02.00
APPENDIX B USER OPEN INTERFACE
SuoOutputHighImpedance
Outputs high-impedance for the pin.
Caution
This function cannot be called in the MakeUserModel function. It can only be called in a callback
function.
[Syntax]
#include
int
"suo.h"
SuoOutputHighImpedance(SuoHandle handle);
[Argument(s)]
Argument
handle
Description
Handle of the pin interface
[Return value]
Macro
Description
SUO_NOERROR
Normal completion
Error number
Exit with error (abend) (see "B.4.8 Error numbers")
[Description]
- This function is used to output high-impedance for the specified digital/analog pin interface.
[Example]
#include
"suo.h"
SuoHandle hPinP00;
void func1(void)
{
.........
SuoOutputHighImpedance(hPinP00);
/* Output High Impedance */
}
R20UT2867EJ0100 Rev.1.00
Feb 01, 2014
Page 507 of 572
CubeSuite+ V2.02.00
APPENDIX B USER OPEN INTERFACE
SuoSetInputDigitalPinCallback
Registers digital pin value input callback.
[Syntax]
#include
int
"suo.h"
SuoSetInputDigitalPinCallback(SuoHandle handle, SuoInputDigitalPinCallback func);
[Argument(s)]
Argument
handle
Description
Handle of the pin interface
func
Pointer to a user-defined function that performs digital pin input processing (see "InputDigitalPinFunc")
[Return value]
Macro
Description
SUO_NOERROR
Normal completion
Error number
Exit with error (abend) (see "B.4.8 Error numbers")
[Description]
- This function is used to register a user-defined function that performs digital pin input processing.
- The registered function is called when a signal is input to the specified pin.
- If NULL is specified for func, registration is canceled.
[Example]
#include
"suo.h"
void InputDigitalPinFunc(SuoHandle handle, int pinValue);
SuoHandle hPinP00;
void func1(void)
{
.........
SuoSetInputDigitalPinCallback(hPinP00, InputDigitalPinFunc); /* Set input-digital-pin function */
}
/* Input-digital-pin function */
void InputDigitalPinFunc(SuoHandle handle, int pinValue)
{
.........
}
R20UT2867EJ0100 Rev.1.00
Feb 01, 2014
Page 508 of 572
CubeSuite+ V2.02.00
APPENDIX B USER OPEN INTERFACE
SuoSetInputAnalogPinCallback
Registers analog pin value input callback.
[Syntax]
#include
int
"suo.h"
SuoSetInputAnalogPinCallback(SuoHandle handle, SuoInputAnalogPinCallback func);
[Argument(s)]
Argument
handle
Description
Handle of the pin interface
func
Pointer to a user-defined function that performs analog pin input processing (see "InputAnalogPinFunc")
[Return value]
Macro
Description
SUO_NOERROR
Normal completion
Error number
Exit with error (abend) (see "B.4.8 Error numbers")
[Description]
- This function is used to register a user-defined function that performs analog pin input processing.
- The registered function is called when a signal is input to the specified pin.
- If NULL is specified for func, registration is canceled.
[Example]
#include
"suo.h"
void InputAnalogPinFunc(SuoHandle handle, double pinValue);
SuoHandle hPinP00;
void func1(void)
{
.........
SuoSetInputAnalogPinCallback(hPinP00, InputAnalogPinFunc); /* Set input-analog-pin function */
}
/* Input-analog-pin function */
void InputAnalogPinFunc(SuoHandle handle, double pinValue)
{
.........
}
R20UT2867EJ0100 Rev.1.00
Feb 01, 2014
Page 509 of 572
CubeSuite+ V2.02.00
APPENDIX B USER OPEN INTERFACE
SuoSetInputHighImpedanceCallback
Registers pin high-impedance state report callback.
[Syntax]
#include
int
"suo.h"
SuoSetInputHighImpedanceCallback(SuoHandle handle, SuoInputHighImpedanceCallback func);
[Argument(s)]
Argument
Description
handle
Handle of the pin interface
func
Pointer to a user-defined function that performs processing when all the connected pins enter the
high-impedance state (see "InputHighImpedanceFunc")
[Return value]
Macro
Description
SUO_NOERROR
Normal completion
Error number
Exit with error (abend) (see "B.4.8 Error numbers")
[Description]
- This function is used to register the user-defined function that performs processing when all the pins connected to
digital/analog pins enter the high-impedance state.
- If NULL is specified for func, registration is canceled.
[Example]
#include
"suo.h"
void InputHighImpedanceFunc(SuoHandle handle);
SuoHandle hPinP00;
void func1(void)
{
.........
SuoSetInputHighImpedanceCallback(hPinP00,InputHighImpedanceFunc);
/* Set input-high-impedance function */
}
/* Input-high-impedance function */
void InputHighImpedanceFunc(SuoHandle handle)
{
.........
}
R20UT2867EJ0100 Rev.1.00
Feb 01, 2014
Page 510 of 572
CubeSuite+ V2.02.00
B.4.5
APPENDIX B USER OPEN INTERFACE
External bus interface functions
The external bus interface functions that are supplied by Simulator GUI are as follows:
Function Name
Outline of Function
SuoCreateExtbus
Generates external bus interface.
SuoGetExtbusHandle
Acquires external bus interface handle.
SuoSetReadExtbusCallback
Registers external bus read access callback.
SuoSetWriteExtbusCallback
Registers external bus write access callback.
Caution
When using the external bus interface function, the external memory area to use must be set to [Target memory area] with the [Memory Type] area of the Memory Mapping dialog box.
R20UT2867EJ0100 Rev.1.00
Feb 01, 2014
Page 511 of 572
CubeSuite+ V2.02.00
APPENDIX B USER OPEN INTERFACE
SuoCreateExtbus
Generates external bus interface.
Cautions 1.
This function can only be called in the MakeUserModel function. An error occurs if it is called at
any other timing.
2.
When using the external bus interface function, the external memory area to use must be set to
[Target memory area] with the [Memory Type] area of the Memory Mapping dialog box.
[Syntax]
#include
"suo.h"
int
SuoCreateExtbus(const char* extbusName, unsigned long addr, unsigned long size,
SuoHandle* handle);
[Argument(s)]
Argument
Description
extbusName
Name of the external bus
addr
The first address of the external memory area
size
Size of the external memory area
handle
Location where the handle of the external bus interface is to be stored
[Return value]
Macro
Description
SUO_NOERROR
Normal completion
Error number
Exit with error (abend) (see "B.4.8 Error numbers")
[Description]
- This function is used to generate an external bus interface.
- The generated external bus interface is associated with the name specified for extbusName.
- If this function is successful, the handle of the generated external bus interface can be obtained. The external bus
interface can then be controlled by specifying this handle.
The handle can also be obtained by using the SuoGetExtbusHandle function.
R20UT2867EJ0100 Rev.1.00
Feb 01, 2014
Page 512 of 572
CubeSuite+ V2.02.00
APPENDIX B USER OPEN INTERFACE
[Example]
#include
"suo.h"
SuoHandle hExtbus1;
SuoUserEntry void MakeUserModel(const char *option)
{
.........
SuoCreateExtbus("EXTBUS1", 0x200000, 0x1000, &hExtbus1);
/* Create "EXTBUS1" */
}
R20UT2867EJ0100 Rev.1.00
Feb 01, 2014
Page 513 of 572
CubeSuite+ V2.02.00
APPENDIX B USER OPEN INTERFACE
SuoGetExtbusHandle
Acquires external bus interface handle.
[Syntax]
#include
"suo.h"
SuoHandle
SuoGetExtbusHandle(const char* extbusName);
[Argument(s)]
Argument
extbusName
Description
Name of the external bus
[Return value]
Macro
Description
Handle of the specified
Normal completion
external bus interface
NULL
Exit with error (abend)
[Description]
- This function is used to obtain the handle of the specified external bus interface.
- Specify the name specified by the SuoCreateExtbus function as extbusName (if a different name is specified,
NULL is returned).
[Example]
#include
"suo.h"
SuoHandle hExtbus1;
void func1(void)
{
.........
hExtbus1 = SuoGetExtbusHandle("EXTBUS1");
/* Get handle of "EXTBUS1" */
}
R20UT2867EJ0100 Rev.1.00
Feb 01, 2014
Page 514 of 572
CubeSuite+ V2.02.00
APPENDIX B USER OPEN INTERFACE
SuoSetReadExtbusCallback
Registers external bus read access callback.
[Syntax]
#include
int
"suo.h"
SuoSetReadExtbusCallback(SuoHandle handle, SuoReadExtbusCallback func);
[Argument(s)]
Argument
Description
handle
Handle of the external bus interface
func
Pointer to a user-defined function that performs read access processing of an external bus (see
"ReadExtbusFunc")
[Return value]
Macro
Description
SUO_NOERROR
Normal completion
Error number
Exit with error (abend) (see "B.4.8 Error numbers")
[Description]
- This function is used to register a user-defined function that performs read access processing of an external bus.
- The registered function is called if a read request is issued to the specified external bus (in the registered address
range).
- If NULL is specified for func, registration is canceled.
[Example]
#include
"suo.h"
void ReadExtbusFunc(SuoHandle handle, unsigned long addr, int accessSize, unsigned char data[]);
SuoHandle hExtbus1;
void func1(void)
{
.........
SuoSetReadExtbusCallback(hExtbus1, ReadExtbusFunc);
/* Set read-external-bus function */
}
/* Read-external-bus function */
void ReadExtbusFunc(SuoHandle handle, unsigned long addr, int accessSize, unsigned char data[])
{
.........
}
R20UT2867EJ0100 Rev.1.00
Feb 01, 2014
Page 515 of 572
CubeSuite+ V2.02.00
APPENDIX B USER OPEN INTERFACE
SuoSetWriteExtbusCallback
Registers external bus write access callback.
[Syntax]
#include
int
"suo.h"
SuoSetWriteExtbusCallback(SuoHandle handle, SuoWriteExtbusCallback func);
[Argument(s)]
Argument
handle
Description
Handle of the external bus interface
func
Pointer to a user-defined function that performs write access processing of an external bus (see
"WriteExtbusFunc")
[Return value]
Macro
Description
SUO_NOERROR
Normal completion
Error number
Exit with error (abend) (see "B.4.8 Error numbers")
[Description]
- This function is used to register a user-defined function that performs write access processing of an external bus.
- The registered function is called when a write request is issued to the specified external bus (in the registered
address range).
- If NULL is specified for func, registration is canceled.
R20UT2867EJ0100 Rev.1.00
Feb 01, 2014
Page 516 of 572
CubeSuite+ V2.02.00
APPENDIX B USER OPEN INTERFACE
[Example]
#include
"suo.h"
void WriteExtbusFunc(SuoHandle handle, unsigned long addr, int accessSize, const unsigned char data[]);
SuoHandle hExtbus1;
void func1(void)
{
.........
SuoSetWriteExtbusCallback(hExtbus1, WriteExtbusFunc);
/* Set write-external-bus function */
}
/* Write-external-bus function */
void WriteExtbusFunc(SuoHandle handle, unsigned long addr, int accessSize, const unsigned char data[])
{
.........
}
R20UT2867EJ0100 Rev.1.00
Feb 01, 2014
Page 517 of 572
CubeSuite+ V2.02.00
B.4.6
APPENDIX B USER OPEN INTERFACE
Serial interface functions
The serial interface functions that are supplied by Simulator GUI are as follows:
Function Name
Outline of Function
SuoCreateSerialUART
Generates serial interface (UART type).
SuoCreateSerialCSI
Generates serial interface (CSI type).
SuoGetSerialHandle
Acquires serial interface handle.
SuoSetSerialParameterUART
Sets serial parameter (UART type).
SuoSetSerialParameterCSI
Sets serial parameter (CSI type).
SuoGetSerialParameterUART
Acquires serial parameter (UART type).
SuoGetSerialParameterCSI
Acquires serial parameter (CSI type).
SuoSendSerialData
Performs serial transmission (1 data).
SuoSendSerialDataList
Performs serial transmission (more than one data).
SuoSendSerialFile
Performs serial transmission (serial transmission data file).
SuoSetNotifySentSerialCallback
Registers serial transmission end notification callback.
SuoSetReceiveSerialCallback
Registers serial reception callback.
R20UT2867EJ0100 Rev.1.00
Feb 01, 2014
Page 518 of 572
CubeSuite+ V2.02.00
APPENDIX B USER OPEN INTERFACE
SuoCreateSerialUART
Generates serial interface (UART type).
Caution
This function can only be called in the MakeUserModel function. An error occurs if it is called at any
other timing.
[Syntax]
#include
"suo.h"
int
SuoCreateSerialUART(const char* serialName, const char* pinNameTXD, const char*
pinNameRXD, SuoHandle* handle);
[Argument(s)]
Argument
Description
serialName
Name of the serial
pinNameTXD
Name of the transmit data pin used by the serial
pinNameRXD
Name of the receive data pin used by the serial
handle
Location where the handle of the serial interface is to be stored
[Return value]
Macro
Description
SUO_NOERROR
Normal completion
Error number
Exit with error (abend) (see "B.4.8 Error numbers")
[Description]
- This function is used to generate a serial interface (UART type).
- The generated serial interface is associated with the name specified for serialName. In addition, pins specified as
pinNameTXD and pinNameRXD are also generated.
- If this function is successful, the handle of the generated serial interface can be obtained. The serial interface can
then be controlled by specifying this handle.
The handle can also be obtained by using the SuoGetSerialHandle function.
R20UT2867EJ0100 Rev.1.00
Feb 01, 2014
Page 519 of 572
CubeSuite+ V2.02.00
APPENDIX B USER OPEN INTERFACE
[Example]
#include
"suo.h"
SuoHandle hUart1;
SuoUserEntry void MakeUserModel(const char *option)
{
.........
SuoCreateSerialUART("UART1", "TXD1", "RXD1", &hUart1);
/* Create "UART1" */
}
R20UT2867EJ0100 Rev.1.00
Feb 01, 2014
Page 520 of 572
CubeSuite+ V2.02.00
APPENDIX B USER OPEN INTERFACE
SuoCreateSerialCSI
Generates serial interface (CSI type).
Caution
This function can only be called in the MakeUserModel function. An error occurs if it is called at any
other timing.
[Syntax]
#include
"suo.h"
int
SuoCreateSerialCSI(const char* serialName, const char* pinNameSO, const char*
pinNameSI, const char* pinNameSCK, SuoHandle* handle);
[Argument(s)]
Argument
Description
serialName
Name of the serial
pinNameSO
Name of the transmit data pin used by the serial
pinNameSI
Name of the receive data pin used by the serial
pinNameSCK
Name of the clock pin used by the serial
handle
Location where the handle of the serial interface is to be stored
[Return value]
Macro
Description
SUO_NOERROR
Normal completion
Error number
Exit with error (abend) (see "B.4.8 Error numbers")
[Description]
- This function is used to generate a serial interface (CSI type).
- The generated serial interface is associated with the name specified for serialName. In addition, the pins specified
as pinNameSO, pinNameSI, and pinNameSCK are also generated.
- If this function is successful, the handle of the generated serial interface can be obtained. The serial interface can
then be controlled by specifying this handle.
The handle can also be obtained by using the SuoGetSerialHandle function.
R20UT2867EJ0100 Rev.1.00
Feb 01, 2014
Page 521 of 572
CubeSuite+ V2.02.00
APPENDIX B USER OPEN INTERFACE
[Example]
#include
"suo.h"
SuoHandle hCsi1;
SuoUserEntry void MakeUserModel(const char *option)
{
.........
SuoCreateSerialCSI("CSI1", "SO1", "SI1", "SCK1", &hCsi1);
/* Create "CSI1" */
}
R20UT2867EJ0100 Rev.1.00
Feb 01, 2014
Page 522 of 572
CubeSuite+ V2.02.00
APPENDIX B USER OPEN INTERFACE
SuoGetSerialHandle
Acquires serial interface handle.
[Syntax]
#include
"suo.h"
SuoHandle
SuoGetSerialHandle(const char* serialName);
[Argument(s)]
Argument
serialName
Description
Name of the serial
[Return value]
Macro
Description
Handle of the specified
Normal completion
serial interface
NULL
Exit with error (abend)
[Description]
- This function is used to obtain the handle of the specified serial interface.
- Specify the name specified by the SuoCreateSerialUART or SuoCreateSerialCSI function as serialName (if a different name is specified, NULL is returned).
[Example]
#include
"suo.h"
SuoHandle hSerial1;
void func1(void)
{
.........
hSerial1 = SuoGetSerialHandle("SERIAL1");
/* Get handle of "SERIAL1" */
}
R20UT2867EJ0100 Rev.1.00
Feb 01, 2014
Page 523 of 572
CubeSuite+ V2.02.00
APPENDIX B USER OPEN INTERFACE
SuoSetSerialParameterUART
Sets serial parameter (UART type).
Caution
This function cannot be called in the MakeUserModel function. It can only be called in a callback
function.
[Syntax]
#include
int
"suo.h"
SuoSetSerialParameterUART(SuoHandle handle, const SuoSerialParameterUART* param);
[Argument(s)]
Argument
Description
handle
Handle of the serial interface
param
Location where the parameters of the serial interface (UART type) are to be stored
Specify a pointer to SuoSerialParameterUART structureNote.
Note The configuration of SuoSerialParameterUART structure is as follows:
typedef struct {
unsigned long
baudrate;
/* Baud rate */
int
direction;
/* Transfer direction */
int
dataLength;
/* Data bit length */
int
stopLength;
/* Stop bit length */
int
parity;
/* Parity */
} SuoSerialParameterUART;
Parameter (UART Type)
Value
Description
Baud rate
Baud rate value
Unit: bps
Transfer direction
SUO_MSBFIRST
MSB first
SUO_LSBFIRST
LSB first
Data bit length
1 to 32
-
Stop bit length
1 or 2
-
Parity
SUO_NONEPARITY
No parity
SUO_ZEROPARITY
0 parity
(During transmission: parity 0, During reception: no parity
check)
R20UT2867EJ0100 Rev.1.00
Feb 01, 2014
SUO_ODDPARITY
Odd parity
SUO_EVENPARITY
Even parity
Page 524 of 572
CubeSuite+ V2.02.00
APPENDIX B USER OPEN INTERFACE
[Return value]
Macro
Description
SUO_NOERROR
Normal completion
Error number
Exit with error (abend) (see "B.4.8 Error numbers")
[Description]
- This function is used to set parameters (UART type) related to the serial operation of the specified serial interface.
The default values of the parameters are as follows:
- Baud rate:
9600 bps
- Transfer direction:
LSB first
- Data bit length:
7 bits
- Stop bit length:
1 bit
- Parity:
None
[Example]
#include
"suo.h"
SuoHandle hUart1;
void func1(void)
{
SuoSerialParameterUART param;
.........
param.baudrate
= 19200;
/* 19200 bps */
param.direction
= SUO_LSBFIRST;
/* LSB First */
param.dataLength = 8;
/* databit 8 bit */
param.stopLength = 1;
/* stopbit 1 bit */
param.parity
/* even parity */
= SUO_EVENPARITY;
SuoSetSerialParameterUART(hUart1, ¶m);
/* Set parameter of UART1 */
}
R20UT2867EJ0100 Rev.1.00
Feb 01, 2014
Page 525 of 572
CubeSuite+ V2.02.00
APPENDIX B USER OPEN INTERFACE
SuoSetSerialParameterCSI
Sets serial parameter (CSI type).
Caution
This function cannot be called in the MakeUserModel function. It can only be called in a callback
function.
[Syntax]
#include
int
"suo.h"
SuoSetSerialParameterCSI(SuoHandle handle, const SuoSerialParameterCSI* param);
[Argument(s)]
Argument
Description
handle
Handle of the serial interface
param
Location where the parameters of the serial interface (CSI type) are to be stored
Specify a pointer to SuoSerialParameterCSI structureNote.
Note The configuration of SuoSerialParameterCSI structure is as follows:
typedef struct {
int
mode;
/* Operation mode */
unsigned long
frequency;
/* Frequency of transfer clock */
int
phase;
/* Phase */
int
direction;
/* Transfer direction */
int
datalength;
/* Data bit length */
} SuoSerialParameterCSI;
Parameter (CSI Type)
Operation mode
Frequency of transfer clock
Value
Description
SUO_MASTER
Master operation
SUO_SLAVE
Slave operation
Frequency
Unit: Hz
Note that "0" cannot be specified if master operation.
Phase
Transfer direction
Data bit length
R20UT2867EJ0100 Rev.1.00
Feb 01, 2014
0
Normal phase
SUO_PRECEDEDATA
Data output first
SUO_REVERSECLOCK
Clock reversal
SUO_PRECEDEDATA |
Specifies both data output first and
SUO_REVERSECLOCK
clock reversal.
SUO_MSBFIRS
MSB first
SUO_LSBFIRST
LSB first
1 to 32
See "Table B-3."
-
Page 526 of 572
CubeSuite+ V2.02.00
APPENDIX B USER OPEN INTERFACE
Table B-3. CSI Phase Types (SuoSetSerialParameterCSI Function)
Value of Phase
Phase
0
SCK
SO
D7
D6
D5
D4
D3
D2
D1
D0
D7
D6
D5
D4
D3
D2
D1
D0
D7
D6
D5
D4
D3
D2
D1
D0
D7
D6
D5
D4
D3
D2
D1
D0
SI input timing
SUO_PRECEDEDATA
SCK
SO
SI input timing
SUO_REVERSECLOCK
SCK
SO
SI input timing
SUO_PRECEDEDATA|
SUO_REVERSECLOCK
SCK
SO
SI input timing
[Return value]
Macro
Description
SUO_NOERROR
Normal completion
Error number
Exit with error (abend) (see "B.4.8 Error numbers")
[Description]
- This function is used to set parameters (CSI type) related to the serial operation of the specified serial interface.
The default values of the parameters are as follows:
- Operation mode :
Slave
- Frequency of transfer clock : 0
- Phase :
Normal phase
- Transfer direction :
MSB first
- Data bit length :
8 bits
- When operating as the master for CSI communication, transmission of dummy data is required for reception
because the CSI is the communication mode that performs transmission/reception in response to the clock output
from the master.
R20UT2867EJ0100 Rev.1.00
Feb 01, 2014
Page 527 of 572
CubeSuite+ V2.02.00
Remark
APPENDIX B USER OPEN INTERFACE
If the CSI pin waveform is checked in the Timing Chart window while CSI communication is not performed,
an unexpected level will be monitored.
The expected level will be output after communication starts, so this issue does not affect the actual operation.
- SCK pin (in slave mode) : High level is output (which should be high impedance).
- SO pin :
High level is output (which should be low level).
[Example]
#include
"suo.h"
SuoHandle hCsi1;
void func1(void)
{
SuoSerialParameterCSI param;
.........
param.mode
= SUO_SLAVE;
/* slave */
param.frequency
= 1000000;
/* 1MHz */
param.phase
= 0;
/* normal */
param.direction
= SUO_LSBFIRST;
/* LSB First */
param.dataLength
= 8;
/* databit 8bit */
SuoSetSerialParameterCSI(hCsi1, ¶m);
/* Set parameter of CSI1 */
}
R20UT2867EJ0100 Rev.1.00
Feb 01, 2014
Page 528 of 572
CubeSuite+ V2.02.00
APPENDIX B USER OPEN INTERFACE
SuoGetSerialParameterUART
Acquires serial parameter (UART type).
Caution
This function cannot be called in the MakeUserModel function. It can only be called in a callback
function.
[Syntax]
#include
int
"suo.h"
SuoGetSerialParameterUART(SuoHandle handle, SuoSerialParameterUART* param);
[Argument(s)]
Argument
Description
handle
Handle of the serial interface
param
Location where the parameters of the serial interface (UART type) are to be stored
Specify a pointer to SuoSerialParameterUART structureNote.
Note For details on SuoSerialParameterUART structure, see the SuoSetSerialParameterUART function.
[Return value]
Macro
Description
SUO_NOERROR
Normal completion
Error number
Exit with error (abend) (see "B.4.8 Error numbers")
[Description]
- This function is used to obtain the parameters (UART type) related to serial operation of the specified serial interface.
[Example]
#include
"suo.h"
SuoHandle hUart1;
void func1(void)
{
SuoSerialParameterUART param;
.........
SuoGetSerialParameterUART(hUart1, ¶m);
/* Get parameter of UART1 */
.........
}
R20UT2867EJ0100 Rev.1.00
Feb 01, 2014
Page 529 of 572
CubeSuite+ V2.02.00
APPENDIX B USER OPEN INTERFACE
SuoGetSerialParameterCSI
Acquires serial parameter (CSI type).
Caution
This function cannot be called in the MakeUserModel function. It can only be called in a callback
function.
[Syntax]
#include
int
"suo.h"
SuoGetSerialParameterCSI(SuoHandle handle, SuoSerialParameterCSI* param);
[Argument(s)]
Argument
Description
handle
Handle of the serial interface
param
Location where the parameters of the serial interface (UART type) are to be stored
Specify a pointer to SuoSerialParameterCSI structureNote.
Note For details on SuoSerialParameterCSI structure, see the SuoSetSerialParameterCSI function.
[Return value]
Macro
Description
SUO_NOERROR
Normal completion
Error number
Exit with error (abend) (see "B.4.8 Error numbers")
[Description]
- This function is used to obtain the parameters (CSI type) related to serial operation of the specified serial interface.
[Example]
#include
"suo.h"
SuoHandle hCsi1;
void func1(void)
{
SuoSerialParameterCSI param;
.........
SuoGetSerialParameterCSI(hCsi1, ¶m);
/* Get parameter of CSI1 */
.........
}
R20UT2867EJ0100 Rev.1.00
Feb 01, 2014
Page 530 of 572
CubeSuite+ V2.02.00
APPENDIX B USER OPEN INTERFACE
SuoSendSerialData
Performs serial transmission (1 data).
Cautions 1.
Be sure to use the SuoSendSerialDataList function (for serial transmission of multiple data
units) when executing continuous UART transmission.
2.
If this function is called using NotifySentSerialFunc function (serial transmission completion
report callback function), transmission start is delayed for half the baud rate cycle of UART.
3.
This function cannot be called in the MakeUserModel function. It can only be called in a callback function.
[Syntax]
#include
int
"suo.h"
SuoSendSerialData(SuoHandle handle, unsigned long data);
[Argument(s)]
Argument
Description
handle
Handle of the serial interface
data
Transmit data (1 data)
[Return value]
Macro
Description
SUO_NOERROR
Normal completion
Error number
Exit with error (abend) (see "B.4.8 Error numbers")
[Description]
- This function is used to start transmitting one serial data.
- It takes time to complete transmitting the serial data. If you want to know the timing of transmission completion,
set the transmission end notification function by using the SuoSetNotifySentSerialCallback function.
- If this function is called for a serial interface that is currently transmitting data, an error occurs.
[Example]
#include
"suo.h"
SuoHandle hSerial1;
void func1(void)
{
.........
SuoSendSerialData(hSerial1, 0x80);
/* Send 0x80 */
}
R20UT2867EJ0100 Rev.1.00
Feb 01, 2014
Page 531 of 572
CubeSuite+ V2.02.00
APPENDIX B USER OPEN INTERFACE
SuoSendSerialDataList
Performs serial transmission (more than one data).
Caution
This function cannot be called in the MakeUserModel function. It can only be called in a callback
function.
[Syntax]
#include
int
"suo.h"
SuoSendSerialDataList(SuoHandle handle, long count, unsigned long dataList[]);
[Argument(s)]
Argument
Description
handle
Handle of the serial interface
count
Number of data to be transmitted (1 to 32767)
dataList[]
Transmit data
Specify an array consisting of the number of data to be transmitted.
[Return value]
Macro
Description
SUO_NOERROR
Normal completion
Error number
Exit with error (abend) (see "B.4.8 Error numbers")
[Description]
- This function is used to start transmitting two or more serial data.
- It takes time to complete transmission of the serial data. If you want to know the timing of transmission completion,
set the transmission end notification function by using the SuoSetNotifySentSerialCallback function.
- If this function is called for a serial interface that is currently transmitting data, an error occurs.
[Example]
#include
"suo.h"
SuoHandle hSerial1;
void func1(void)
{
unsigned long dataList[6] = {0x73, 0x65, 0x72, 0x69, 0x61, 0x6c};
.........
SuoSendSerialDataList(hSerial1, 6, dataList);
/* Send dataList */
}
R20UT2867EJ0100 Rev.1.00
Feb 01, 2014
Page 532 of 572
CubeSuite+ V2.02.00
APPENDIX B USER OPEN INTERFACE
SuoSendSerialFile
Performs serial transmission (serial transmission data file).
Caution
This function cannot be called in the MakeUserModel function. It can only be called in a callback
function.
[Syntax]
#include
int
"suo.h"
SuoSendSerialFile(SuoHandle handle, const char* serialFile);
[Argument(s)]
Argument
Description
handle
Handle of the serial interface
serialFile
Name of the serial transmission data file that has been saved after being edited on the Serial window
Note that if serialFile is specified by a relative path, it is treated as relative to the path of the user
model (UserModel.dll).
[Return value]
Macro
Description
SUO_NOERROR
Normal completion
Error number
Exit with error (abend) (see "B.4.8 Error numbers")
[Description]
- This function is used to start transmitting serial data described in a serial transmission data file (*.ser) that has
been saved after being edited on the Serial window.
- It takes time to complete transmission of the serial data. If you want to know the timing of transmission completion,
set the transmission end notification function by using the SuoSetNotifySentSerialCallback function.
- If this function is called for a serial interface that is currently transmitting data, an error occurs.
[Example]
#include
"suo.h"
SuoHandle hSerial1;
void func1(void)
{
.........
SuoSendSerialFile(hSerial1, "foo.ser");
/* Send serial data on "foo.ser" */
}
R20UT2867EJ0100 Rev.1.00
Feb 01, 2014
Page 533 of 572
CubeSuite+ V2.02.00
APPENDIX B USER OPEN INTERFACE
SuoSetNotifySentSerialCallback
Registers serial transmission end notification callback.
[Syntax]
#include
int
"suo.h"
SuoSetNotifySentSerialCallback(SuoHandle handle, SuoNotifySentSerialCallback func);
[Argument(s)]
Argument
Description
handle
Handle of the serial interface
func
Pointer to a user-defined function that performs processing when serial transmission is completed
(see "NotifySentSerialFunc")
[Return value]
Macro
Description
SUO_NOERROR
Normal completion
Error number
Exit with error (abend) (see "B.4.8 Error numbers")
[Description]
- This function is used to register a user-defined function that performs processing when serial transmission is completed.
- The registered function is called when one or more serial data specified to be transmitted have been completely
transmitted.
- If NULL is specified for func, registration is canceled.
R20UT2867EJ0100 Rev.1.00
Feb 01, 2014
Page 534 of 572
CubeSuite+ V2.02.00
APPENDIX B USER OPEN INTERFACE
[Example]
#include
"suo.h"
void NotifySentSerialFunc(SuoHandle handle);
SuoHandle hSerial1;
void func1(void)
{
.........
SuoSetNotifySentSerialCallback(hSerial1, NotifySentSerialFunc);
/* Set notify-sent-serial function */
}
/* Notify-sent-serial function */
void NotifySentSerialFunc(SuoHandle handle)
{
.........
}
R20UT2867EJ0100 Rev.1.00
Feb 01, 2014
Page 535 of 572
CubeSuite+ V2.02.00
APPENDIX B USER OPEN INTERFACE
SuoSetReceiveSerialCallback
Registers serial reception callback.
[Syntax]
#include
int
"suo.h"
SuoSetReceiveSerialCallback(SuoHandle handle, SuoReceiveSerialCallback func);
[Argument(s)]
Argument
Description
handle
Handle of the serial interface
func
Pointer to a user-defined function that performs processing when serial data is received (see
"ReceiveSerialFunc")
[Return value]
Macro
Description
SUO_NOERROR
Normal completion
Error number
Exit with error (abend) (see "B.4.8 Error numbers")
[Description]
- This function is used to register a user-defined function that performs processing when serial data is received.
- The registered function is called when one serial data has been received.
- If NULL is specified for func, registration is canceled.
[Example]
#include
"suo.h"
void ReceiveSerialFunc(SuoHandle handle, unsigned long data, int status);
SuoHandle hSerial1;
void func1(void)
{
.........
SuoSetReceiveSerialCallback(hSerial1, ReceiveSerialFunc);
/* Set receive-serial function */
}
/* Receive-serial function */
void ReceiveSerialFunc(SuoHandle handle, unsigned long data, int status)
{
.........
}
R20UT2867EJ0100 Rev.1.00
Feb 01, 2014
Page 536 of 572
CubeSuite+ V2.02.00
B.4.7
APPENDIX B USER OPEN INTERFACE
Signal output unit interface functions
The signal output unit interface functions that are supplied by Simulator GUI are as follows:
Function Name
Outline of Function
SuoCreateWave
Generates signal output unit interface.
SuoGetWaveHandle
Acquires signal output unit interface handle.
SuoSendWaveFile
Performs transmission via signal output unit.
SuoSetNotifySentWaveCallback
Registers signal output unit transmission end notification callback.
R20UT2867EJ0100 Rev.1.00
Feb 01, 2014
Page 537 of 572
CubeSuite+ V2.02.00
APPENDIX B USER OPEN INTERFACE
SuoCreateWave
Generates signal output unit interface.
Caution
This function can only be called in the MakeUserModel function. An error occurs if it is called at any
other timing.
[Syntax]
#include
int
"suo.h"
SuoCreateWave(const char* waveName, int count, const char* pinNameList[], SuoHandle* handle);
[Argument(s)]
Argument
Description
waveName
Name of the signal output unit
count
Number of pins used by the signal output unit
pinNameList[]
Names of the pins used by the signal output unit
Specify names in an array equivalent to the number of pins.
handle
Location where the handle of the signal output unit interface is to be stored
[Return value]
Macro
Description
SUO_NOERROR
Normal completion
Error number
Exit with error (abend) (see "B.4.8 Error numbers")
[Description]
- This function is used to generate a signal output unit interface.
- The generated signal output unit interface is associated with the name specified for waveName. In addition, the
pins specified by count and pinNameList are also generated.
- If this function is successful, the handle of the generated signal output unit interface can be obtained. The signal
output unit interface can then be controlled by specifying this handle.
The handle can also be obtained by using the SuoGetWaveHandle function.
R20UT2867EJ0100 Rev.1.00
Feb 01, 2014
Page 538 of 572
CubeSuite+ V2.02.00
APPENDIX B USER OPEN INTERFACE
[Example]
#include
"suo.h"
SuoHandle hWave1;
SuoUserEntry void MakeUserModel(const char *option)
{
.........
char* pinNameList[4] = {"P00", "P01", "P02", "P03"};
SuoCreateWave("WAVE1", 4, pinNameList, &hWave1);
/* Create "WAVE1" */
}
R20UT2867EJ0100 Rev.1.00
Feb 01, 2014
Page 539 of 572
CubeSuite+ V2.02.00
APPENDIX B USER OPEN INTERFACE
SuoGetWaveHandle
Acquires signal output unit interface handle.
[Syntax]
#include
"suo.h"
SuoHandle
SuoGetWaveHandle(const char* waveName);
[Argument(s)]
Argument
waveName
Description
Name of the signal output unit
[Return value]
Macro
Description
Handle of the signal out-
Normal completion
put unit interface
NULL
Exit with error (abend)
[Description]
- This function is used to obtain the handle of the specified signal output unit interface.
- Specify the name specified by the SuoCreateWave function as waveName (if a different name is specified, NULL
is returned).
[Example]
#include
"suo.h"
SuoHandle hWave1;
void func1(void)
{
.........
hWave1 = SuoGetWaveHandle("WAVE1");
/* Get handle of "WAVE1" */
}
R20UT2867EJ0100 Rev.1.00
Feb 01, 2014
Page 540 of 572
CubeSuite+ V2.02.00
APPENDIX B USER OPEN INTERFACE
SuoSendWaveFile
Performs transmission via signal output unit.
Caution
This function cannot be called in the MakeUserModel function. It can only be called in a callback
function.
[Syntax]
#include
int
"suo.h"
SuoSendWaveFile(SuoHandle handle, const char* waveFile);
[Argument(s)]
Argument
Description
handle
Handle of the signal output unit interface
waveFile
Name of the signal data file that has been saved after being edited on the Signal Data Editor window
Note that if waveFile is specified by a relative path, it is treated as relative to the path of the user
model (UserModel.dll).
[Return value]
Macro
Description
SUO_NOERROR
Normal completion
Error number
Exit with error (abend) (see "B.4.8 Error numbers")
[Description]
- This function is used to start transmitting a signal value whose timing is described in a signal data file (*.wvi) that
has been saved after being edited on the Signal Data Editor window.
- It takes time to complete transmitting the signal data file. If you want to know the timing of transmission completion,
set the transmission end notification function by using the SuoSetNotifySentWaveCallback function.
- If this function is called for a signal output unit interface that is currently transmitting data, the data being transmitted is canceled and the newly specified data is transmitted.
[Example]
#include
"suo.h"
SuoHandle hWave1;
void func1(void)
{
.........
SuoSendWaveFile(hSerial1, "foo.wvi");
/* Send pin data on "foo.wvi" */
}
R20UT2867EJ0100 Rev.1.00
Feb 01, 2014
Page 541 of 572
CubeSuite+ V2.02.00
APPENDIX B USER OPEN INTERFACE
SuoSetNotifySentWaveCallback
Registers signal output unit transmission end notification callback.
[Syntax]
#include
int
"suo.h"
SuoSetNotifySentWaveCallback(SuoHandle handle, SuoNotifySentWaveCallback func);
[Argument(s)]
Argument
Description
handle
Handle of the signal output unit interface
func
Pointer to a user-defined function that performs processing when transmission by the signal output
unit is completed (see "NotifySentWaveFunc")
[Return value]
Macro
Description
SUO_NOERROR
Normal completion
Error number
Exit with error (abend) (see "B.4.8 Error numbers")
[Description]
- This function is used to register a user function that performs processing when transmission by the signal output
unit is completed.
- The registered function is called when all signal data specified to be transmitted have been completely transmitted.
- If NULL is specified for func, registration is canceled.
[Example]
#include
"suo.h"
void NotifySentWaveFunc(SuoHandle handle);
SuoHandle hWave1;
void func1(void)
{
.........
SuoSetNotifySentWaveCallback(hWave1, NotifySentWaveFunc);
/* Set notify-sent-wave function */
}
/* Notify-sent-wave function */
void NotifySentWaveFunc(SuoHandle handle)
{
.........
}
R20UT2867EJ0100 Rev.1.00
Feb 01, 2014
Page 542 of 572
CubeSuite+ V2.02.00
B.4.8
APPENDIX B USER OPEN INTERFACE
Error numbers
The meanings of error numbers (macro names) that are returned from the supplied interface function as return values
are as follows:
Note that an error number is indicated by a macro name defined by the supplied header file (suo.h).
Table B-4. List of Error Numbers (Macro Names)
Error number (Macro Name)
Description
SUO_NOERROR
Normal completion
SUO_CANTALLOC
Memory cannot be allocated.
SUO_ILLIFNAME
The interface name is not correct.
NULL or "" is specified for the interface name. Or, an interface name that has not been generated is specified for a handle acquisition function.
SUO_ILLHANDLE
The handle is not correct.
A handle other than that of the generated interface is specified.
SUO_ILLPARAM
The argument (parameter) is not correct.
A value other than those that can be specified is specified as a argument (parameter).
SUO_CANTCALL
The function cannot be called.
A function that can be called only by the MakeUserModel function is called by another function. Or, a function that can be called by a function other than the MakeUserModel function is
called by the MakeUserModel function.
SUO_CONFLICTRES
The resources to be generated conflict.
Two or more names that are the same as an interface name or pin name generated in the
MakeUserModel function exist.
SUO_ILLFILENAME
The file name is not correct.
NULL or a name including an invalid character is specified for a file name.
SUO_CANTOPENFILE
The signal data file cannot be opened.
The signal data file does not exist, or is not permitted to be read.
SUO_ILLFILEFMT
[Serial transmission data file]
The file cannot be opened.
The file does not exist, is not permitted to be read, or the file name is not correct.
[Signal data file]
The file format is not correct.
NULL or a name including an invalid character is specified for a file name.
SUO_ILLFILECONT
The file contents are not correct.
The contents of data described in the file include a contradiction, or no data exists in the file.
SUO_ILLPINNAME
The pin name is not correct.
NULL or "" is specified for the pin name.
SUO_ILLADDRRANGE
The address range is not correct.
The address range is not valid.
SUO_UNDERSENDING
Already being transmitted.
New transmission cannot be started because transmission is in progress.
R20UT2867EJ0100 Rev.1.00
Feb 01, 2014
Page 543 of 572
CubeSuite+ V2.02.00
B.5
APPENDIX B USER OPEN INTERFACE
User-Defined Functions
This section describes the user-defined functions that user creates.
The user-defined functions are listed below.
Table B-5. List of User-Defined Functions
Function Name
Outline of Function
MakeUserModel
MakeUserModel entry function
InitFunc
Initialization callback function
ResetFunc
Reset callback function
NotifyTimerFunc
Timer time notification callback function
InputDigitalPinFunc
Digital pin input value callback function
InputAnalogPinFunc
Analog pin input value callback function
InputHighImpedanceFunc
Pin high-impedance state report callback function
ReadExtbusFunc
External bus read access callback function
WriteExtbusFunc
External bus write access callback function
NotifySentSerialFunc
Serial interface transmission end notification callback function
ReceiveSerialFunc
Serial interface reception callback function
NotifySentWaveFunc
Serial interface reception callback function
R20UT2867EJ0100 Rev.1.00
Feb 01, 2014
Page 544 of 572
CubeSuite+ V2.02.00
APPENDIX B USER OPEN INTERFACE
MakeUserModel
Creates the resources to be used as the entry function of the user model.
Caution
Because MakeUserModel is a static entry function of the user model, this function name must be
used.
[Syntax]
#include
"suo.h"
SuoUserEntry
void MakeUserModel(const char *option);
[Argument(s)]
Argument
option
Description
Option character string specified in the simulator configuration file
Note that if no option is specified in the simulator configuration file, NULL character (" ") is
assumed.
[Return value]
None
[Description]
- This function must be used to generate the resources to be used with the user model. Any function other than this
function cannot generate the resources.
- This function must be used to register a callback function as necessary. In particular, an initialization callback
function must be registered by this function (because the initialization timing has passed even if a function is registered by a function other than this function).
R20UT2867EJ0100 Rev.1.00
Feb 01, 2014
Page 545 of 572
CubeSuite+ V2.02.00
APPENDIX B USER OPEN INTERFACE
[Example]
#include
"suo.h"
SuoHandle hTim1;
SuoHandle hPinP00;
SuoHandle hExtbus1;
void InitFunc(void);
void ResetFunc(void);
SuoUserEntry void MakeUserModel(const char *option)
{
/* Create source */
SuoCreateTimer("TIM1", &hTim1);
/* Create "TIM1" */
SuoCreatePin("P00", &hPinP00);
/* Create "P00" */
SuoCreateExtbus("EXTBUS1", 0x200000, 0x1000, &hExtbus1);
/* Create "EXTBUS1" */
/* Set callbacks */
SuoSetInitCallback(InitFunc);
/* Set initialize function */
SuoSetResetCallback(ResetFunc);
/* Set reset function */
}
R20UT2867EJ0100 Rev.1.00
Feb 01, 2014
Page 546 of 572
CubeSuite+ V2.02.00
APPENDIX B USER OPEN INTERFACE
InitFunc
Performs the initialization processing as a callback function.
Caution
InitFunc is a place holder for a user-defined function name, so this function name does not have to
be used.
[Syntax]
#include
void
"suo.h"
InitFunc (void);
[Argument(s)]
None
[Return value]
None
[Description]
- InitFunc describes initialization processing.
- Use the SuoSetInitCallback function to register InitFunc as a callback function.
R20UT2867EJ0100 Rev.1.00
Feb 01, 2014
Page 547 of 572
CubeSuite+ V2.02.00
APPENDIX B USER OPEN INTERFACE
ResetFunc
Performs the reset processing as a callback function.
Caution
ResetFunc is a place holder for a user-defined function name, so this function name does not have
to be used.
[Syntax]
#include
void
"suo.h"
ResetFunc (void);
[Argument(s)]
None
[Return value]
None
[Description]
- ResetFunc describes the reset processing.
- Use the SuoSetResetCallback function to register ResetFunc as a callback function.
R20UT2867EJ0100 Rev.1.00
Feb 01, 2014
Page 548 of 572
CubeSuite+ V2.02.00
APPENDIX B USER OPEN INTERFACE
NotifyTimerFunc
Performs the processing when the timer time is reported, as a callback function.
Caution
NotifyTimerFunc is a place holder for a user-defined function name, so this function name does not
have to be used.
[Syntax]
#include
void
"suo.h"
NotifyTimerFunc (SuoHandle handle);
[Argument(s)]
Argument
handle
Description
Handle of the timer interface
[Return value]
None
[Description]
- NotifyTimerFunc describes the processing when the timer time is reported.
- Use the SuoSetNotifyTimerCallback function to register NotifyTimerFunc as a callback function.
R20UT2867EJ0100 Rev.1.00
Feb 01, 2014
Page 549 of 572
CubeSuite+ V2.02.00
APPENDIX B USER OPEN INTERFACE
InputDigitalPinFunc
Performs the digital pin input processing, as a callback function.
Caution
InputDigitalPinFunc is a place holder for a user-defined function name, so this function name does
not have to be used.
[Syntax]
#include
void
"suo.h"
InputDigitalPinFunc (SuoHandle handle, int pinValue);
[Argument(s)]
Argument
Description
handle
Handle of the pin interface
pinValue
Digital input value (specify any of the following)
- SUO_HIGH (=1):
HIGH value
- SUO_LOW (=0):
LOW value
[Return value]
None
[Description]
- InputDigitalPinFunc describes the digital pin input processing.
- Use the SuoSetInputDigitalPinCallback function to register InputDigitalPinFunc as a callback function.
R20UT2867EJ0100 Rev.1.00
Feb 01, 2014
Page 550 of 572
CubeSuite+ V2.02.00
APPENDIX B USER OPEN INTERFACE
InputAnalogPinFunc
Performs the analog pin input processing, as a callback function.
Caution
InputAnalogPinFunc is a place holder for a user-defined function name, so this function name does
not have to be used.
[Syntax]
#include
void
"suo.h"
InputAnalogPinFunc (SuoHandle handle, double pinValue);
[Argument(s)]
Argument
Description
handle
Handle of the pin interface
pinValue
Value (analog value) input to the pin (unit: V)
[Return value]
None
[Description]
- InputAnalogPinFunc describes the analog pin input processing.
- Use the SuoSetInputAnalogPinCallback function to register InputAnalogPinFunc as a callback function.
R20UT2867EJ0100 Rev.1.00
Feb 01, 2014
Page 551 of 572
CubeSuite+ V2.02.00
APPENDIX B USER OPEN INTERFACE
InputHighImpedanceFunc
Performs the processing when all the pins connected to digital/analog pins enter the high-impedance state, as a callback function.
Caution
InputHighImpedanceFunc is a place holder for a user-defined function name, so this function name
does not have to be used.
[Syntax]
#include
void
"suo.h"
InputHighImpedanceFunc (SuoHandle handle);
[Argument(s)]
Argument
handle
Description
Handle of the pin interface
[Return value]
None
[Description]
- InputHighImpedanceFunc is used to describe the processing when all the pins connected to digital/analog pins
enter the high-impedance state.
- Use the SuoSetInputHighImpedanceCallback function to register InputHighImpedanceFunc as a callback function.
R20UT2867EJ0100 Rev.1.00
Feb 01, 2014
Page 552 of 572
CubeSuite+ V2.02.00
APPENDIX B USER OPEN INTERFACE
ReadExtbusFunc
Performs the read access processing of an external bus, as a callback function.
Caution
ReadExtbusFunc is a place holder for a user-defined function name, so this function name does not
have to be used.
[Syntax]
#include
void
"suo.h"
ReadExtbusFunc (SuoHandle handle, unsigned long addr, int accessSize, unsigned char data[]);
[Argument(s)]
Argument
Description
handle
Handle of the external bus interface
addr
Address
accessSize
Access size
data[]
Data storage area
As many data as the access size must be stored.
[Return value]
None
[Description]
- ReadExtbusFunc describes the read access processing of an external bus.
- Data must be stored in data[].
- Use the SuoSetReadExtbusCallback function to register ReadExtbusFunc as a callback function.
R20UT2867EJ0100 Rev.1.00
Feb 01, 2014
Page 553 of 572
CubeSuite+ V2.02.00
APPENDIX B USER OPEN INTERFACE
WriteExtbusFunc
Performs the write access processing of an external bus, as a callback function.
Caution
WriteExtbusFunc is a place holder for a user-defined function name, so this function name does not
have to be used.
[Syntax]
#include
"suo.h"
void
WriteExtbusFunc (SuoHandle handle, unsigned long addr, int accessSize, const unsigned char
data[]);
[Argument(s)]
Argument
Description
handle
Handle of the external bus interface
addr
Address
accessSize
Access size
data[]
Data storage area
As many data as the access size must be stored.
[Return value]
None
[Description]
- WriteExtbusFunc describes the write access processing of an external bus.
- Use the SuoSetWriteExtbusCallback function to register WriteExtbusFunc as a callback function.
R20UT2867EJ0100 Rev.1.00
Feb 01, 2014
Page 554 of 572
CubeSuite+ V2.02.00
APPENDIX B USER OPEN INTERFACE
NotifySentSerialFunc
Performs the processing when transmission by a serial interface has been completed, as a callback function.
Caution
NotifySentSerialFunc is a place holder for a user-defined function name, so this function name does
not have to be used.
[Syntax]
#include
void
"suo.h"
NotifySentSerialFunc (SuoHandle handle);
[Argument(s)]
Argument
handle
Description
Handle of the serial interface
[Return value]
None
[Description]
- NotifySentSerialFunc describes the processing when transmission by a serial interface has been completed.
- Use the SuoSetNotifySentSerialCallback function to register NotifySentSerialFunc as a callback function.
R20UT2867EJ0100 Rev.1.00
Feb 01, 2014
Page 555 of 572
CubeSuite+ V2.02.00
APPENDIX B USER OPEN INTERFACE
ReceiveSerialFunc
Performs the processing during reception by a serial interface, as a callback function.
Caution
ReceiveSerialFunc is a place holder for a user-defined function name, so this function name does
not have to be used.
[Syntax]
#include
void
"suo.h"
ReceiveSerialFunc (SuoHandle handle, unsigned long data, int status);
[Argument(s)]
Argument
Description
handle
Handle of the serial interface
data
Received serial data
status
Receive status (specify any of the following)
-0:
Normal reception
- SUO_PARITYERR :
Parity error (if parity bit does not match)
- SUO_FRAMINGERR :
Framing error (if stop bit is not detected)
[Return value]
None
[Description]
- ReceiveSerialFunc describes the processing during reception by a serial interface.
- Use the SuoSetReceiveSerialCallback function to register ReceiveSerialFunc as a callback function.
R20UT2867EJ0100 Rev.1.00
Feb 01, 2014
Page 556 of 572
CubeSuite+ V2.02.00
APPENDIX B USER OPEN INTERFACE
NotifySentWaveFunc
Performs the processing to be performed when transmission by a signal output unit has been completed, as a callback
function.
Caution
NotifySentWaveFunc is a place holder for a user-defined function name, so this function name does
not have to be used.
[Syntax]
#include
void
"suo.h"
NotifySentWaveFunc (SuoHandle handle);
[Argument(s)]
Argument
handle
Description
Handle of the signal output unit interface
[Return value]
None
[Description]
- NotifySentWaveFunc describes the processing to be performed when transmission by a signal output unit has
been completed.
- Use the SuoSetNotifySentWaveCallback function to register NotifySentWaveFunc as a callback function.
R20UT2867EJ0100 Rev.1.00
Feb 01, 2014
Page 557 of 572
CubeSuite+ V2.02.00
B.6
APPENDIX B USER OPEN INTERFACE
Sample Program (Timer Model)
This section describes a sample program (timer model) of a user model created by using the Simulator GUI's user open
interface.
B.6.1
Overview
Timer model is a sample program using a timer interface.
It outputs a value to a pin at fixed time intervals.
B.6.2
Configuration
The timer model generates the PIN pin and TIM timer.
The generated PIN pin is connected to the PDH pin of the CPU.
Figure B-5. Timer Model Configuration
PDH
CPU
PIN
Timer model
TIM
B.6.3
Operation
The timer model calculates a predetermined time by using the timer interface, and alternately outputs a low level
and a high level to the PDH pin.
The output value and output time are as shown below.
Figure B-6. Timer Model Operation
1000
4000
2000
2000
40000
1000
2000
2000
(Repeat)
RESET
B.6.4
Project file
The following table shows the setting information of the Visual C++ project file of the Timer model.
Table B-6. Setting Information of Timer Model
Information
Description
Project type
Win32 Dynamic-Link Library
Source file
suolink.c, uo_timer.c
Path of include file
Folder storing suo.h
R20UT2867EJ0100 Rev.1.00
Feb 01, 2014
Page 558 of 572
CubeSuite+ V2.02.00
B.6.5
APPENDIX B USER OPEN INTERFACE
Details of program
The following shows the sample programs of the timer model.
(1)Source file of timer model (uo_timer.c)
(2)Simulator configuration file (smplus.cfg)
(3)Source file of target program (lm_timer.c)
(1) Source file of timer model (uo_timer.c)
#include <windows.h>
#include "suo.h"
/* Handle */
SuoHandle hTIM;
SuoHandle hPIN;
/* Wave-Table */
#define MAXWAVE 8
struct _WaveTable {
unsigned longtime;
/* Wait Time [usec] */
int pinValue;
/* Pin Value (SUO_HIGH or SUO_LOW) */
} waveTable[MAXWAVE] = {
1000, SUO_HIGH,
4000, SUO_LOW,
2000, SUO_HIGH,
2000, SUO_LOW,
4000, SUO_HIGH,
1000, SUO_LOW,
2000, SUO_HIGH,
2000, SUO_LOW
};
int waveIndex;
/* Declare */
void Reset(void);
void NotifyTimer(SuoHandle handle);
void puterr(int error);
/* MakeUserModel */
void SuoUserEntry MakeUserModel(const char *option)
{
int error;
/* Create interface */
if((error = SuoCreateTimer("TIM", &hTIM)) != SUO_NOERROR){
puterr(error);
return;
}
R20UT2867EJ0100 Rev.1.00
Feb 01, 2014
Page 559 of 572
CubeSuite+ V2.02.00
APPENDIX B USER OPEN INTERFACE
if((error = SuoCreatePin("PIN", &hPIN)) != SUO_NOERROR){
puterr(error);
return;
}
/* Set callback */
SuoSetResetCallback(Reset);
SuoSetNotifyTimerCallback(hTIM, NotifyTimer);
}
/* Reset callback */
void Reset(void)
{
int error;
/* Initialize Wave-Tabel index */
waveIndex = 0;
/* Output LOW(initial value) to PIN */
if((error = SuoOutputDigitalPin(hPIN, SUO_LOW)) != SUO_NOERROR){
puterr(error);
return;
}
/* Set wait time */
if((error = SuoSetTimer(hTIM, SUO_USEC, waveTable[waveIndex].time)) != SUO_NOERROR){
puterr(error);
return;
}
}
/* NotifyTimer callback */
void NotifyTimer(SuoHandle handle)
{
int error;
/* Output value to PIN */
if((error = SuoOutputDigitalPin(hPIN, waveTable[waveIndex].pinValue)) != SUO_NOERROR){
puterr(error);
return;
}
/* Set next Wave-Tabel index */
waveIndex++;
if(waveIndex >= MAXWAVE){
waveIndex = 0;
}
R20UT2867EJ0100 Rev.1.00
Feb 01, 2014
Page 560 of 572
CubeSuite+ V2.02.00
APPENDIX B USER OPEN INTERFACE
/* Set wait time */
if((error = SuoSetTimer(hTIM, SUO_USEC, waveTable[waveIndex].time)) != SUO_NOERROR){
puterr(error);
return;
}
}
/* Report error */
void puterr(int error)
{
char message[80];
wsprintf(message, "The user open interface error (0x%04x) occurred.", error);
MessageBox(NULL, message, "ERROR", MB_OK|MB_ICONERROR);
}
(2) Simulator configuration file (smplus.cfg)
cpu = CPU('a');
#========================================================================
# UO_TIMER description (CPU=uPD70F3261Y)
#========================================================================
#---- Create UserOpen --------------------------------------------------uo_timer = Device("USEROPEN", "Release\uo_timer.dll");
#---- Pseudo Pin connection --------------------------------------------wire_clock =
Wire(1);
wire_clock += cpu.DebuggerPseudoPort("debugger_pseudo_pin_main_clkout");
wire_clock += uo_timer.Port("gui_pseudo_pin_clock_notice");
wire_reset =
Wire(1);
wire_reset += cpu.DebuggerPseudoPort("debugger_pseudo_pin_reset_notice");
wire_reset += uo_timer.Port("gui_pseudo_pin_reset_notice");
#---- PIN connection ----------------------------# UO_TIMER.PIN <--> CPU.PDH0
wire_PIN =
Wire(1);
wire_PIN += uo_timer.Port("PIN");
wire_PIN += cpu.Port("PDH0");
R20UT2867EJ0100 Rev.1.00
Feb 01, 2014
Page 561 of 572
CubeSuite+ V2.02.00
APPENDIX B USER OPEN INTERFACE
(3) Source file of target program (lm_timer.c)
/* Target Program for UO_TIMER */
#pragma ioreg
void main( )
{
unsigned char value;
PMDH.0 = 1;
/* set port-input mode */
PMDH.1 = 0;
/* set port-output mode */
while( 1 ){
value = PDH.0;
/* input signal from "PDH0" */
PDH.1 = value;
/* output signal to "PDH1" */
}
}
R20UT2867EJ0100 Rev.1.00
Feb 01, 2014
Page 562 of 572
CubeSuite+ V2.02.00
APPENDIX C INDEX
APPENDIX C INDEX
Collect execution history when the condition is met
A
... 130
Access to variables ... 90
Action event ... 149, 302, 306, 307
Configure the trace operation ... 123
Action Events dialog box ... 320
Display collected execution history ... 133
Save the contents of execution history ... 140
[Printf event] tab ... 322
Search the trace data ... 135
Address Offset Settings dialog box ... 331
Address range ... 314
Column Number Settings dialog box ... 330
Analog Button Properties dialog box ... 431
Combination Condition dialog box ... 348
Array ... 272, 278
Configuration ... 48
Auto variables ... 272
Configure the trace operation ... 123
Connect to/disconnect from debug tool ... 52
B
Control register ... 107, 260
Basic interface functions ... 491
Coverage Measurement ... 146
SuoGetMainClock ... 494
Configure the coverage measurement ... 146
SuoSetInitCallback ... 492
Display the coverage measurement result ... 147
SuoSetResetCallback ... 493
CPU Register panel ... 260
Binary data file ... 61
Current PC mark ... 252
Bookmark ... 71
Current PC position ... 226, 252
Bookmarks dialog box ... 328
Customize dialog box ... 399
Break ... 32, 39, 45, 50
Break cause ... 294
D
Break event ... 88
Data flash emulation function ... 24
Breakpoint ... 86
Data flash memory ... 241
Built-in event ... 306, 307
Data Save dialog box ... 364
Debug information ... 217
C
Debug toolbar ... 179
Call stack information ... 288
Delete a break event ... 90
Call Stack panel ... 288
Detail dialog box (for access events) ... 354
Callback function ... 478
Detail dialog box (for execution events) ... 350
Clock ... 16, 28, 35, 47
Disassemble display mode ... 134, 295
Code ... 253
Disassemble panel ... 250
Collect execution history of programs ... 123
Disassembled text ... 72, 250
Clear the trace memory ... 135
Collect execution history from the start to stop of the
execution ... 126
Collect execution history in the arbitrary section
... 126
Display and change programs ... 64
Display source files ... 64
Display the result of disassembling ... 72
Perform line assembly ... 76
Display format of watch-expression ... 281
Display information on function call from stack ... 121
R20UT2867EJ0100 Rev.1.00
Feb 01, 2014
Page 563 of 572
CubeSuite+ V2.02.00
APPENDIX C INDEX
Display call stack information ... 121
Font ... 370
Save the contents of call stack information ... 122
Forced break function ... 83
Display/change the memory, register and variable ... 97
Display/change
global
variables/static
variables
Format (CSI) dialog box ... 473
Format (UART) dialog box ... 471
... 112
Display/change local variables ... 112
G
Display/change the CPU register ... 107
General-purpose register ... 107, 260
Display/change the memory ... 97
Global variable ... 112
Display/change the SFR ... 109
Go to Here ... 80
Display/change watch-expression ... 114
Go to Line dialog box ... 362
DMA ... 296
Go to the Location dialog box ... 363
DMM function ... 101
Download ... 55, 215
Download condition ... 59, 316
Download Files dialog box ... 316
H
Hardware Break ... 84, 85, 300, 301
Hardware break function ... 83
Hook transaction ... 218
E
Hot plug-in ... 30, 37, 53
Editor panel ... 220
Hot plug-in function ... 178
Encoding dialog box ... 325
How to connect to debug tool ... 52
Event area ... 224, 252
How to disconnect from debug tool ... 52
Event mark ... 300
Event type ... 301
Events panel ... 299
Execute programs ... 78
Execute programs ... 78
Execute programs in steps ... 80
Reset microcontroller (CPU) ... 78
External bus interface functions ... 511
SuoCreateExtbus ... 512
SuoGetExtbusHandle ... 514
SuoSetReadExtbusCallback ... 515
SuoSetWriteExtbusCallback ... 516
I
I/O Panel window ... 418
I/O protection area ... 313
InitFunc ... 547
Initial value ... 332
Input format of watch-expression ... 279
InputAnalogPinFunc ... 551
InputDigitalPinFunc ... 550
InputHighImpedanceFunc ... 552
Instruction level debugging ... 64, 220
Interface functions ... 489
Basic interface functions ... 491
F
External bus interface functions ... 511
Fail-safe break function ... 19, 95
Pin interface functions ... 502
Features ... 8
Serial interface functions ... 518
File monitor ... 228
Signal output unit interface functions ... 537
Flash ... 29, 36, 42
Time interface functions ... 495
Flash macro service ... 209
Internal Static variables ... 272
Flash rewrite ... 30, 36, 42
Flash self programming emulation function ... 20, 207
L
Label ... 294
R20UT2867EJ0100 Rev.1.00
Feb 01, 2014
Page 564 of 572
CubeSuite+ V2.02.00
APPENDIX C INDEX
Label name ... 253
Move to ... 69
Line assembly ... 76, 254
Move to the specified address ... 73
Load module file ... 55
Move to the symbol defined location ... 74
Local variable ... 112
Local Variables panel ... 271
N
Loop dialog box ... 408
Normal display mode ... 65
NotifySentSerialFunc ... 555
M
NotifySentWaveFunc ... 557
Macro service error ... 22, 25
NotifyTimerFunc ... 549
Main clock source ... 190
Main window ... 176
O
MakeUserModel ... 545
OCD trace function ... 32
Manage events ... 151
Offset value ... 253, 294
Change the setting state of the event ... 151
Open break function ... 200
Delete events ... 159
Open File dialog box ... 382
Display only particular event types ... 152
Open Option Setting File dialog box ... 389
Edit detailed settings of events ... 153
Open Watch Expression Data File dialog box ... 380
Event types that can be set and deleted during
Operating environment ... 14
execution ... 160
Option dialog box ... 368
Jump to the event address ... 152
[General - Build/Debug] category ... 375
Maximum number of enabled events ... 159
[General - Font and Color] category ... 370
Write comment to events ... 159
Output panel ... 309
Mask for input signal ... 20, 32, 39, 45
Maximum number of enabled events ... 159
Measure Execution Time of the Program ... 142
Measurable time ranges ... 145
Measure execution time from the start to stop of the
execution ... 142
Measure execution time in the arbitrary section
... 142
Measurement of the execution time of the program
... 142
Memory access ... 18, 31, 38, 44, 49
Memory Initialize dialog box ... 332
Memory mapping ... 18, 31, 37, 43, 49
Memory Mapping dialog box ... 312
Memory Search dialog box ... 334
Memory settings ... 17, 49
Memory type ... 313
Menubar ... 176
Mixed display mode ... 65, 134, 295
P
Parts Button Properties dialog box ... 427
Parts Buzzer Properties dialog box ... 455
Parts Key Properties dialog box ... 435
Parts Led Properties dialog box ... 444
Parts Level Gauge Properties dialog box ... 440
Parts List dialog box ... 465
Parts Matrix Led Properties dialog box ... 451
Parts Segment LED Properties dialog box ... 447
Pin interface functions ... 502
SuoCreatePin ... 503
SuoGetPinHandle ... 504
SuoOutputAnalogPin ... 506
SuoOutputDigitalPin ... 505
SuoOutputHighImpedance ... 507
SuoSetInputAnalogPinCallback ... 509
SuoSetInputDigitalPinCallback ... 508
SuoSetInputHighImpedanceCallback ... 510
Point Trace ... 301, 302
R20UT2867EJ0100 Rev.1.00
Feb 01, 2014
Page 565 of 572
CubeSuite+ V2.02.00
APPENDIX C INDEX
Pointer type variable ... 278
Scope specification ... 112
Pointer variables ... 272
Scroll Range Settings dialog box ... 360
Print Address Range Settings dialog box ... 336
Search Data dialog box ... 416
Print Preview window ... 338
Security flag emulation ... 23, 210
Printf ... 301, 302
Security ID ... 193
Printf event ... 149, 322
Select Data Save File dialog box ... 387
Progress Status dialog box ... 367
Select Download File dialog box ... 378
Project Tree panel ... 184
Select Pin dialog box ... 409
Property panel ... 186
Select Simulator Configuration File dialog box. ... 393
[Connect Settings] tab ... 188
Serial interface functions ... 518
[Data Flash Emulation Settings] tab ... 212
SuoCreateSerialCSI ... 521
[Debug Tool Settings] tab ... 196
SuoCreateSerialUART ... 519
[Download File Settings] tab ... 215
SuoGetSerialHandle ... 523
[Flash Self Emulation Eettings] tab ... 207
SuoGetSerialParameterCSI ... 530
[Hook Transaction Settings] tab ... 218
SuoGetSerialParameterUART ... 529
Pull up/Pull down dialog box ... 459
SuoSendSerialData ... 531
SuoSendSerialDataList ... 532
R
SuoSendSerialFile ... 533
RAM monitor function ... 101
SuoSetNotifySentSerialCallback ... 534
Rapid build function ... 75
SuoSetReceiveSerialCallback ... 536
ReadExtbusFunc ... 553
SuoSetSerialParameterCSI ... 526
Read-protected object ... 267
SuoSetSerialParameterUART ... 524
Real-time display update function ... 100
Serial transmission data file ... 467
ReceiveSerialFunc ... 556
Serial window ... 467
Recycle mode ... 66
Set action into the program ... 149
Register bank ... 262
Inset printf ... 149
Register variables ... 272
Set PC to Here ... 80
Registering a watch-expression ... 115
Settable mapping attribute ... 313
Reset ... 78
Setting state of the event ... 152
ResetFunc ... 548
SFR panel ... 265
Return out execution ... 81, 179, 180
Signal Data Editor window ... 401
RRM function ... 100
Signal data file ... 401
Run-Break time ... 142
Signal output unit interface functions ... 537
Run-Break Timer ... 301, 302
SuoCreateWave ... 538
Run-Break Timer event ... 142
SuoGetWaveHandle ... 540
SuoSendWaveFile ... 541
S
Sample program ... 558
Save As dialog box ... 384
Save Option Setting File dialog box ... 391
Save Settings dialog box ... 326
R20UT2867EJ0100 Rev.1.00
Feb 01, 2014
SuoSetNotifySentWaveCallback ... 542
Simulator GUI window ... 395
Smart Analog ... 163, 206
Software Break ... 84, 85, 300, 301
Software break function ... 83
Page 566 of 572
CubeSuite+ V2.02.00
APPENDIX C INDEX
Source display mode ... 134, 295
SuoSetNotifySentWaveCallback ... 542
Source level debugging ... 220
SuoSetNotifyTimerCallback ... 501
Start Tracing ... 301
SuoSetReadExtbusCallback ... 515
Statusbar ... 181
SuoSetReceiveSerialCallback ... 536
Step execution ... 80
SuoSetResetCallback ... 493
Step in execution ... 81, 179, 180
SuoSetSerialParameterCSI ... 526
Step over execution ... 81, 179, 180
SuoSetSerialParameterUART ... 524
Stop programs ... 83
SuoSetTimer ... 498
Access to variables ... 90
SuoSetWriteExtbusCallback ... 516
Manually stop the execution ... 86
Stop at the arbitrary position ... 86
T
Structure ... 272, 278
Tag jump ... 70, 228, 310
Sub clock ... 190
Target board ... 17
Summary ... 8
Targets that can be registered as watch-expressions
SuoCreateExtbus ... 512
... 115
SuoCreatePin ... 503
Text Edit dialog box ... 319
SuoCreateSerialCSI ... 521
Time interface functions ... 495
SuoCreateSerialUART ... 519
SuoCreateTimer ... 496
SuoCreateTimer ... 496
SuoGetTimerHandle ... 497
SuoCreateWave ... 538
SuoKillTimer ... 500
SuoGetExtbusHandle ... 514
SuoSetNotifyTimerCallback ... 501
SuoGetMainClock ... 494
SuoSetTimer ... 498
SuoGetPinHandle ... 504
Timer ... 50
SuoGetSerialHandle ... 523
Timer end ... 301
SuoGetSerialParameterCSI ... 530
Timer Result ... 301, 302
SuoGetSerialParameterUART ... 529
Timer Result event ... 142
SuoGetTimerHandle ... 497
Timer start ... 301
SuoGetWaveHandle ... 540
Timing chart file ... 411
SuoKillTimer ... 500
Timing Chart window ... 411
SuoOutputAnalogPin ... 506
Trace event ... 126
SuoOutputDigitalPin ... 505
Trace frame ... 126
SuoOutputHighImpedance ... 507
Trace memory ... 123, 124, 203
SuoSendSerialData ... 531
Trace number ... 293
SuoSendSerialDataList ... 532
Trace panel ... 292
SuoSendSerialFile ... 533
Trace Search dialog box ... 340
SuoSendWaveFile ... 541
[Instruction Level] tab ... 342
SuoSetInitCallback ... 492
[Source Level] tab ... 345
SuoSetInputAnalogPinCallback ... 509
Trace start ... 301
SuoSetInputDigitalPinCallback ... 508
Trace time tag ... 203
SuoSetInputHighImpedanceCallback ... 510
Type of breakpoint ... 199
SuoSetNotifySentSerialCallback ... 534
R20UT2867EJ0100 Rev.1.00
Feb 01, 2014
Page 567 of 572
CubeSuite+ V2.02.00
APPENDIX C INDEX
U
Unconditional Trace ... 301, 302
Unconditional Trace event ... 126, 152
Union ... 272, 278
Upload ... 55, 62, 63
Use hook function ... 165
Use Smart Analog function ... 163
User model ... 480
User open interface ... 477
User-defined functions ... 544
InitFunc ... 547
InputAnalogPinFunc ... 551
InputDigitalPinFunc ... 550
InputHighImpedanceFunc ... 552
MakeUserModel ... 545
NotifySentSerialFunc ... 555
NotifySentWaveFunc ... 557
NotifyTimerFunc ... 549
ReadExtbusFunc ... 553
ReceiveSerialFunc ... 556
ResetFunc ... 548
WriteExtbusFunc ... 554
W
Watch panel ... 276
Watch-expression ... 114, 276
Window reference ... 173
WriteExtbusFunc ... 554
R20UT2867EJ0100 Rev.1.00
Feb 01, 2014
Page 568 of 572
Revision Record
Description
Rev.
Date
Page
1.00
Feb 01, 2014
-
Summary
First Edition issued
CubeSuite+ V2.02.00 User's Manual:
RL78 Debug
Publication Date: Rev.1.00
Published by:
Feb 01, 2014
Renesas Electronics Corporation
© 2014 Renesas Electronics Corporation and Renesas Solutions Corp.
Colophon 2.0
CubeSuite+ V2.02.00
R20UT2867EJ0100