1
TRACKING PROJECTIONS: EXPERIMENTING IN DYNAMIC
THEATRICAL DESIGN
_______________
A Project
Presented to the
Faculty of
San Diego State University
_______________
In Partial Fulfillment
of the Requirements for the Degree
Master of Fine Arts in Theatre Arts
with a Concentration in
Design and Technical Theatre
_______________
by
Gabrielle Maria Heerschap
Spring 2015
iii
Copyright © 2015
by
Gabrielle Maria Heerschap
All Rights Reserved
iv
DEDICATION
6 years ago I walked into a scene shop ready to start a career in theatre, an industry I
knew absolutely nothing about. I met a man there who believed in me and my abilities when
I had very little to show for myself. He mentored me for several years, helping me to build a
strong foundation for my career and instilling in me to always honor the commitments I
made. He never told me to go to graduate school and was never the biggest fan of scenery
automation, touting that stagehands could do it better. Nevertheless, I would not have made it
this far if he had not pushed me early on to work hard and to be better. I still catch myself
quoting his mantras.
Even though I know you would not have picked this project for me, this one’s for you
Todd King.
v
ABSTRACT OF THE PROJECT
Tracking Projections: Experimenting in Dynamic Theatrical
Design
by
Gabrielle Maria Heerschap
Master of Fine Arts in Theatre Arts with a Concentration in Design
and Technical Theatre
San Diego State University, 2015
Advances in stage automation and projection design in recent years have provided
new design tools to bridge the visual conversation of contemporary theatre into the
technology driven 21st century. A variety of solutions exist to achieve fluid design. This
project explored the concept of moving projection images around a stage by using an existing
automation and projection software partnership with Creative Conners’ Spikemark™
automation software and Dataton’s Watchout™ projection software. Using the automation
system, I moved a projection screen along a motion path. The automation software sent its
position information to the projection software so the projected content followed the moving
screen. Proof of this technology’s ability to enhance the visual movement of stage design was
showcased in the projection design for the SDSU School of Theatre’s production of Alice:
Curiouser and Curiouser, an adaptation of Lewis Carrol’s Alice in Wonderland. Amidst a
multiscreen projection environment, I used tracking projections to further enhance the visual
interest created by the overall projection design. The overall goal for this project was to
deliver an analysis of my user experience with this software partnership in order to make
contributions to the research for improving the system’s tuning process that would achieve
greater tracking image quality. Separately, these two technology systems are readily
available in both regional and university theatre. Thus, improving the process of this system
partnership will have a far reaching effect on improving fluid projection design in theatrical
environments.
vi
TABLE OF CONTENTS
PAGE
ABSTRACT ...............................................................................................................................v
LIST OF FIGURES ................................................................................................................ vii
CHAPTER
1
INTRODUCTION .........................................................................................................1 The Backstory ..........................................................................................................1 The Project ...............................................................................................................2 2
SYSTEM INSTALLATION..........................................................................................6 Network Communication .........................................................................................7 Automation Component Design ............................................................................10 3
PROGRAMMING .......................................................................................................13 Spatial Relationship ...............................................................................................13 Tween Formula ......................................................................................................17 Pixel Scale Factor ............................................................................................18 Offset................................................................................................................19 Cueing ....................................................................................................................21 Media Design .........................................................................................................25 4
SHOW IMPLEMENATION .......................................................................................28 Initial Conception...................................................................................................29 Alice Sees into the Garden.....................................................................................30 “Drink Me” Potion .................................................................................................32 The Head of the Cheshire Cat ................................................................................34 Stolen Tarts Dance .................................................................................................36 5
REFLECTIONS ...........................................................................................................39 BIBLIOGRAPHY ....................................................................................................................41
vii
APPENDIX
EXCERPT FROM THE SPIKEMARK™ 3.2 MANUAL ...............................................42 viii
LIST OF FIGURES
PAGE
Figure 1. Don Powell Theatre network switch locations. ..........................................................8 Figure 2. Inside of the SL Network Enclosure ..........................................................................9 Figure 3. Watchout™ screen shot showing the projector’s display box within the
Stage window. ..............................................................................................................15 Figure 4. Detail of Watchout™ Display information. .............................................................16 Figure 5. Spikemark™ position programming parameters for Alice. ......................................17 Figure 6. Tween Formula dialogue box ...................................................................................18 Figure 7. Motion path representation for the Tart Dance Scene in Alice: Curiouser
and Curiouser. .............................................................................................................24 Figure 8. Motion path representation for the “Drink Me” Potion Scene in Alice:
Curiouser and Curiouser. ............................................................................................24 Figure 9. Photographs of the Alice tracking screen with projected show content and
without projected content. ............................................................................................25 Figure 10. Alice Sees into the Garden media storyboard. .......................................................31 Figure 11. Original Alice in Wonderland illustration of the Head of the Cheshire Cat. ..........35 Figure 12. Stage photo of the Head of the Cheshire Cat for Alice: Curiouser and
Curiouser. ....................................................................................................................36 Figure 13. Production Photo of the Stolen Tarts Dance in Alice: Curiouser and
Curiouser. ....................................................................................................................38 1
CHAPTER 1
INTRODUCTION
Before beginning any worthwhile project, it is important to ask the question, where
does this all fit? For me, that question begins on a high level. I started the development of
this thesis project with asking myself in what artistic conversation am I trying to participate.
It then evolved into how does theatre, the industry to which I belong, have this conversation,
and then into what practical contribution can I make to this topic. As the culture of
virtualization rapidly increases, we must ask ourselves as 21st century artists, how do we
bridge the gap between our design and the technological realm? Theatre as an art form has
the inherent ability to represent some of the most heightened reflections of life. It is arguably
the best medium to comment on technological developments because theatre is a very human
way to connect with people.
THE BACKSTORY
The physicality of theatrical performance relies on the fluidity of its movement to
contribute to telling a story. The problem that occurs is the juxtaposition of the fluid art of
acting with the static art of scenery. For centuries, theatrical designers have reconciled this by
creating dynamic sets in which scenic elements move around to change the visual
composition of the stage throughout the show, whether it be for a location change or to
generate a different audience reaction. Given the current technological culture, the question is
how to move the scenery. The development of automation systems for theatre has
revolutionized scenery movement, providing the ability to move elements beyond typical
utilitarian ways. Stage automation contributes to the idea that man’s technological
achievements can play an active role in the arts. Though theatre artists tend to hide the
mechanisms of movement in order for the scenery transformation to seem magical, an
audience is still passively receiving the technological message. The way a group of
2
stagehands moves an element of scenery is aesthetically different from how a motor moves
the same element. Furthermore, automation equipment can hide in places a person cannot,
subconsciously communicating to the audience that this piece was not moved by a person.
This is key to stage magic which relies on an audience’s inability to figure out how an effect
is achieved. By decreasing the size of moving mechanisms and developing advanced
programming software, the possibilities for automated scenery today are vast. The dynamism
and precision with which contemporary technology allows scenery to be controlled truly
allows it to participate in the choreography of a performance. These effects enhance the
audience’s experience and immerse them in the world of the performance.
The developments in scenery automation are not the only important technological
advances affecting stage design today. Lighting, sound, and projection design are examples
of three disciplines of theatrical design that are pioneering ways to contribute to dynamic
stage pictures. These advancements are increasingly used in show control applications.
“Show control simply means connecting together more than one entertainment system, and
this simple idea can bring amazing sophistication and precision to a wide variety of types of
performance” (Huntington 357). Though there are many reasons to link systems together, I
find practice of show control is important because of its ability to achieve a level of cue
synchronization beyond human capabilities, which has the power to create impressively
immersive effects. Furthermore, I believe it encourages deeper collaboration among design
and technical disciplines.
THE PROJECT
The above ideas are the foundation of and sentiment behind this thesis project. After
seeing the technologically advanced production of Yoshimi Battles the Pink Robots at the La
Jolla Playhouse in 2012, I was inspired to contribute to the process of fluid design that I
found in that show. The seamless coalescence of different technology in that show set a high
bar for the future of stage design. Present in Yoshimi were the early stages of a partnership
between two disciplines: stage automation and projection design. The companies were
Creative Conners and Dataton, whose products are used widely by university and regional
theatre. By joining their software, Creative Conners’s Spikemark™ with Dataton’s
Watchout™, they enabled an integration that allows a projected image from Watchout™ to
3
track on a screen that Spikemark™ is moving. Though the capability to achieve automated
projections using Spikemark™ and Watchout™ is a few years old, it is still a developing
process. When I embarked upon this project, inspired by what I had seen at the La Jolla
Playhouse, my goal was to contribute to this integration’s development by setting up and
testing the two systems together and experimenting with its capabilities. At the start of the
project, the instructions in the Spikemark™ 3.2 manual were the only information I could
find on how to set this up. Though it was helpful to getting my process started because I did
not have to read through several manuals to figure out what boxes needed to be checked in
each program, overall the information was very limited. It told me how to open the
communication between the two programs, but it did not communicate anything about design
considerations or troubleshooting. The last line of the instructions section is, “As you start
using this feature in production, let us know how it works for you and send us some video.
We love to see this stuff in action” (Creative Conners 209). When I read that I thought this
was an excellent opportunity for experimentation and a way to contribute to a developing
technology that I believe is an important step towards encouraging the advancement of
technology to enhance stage design. With this inspiration, I set the following goals for this
thesis project:
1. To experience the Spikemark™/Watchout™ integration from a user point of
view, to analyze the steps needed to deliver the product, and to reflect on
ways to maximize the integration’s efficiency and quality.
Much of the production work done with this integration involved experts in these
fields and assistance from the developers. Now that it is a few years old, a bit more
refined, and released to the public community of Spikemark™ and Watchout™ users,
I took the approach of an end user seeking to use the available information and see if
I could actually get it to work. At each part of the process, I would analyze the
situation to determine what factors of each system had unique considerations for this
integration and then draw conclusions for making choices within the system’s design
that would produce the best result. Furthermore, considering the theatrical industry is
inherently fast paced, if this integration is to be widely used, it needs to be efficient to
setup. By analyzing the elements required to operate the integration, I attempted to
4
gain a better understanding of how they interact in order to make recommendations
for a quick installation.
2. To encourage the development of this integration as another tool for dynamic
design given the prevalence of Watchout™ and Spikemark™ in university
and regional theatre.
While the idea of moving digital images around a stage is certainly not a new
concept, the tools to do so are frequently cost prohibitive, especially for university
and regional theatre. Designers in training at universities are often limited by small
budgets and resources. Developing an accessible technology such as this is an
excellent way to encourage the consideration of these dynamic design concepts in the
next generation of theatrical designers. Part of my approach was to make this
integration readily available to future students in the San Diego State Theatre
Department. Furthermore, regional theatres are often stops on a production’s way to
Broadway. This kind of development allows these technological considerations to
happen earlier in the design process as opposed to waiting for the bigger Broadway
budget.
3. To explore how an actual implementation of this technology could aid in the
storytelling of a production.
I am a strong believer that the conversation about theatrical technology should not
be divorced from the aesthetic conversation. If the goal is to enhance design, then I
must consider how this technology could impact a production’s story and an
audience’s experience. To discover how technology can affect a production, I was
able to employ the integration of Watchout™ and Spikemark™ for the San Diego
State Theatre Department’s production of Alice: Curiouser and Curiouser. Being on
both the design and the technical sides of the project rounded out this experience for
me because I could draw from each side to improve the other. In addition, I could go
beyond understanding how to setup the integration to discover what it would mean to
actually incorporate this into a production. Providing this production example gives
me a stronger case to encourage future implementation of the integration.
There are a number of factors to consider when designing projection and automation
systems independently of each other. Those factors are still important to this work, however
5
for the purpose of this thesis they will be discussed only as necessary and not in detail as this
in an account of factors specific to the integration of Watchout™ and Spikemark™. The
fundamental steps to open the lines of communication between the two systems are the same
each time this integration is used. What varies each time are spatial relationships and
machinery requirements to achieve an aesthetic goal, which is where I put my focus. In the
following sections, I will illustrate the process for employing the Watchout™/Spikemark™
integration by providing an account of my experience testing for and implementing its use in
the San Diego State University production of Alice: Curiouser and Curiouser. I will first
describe its physical implementation and its software integration, and then I will detail a
practical application of the technology.
6
CHAPTER 2
SYSTEM INSTALLATION
Prior to the actual integration of the Watchout™ and Spikemark™ software, it is
essential to set up all of the physical components of the system. For this discussion, I will
provide an overview of both the Watchout™ projection system and the Spikemark™
automation system to define what elements are required for each, and to describe how I
selected the necessary components for my project.
Watchout™ is a multi-display projection playback software. It operates with one
main computer known as the production computer and any number of display computers,
each connected to a projector as their “display.” Each display is associated both with a
physical field of projection that will land on a projection surface, and with an IP address to
connect it to the Watchout™ Local Area Network. The projection programmer uses the
Watchout™ software on the production computer to define each display in the digital world
in order to control what content is projected by a given display. In addition, the programmer
uses the production computer software to add and manipulate media in a layered Timeline,
which, when activated, will output projection content as designed.
Spikemark™ is a multi-axis theatrical motion control software. Similar to
Watchout™, Spikemark™ functions with a main control computer that connects via a Local
Area Network to any number of units used to motorize scenery in a production. Each motor
controls an object with a physically defined axis of movement and is outfitted with a
Stagehand motor controller card that is assigned an independent IP address on the network.
The automation programmer will then connect the main control computer to each Stagehand
card in order to identify what type of motor controls each axis and to set movement and
tuning parameters for each motor. From here, the programmer can compose scenery
movements and write them into a cue stack for a production.
7
When I began my project, it was independent of a production, but it was still
necessary for me to define what I wanted the end result to be. I knew that I wanted to be able
to move a projection screen in a complex motion path capable of moving in the full range of
the proscenium opening and to have an image successfully track with the screen during all
movement. For the automation side of the project, I needed two motors from the SDSU stock
of automation equipment, one to control the X-axis of movement and one to control the Yaxis. Being familiar with the Spikemark™ programming software, I knew that by
manipulating these two motors simultaneously I could create complex screen movements. In
evaluating the range of movement I was working with, I knew I needed a projector capable
of outputting a large display that would cover the screen’s full range of motion and powerful
enough to produce a high lumen output at the plane of the screen. For this, I turned to the
Don Powell Theatre’s main projector situated in the control booth.
Though I began with setting up equipment for an independent project, shortly into my
testing phase it was decided that I would incorporate this technology into the SDSU
production of Alice: Curiouser and Curiouser. The tracking projection rig I decided upon
remained the same for the production, with the exception of replacing the screen with a show
specific projection surface. This rig was situated among a larger set of equipment used for
Alice that included three projection displays used with five projection surfaces and four axes
of automation. In the following sections, I will describe my process for the physical
installation of this system and how certain aspects are helpful to consider for future
implementations of the Watchout™/Spikemark™ integration.
NETWORK COMMUNICATION
In order to integrate Watchout™ and Spikemark™, an open line of communication
must exist between the two systems. The first step of this process is physically connecting
each projection and automation component to the same Local Area Network (LAN).
Considering each show has different needs, equipment locations are variable. I can predict
general locations for the equipment, however I cannot always position equipment in the same
spot. This means new cables need to be run each time for power, network, etc. Negotiating
these cable runs can be difficult, especially in large scale productions. Given one of the main
goals of this project is to encourage continued use of the Watchout™/Spikemark™
8
integration in the San Diego State Theatre Department, I identified the need for an Ethernet
network for the Don Powell Theatre. This would provide network ports at key locations
throughout the theatre in order to maximize the efficiency of setting up future automation and
projection systems.
Both Watchout™ and Spikemark™ connect via standard TCP/IP compatible Ethernet
hardware. The Don Powell network system I created consists of four Ethernet switches
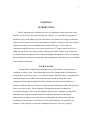
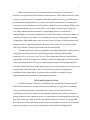
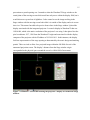
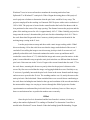
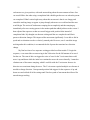
Figure 1 is a plan view that illustrates the network switch locations.
SR SWITCH
SL SWITCH
BEAM SWITCH
BOOTH
SWITCH
Figure 1. Don Powell Theatre network switch locations.
9
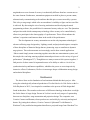
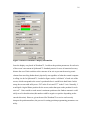
The Booth Switch was an existing switch placed in the control booth of the theatre for easy
access to both the Watchout™ production computer as well as the theatre’s main projector
and display computer. The Beam Switch was another existing switch that I repositioned to be
centralized in the lighting beams above the audience, a frequent position for front projection.
The SR and SL switches are new additions to the network system located on the proscenium
wall on either side of the stage, ideal locations for connecting stage machinery. In order to
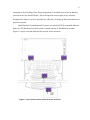
increase the robustness of the onstage switches I assembled them into metal enclosures each
with 7 Neutrik Ethercon panel connectors. The SR and SL enclosures also act as Emergency
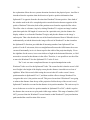
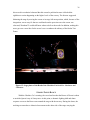
Stop hubs for the automation system. Figure 2 shows the inside of one of these enclosures.
Figure 2. Inside of the SL Network Enclosure
Once all of the switches were in place, I ran Ethernet cables from the SR and SL Switches to
the Beam Switch and from the Beam Switch to the Booth Switch, thus creating an accessible
wired network for connecting all of the projection and automation components. Once all of
the components were physically connected to the system, I assigned each piece a compatible
IP address. Components will be on the same LAN if the first three numbers of the IP address
are the same and the fourth number is unique (Dataton 27). For example, the Watchout™
10
production computer’s IP address was 192.168.10.0 and the Spikemark™ control computer’s
IP address was 192.168.10.10 and both computers functioned on the same LAN.
AUTOMATION COMPONENT DESIGN
Before I explain the physical design considerations that are unique to the automated
projection integration, I will first account in more detail what elements were used in the
automation system. The automated object was a Broadway style theatrical flat with a painted
muslin projection surface. This screen was capable of moving in two axes. It moved in the Xaxis, stage left to stage right, via a custom designed, skate wheel carrier track that is part of
the SDSU’s equipment stock. The screen hung from two carriers on this track. Driving the
left and right movement was a 2HP motorized winch unit capable of pulling a maximum load
of 200 lbs at a maximum speed of 4 ft. /sec. In addition, the track and winch hung on a
counterweighted batten that moves up and down in the Y-axis controlled by a 5HP winch
attached to its arbor. This winch is capable of pulling a maximum load of 900 lbs at a
maximum speed of 3 ft. /sec. For Alice, I wanted to maximize the plane in which the screen
could move to provide the most flexibility in creating motion paths, while at the same time
keeping the machinery hidden. Taking into consideration the desired range of motion, the
audience sightlines, and the height of the theatre’s fly system, I calculated the screen needed
to hang 12’-0” below its carriers in order to be most efficient.
Once the physical components were installed and the load, in this case the projection
screen, was attached to the system, I was able to tune the motors. The purpose of motor
turning is to achieve the smoothest possible motion path given a system’s physical and
mechanical constraints and imperfections. Tuning is done one axis at a time. To describe the
process simply, the motor is written into a cue to bring it to specified location at a given
speed. After running the cue, I must evaluate both the quality of its motion as well as the
motor’s ability to accurately achieve its position. I then need to adjust the tuning parameters
for that motor in Spikemark™ and then re-run the cue to evaluate if the changes achieved the
desired result. The following excerpt from the Spikemark™ manual provides a simplified
explanation for what the tuning parameters are doing:
The Stagehand is constantly analyzing where the motor is versus where it should
be and then adjusting motor power to minimize the difference between where the
11
motor should be and where it really is. It does this analysis a few million times
per second. When it wants to apply power to correct for error in position, it looks
to us for guidance. By entering in some tuning parameters, we are giving the
Stagehand that guidance. In a confounding abstract way, we are specifying how
much power to give the motor when it needs to make a correction. If the values
that we enter give the motor too much power during correction, the motor will be
jerky as it over-corrects and then has to pull back (remember, this happens
millions of times per second). If the values we enter do not provide enough power
to the motor to correct position, it will never reach the cue position since it will
run out of power and be unable to muscle the load onto the target. (Creative
Conners 83-84)
Understanding Spikemark™’s tuning capabilities is essential to the Watchout™
/Spikemark™ integration. When Watchout™ receives the position information and processes
it through the live “tween track” (a Watchout™ specific term that is explained further under
Tween Formula, Chapter 3), it simulates a motion path that it is assuming the projection
surface is following. There is no sensor or information going in the other direction to assure
the image is accurately tracking with the screen. This means that the actual motion path of
the projection surface, as dictated by the automation software, must be tuned to the simulated
motion path. As I discovered through testing, movement that is not precise to the simulated
motion path will result in a noticeable vibration of the image as it tracks with the screen.
When using this automation system conventionally, the jitteriness of the screen would be
undetectable. However, image tracking highlighted all of the imperfections of the physical
motion path. Therefore, it is necessary to this integrative process to spend more time than
usual dialing in the tuning parameters.
Being attentive to the mechanical design of a winch unit is a standard concept in
automation design but it is beyond the scope of this discussion. Part of physical design that I
feel is pertinent to discuss is the mechanism from which the screen hangs from its track
carriers. During the testing phases of this project, the screen hanger design went through a
few iterations. My first attempt was to hang the screen from two 1/8” aircraft cables. I chose
a thin cable to minimize the visibility of the hanging points and make the screen look more
like it was floating in space. However, I discovered through the motor tuning phase that there
was too much lateral movement from the non-rigid cable connection. Spikemark™’s tuning
capabilities are not sophisticated enough to smooth the lateral movement out to the level that
is necessary for image tracking.
12
The next attempt I made was to replace the 1/8” cable lines with 1” square steel
tubing to make the connection rigid. While this eliminated the lateral sway the screen had
with the cable, it created a rigid jerkiness to the movement, which could be minimized with
proper tuning, but not eliminated. Under these conditions, the screen’s movement would be
considered good for normal scenery automation applications. Furthermore, for simple
movements, this setup allowed for image tracking that was relatively smooth with vibration
that was not detectable from the audience. However, when more complex movements were
introduced, the tracking quality diminished enough for the vibration to be noticeable.
The final touch that yielded a suitable result was to make the hanging frame more
rigid by adding diagonal bracing between the two hanging tubes using 1/16” aircraft cable.
This added enough rigidity for the screen to make a smooth complex movement. The
downside of this hanger design is that it is significantly bulkier than the first iteration and
required negotiation with the lighting designer to minimize its visibility. Achieving the
aesthetic effect of a floating screen under the conditions of the integration is inherently
problematic because reducing the structure stresses the automation system’s tuning
capabilities. Designs in which the structural necessities of the hangar could be incorporated
into the screen’s design would create a stronger path to the success of the tracking projection.
The test-and-adjust phase of the automation installation proved it was necessary to
consider how the structural design of an automated piece of scenery will affect the ability of
Spikemark™’s to generate a smooth motion path. Knowing the capabilities for each
component of the system and being careful during the machinery installation is valuable
during the programming phase because it will reduce the time needed for troubleshooting and
fine tuning. Matching an automated motion path to a computer generated idealized path is
nearly impossible. However, with the above methods of hanger design and with careful cue
programming, which will be discussed under Cueing, Chapter 3, I was able to generate a path
smooth enough that the imperfections of the image tracking were minimal from the
audience’s point of view.
13
CHAPTER 3
PROGRAMMING
Once the components were in place and the physical parameters were set, it was time
to actually make the software integration happen. With Internet Protocol as the underlying
protocol, Spikemark™ uses User Datagram Protocol (UDP) to transmit packets of position
information to Watchout™. In this instance, UDP is the preferred method of message
delivery because of its simplicity and speed ("User Datagram Protocol (UDP)"). I consulted
the Spikemark™ manual for instructions on how to configure the software so that
Spikemark™ would send its position information via UDP to the correct server port on the
Watchout™ production computer. On the other side, I needed to tell Watchout™ to listen to
the UDP information. The instructions can be found in Appendix A (Creative Conners 196209). In the following sections, I will analyze the different aspects of configuring and
programming the software to make this integration successful as I experienced it through
testing the system and using it in San Diego State’s production of Alice: Curiouser and
Curiouser.
SPATIAL RELATIONSHIP
Syncing Watchout™’s outputted image position with the automated screen’s position relies
on both Spikemark™ and Watchout™ recognizing the same physical parameters of the stage.
In order to understand how the two systems spatially sync with each other, I will describe
how each program recognizes the physical space.
In Watchout™, there is a Stage window in which display fields are placed virtually.
Each display is delineated as a box, the dimensions of which are given in pixels and
correspond, in most cases, to the native resolution of the projector with which the display is
linked. The origin of the stage, according to Watchout™, is the top, left corner of the Stage
window. The placement of the display box within the Stage window theoretically is arbitrary.
14
Typically, the displays are placed in a logical location, relative to where the corresponding
projected surfaces are to aid in the visualization of cue building. Each display when added is
assigned the IP address of the display computer that is controlling it. Watchout™ will not
output any projected images without an added, linked display window. Consequently, only
images placed within the field of display will be output from the projector. The placement of
the display within the Stage window is inconsequential to the projector because the projector
is manually focused at the unit. Once the physical space is set in terms of screen placement
and its surroundings, the projector can be shuttered and focused to the given location.
Though displays in Watchout™ can be nonspecifically placed, they do contain coordinates
for their location relative to the Stage window's origin. This information becomes very
important when preparing to connect with Spikemark™.
Spikemark™ necessarily ties itself closer to the physical world given the safety
requirements of stage machinery. The Spikemark™ system receives its position information
from encoders attached to the motor units. There is no global origin for all machinery being
controlled, but rather each axis can have a Home position set and the software will retain its
position from Home along its full axis of movement. The limits of the axis are defined by the
physical space in which the axis exists. Therefore it is a necessary part of the automation
setup process to know and understand the physical limits and to set the position information
in the software according to those limits. There are several options for position units in the
software: counts, inches, feet, millimeters, and degrees. In my setup, I used inches.
Spikemark™ also will allow the encoder information to be either positive or negative.
Therefore, if the 0” position of the automated unit is somewhere in the middle of the axis, the
position information will be positive going one direction from 0” and negative in the other
direction.
With this understanding, I will describe the spatial considerations for the integration as it
relates to the production of Alice. Since Spikemark™ allows user definition of an axis origin,
whereas Watchout™ has a fixed origin and fixed positive quadrant, my overall approach was
to first place the display window in Watchout™ and then manipulate the position numbers in
Spikemark™ to recognize where the display field was in real space. I found it helpful to
think of Watchout™’s origin as the upper, left corner of the theatre space, beyond what the
15
proscenium or portal opening was. I wanted to relate the Watchout™ Stage window to the
actual plane of the moving screen which would not only move within the display field, but it
would also move up and out of sightlines. I also wanted to see the image tracking in the
Stage window with the moving screen both while it is outside of the display and as it crosses
into view. This meant I needed to be precise about where in the Stage window I placed the
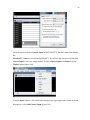
display associated with the integrated projector. I created a display in Watchout™ that was
1920x1080, which is the native resolution of the projector I was using. I then placed it at the
pixel coordinates 1517, 1500 from the Watchout™ origin and associated it with the display
computer of the projector with its IP address of 192.168.10.11. In this instance, the display
field was representative of the stage opening as determined by the scenic design and masking
portals. This was sized to allow for a projected image within the full field of travel of the
automated projection screen. The display’s distance from the Stage window origin
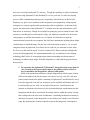
corresponded to the physical space around the screen’s visible field of movement.
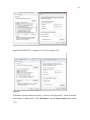
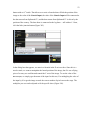
Figure 3. Watchout™ screen shot showing the projector’s display box within the Stage
window.
16
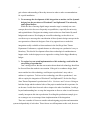
Figure 4. Detail of Watchout™ Display information.
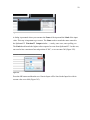
Once the display was placed in Watchout™, I could set the position parameters for each axis
of the screen’s movement in Spikemark™. Standard practice for axes of motorized scenery
dictates the use of limit switches at the extremes of an axis to prevent the moving scenic
element from traveling farther than it physically can regardless of what the control computer
is telling it to do. In Spikemark™, I needed to figure out the “soft limits” of each axis of the
screen, which correspond to the screen’s position before it would hit its hard limits. In this
setup, the screen could safely move 320” in the X-axis and 237” in the Y-Axis. Normally, I
would pick a logical Home position for the screen, and at that spot set the position for each
axis to 0”. I then would set each motor’s maximum position as the furthest amount it could
safely travel in that direction (this number could be negative or positive depending on the
encoder direction). However, given the need for Watchout™ to receive and correctly
interpret the position numbers, the process for setting position programming parameters was
tricky.
17
Ideally, Watchout™ and Spikemark™ would recognize the same origin and positive
quadrant, however this was not the case for the Alice rig. If the origin for the Spikemark™
setup was, when facing the stage, in the upper left corner and the screen traveled on stage and
downward, both motors would be generating negative position numbers. Watchout™ reads
negative input information as 0. So, if a Spikemark™ cue were to run in a direction in which
the position numbers were negative, despite the fact that is it sending out its position
messages, the image would not move in Watchout™ because it would think it was at 0 the
whole time. To remedy this requires negotiation of position numbers in both Watchout™ and
Spikemark™, a topic that will be further discussed under the subheading Offset under the
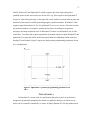
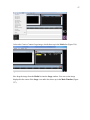
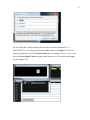
heading Tween Formula. Figure 5 depicts the final position programming parameters for the
Alice configuration.
Figure 5. Spikemark™ position programming parameters for
Alice.
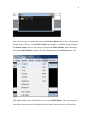
TWEEN FORMULA
In Watchout™, a tween track is a specification placed on a piece of media that is
designed to dynamically manipulate the media it is applied to during a cue. Many tween
tracks can be externally controlled by a variety of inputs (Dataton 69). For the production of
18
Alice, I used motor input values from the automation system to control position tween tracks.
One of the trickier and more complex parts of working with this integration is developing an
accurate tween formula to associate with a given position track. This formula is unique to
every instance of this integration. In this application, each motor, filtered through
Spikemark™, functions as a generic input in Watchout™. A live tween situation occurs
when the stream of incoming Spikemark™ information is associated with a position track.
The tween formula in this case functioned both to associate the motor information for the X
and Y axes with the tween values for the X and Y axes of an image’s position and to translate
the incoming data for Watchout™ so it knows in its system where the image should be.
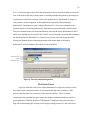
Writing the formula involves knowing the name of the motor input as defined by
Spikemark™ and two numbers: Pixel Scale Factor and Offset.
Pixel Scale Factor
Offset
Motor Input Name
Figure 6. Tween Formula dialogue box
Pixel Scale Factor
A pixel to inch ratio refers to the actual dimension of a single pixel when it comes
into contact with a projection surface. It is determined by the native resolution of the
projector and the projector’s proximity to the projection surface. This is a natural
consideration for projection design to ensure the proper resolution of media is used for a
given application. With the Watchout™/Spikemark™ integration, the pixel ratio plays a
large role in determining the accuracy of the image tracking because it is the scale factor
19
Watchout™ uses in its tween formula to translate the incoming unit inches from
Spikemark™ to Watchout™’s unit pixels. When I began the testing phase of this project, I
used a projector calculator to determine what the pixel ratio would be for my setup. The
projector employed for the tracking is a Panasonic DLP Projector with a native resolution of
1920 x 1080. The projector is located in the control booth at the back of the theatre with its
lens positioned at the center of the stage opening. The distance between the projector and the
plane of the tracking screen for Alice is approximately 100’-0”. When I initially projected an
image onto the screen, I determined the pixel ratio for this relationship to be 4.48:1. This is
the scale factor that I began with when I wrote my initial position tween formula for the
tracking image, testing in the Y-Axis.
I ran the projection screen up and down with a static image tracking with it. What I
discovered using 4.48 as the scale factor was that the image tracked ahead of the screen. I
concluded I was telling the image to travel too many pixels per inch of screen travel, so I
gradually reduced the scale factor and continued to run the screen up and down until I
reached the correct factor of 3.75, which had the image and screen synced in motion. At this
point, it seemed that this setup required a static pixel ratio that was different than the kinetic
pixel ratio. I then ran tests in the X-Axis. I began with a tween formula that also used 3.75 as
the scale factor, assuming this factor was purely related to the projector’s distance to the
screen. My first test revealed that the image was lagging behind the screen. Similarly to my
Y-axis tests, I gradually increased the pixel scale factor in the tween formula until the image
and screen were synced in the X-Axis. The resulting number was 4.4, nearly the same as the
static pixel ratio I had calculated. I then concluded there were several factors contributing to
the scale factor including but not limited to the type and resolution of the encoder attached to
the motor and the image size varying as it moves through the field of projection. Further
experimentation to understand the pixel scale factor is underway, however I have not yet
drawn a conclusion on how to predict the number more accurately.
Offset
Once the pixel scale is determined and the base formula is written, it is time to
analyze the numbers Spikemark™ is sending to Watchout™ to determine if an offset is
needed in the Watchout™ tween formula. Under the heading Spatial Relationship, I began
20
the explanation of how the two systems determine location in the physical space. An offset is
introduced into the equation when the direction of positive position information from
Spikemark™ is opposite from the direction that Watchout™ deems positive. Since both of
the winches used in the Alice setup had positive encoder direction that was opposite of the
positive Watchout™ direction, both of the position tween formulas required offset values.
The offset value is a distance, in pixels, relating Watchout™’s origin to an image’s anchor
point that equals the full length of screen travel in a particular axis, plus the distance the
display window is set from the Watchout™ origin, and plus the distance to the image’s
anchor point. That value then has the rest of the formula subtracted from it. What this does is
mathematically switch the direction the image will travel in Watchout™ so that it matches
the Spikemark™ direction, provided that all incoming numbers from Spikemark™ are
positive. For the X-axis motor, this was straightforward because the full distance the screen
can travel horizontally in view is almost equal to the width of the projection display. Given
the sightlines for the screen, it never traveled out of sight in the horizontal direction, so I did
not need to account for that distance in the offset. Therefore, it was possible to use the offset
to move the Watchout™ 0 to the Spikemark™ 0” in the X-Axis.
The Y-axis was more complicated because it required manipulation on the
Watchout™ side as well as the Spikemark™ side. The reason for this is that the screen’s full
travel height is the height of the display screen plus the distance it needed to travel out of
sightlines. What I discovered while testing the screen is that if I set the screen’s lowest
position number in Spikemark™ to 0”, and then used the offset to change Watchout™ to
recognize this as its 0, the position was off. This proved to me that if Watchout™ was going
to subtract the distance from the top of the projection field to the top of the screen’s travel,
Spikemark™ needed to account for that distance in its position numbers. The easiest way for
me to do that was to set the low position number in Spikemark™ to 248”, which is equal to
the distance the screen moves up beyond visible stage window. This range of numbers (248”485”) processed into the Watchout™ tween formula so that Watchout™’s projected motion
path matched the actual location of the screen.
21
CUEING
Once the two programs had the same spatial understanding for the needs of the
production, and I had accomplished successful accuracy tests, I composed tracking
sequences. A sequence requires programming in both Watchout™ and Spikemark™. These
programs have fundamentally different styles of creating cues. In Spikemark™, cues are
written in a stacking order. Each targeted movement is written as an independent cue with the
option of being linked to another cue. An operator presses a go button to trigger the cue, the
cue will run to completion, and the operator can load the next cue in the stack. Watchout™,
on the other hand functions in a Timeline. Cues are written by adding layers of media to the
Timeline, composing their placement in the Stage window, and adding tween tracks for a
desired effect. Playing the Timeline will run through any media sequences present at that
time in the show. A simple use of the Timeline, and the one used for Alice, is to add a pause
button after each desired cue. Therefore the operator plays the Timeline and a sequence plays
until the pause button, which pauses the Timeline until the operator hits play again.
Though it may appear that Spikemark™ is controlling Watchout™ when a cue runs,
this is actually not the case. Running a Spikemark™ cue will not trigger the Watchout™
Timeline to play a cue. Spikemark™’s running cue simply sends the information out as it is
running to the media that is linked to the information. All that is required in Watchout™ for a
static image to track with the screen is for a synced item of media to be active in
Watchout™’s Timeline. If the Watchout™ cue requires the Timeline to play, such as in the
case of a video, a separate projection operator is required to play the Timeline at the same
time the automation operator runs the Spikemark™ cue. Because Watchout™ is constantly
receiving position data from Spikemark™, there is a good amount of room for operator error.
If both the Spikemark™ and Watchout™ operators do not hit the go button at precisely the
same time the Watchout™ image will automatically jump to the screen’s position. For
obvious reasons, with the screen starting out of sightlines, there is more room for this error
than if the screen moves in view the whole time. During Alice, I employed a few different
cueing styles for this integration, which were all successful. In Chapter 4, I describe in detail
how I generated each tracking projection sequence.
22
When writing a cue in Watchout™ for this integration, after the necessary steps are
taken as detailed in the Spikemark™ manual to allow external control of the media, much of
the methods are the same as without having it linked to Spikemark™. The exception is that
the linked media cannot freely move around the Stage window. Therefore, this created a
tedious situation when I needed to adjust the media’s placement on the projection screen
because I could not just drag it into place. My first method of adjustment was to keep all of
the offset values the same for each image’s tween formula and then adjust the anchor point of
an image to place it where I wanted it to be on the screen because this was faster than
modifying the tween formula each time. However, when I wanted to add rotational tween
tracks to some of the media, I found I needed the anchor points to be at the center of the
image. At this point, I reset all of the images’ anchor points to the center of each image and
made adjustments to image position via the offset in the tween formula.
While writing cues for the integration in Watchout™ is more tedious and repetitive
than it is complex, developing the screen motion paths in Spikemark™ requires significantly
more attention. Beyond motor tuning discussed in Chapter 2, another factor in delivering a
smooth motion path is in the actual writing of a cue. In general, when writing a cue in the
Spikemark™ program, I first determine each axis that needs to move in the cue and then I
individually add those motors to the cue. I then specify the position each motor will move to,
the speed at which it will move, and the rate at which it will accelerate. Understanding each
motor’s overall capabilities and nuances of movement is important, especially when I want
the screen to move in two axes at once in a complex cue. Considering the differences in
mechanical design between the two winches that controlled the screen’s movement, I needed
to be attentive when setting each motor’s speed and acceleration rates. It was important that I
pay attention to the needs of each motor so I would not write cues that would jerk the motor
into movement or stop it too quickly. Doing that would add more inertial movement to the
screen which would cause the motor’s tuning parameters to react in a way that would lead to
uneven movement.
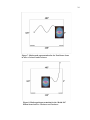
For Alice, I had two complicated motion sequences to write, which are illustrated in
Figures 7 and 8. Both required movement simultaneously in the X and Y directions in an
undulating pattern. I first began by writing a series of cues with both axes that would bring
23
each motor to a given position, with each motor taking about the same amount of time. One
cue would follow the other using a completion link which began the next cue when the parent
cue completed. What I noticed right away about this movement is that it was choppy and
caused the tracking image to appear to jump abruptly when one cue would end and the next
would begin. The action of both motors ramping down completely and then ramping up
immediately after was causing pauses in the motion path that added jerkiness to the screen. I
then adjusted the sequence so that cues would trigger with position links instead of
completion links. My thought was that not waiting until the cue completed would limit
pauses at direction changes. This improved the movement significantly. I was able to dial in
speed and acceleration to make a relatively smooth path. However, once I tested the image
tracking under this condition, it accentuated the bit of pause that remained at a direction
change.
My final revision of cue sequence writing provided excellent results. To begin the
sequence, a cue started the screen moving in the X direction for the full amount of its travel
for that cue. The start of this cue triggered a series of cues for the Y axis motor that would
move it up and down while the initial cue continued to move the screen laterally. I wanted to
eliminate one of the motors ramping, which I could do with the X axis motor because its
direction was consistent during the move. The Y axis motor required multiple cues because it
needed to change direction. I incorporated position link triggers for the sequence of up and
down cues and refined all of the settings until I had two paths of movement that allowed for
smooth image tracking.
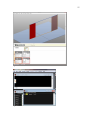
24
Figure 7. Motion path representation for the Tart Dance Scene
in Alice: Curiouser and Curiouser.
Figure 8. Motion path representation for the “Drink Me”
Potion Scene in Alice: Curiouser and Curiouser.
25
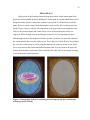
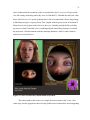
MEDIA DESIGN
Being aware of the functional imperfections between the actual motion path of the
projection surface and the idealized Watchout™ motion path, it is worth considering ways to
design the media content to reduce the audience’s perception of a difference between the
paths. This was a main lesson I learned during the creation of the Alice tracking projection
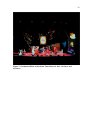
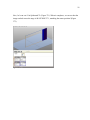
design. Figure 9 shows a side by side comparison of the projection screen designed for this
effect by the scenic designer and a static image of one of the moments this effect was
employed. What I designed for the tracking projections for Alice was perhaps the most
difficult application for the integration of these systems. As shown, the projected content of
the screen matches the exact size of the screen. This is the root of the difficulty. Projecting to
the exact size of the screen as well as using the painted oval geometry on the screen allows
for no error between the actual and idealized motion paths. Any deviation in the projected
picture frame and the actual picture frame would be noticeable. This is an example of trying
to use an imperfect system perfectly.
Figure 9. Photographs of the Alice tracking screen with projected show content and
without projected content.
26
There were a few reasons I designed the media in this way despite its difficulty. First,
the screen was designed to be an oval shaped portrait frame with a tromp l’oeil frame and a
white oval in the center to be the projection surface. Therefore, I was immediately restricted
to using the oval line. This required me to create an oval shape in Photoshop that
proportionally matched the oval of the screen. I did that by importing the scenic designer’s
paint elevation of the screen into Photoshop and drawing an oval that matched the shape of
the picture frame’s oval. I then brought the oval into Watchout™ to employ as a mask for the
content that would go inside the oval. This means that Watchout™ would use the oval mask
to “crop” the image to that shape, thus creating a hard projected line that needed to follow a
hard painted line on the screen. Had this been the only restriction for the media content, I
could have feathered the oval mask to reduce the hard line of the projected content to make it
less noticeable if it was not perfectly following the painted line of the screen as it traveled on
its motion path. However, once I began to look at the screen under show lighting conditions,
I realized the painted frame detail was falling really flat next to the bright projected content
of the oval. The lighting designer was not able to assist in brightening the frame as he would
not be able to isolate the frame across its path of movement without washing out part of the
projection. I then went back to the paint elevation of the screen’s picture frame and added
that as another layer in Watchout™ to project the image of the paint elevation onto the actual
painted treatment. This was incredibly successful visually. It gave the painted frame a lot of
depth. Though, it required the projection of the frame to follow the hard lines of the screen.
The deviation of the projected frame and the painted frame when the screen was in motion
was, understandably, the most noticeable discrepancy of the motion paths because it is a level
of precision that the system is not currently designed to handle. Any images projected in the
middle of the oval, such as the cherry tart shown in Figure 9, appeared smooth from the
audience’s perspective because there was nothing to reference it as being slightly out of sync.
I found a way to reconcile the problem that I believe generated the best success for the
design. I first reduced the opacity of the projected picture frame. This reduction of light made
the deviation between the two paths not as harsh. I also oversized the oval mask so that it was
large enough to accommodate the range of deviation and not show its line next to the painted
oval line. In this application, the aesthetic need to have a lit picture frame outweighed the
27
imperfection of its path relative to the screen’s path. However, for future applications, I
would recommend avoiding tight tolerances for a tracking projection. Truly revealed through
this process is that the design of the media can play a crucial role in compensating for the
discrepancies of the motion paths.
28
CHAPTER 4
SHOW IMPLEMENATION
Advancements in theatrical technology continue to increase the repertoire of stage
effects with which one can design. Scenic technology, in particular, can significantly aid in
the ease and precision of complex scenery transitions. Though it is important to note that
incorporating scenic technology into a production is more than simply a functional
consideration. Employing this technology has the power to create dynamic visual
compositions that contribute to the choreography and storytelling of a piece. The tracking
projection system is an example of employing technology in this way. This makes it an
excellent tool for experimenting with how to design aesthetically with scenic automation.
Using this setup for the San Diego State University production of Alice: Curiouser and
Curiouser was an exciting way for me to begin this exploration.
Typically, the decision to use certain technology in a show is made alongside the rest
of the scenic design. However, I was in the process of discovering how to setup and operate
the tracking projection rig independently of the Alice design process. So, the decision to
include it was well after the scenery was designed. This had both benefits and drawbacks.
First, it allowed me, the director, and the scenic designer to understand the other side of the
art and technology relationship. While most of the time in theatre the artistic decisions
necessitate the design of new technology, in this instance the technology drove the creation
of new artistic ideas. Furthermore, we were able to find parts of the show that were
challenging to stage and use the tracking projections to enhance the moment. The difficult
side to incorporating this setup after the scenery was designed is that decisions for the
location of the rig and for the size and shape of the screen were restricted to fitting into the
existing physical and aesthetic world of the design. While overall it was a good compromise
that allowed the tracking projections to be successful, it presented design limitations for me
that could have been resolved had we been able to collaborate earlier in the design process.
29
For example, my field of movement was limited by the placement of other scenic elements
and by the audience sightlines created with the masking curtains. I could not move the screen
horizontally out of sight. It always had to exit upward. This both added an element of
predictability to its movement and also made programming complex motion paths more
complicated because I had less space in which to make dramatic movements. In addition,
perhaps the biggest challenge that faced my design process is the one discussed under the
Media Design heading of Chapter 3. Now that I have a better understanding of the design of
this technology, when I next employ it I would negotiate for a screen design and paint
treatment that would mask the imperfections of the technology.
INITIAL CONCEPTION
The first time I met with the director for Alice, we discussed what the full
technological capabilities of the tracking projection screen could be. She was drawn to its
lateral movement and its ability to break up the existing patterns of scenery and movement
present within the set. She wondered how its movement could accentuate the idea of floating
thoughts and how it could enhance the unexpected feelings of Wonderland. From this
discussion, we thought through the show and identified moments where the tracking screen’s
inclusion would be appropriate. As she visualized ideas during her rehearsal process, I read
through the script to get a feel for when the tracking projections could amplify the
storytelling. The projection list went through an iterative process as we approached the time
for technical rehearsals. New ideas were added and old ideas were cut. For example, upon
reading the script, it seemed natural to want to include the screen’s ability to be in multiple
locations for the scene when Alice meets the Cheshire Cat. During the scene, the Cheshire
Cat disappears and reappears at random. I felt that projections could be a good way to move
the character around the stage and have his image appear and disappear in addition to the
actor’s movements in order to accentuate the magic of his character’s elusive nature.
However, once I saw the scene performed in rehearsal, it became clear that trying to use the
projections in this way would be cumbersome for a quick paced scene. The staging of the
actor in this scene was the stronger choice.
Ultimately, as we worked through the design and rehearsal process, we settled on four
cues for the tracking projection screen where its use would be helpful and appropriate. Two
30
of the cues were in Act 1, first helping us transition Alice into the garden of Wonderland and
then as an illustration of imagination for how the “Drink Me” potion tastes. In Act 2, the
screen is used first in the Croquet scene when Alice sees a large, looming image of the
Cheshire Cat’s face. It then supports the whimsy of the Stolen Tarts Dance as it carries an
image of a tray of cherry tarts across the stage. Each cue of the tracking projection screen
illustrates different capabilities of the system. The cues include static images, animated
images, and video, as well as follow varying motion paths around the stage. The following
sections provide detailed descriptions for how this system was applied in each instance.
ALICE SEES INTO THE GARDEN
Arguably the strongest use of the tracking projection screen is this movement that
occurs early in Act 1 of the show. After falling down the rabbit hole, Alice has found herself
among many doors. She finds one small door especially curious, though it is locked. With the
help of the Enchanted Table character, she finds the door’s key. The door is positioned, from
the audience’s point of view, in the lower left corner of the stage. At the point where Alice
kneels down to open the little door, the tracking projection screen flies in center stage playing
a video of a close up of Alice’s eyes catching the first glimpse of the Wonderland garden.
When the screen reaches its downward position, the video of Alice’s eyes freezes with her
looking directly towards the audience. On her line, “It’s the loveliest garden I ever saw,” a
spinning flower appears in each of her eyes and lasts through the moment of her peering into
the garden.
The idea grew out of the director’s desire to have the moment of Alice looking
through the door be prominent and understandable that she was looking into the physical
Wonderland garden onstage. I began creating this sequence with a video clip of Alice’s face
close up in front of a green screen, looking around as if she were peering for the first time
into Wonderland. Considering the quick timing of the scene, I knew I needed less than 10
seconds of video from when we first see the screen to its final lowered position. I selected an
8 second clip from the video that ended in a moment of Alice looking out to the audience,
wide-eyed. The challenge with this media and the screen shape was that we wanted to see
just her eyes close up, a landscape oriented view, but the screen had a portrait orientation.
This showed her entire face in the portrait and restricted how far I could zoom in on her eyes.
31
I put a feathered border around the video so it looked like Alice’s eyes were lit up in a dark
cave-like setting, mimicking where they were. In Watchout™, I blended the end of the video
into a still of her eyes. To get the spinning flower effect, I manipulated a flower shape image
in Photoshop and gave it a glossy sheen. This coupled with an opacity tween in Watchout™
allowed me to slowly ghost in the flowers to her eyes. I initially just had the flower fading
up, however when I heard the scene’s twinkling magical sound effect playing as I watched
the projection, I felt this moment needed a matching animation, which is when I added a
rotation tween to the flowers.
Figure 10. Alice Sees into the Garden media storyboard.
The motion path for this scene was a simple down movement in the Y-axis. I felt
center stage was the appropriate choice for this path because it balanced the action happening
32
in the downstage right part of the stage. Triggering this sequence required two operators,
projection and automation, to press go at the same time. The timing of this cue was tricky.
Since the screen was at its maximum out position, I needed to allow the Y-axis motor time to
ramp up to speed and bring the screen in view, however I only had 8 seconds of video to use.
Selecting the right moment for the “Go” took several iterations. The most helpful thing I did
was take a video of the scene in performance and watch it while I ran the cues, in order to
figure out when the stage manager should call this cue. Ultimately I knew the automation cue
needed to run before the projection cue so that the screen could get into position at the time
the video started playing. In order to aid in the stage manager’s calling of the cue, I delayed
the start of the Watchout™ sequence so both cues could be called at the same time and the
video would be timed correctly to the movement.
The movement of the screen enhanced this moment more than a static projection
screen could have. A curious feeling was added to the scene when we watched Alice’s eyes
darting around as they descended into the stage window. It looked as if Alice was seeing
different aspects of Wonderland as the screen traveled through it. Her awe of Wonderland
was amplified when the video paused as the screen stopped moving, showing a stylized
image of her eyes with animated flowers until they slowly fade out at the end of the dialogue.
“DRINK ME” POTION
This sequence showcases the full capabilities of the tracking projection system. It
includes both a complex motion path and changing projection images. This cue happens right
after the “Alice Sees into the Garden” sequence fades away. After Alice sees into the garden,
she longs to be small enough to fit through the tiny door and experience that world. At this
point, the Enchanted Table lures her to drink a potion to change her size. He addresses the
audience asking the question, “What does she taste?” Then, to the beat of the scene’s music,
he lists the potion’s tastes as “Cherry Tart, Custard, Pineapple, Roast Turkey.” Alice joins in
for a second round of this list agreeing to what she tasted. The projection screen begins in the
same position in which it ended during the “Alice Sees into the Garden” scene, at center
stage. As the Enchanted Table begins his list of tastes, images of the items flash on the screen
behind him. When Alice joins in, the screen begins an undulating diagonal movement going
stage left and up out of sight while the taste images continue to flash on the screen. At the
33
same time the screen begins moving stage left, a nearly 12’-0 tall Giant Alice character enters
from stage right balancing the screen’s movement visually and also conceptually. It seems
the potion Alice drank in this scene made her grow instead of shrink.
This moment was conceived of by the director as a way to create an interesting
illustration of thoughts floating through the air. I began by collecting different images of the
food items listed and tested what they looked like projected on the screen. I paid attention to
how the image was framed by the oval as well as the quality of lighting in the image. I
wanted bright images of the food items that would stand out in a fantastical way. I included a
background for the images so they looked like portraits in the oval frame. Considering the
design of the frame itself and the world Alice came from, I chose a Victorian wallpaper
pattern, which I manipulated in Photoshop for a fitting color for the scene. Figure 8, p. 24
shows a photograph of part of the media for this sequence with an illustration of its motion
path.
The motion path for this sequence was the most complex to program of all of the cues
in the show. Because of where the screen started for this movement, I had limited space to
move the screen in an interesting way before it was out of sight. Adding too many movement
points close together forced the motors to ramp up and down quickly, and made it difficult to
get a delicate path to make the illustration of thought feel light and airy. Through several
iterations of programming techniques, as discussed earlier under Cueing, Chapter 3, I was
able to achieve an appropriate path. Furthermore, the timing of this scene needed to be
precise in order to amplify the effect. The image flashes needed to be timed to appear as the
characters were saying the words and the screen needed to be out of sight by the time the
moment concluded. By listening to the music ahead of time, I was able to time the
Watchout™ image sequences so they were close to what they needed to be, however in
actual performance of the scene the timing was not quite right. Again, this is where a video
of the scene in rehearsal became helpful for me since I could dial in the precise timing of the
sequence to the actual performance and place where the projection and automation cues
needed to happen.
The sequence is one projection cue and one automation cue. The projection cue
begins on the static screen flashing the first round of food images. Then, as Alice joins the
34
Enchanted Table, an automation cue begins the screen’s movement while the same projection
cue continues to run. Watchout™ knows where the screen is initially because Spikemark™
retains position at all times, so the projection is able to begin on the static screen in its
starting location. Then when the screen begins moving, the open stream of communication
between Watchout™ and Spikemark™ allows the projection cue to continue as is while it
follows the automated path of the screen.
Working on this sequence was important to the development of the Watchout™ and
Spikemark™ integration because its complexity provided a real challenge to negotiating how
all of the components could function smoothly. It demanded more refined motor tuning and
cue programming in order to reduce the media’s vibration while in motion. In addition, it
generated techniques for achieving greater perceived accuracy of the image tracking.
Furthermore, it pushed the visual composition of this scene into being a more vibrant
experience.
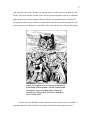
THE HEAD OF THE CHESHIRE CAT
In Act 2, Scene 14, Alice is invited to play croquet with the Queen of Hearts. At one
point during the games, visible only to Alice, a giant head of the Cheshire Cat appears.
Motivation for the Cat’s presence in this scene is found in the original illustrations for Alice
in Wonderland seen in Figure 11. Similar to the “Alice Sees into the Garden” movement, the
screen flies in with a giant still image of the Cheshire Cat’s face, except this time it flies in at
its stage left most position. His character’s magical, all knowing presence looms over the
scene until it comes to life with him saying “Look to the tarts!” in a booming voice. He is
calling attention to the Knave of Hearts character who is about to steal the Queen’s tray of
cherry tarts. On the screen, we see the video of the Cheshire Cat saying his line as it fades
into an image of a tray of cherry tarts.
For this scene, I faced a similar media problem as I did with trying to isolate Alice’s
eyes. I began by taking a close up video of the actor playing the Cheshire Cat in his costume
and makeup against a black background grimacing into the camera and then delivering his
line. However, I wanted to highlight Cheshire Cat’s iconic smile, so I again used a feathered
border on this video, though slightly less opaque and, this time, positioning it so that the
character’s smile was prominent and the rest of his face was in shadow. The screen flies in
35
with a paused video of the Cheshire Cat’s grimacing face in the same motion path as it did
for the “Alice Sees into the Garden” scene, the exception being that it came in at a different
point on the X-axis. At the moment when the Cheshire Cat speaks his line, a Watchout™
cue plays the video in sync with the recorded sound of the character delivering his line. The
same projection cue continues to a crossfade of the video into the tray of cherry tarts image.
Figure 11. Original Alice in Wonderland illustration
of the Head of the Cheshire Cat from Tenniel, John.
Executioner Argues with King about Cutting off
Cheshire Cat's Head. 1865. The Project Gutenberg.
Web. 29 Mar. 2015.
For this scene, the flexibility of the automated screen’s placement was invaluable. I
originally planned for the Cheshire Cat’s head to be featured center stage. However, I
36
discovered in a technical rehearsal that this caused a problem because it blocked the
sightlines to action happening on the higher levels of the scenery. The director suggested
balancing the stage by moving the screen to its stage left most position, which, because of the
integration, was an easy fix that we could make on the spot since once the screen was
relocated, Watchout™ would still know where to deliver the media. In addition, making this
move gave me a new idea for the screen’s use: to enhance the whimsy of the Stolen Tart
Dance.
Figure 12. Stage photo of the Head of the Cheshire Cat for Alice: Curiouser and
Curiouser.
STOLEN TARTS DANCE
With the Cheshire Cat’s warning, the crowd realizes that the Knave of Hearts is about
to steal the Queen’s tray of cherry tarts. At this point, a dramatic lighting shift and dance
sequence occurs as the Knave runs around the stage with the tart tray. During the dance, the
tracking screen makes a whimsical movement to the other side of the stage carrying the
37
image of the tart tray with it. The movement lasts for the duration of the dance and upon
reaching the other side of the stage, the cherry tart tray image fades into the Queen of Heart’s
Coat of Arms to establish the next scene as the Court of the Queen of Hearts.
The conception of this sequence happened organically during the technical rehearsal
process. Prior to the rehearsal, we knew we wanted to use the screen to portray the Cheshire
Cat head and we knew we wanted it to aid in establishing location for the Queen’s Court.
After seeing the choreography, music, and lighting cues come together, it felt natural to
include the automated projection screen. This sequence runs from an automation cue that
takes the screen in an undulating path to the other side of the stage. Unlike in the “Drink Me”
potion scene, I had more space to make larger movements, so I was able to make a smooth
motion path without much tweaking. Figure 7, p.24 depicts the motion path for this scene.
When the screen reaches its destination at the end of the dance, a Watchout™ cue runs the
fade of the cherry tart tray into the Coat of Arms image.
Perhaps the most challenging media creation was for this sequence. The tray of cherry
tarts could not be an arbitrary tray because we see the Knave carrying a tray of tarts so I
needed to project an image that more or less matched the prop he carried. Unfortunately,
while the prop looked good from a distance, it was not photo quality. I also could not find an
appropriate image to use, so I composed one in Photoshop. Additionally, the Coat of Arms
media proved challenging because my reference image was a small part of an original Alice
in Wonderland illustration of the Court. I enlisted the help of the scenic designer to redraw
this image for me so I could then manipulate it in Photoshop to make it look three
dimensional like the rest of the media.
The Act 2 use of the automated projection screen was a successful example of using
the full range of the screen’s motion. The visual necessity of having the screen start on stage
left and end on stage right for the next scene was made possible with the use of this
integration. Without this range of capability, the design for these moments would have
suffered. Discovering the Tart Dance movement was a bonus. Through this design, we were
able to add playful excitement to the chase by having the image of the tarts moving across
stage as the real tarts were moving too.
38
Figure 13. Production Photo of the Stolen Tarts Dance in Alice: Curiouser and
Curiouser.
39
CHAPTER 5
REFLECTIONS
Carrying this project through the testing and production phases was an important
beginning to researching this integration. It allowed me to discover all of the nuances
involved and identify areas that need further development and understanding. Being both the
technical designer as well as the artistic designer was invaluable to my process. I was able to
push both sides of the equation and really discover the capabilities of this integration. My
technical knowledge encouraged me to design more complex sequences, and my artistic
experience forced me to develop techniques to refine the technology to achieve the desired
effect. I am proud of this work as a first iteration for the San Diego State Theatre
Department, though I recognize areas needing improvement. Through continued use of this
integration, we can truly contribute to its improvement. The areas which I hope to continue
researching are:
Pixel Scale Factor
Conducting experiments to determine a formula for accurately calculating the
pixel scale factor needed for the tween formula would be incredibly helpful to the
efficiency of this system’s installation. Since we value quick setup in theatre, it is
important to get this number as close as possible to minimize the amount of trial
and error during programming.
Integration-Specific Machine Design
My machinery resources to conduct this research were limited to the equipment
available in the stock of the SDSU Theatre Department. While this is quality
equipment that was indeed capable of producing a successful result, I would
improve upon this by incorporating a mechanical design, which takes into account
factors specific to moving a projection screen. Refining the machine design would
allow me to get closer to achieving the automated motion path that Watchout™
simulates.
Experimenting with controlling other tween tracks
A position tween is the natural choice for external control by the automation
software. However, I would experiment with how these numbers might
manipulate media in other ways beyond simply moving it with the screen in order
40
to push the designs forward. I believe these experiments could lead to some very
dynamic effects.
With the information provided thus far in this thesis, I hope to encourage future
generations of SDSU theatrical designers to continue to create in a fluid way. I hope that the
new designs we conceive will further the development of the Watchout™ and Spikemark™
integration.
41
BIBLIOGRAPHY
WORKS CITED
Dataton. Watchout™ 5 User’s Guide. Dataton. Dataton AB, 1 Jan. 2015. Web. 22 Jan. 2015.
Creative Conners. Spikemark™ v3.2 User Manual. Creative Conners. Creative Conners,
Inc., 1 Jan. 2013. Web. 22 Jan. 2015.
Huntington, John. Show Networks and Control Systems: Formerly Control Systems for Live
Entertainment. Brooklyn: Zircon Designs, 2012. Print.
Tenniel, John. Executioner Argues with King about Cutting off Cheshire Cat's Head. 1865.
The Project Gutenberg. Web. 29 Mar. 2015.
"User Datagram Protocol (UDP)." IPv6.com. 1 Jan. 2008. Web. 6 Feb. 2015.
WORKS CONSULTED
Alice: Curiouser and Curiouser. Adapt. Margaret Larlham. Dir. Margaret Larlham. San
Diego State University Department of Theatre. Don Powell Theatre, San Diego. 6
Mar. 2015. Performance.
Carroll, Lewis. Alice’s Adventures in Wonderland. London: Macmillan and Co., 1865. Print.
Yoshimi Battles the Pink Robots. By Wayne Coyne and Des McAnuff. Dir. Des McAnuff. La
Jolla Playhouse. Mandell Weiss Theatre, La Jolla. 21 Nov. 2012. Performance.
42
APPENDIX
EXCERPT FROM THE SPIKEMARK™ 3.2
MANUAL
Dataton WATCHOUT™ Integration – New in Spikemark™ 3!
Projection design is commonplace in an increasing number of theatrical performances. With
media servers and automation gear existing on the same network, it seems obvious that these
systems should share data to create stunning effects by coordinating video and scenic motion.
To that end, Spikemark™ now has the ability to output position data from any motor in a
show to a WATCHOUT™ media server. It takes a little extra configuration in Spikemark™
and WATCHOUT™ to get both systems talking to each other, but the effort is reward with
truly stunning effects. Alright, let’s get started.
Assume that we have a little show with an automated wall panel attached to a traveler track.
On cue, the wall panel will track from Stage Right to Stage Left. As the panel tracks across
the stage, we need to project a graphic onto the panel and have the image move along as if it
were glued to the panel. Here’s a screen shot of the Spikemark™ cue (Figure 350):
43
Figure 350
In order for WATCHOUT™ ’s projectors to track an image synchronously with the
motorized panel, we need to send the position of the panel to WATCHOUT™ . Spikemark™
will communicate with WATCHOUT™ over the Ethernet network, so both the
Spikemark™ automation computer and the WATCHOUT™ production computer need to
be plugged into the same physical network. In addition, the two computers need to have
compatible IP Addresses that share the first three segments of the address with unique fourth
segments. I have the addresses assigned as such: Spikemark™ computer is 192.168.10.119
(Figure 351)
44
Figure 351
And the WATCHOUT™ computer is 192.168.10.9 (Figure 352)
Figure 352
With both computers addressed properly, we need to tell Spikemark™ where to send the
position data. In Spikemark™ select Watchout™ from the Show Control menu (Figure
353).
45
Figure 353
A dialog pops up with some configuration details that determine what data is sent to
WATCHOUT™ (Figure 354).
Figure 354
From the top the options are:
1. Server Address: The IP Address of the WATCHOUT™ production computer
2. Server Port: The port where WATCHOUT™ listens for incoming data. By default,
WATCHOUT™ listens on 3040.
3. Motor List: Each motor in your show is listed. If the Active box is checked, that
motor’s position information will be sent to WATCHOUT™ . In the Watchout™
Name text box you can enter a name that will be used inside WATCHOUT™ to
46
identify the motor’s position. The Spikemark™ motor name and the WATCHOUT™
name can map however you like. For example, we could have called it “Logo Winch”
in Spikemark™ and “fuzzy pink rabbit” in Watchout™ .
4. Sending Position Data: Indicates whether Spikemark™ is currently sending UDP
packets to the address indicated in Server Address.
5. Update Interval (ms): The frequency with which Spikemark™ will send position
updates to WATCHOUT™ . The number entered here will determine how many
milliseconds should elapse between updates, so higher numbers will result in a slower
update cycle. In practice, 30ms is about the fastest rate consistently possible without
adversely affecting Spikemark™ ’s performance.
6. Messages/second: The number of position updates that are actually being sent to
WATCHOUT™ each second. This number will often bounce around by 1 or 2
messages.
7. Include transition rate in messages: If checked, Spikemark™ will send
WATCHOUT™ the number of milliseconds that have elapsed since the last position
update.
WATCHOUT™ can use this information to smooth the animation of the image as it
tracks with the motor. This generally results in a smoother visual result, but can be
slightly inaccurate. Feel free to experiment with either setting to get the most
appropriate result for your show.
8. Send Output: This is a toggle button to turn on/off the data stream from
Spikemark™ . The data is sent via UDP, which is a connectionless protocol, so there
is no harm sending out the packets even if WATCHOUT™ is disconnected from the
network. UDP packets will blissfully fall into oblivion if the server is not around to
receive them so you can start the output stream before WATCHOUT™ is running.
With Spikemark™ configured and the Send Output button depressed, we are ready to fire
up the WATCHOUT™ production machine. Start WATCHOUT™ and give your show file
a name. As I mentioned when we started, I need an image to be projected on the traveler
panel, so our first step in WATCHOUT™ is to import an image (Figure 355).
47
Figure 355
I selected a Creative Conners Logo image, which shows up in the Media list (Figure 356).
Figure 356
Now drag the image from the Media list into the Stage window. You can see the image
displayed in the center of the Stage view and it also shows up in the Main Timeline (Figure
357).
48
Figure 357
With the image on our virtual stage, we need start configuring WATCHOUT™ to listen for
data from Spikemark™ . We have to enable an external source (Spikemark™ in this case) to
control the image position. Double-click on the image in the Media List and select More
Effects and Capabilities (Figure 358).
Figure 358
Then, in the Main Timeline, double-click on the image layer to bring up the Media Cue
properties window. Select the Advanced tab and check External Control of Position, Scale
& Rotation (Figure 359).
49
Figure 359
Our next step is to create a Generic Input in WATCHOUT™ that has a name that matches
the
Watchout™ Name we entered into Spikemark™ . We will use the data received from that
Generic Input to move the image around. To add a Generic Input select Input from the
Window menu (Figure 360).
Figure 360
From the Input window, click on the little triangle in the upper right corner. From the menu
that appears, select Add Generic Input (Figure 361).
50
Figure 361
A dialog is presented where you can enter the Name of the input and the Limit of the input
value. This step is important to get correct. The Name needs to match the name entered in
the Spikemark™ Watchout™ Output window… exactly, same case, same spelling, etc.
The Limit should match the highest value expected to come from Spikemark™ . In this case,
our traveler has a maximum forward position of 360”, so we can enter 360 (Figure 362).
Figure 362
Press the OK button and then the new Generic Input will be listed in the Input list with its
current value set to 0.00 (Figure 363).
51
Figure 363
Now, the next step is to connect the value of the Generic Input to the x-axis of the Image so
that the Image will move as the Generic Input value changes. To link the image position to
the Generic Input value we will create a formula in the Main Timeline. Select the image
layer in the Main Timeline, and then from the Tween menu select Position (Figure 364).
Figure 364
This adds a Position tween track below Layer 1 in the Main Timeline. This is the good part.
Now that we have a tween for Position, on the left side of the track there is a little round
52
button with an “f” inside. That allows us to write a formula that will link the position of the
image to the value of the Generic Input, the value of the Generic Input will be connected to
the data stream from Spikemark™ , and the data stream from Spikemark™ is driven by the
position of the scenery. The knee bone is connected to the leg bone… still with me? Great,
click the little ƒunction button (Figure 365).
Figure 365
In the dialog box that appears, we enter in a formula in the X axis text box. Since this is a
traveler track, we want to manipulate the lateral position of the image, but if it was a flying
piece of scenery we could instead control the Y axis of the image. To use the value of the
Generic Input,
we simply type the name of the input. In this case, I’m multiplying the value of
the input by 10 to get the image to track the correct number of pixels across the stage. The
multiplier you use can be adjusted to fit the specific show (Figure 366).
53
Figure 366
We are almost there. Before flipping the last switch to connect Spikemark™ to
WATCHOUT™ , try clicking around in the Value column of the Input list. This will
manually adjust the value of the Generic Input and if everything is correct so far, as you
alter the Generic Input Value the image should jump to a new X position in the Stage
window (Figure 367).
Figure 367
54
Alright, let’s get the WATCHOUT™ computer listening to the Spikemark™ computer.
From the File menu select Preferences. Then from the Control tab, check the UDP box next
to Production Computer Control (Figure 368).
Figure 368
As soon as you click OK, WATCHOUT™ will start picking up the position data stream from
Spikemark™ (assuming you depressed the Send Output button in Spikemark™ ) and the
image will snap back to match its X position with the motor position. Also, the Generic
Input Value should track with the motor position.
Let’s load up cue #2 in Spikemark™ . Notice that the current motor position is 0.18” in
Spikemark™ , and that the Generic Input Value in WATCHOUT™ is 0.175 showing that
the two systems are communicating (Figure 369, Figure 370).
55
Figure 369
Figure 370
56
Now, let’s run cue #2 in Spikemark™ (Figure 371). When it completes, we can see that the
image tracked across the stage in WATCHOUT™ , matching the motor position! (Figure
372)
Figure 371
57
Figure 372
I hope this gives you a little inspiration to create some stunning stage effects. This tutorial is
just a taste of what can be achieved when Spikemark™ and WATCHOUT™ are used
together in live theatre. As you start using this feature in production, please let us know how
it works for you and send us some video. We love to see this stuff in action.