1
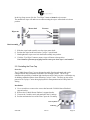
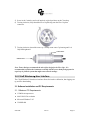
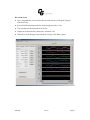
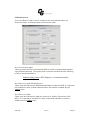
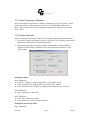
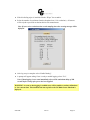
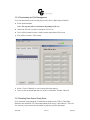
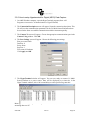
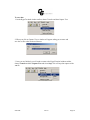
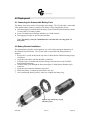
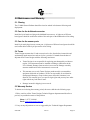
User’s Manual March 30, 2010 P/N: 998-2205 Revision E TURNER DESIGNS 845 W. Maude Ave. Sunnyvale, CA 94085 Phone: (408) 749-0994 FAX: (408) 749-0998 Table of Contents Table of Contents ................................................................................................................................... 2 1.0 Introduction ............................................................................................................................. 5 Important Note Regarding Use of Fluorescein Sensor ...............................5 2.0 Inspection and Setup ........................................................................................................................ 6 2.1 Instrument Checklist.................................................................................................................... 6 2.2 Getting Started............................................................................................................................. 8 2.2.1 Installing Cyclops-7 Sensors ......................................................................................................... 8 2.2.2 Installing the Mechanical Wiper ................................................................................................... 9 Overview .........................................................................................................9 Benefits ............................................................................................................9 Installation ......................................................................................................9 2.2.3 Installing the Flow Cap ............................................................................................................... 10 Overview .......................................................................................................10 Installation ....................................................................................................10 3.0 C-Soft Windows User Interface .................................................................................................. 11 3.1 Software Installation and PC Requirements .............................................................................. 11 3.1.1 Minimum PC Requirements........................................................................................................ 11 3.1.2 Software Installation ................................................................................................................... 12 3.1.3 PC Software Interface ................................................................................................................. 12 3.2 Software Operation.................................................................................................................... 13 3.2.1 Settings Screen ............................................................................................................................ 13 3.2.2 Current Data and Calibration Screen........................................................................................... 14 Current Data.................................................................................................14 Tabular Screen .............................................................................................14 Waveform Screen .........................................................................................15 Calibration Screen........................................................................................16 3.2.2.1 Direct Concentration Calibration ............................................................................................. 17 3.2.2.2 Raw Fluorescence Calibration – Blank Subtracted .................................................................. 18 3.2.2.3 Raw Fluorescence Calibration.................................................................................................. 19 3.2.2.4 Depth Calibration ..................................................................................................................... 19 Atmospheric Offset ......................................................................................19 Atmospheric and Gravity Offset.................................................................19 3.2.3 Log Setup Screen ........................................................................................................................ 20 3.2.4 Downloading and File Management ........................................................................................... 22 3.2.5 Enabling Data Output Ready State.............................................................................................. 22 Integration Cable for Digital (ASCII) Output...........................................23 3.2.6 How to setup Hyperterminal for Digital (ASCII) Data Capture.................................................. 24 4.0 Deployment .................................................................................................................................... 26 4.1 Connecting the Submersible Battery Pack ................................................................................ 26 4.2 Battery Bracket Installation ....................................................................................................... 26 5.0 Maintenance and Warranty............................................................................................................ 27 5.1. Rinsing ..................................................................................................................................... 27 5.2 Care for the bulkhead connector................................................................................................ 27 5.3 Care for the sensor ports............................................................................................................ 27 5.4 Terms......................................................................................................................................... 27 5.5 Warranty Service ....................................................................................................................... 27 5.6 Out-of-Warranty Service ........................................................................................................... 28 Appendix A. Specifications................................................................................................................... 30 Appendix B. C6 Multi-Sensor Platform Operating Instructions .......................................................... 31 Description ....................................................................................................31 Identification.................................................................................................31 Recommended Measurement Practices .....................................................31 Appendix C. C6 Multi-Sensor Platform Wiring Guide......................................................................... 32 Appendix D. Using the Secondary Standard ........................................................................................ 33 Solid Secondary Standard Benefits: ...........................................................33 The Solid Secondary Standard provides a very stable fluorescent signal. It has an adjustment screw so that you can tune the Solid Standard to provide a signal to match a specific sample. Installing the Secondary Standard .....33 Use of the Solid Secondary Standard: ........................................................34 Linear Range and Quenching .....................................................................35 Temperature Considerations ......................................................................35 Equipment Specified as Electrical and Electronic Waste 1.0 Introduction The C6 Multi-Sensor Platform was designed to integrate up to six Cyclops-7 submersible sensors for extended or short-term deployments. The C6 Multi-Sensor Platform provides automatic gain control, calibration, digital data reporting, data logging and digital data output for each Cyclops-7 sensor. The C6 Multi-Sensor Platform comes with factory installed temperature and pressure sensors and is rated to a depth of 600 meters. The C-Soft Windows based user interface allows for intuitive calibration, data loggings set up, and file downloading. Existing Cyclops-7 users can easily integrate their sensors into the C6 MultiSensor Platform. Available Cyclops-7 Sensors: In Vivo Chlorophyll a Blue Green Algae (Phycoerythrin) Blue Green Algae (Phycocyanin) CDOM Turbidity Crude Oil Refined Oil/Fuels Rhodamine Dye Fluorescein Dye (See note below) Optical Brighteners Custom Optics Important Note Regarding Use of Fluorescein Sensor The Fluorescein sensor, when enabled with other sensors, specifically Chlorophyll and Rhodamine sensors, for simultaneous data collection will produce unreliable results. Therefore, the Fluorescein sensor should not be used for simultaneous data collection with Chlorophyll or Rhodamine sensors. All other sensors can be used simultaneously with the Fluorescein sensor. 998-2205 Rev. E Page 5 2.0 Inspection and Setup 2.1 Instrument Checklist The C6 Multi-Sensor Platform package (P/N: 2200-000) includes: C6 Multi-Sensor Platform Factory installed pressure sensor Factory installed temperature sensor Interface cable for PC with 12V power supply Sensor fasteners 8-pin female plug CD includes C-Soft software, user’s manual and quick start guide Sensor fastener Temperature sensor Eyelift holes 8-pin female end plug Pressure sensor 12V power supply Computer interface cable 6-pin male plug 998-2205 Rev. E Page 6 Optional Accessories: Submersible Battery Kit includes charger (P/N: 2200-601) Turner Designs Mechanical Wiper (P/N: 2200-450) and Replaceable Brush (P/N: 2200460) Submersible Battery Bracket (P/N: 2200-603) 6-pin male plugs (P/N: 105-2210) 2 foot Integration Cable (P/N: 2200-160) or 5 meter Integration Cable (P/N: 2200-165) Flow Cap (P/N: 2200-700) Shade Cap (P/N: 2200-500) Booster Kit (P/N: 2200-900) Note: Booster Kits are required for cable lengths greater than 10 meters. Extended Cables: 10 meters (P/N: 105-2595) 25 meters (P/N: 105-2596) 50 meters (P/N: 105-2597) Custom lengths available upon request Flow Cap Submersible battery 998-2205 Rev. E Page 7 Shade Cap Mechanical wiper Battery bracket 2.2 Getting Started 2.2.1 Installing Cyclops-7 Sensors Up to six Turner Designs Cyclops-7 sensors can be installed into the C6 Multi-Sensor Platform. The center port is intended for the optional mechanical wiper only. Follow the instructions below to successfully integrate your Cyclops-7 sensor. 1. Place the fastener on one of the Cyclops-7 ports of the C6 Multi-Sensor Platform and rotate to tighten. Make sure not to over tighten. 2. Align the 6-pin male end of the Cyclops-7 sensor with the C6 Multi-Sensor Platform port and fastener. 3. Hold the Cyclops-7 in place and rotate the remaining ring to tighten. This will lock the Cyclops-7 into position. 4. Follow the same installation instructions for the remaining Cyclops-7 sensors. 5. Install a 6-pin male plug into any unused port on the C6 Multi-Sensor Platform. *The center port is for the mechanical wiper only 998-2205 Rev. E Page 8 Cyclops-7 Fastener 2.2.2 Installing the Mechanical Wiper Overview The C6 Multi-Sensor Platform’s mechanical wiper is an optional accessory that can be easily installed to eliminate bio-fouling during extended deployments. The wiper uses nondestructive brush material to clean Cyclops-7 sensors allowing for accurate readings under extreme bio-fouling conditions. Users are able to select the number of wiper rotations before sampling. Benefits Limits debris and bio-fouling organisms from interfering with readings Easy installation Stainless steel housing prolongs motor life Easy brush replacement design Adjustable wiping revolutions Installation The mechanical wiper has a 6-pin male end that fits into the center port on the C6 MultiSensor Platform and can be locked into place, limiting movement during transportation, deployment, and retrieval. 1. Place the fastener on the center port of the C6 Multi-Sensor Platform and rotate to tighten. Make sure not to over tighten. 2. Align the 6-pin male end of the mechanical wiper with the C6 Multi-Sensor Platform center port and fastener. 3. Hold the mechanical wiper in place and rotate the remaining ring to tighten. This will lock the wiper into position. 4. Open the C-Soft software (See section 3.0). 998-2205 Rev. E Page 9 In the Log Setup screen click the “Test Wiper” button to home the wiper motor. The mechanical wiper will make one revolution setting the wipers motor shaft to its home position. Motor shaft Fastener Wiper nut Brush assembly 5. Slide the wiper brush assembly over the wiper motor shaft. 6. Position the wiper brush between the Cyclops-7 optical heads. 7. Hand tighten the wiper nut to lock the brush assembly into position. 8. Click the “Test Wiper” button to ensure wiper will home to that position. Note: Install a 6-pin waterproof plug into the center port when wiper is not installed 2.2.3 Installing the Flow Cap Overview The C6 Multi-Sensor Flow Cap was designed to enable flow through mode and can be configured with other instruments with online flow through systems. The flow cap eliminates the possibility of ambient light interference and it can be used as a calibration cup for holding standard solutions when calibrating Cyclops-7 units. The flow cap also offers protection for Cyclops-7 units during deployment or transportation and will help limit biofouling. Installation 1) Use a screwdriver to remove the screws that fasten the C6 Multi-Sensor Platform’s support bracket. 2) Remove the C6 Multi-Sensor Platform’s support bracket. 3) Unscrew the 3 stainless steel rods attached to the C6 endcap. 4) Position and mate the base of the Flow Cap to the C6 endcap. Flow Cap Base C6 Endcap 998-2205 Rev. E Page 10 5) Screw in the 3 stainless steel rods into their original positions on the C6 endcap. 6) Turning clockwise, fully thread the Flow Cap housing onto the Flow Cap base connector. 7) Turning clockwise, thread the Flow Cap’s endcap to the Flow Cap housing until it is fully hand tightened. In-Flow Valve Outflow Valve Note: Turner Designs recommends the above flow design for the Flow Cap. It is recommended to position the instrument vertically with the sensor head facing upward to expel any air from the system that might cause skewed readings. 3.0 C-Soft Windows User Interface The C-Soft Windows based user interface allows for intuitive calibration, data loggings set up, and file downloading. 3.1 Software Installation and PC Requirements 3.1.1 Minimum PC Requirements 133MHz microprocessor 600 X 800 VGA resolution Microsoft Windows 95 32 MB RAM 998-2205 Rev. E Page 11 3.1.2 Software Installation 1. Exit all Windows programs 2. Insert the C-Soft CD (also located on the Turner Designs Software webpage, http://www.turnerdesigns.com/t2/sw/main.html). 3. Open the C-Soft software folder and double click on the setup icon. 4. Double click on the “setup.exe” icon to begin installation. 5. The software will automatically be installed in the PC’s (C:/Program Files/C6) folder unless user selects alternate location. 6. After restarting the PC double click on the “C-Soft" icon located on the desktop. Note: You may receive a warning message asking if you want to unblock messages, select "Unblock" 3.1.3 PC Software Interface 1. Connect the 9-pin serial end of the interface cable into the serial port on the back of the PC. Note: If your computer only has USB ports we recommend purchasing a USB to serial adapter cable. (See Turner Designs Support webpage for recommendations). 2. Connect the 8-pin female end of the interface cable to the 8-pin male connector on the C6 Multi Sensor Platform. 3. Connect the interface cable’s 12V pin to the 12V power supply. 4. Plug the 12V power supply into a power source. 5. Wait for initialization process to complete. 6. The connection icon, located on the upper right of the screen, will turn green if connected. Note: If the connection icon does not turn green disconnect and reconnect power. 998-2205 Rev. E Page 12 3.2 Software Operation 3.2.1 Settings Screen The Settings Screen allows users to set the time and date, identify each Cyclops-7, update serial numbers and select sensors to be enabled. Users can manually set the date and time or choose to synchronize the C6 Multi-Sensor Platform to the PC date and time. Each channel (1-6) in the Settings Screen has a port associated with it on the C6 MultiSensor Platform that is numerically labeled (1-6) respectively. Click on the box adjacent to the channel to enable channel operation. If there is no sensor installed users will be unable to select that channel. Channels can be renamed using the dropdown selections or by manually entering a name. Channels can also be named using Cyclops-7 serial numbers. Settings will automatically be saved after exiting the Settings screen. 998-2205 Rev. E Page 13 3.2.2 Current Data and Calibration Screen The Current Data Screen allows users to view real-time data acquisition, in both tabular and waveform formats as well as conduct calibrations for each channel. Current Data Sensor labels are displayed but cannot be changed in the Current Data screen. Real-time values are displayed next to each channel and in the adjacent Data Table. A calibration button is available for all Cyclops-7 sensors and the depth sensor. Real-time data can be saved by selecting the “Start Data Capture” button. Users will be prompted to enter a file name and file location. Data files will be saved in (*.csv) format. Tabular Screen Real-time data including time, date, and units are continuously scrolling on the tabular screen for enabled sensors. Each sensor identification name will appear in the associated column headings. If units are not selected during calibration a relative fluorescence units (RFU) label will appear. 998-2205 Rev. E Page 14 Waveform Screen Users can graphically view real-time data for each sensor by clicking the “Display Waveform” box. Sensor identification name and units will be displayed on the Y-axis. Time and date will be displayed on the X-axis. Graphs can be autoscaled by clicking the “Autoscale” box. Data can be saved during waveform mode by clicking “Start Data Capture” 998-2205 Rev. E Page 15 Calibration Screen Users can calibrate Cyclops-7 sensors in either the direct concentration mode, raw fluorescence mode, or blank subtracted raw fluorescence mode. Direct Concentration Mode Values reported in the Direct Concentration Mode are scaled to a predetermined standard value and blank subtracted. The equation used to calculate concentrations after calibrating to Direct Concentration Mode is: Standard Value (units) x RFU Response = Concentration (units) Standard RFU Raw Fluorescence Mode Blank Subtracted Values in the Raw Fluorescence Blank Subtracted Mode are noted as RFUB. It is important to note that these values are blank subtracted but are not scaled to a standard, they are relative values. Raw Fluorescence Mode Values in the Raw Fluorescence Mode are referred to as “Relative Fluorescence Units” (RFU). It is important to note that these values are not blank subtracted or scaled to a standard, they are relative values. 998-2205 Rev. E Page 16 3.2.2.1 Direct Concentration Calibration Following steps 1-5 will ensure values are reported as Blank subtracted Concentrations in units of choice. See Appendix B for recommended practices. Step 1: Blanking Place the C6 Multi-Sensor Platform and Cyclops-7 sensors in a blank solution. Note: A blank solution is a solution without the fluorophore of interest (i.e. de-ionized water, artificial seawater, or filtered seawater) Note: Ensure the Cyclops-7 sensors are free of bubbles Wait until “Current RFU” readings have stabilized then select the “Set Blank” button to set the blank value. Future measurements for this sensor will be blank subtracted based on the blank response recorded during calibration. Step 2: Standard Value and Units Place the C6 Multi-Sensor Platform and Cyclops-7 sensors in a standard solution or use a secondary solid standard (see Appendix D for more information on solid standards). Note: Not all sensors are designed with solid standards. See the Cyclops-7 manual for available secondary solid standards. Enter the known concentration value of the standard solution in the “Standard Value” box. If the concentration is not known, enter an arbitrary value (i.e. 100). Future measurements will be calculated based on the correlated response to the standard value. Enter manually or select desired units from the dropdown menu. Note: Do not choose or enter “RFUB” if Direct Concentration Mode is used. Step 3: Set Standard When readings in “Current RFU” box have stabilized, select the “Set Standard” button. Step 4: Optional Temperature Compensation Temperature compensation is optional and allows the user to automatically compensate to the factory installed temperature sensor. Temperature compensation is available for Chlorophyll a and Rhodamine sensors only. Temperature is displayed in degree Celsius. Click on the “Temperature Compensation” box. Select either Chlorophyll a or Rhodamine fluorophore from the dropdown menu. Data will now be corrected for temperature fluctuations. 998-2205 Rev. E Page 17 The temperature compensation coefficients for each fluorophore are listed below. Fluorophore Coefficient Rhodamine 0.026 per degree C Exponential Chlorophyll a 1.4% per degree C Linear Step 5: Save Calibration After calibration is complete select “Save Calibration”. Data for the selected sensor will now be calibrated. 3.2.2.2 Raw Fluorescence Calibration – Blank Subtracted Following steps 1-5 will ensure values are reported as Blank subtracted Relative Fluorescence Units (RFUB). See Appendix B for recommended practices. Step 1: Blanking Place the C6 Multi-Sensor Platform and Cyclops-7 sensors in a blank solution. Note: A blank solution is a solution without the fluorophore of interest (i.e. de-ionized water, artificial seawater, or filtered seawater) Note: Ensure the Cyclops-7 sensors are free of bubbles Wait until “Current RFU” readings have stabilized then select the “Set Blank” button to set the blank value. Future measurements for this sensor will be blank subtracted based on the blank response recorded during calibration. Step 2: Selecting Units Select RFUB from the units’ dropdown menu. Note: Do not enter a value in the standard value box. Step 3: Skip and go to Step 4 Step 4: Optional Temperature Compensation – Follow same steps under the Direct Calibration procedure Step 5: Save Calibration After calibration is complete select “Save Calibration”. Data for the selected sensor will now be in relative fluorescence units and blank subtracted. 998-2205 Rev. E Page 18 3.2.2.3 Raw Fluorescence Calibration In the Current Data screen select the “calibrate” button next to a specific Cyclops-7 sensor. At the bottom of the Calibration Screen, click to use “Uncalibrated Raw Fluorescence Mode”. Data for that sensor will be uncalibrated and reported as “Relative Fluorescence Units” (RFU). 3.2.2.4 Depth Calibration Depth is displayed in meters only. There are two calibration options for depth calibration: 1. The first uses only the atmospheric pressure as an offset. This is suitable for any shallow application, including most fresh water applications. 2. The second compensates for gravity variations with latitude, as designed from the UNESCO Technical Papers in Marine Science #44. This method assumes 0C and 35PSU salinity. Atmospheric Offset Step 1 (Method 1): Select the “Calibrate” button for depth in the “Current Data” screen. Pressure in PSI will be displayed in the “Current Pressure” window. After “Current Pressure” readings are stable at desired location select “Set Zero”. Step 2 (Method 1): Select “Atmospheric offset only”. Step 3 (Method 1): Select “Save Calibration” button. Future depth values will be scaled to the offset. Atmospheric and Gravity Offset Step 1 (Method 2): 998-2205 Rev. E Page 19 Select the “Calibrate” button for depth in the “Current Data” screen. Pressure in PSI will be displayed in the “Current Pressure” window. After “Current Pressure” readings are stable at desired location select “Set Zero”. Step 2 (Method 2): Select “Atmospheric and gravity offset”. Enter the latitude. Step 3 (Method 2): Select “Save Calibration” button. Future depth values will be scaled to the offset. 3.2.3 Log Setup Screen The Log Setup screen allows the user to configure a logging session, activate the wiper, and enable logging. The C6 Multi-Sensor Platform can log just over 64,000 lines of data. Enter a log start date (MM/DD/YYYY) and time (HH:MM:SS). Enter the sampling interval (HH:MM:SS). The minimum sampling interval is 1 second. 998-2205 Rev. E Page 20 If the bio-fouling wiper is installed click the “Wiper” box to enable. Select the number of revolutions from the dropdown box (1-10 revolutions). All sensors will be wiped at specified revolutions before each measurement. Note: If users select revolutions that exceed sampling interval a warning message will be displayed. After log set up is complete select “Enable Datalog”. A prompt will appear asking if user is ready to enable logging, select “Yes”. Note: If data logging is set to start immediately, there will be a minimum delay of 100 seconds before startup after power has been supplied. WARNING! As soon as data logging is enabled users will be unable to conduct calibrations or view current data. This should be the last step before the C6 Multi-Sensor Platform is deployed. 998-2205 Rev. E Page 21 3.2.4 Downloading and File Management Users can download new and exisiting files saved in the C6 Multi-Sensor Platform. Select Download Data. Note: This step may take several minutes depending on file size. Choose the files to be saved by clicking the “Save” box. Users will be promted to chose a folder location where data will be saved. Files will be saved in a .CSV format. Select “Clear C6 Datalog” to erase existing data from memory. Users are able to upload data and view in the “Current Data” window if desired. 3.2.5 Enabling Data Output Ready State Users interested in integrating the C6 Multi Sensor Platform into CTDs or Third Party Platforms must enable the C6’s Data Output Ready State using C-Soft Software. There are five necessary steps to ensure the instrument is properly setup for data output: 998-2205 Rev. E Page 22 1) Set the instrument’s clock to PC or local time in the Settings Tab 2) Select the sensors you expect to use during sampling 3) Calibrate selected sensors for either Direct Concentration Mode or Raw Fluorescence Units Blanked (RFUB) Mode (see section 3.2.2) 4) Set the start time, sampling, and wiping intervals in the Log Setup Tab. Note: wiping interval is optional and depends on the sampling interval (see section 3.2.3) 5) Click the ‘Enable Datalog’ button followed by the ‘Yes’ button to enable the Data Output Ready State A few seconds after the ‘Yes’ button has been clicked to enable the Data Output Ready State, the C-Soft program will automatically shut down and users must disconnect power and serial connections. The instrument is now in the Data Output Ready State and will remain in that state so long as C-Soft is not used to communicate with the instrument. Note: As soon as C-Soft is used to communicate with the instrument, users will need to re-set the parameter settings in the Log Setup (section 3.2.3) and again enable datalog to put the instrument into the Data Output Ready State. When power is supplied to the instrument while it is in the Data Output Ready State, it will begin streaming data after a 100 second delay. If power is cycled (i.e. disconnected and reconnected) please allow 100 seconds for the data stream to begin. The C6 Multi Sensor Platform’s standard output is in digital (ASCII) format. Integration Cable for Digital (ASCII) Output The Integration Cable is recommended for digital integrations with CTDs or Third Party Platforms. This cable is designed so that flow control is disabled; therefore it may only be used for integrations and cannot be used for communicating with the C3. As long as the C3 is in the Data Output Ready State, power is supplied to the instrument, and a 100 second delay has been allowed, the C3 will output digital data continuously without interruptions if the integration cable is used. Using any other cable for digital integrations may cause interruptions caused by hardware flow control. The Integration Cable has 3 connectors: 1) A serial DB9 plug (RS232) 2) A female plug for supplying power to the instrument 3) An 8-pin female connector for connecting to the C3 And can be ordered in either a 2 foot (PN: 2200-160) or 5 meter (PN: 2200-165) cable length. Note: The Integration Cable will have a yellow band which distinguishes it from the standard Interface Cable used to communicate with the C3 Submersible Fluorometer. After the instrument has been calibrated proceed to Log Setup (Section 3.2.3). After logging has been enabled, the C-Soft software will automatically shut down. Users should disconnect power and communicate with the C6 Multi-Sensor Platform via HyperTerminal serial terminal emulator. 998-2205 Rev. E Page 23 3.2.6 How to setup Hyperterminal for Digital (ASCII) Data Capture 1. On a MS Windows computer, open the HyperTerminal program (StartAll ProgramsAccessoriesCommunications HyperTerminal) 2. The Connection Description screen will appear. Name the connection description. This file will save the communication parameters for the C6 Multi-Sensor Platform and can be used in the future to establish communication with the instrument quickly. 3. The Connect To screen will appear. Choose the appropriate communications port in the Connect Using window. Click OK. 4. The Port Settings screen will appear. Choose the following port settings; Bits per second: 9600 Data bits: 8 Parity: None Stop bits: 1 Flow control: Hardware Click Apply and OK 5. The HyperTerminal window will appear. You are now ready to connect C6 MultiSensor Platform to a power source. Data will be displayed at set intervals, in the HyperTerminal window, after a 100 second delay or at the specified log start time. Most applications will integrate streaming data. Below are instructions on how to save streaming data on a PC. 998-2205 Rev. E Page 24 To save data: 1. On the HyperTerminal window toolbar, choose Transfer and then Capture Text 2. When you click on Capture Text, a window will appear asking you to name and save the .txt file to the location of interest. 3. Once you are finished, you will need to return to the HyperTerminal window toolbar, choose Transfer and then Capture Text and select Stop. This will stop data capture to the .txt file. 998-2205 Rev. E Page 25 4.0 Deployment 4.1 Connecting the Submersible Battery Pack The Battery Pack comes with a 12-inch cable and a charger. The 12-inch cable is not needed if the optional battery bracket is installed. The battery is fully charged after 8 hours. After data logging is enabled attach the battery to the C6 Multi-Sensor Platform with the 12-inch cable or via battery bracket. Secure C6 Multi-Sensor Platform and battery to a fixed structure. Data logging will begin at specified time and date. Note: The battery is rated for 10,000 data lines, each data line can range from 3-9 data points 4.2 Battery Bracket Installation The optional battery bracket was designed for easy self-contained compact deployment of the C6 Multi-Sensor Platform. The 12-inch cable is not needed if the battery bracket is installed. 1. Remove the 2 eyelifts located at the top of the C6 Multi-Sensor Platform housing using a screwdriver. 2. Align the bracket holes with the threaded eye lift holes. 3. Using the screws, included in the bracket package, fasten the brace to the C6 MultiSensor Platform housing. 4. Glide the battery pack through the brace towards the C6 Multi-Sensor Platform 8-pin connector. 5. Align the 8-pin connector and battery and secure. 6. Ensure the battery is completely mated before next step. 7. After installing the battery pack use a hex key to tighten the battery ring. Tighten ring with hex key to grip the battery pack 998-2205 Rev. E Page 26 5.0 Maintenance and Warranty 5.1. Rinsing The C6 Multi-Sensor Platform should be rinsed or soaked in freshwater following each deployment. 5.2 Care for the bulkhead connector Install the 8-pin female end plug to the bulkhead between uses. A light coat of Silicone based grease should be used on the rubber of the male pins of the bulkhead to aid in sealing. 5.3 Care for the sensor ports Install 6-pin male plugs into any vacant port. A light coat of Silicone based grease should be used on the rubber of the 6-pin port end to aid in sealing. 5.4 Terms Turner Designs warrants the C6 and accessories to be free from defects in materials and workmanship under normal use and service for a period of 12 months from the date of shipment from Turner Designs with the following restrictions: Turner Designs is not responsible for replacing parts damaged by accident or neglect. Your instrument must be installed according to instructions in the User’s Manual. Damage from corrosion is not covered. Damage caused by customer modification of the instrument is not covered. This warranty covers only Turner Designs products and is not extended to equipment used with our products. We are not responsible for accidental or consequential damages, except in those states where this limitation is not allowed. This warranty gives you specific legal rights and you may have other rights which vary from state to state. Damage incurred in shipping is not covered. 5.5 Warranty Service To obtain service during the warranty period, the owner shall take the following steps: 1. Write, email or call the Turner Designs Technical Support department and describe as precisely as possible the nature of the problem. Phone: 1 (877) 316-8049 Email: [email protected] 2. Carry out any adjustments or tests as suggested by the Technical Support Department. 998-2205 Rev. E Page 27 3. If proper performance is not obtained you will be issued a Return Materials Authorization number (RMA) to reference. Package the unit, write the RMA number on the outside of the shipping carton, and ship the instrument, prepaid, to Turner Designs. If the failure is covered under the warranty terms, the instrument will be repaired and returned free of charge, for all customers in the contiguous continental United States. For customers outside of the contiguous continental United States who purchased equipment from one of our authorized distributors, contact the distributor. If you purchased directly, contact us. We will repair the instrument at no charge. Customer pays for shipping duties and documentation to Turner Designs. Turner Designs pays for return shipment (custom duties, taxes and fees are the responsibility of the customer). 5.6 Out-of-Warranty Service Follow steps for Warranty Service as listed above. If our Technical Support department can assist you by phone or correspondence, we will be glad to, at no charge. Repair service will be billed on a fixed price basis, plus any applicable duties and/or taxes. Shipment to Turner Designs should be prepaid. Your bill will include return shipment freight charges. Address for Shipment: Turner Designs, Inc. 845 W. Maude Ave. Sunnyvale, CA 94085 998-2205 Rev. E Page 28 Equipment Specified as Electrical and Electronic Waste 998-2205 Rev. E Page 29 Appendix A. Specifications C6 Multi-Sensor Platform Weight in Air 2.7 kg 6.0 lbs (without sensors, submersible battery, or wiper) Weight in Water 1.6 kg 3.4 lbs Length 25.8 cm 10.2 in Length with Sensors Attached 33.8 cm 13.3 in Diameter 10.2 cm 4.0 in Material 316 Stainless Steel; Delrin Temperature -2 to 50 degrees C. Depth 600 meters External Power 8 to 30 VDC Signal Output Digital Interface RS232 (USB Adaptor) Maximum Sampling Rate 1 second Nonvolatile Memory 64,000 Data Lines Submersible Battery Pack Battery Lithium-Ion Weight in Air 0.75 kg (1.65 lbs) Weight in Water 0.22 kg (0.50 lbs) Length 13.46cm (5.3 in) Diameter 7 cm (2.75 in) Material Delrin Temperature -2 to 50 degrees C. Depth 600 meters Capacity 2,200 mAH Voltage Output 14.8V nominal Protection Features Protects against: overcharge, over-discharge,overheating, short-circuiting 998-2205 Rev. E Page 30 Appendix B. C6 Multi-Sensor Platform Operating Instructions Description The Turner Designs C6 Multi-Sensor Platform can be used with Cyclops-7 sensors for many different applications. It can also be integrated into a multi-parameter system. It is capable of logging and storing data and uses algorithms to compute direct concentrations of fluorophores. Identification Each Cyclops-7 Sensor is identified by a letter stamped into the connector. “C” = Chlorophyll, “U” = CDOM, “O” = Crude Oil, “F” = Fluorescein, “B” = Optical Brighteners, “P” = Phycocyanin “E” = Phycoerythrin, “R” = Rhodamine, “T”= Turbidity, and “G” = Refined Oil/Fuels. Recommended Measurement Practices The following steps will improve the accuracy and repeatability of your measurements, especially at low concentration levels: 1. Use a Glass Beaker for your water samples. (Avoid plastic beakers – plastic may fluoresce and might interfere with measurements). 2. Place the glass beaker on a non-reflective surface, preferably black. 3. Ensure that the sensor is more than 3 inches above the bottom of the glass beaker. 4. Ensure that the sensor is in the center of the glass beaker, and has more than 2 inches clearance between the sensor and the inside surface of the beaker. 5. Check that the optical surface of the sensor is free of air bubbles. Calibrated Sensor >2 inches all around Glass Beaker >3 inches No Air Bubbles On Optical Surface 998-2205 Dark/Black NonReflective Surface Rev. E Page 31 Appendix C. C6 Multi-Sensor Platform Wiring Guide The C6 Multi-Sensor Platform outputs digital data in a format that can be read by CSoft software or a terminal emulator program. It can be integrated into larger multi parameter systems such as CTDs or buoys. An 8-pin impulse cable provides two end connections: 1) a 9-pin RS232 serial port for connection to a PC or laptop computer and 2) a 12V port for supplying power to the unit. C6 Multi Sensor Platform bulkhead and serial port connectors Sub D Connector 8 2 1 7 5 4 3 2 1 3 4 6 9 5 8 7 6 Wire Guide 998-2205 Pin Out Color C6 Function 1 Black V BATT (+) 2 White V BATT (-) 3 4 5 6 7 8 Red Green Blue Brown Yellow Orange GND RX TX DTR & DSR RTS & CTS N/A Corresponding Sub D Connector Pin Power Connector Cable–Center Pin (+) Power Connector Cable– Housing (-) PIN 5 PIN 2 PIN 3 PIN 4, 6 PIN 7, 8 N/A Rev. E Page 32 Appendix D. Using the Secondary Standard The following information will describe how to use the Solid Secondary Standard, P/N 2100-900, with Cyclops-7 sensors. Note: The Turbidity Cyclops does not have a solid secondary standard. Solid Secondary Standard Benefits: 1. It can be used in place of a primary liquid standard once a correlation between a primary standard and the solid standard has been established. 2. It can be used to check the stability of the instrument, and/or check for loss in sensitivity resulting from the growth of bio-fouling organisms on the sensor optics. The Solid Secondary Standard provides a very stable fluorescent signal. It has an adjustment screw so that you can tune the Solid Standard to provide a signal to match a specific sample. Installing the Secondary Standard 1. Before installing the Solid Standard you must ensure that the optical surface of the Cyclops-7 is completely clean and dry. The Solid Standard is indexed and it must be installed so that the indexing is precisely aligned for proper use (see below). 2. To install, place the Solid Standard on to the optical end of the Cyclops-7. Cyclops -7 Solid Standard indexing mark Align the index mark and indexing ball when installing Cyclops-7 in the Solid Secondary Standard. Solid Standard indexing ball Lock Nut Insert the supplied green screwdriver through the calibration hole in the locking nut to reach the adjustment screw. Adjustment screw is located under the locking nut 998-2205 Rev. E Page 33 3. With the Solid Standard fully mated with the sensor head, rotate in either direction until you feel the Solid Standard indexing ball click into the indexing mark on the Cyclops-7. 4. To begin, use a flat-head screwdriver to unscrew the locking nut as far as it will go. 5. Next, to change the signal level, use the green screwdriver provided and insert the blade through the hole in the locking nut. Rotate it until it engages with the adjustment screw that is beneath the locking nut. Now the screw can be used to adjust the signal level as necessary. 6. Once the desired reading has been obtained, the locking nut should be screwed down so that the adjustment screw is held firmly in place. 7. Note that the response of every solid standard is unique. Hence, a new correlation must be determined for every sensor. For future identification, use the “ID” space on the label for a unique identifier for the Secondary Standard. Use of the Solid Secondary Standard: The Solid Secondary Standard can be use to: Check signal stability Determine drift Recalibrate 1. To establish a correlation between a known concentration and it’s respective fluorescence output immerse the sensor in a sample with a known concentration of your fluorophore. 2. Dry off the C3 Submersible Fluorometer’s optics, attach the Solid Standard, and adjust the Solid Standard to produce the same fluorescence output value from the sensor as in step 1, (turning the Secondary Standard adjustment screw clockwise produces a higher signal). 3. Now your Solid Secondary Standard has been correlated to a known concentration and as long as it is no longer adjusted, stored and used properly that signal will remain a stable reference point. 4. Comprehensive information on fluorescence applications http://www.turnerdesigns.com/t2/doc/appnotes/main.html#fluorescent Note: There are no Solid Secondary Standards available for the Turbidity or UV optical sensors. 998-2205 Rev. E Page 34 Linear Range and Quenching The linear range is the concentration range in which the Cyclops-7 output is directly proportional to the concentration of the signal. The linear range begins with the smallest detectable concentration and spans to an upper limit (concentration) that is dependent upon the properties of the material, filters used, and path length. A non-linear relationship is seen at very high concentrations where the signal does not increase at a constant rate in comparison to the change in concentration, see figure below. At even higher concentrations, the signal will decrease even though the sample concentrations are continuing to increase. This effect is known as “signal quenching”. Linearity can be checked by diluting a sample 1:1 or some other convenient ratio. If the sample is still in the linear range, the reading will decrease in direct proportion to the dilution. If the reading does not decrease in direct proportion to the dilution, or if the reading increases, the sample is beyond the linear range. Fluorometer Reading Fluorometer Response Curve Sample Quenching Region Graph showing Linear and Quenching Regions of the sample’s response Sample Linear Region Sample Concentration Temperature Considerations Fluorescence is temperature sensitive. As the temperature of the sample increases, the fluorescence decreases. For greatest accuracy, record the sample temperature and correct the sensor output for changes in temperature. For further information on how temperature, light, water quality and the physiological state of the algal cells can all affect the measurement of chlorophyll a, please refer to the application section of Turner Designs’ web site at the following URL: http://www.turnerdesigns.com/esupport/understanding.html 998-2205 Rev. E Page 35