1
6-SERIES
DRINKING
WATER
SYSTEMS
600DW-B Sonde
6920DW Sonde
650 MDS Display/Logger
6500 Process Monitor
Environmental
Monitoring
Systems
SAFETY NOTES
TECHNICAL SUPPORT AND WARRANTY INFORMATION
Contact information for technical support and warranty information on YSI’s Environmental
Monitoring Systems products can be found in Section 8, Warranty and Service Information.
COMPLIANCE
When using the YSI 6-Series sondes in a European Community (CE) country, please be aware
that electromagnetic compatibility (EMC) performance issues may occur under certain
conditions, such as when the sonde is exposed to certain radio frequency fields.
If you are concerned with these issues, consult the Declaration of Conformity that was enclosed
with your instrument. Specific conditions where temporary sensor problems may occur are listed
in this document.
If you are unable to locate the Declaration of Conformity that was shipped with your instrument,
contact your local YSI representative, or YSI Customer Service in Yellow Springs, Ohio for a
copy of the document. See Section 8, Warranty and Service Information for contact
information.
SPECIFICATIONS
For general specifications for all YSI Environmental Monitoring Systems products included in
this manual, please see Appendix M, Specifications.
GENERAL SAFETY CONSIDERATIONS
For Health and Safety issues concerning the use of the calibration solutions with the sondes,
please see Appendix A, Health and Safety.
NOTICE
Information contained in this manual is subject to change without notice. Effort has been made to
make the information contained in this manual complete, accurate, and current. YSI shall not be
held responsible for errors or omissions in this operations manual.
WARNING:
When caring for your sonde, remember that the sonde is sealed at the factory, and there is never a
need to gain access to the interior circuitry of the sonde. In fact, if you attempt to disassemble the
sonde, you would void the manufacturer's warranty.
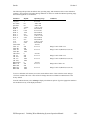
TABLE OF CONTENTS
SECTION 1 INTRODUCTION
1.1 ABOUT YSI
1.2 HOW TO USE THIS MANUAL
1.3 UNPACKING AND INSPECTION
1-1
1-1
1-2
SECTION 2 6920DW AND 600DW-B SONDES
2.1 GETTING STARTED
2.2 CONNECTING YOUR SONDE
2.3 PREPARING THE SONDE FOR USE
2.4 ECOWATCH FOR WINDOWS – GETTING STARTED
2.5 SONDE SOFTWARE SETUP
2.6 GETTING READY TO CALIBRATE
2.7 TAKING READINGS
2.8 USING ECOWATCH TO UPLOAD AND ANALYZE DATA
2.9 SONDE MENU
2.10 CARE, MAINTENANCE, AND STORAGE
2-1
2-2
2-5
2-18
2-18
2-26
2-39
2-45
2-59
2-95
SECTION 3 650 MDS DATA LOGGER
3.1 INTRODUCTION
3.2 GETTING STARTED
3.3 SETTING UP THE 650
3.4 SONDE MENU INTERFACE
3.5 LOGGING DATA WITH THE 650
3.6 MANAGING 650 FILES
3.7 UPLOADING DATA FROM SONDES
3.8 USING GPS WITH 650
3.9 USING THE 650 BAROMETER
3.10 UPGRADING 650 SOFTWARE
3.11 TROUBLESHOOTING
3.12 FERRITE BEAD INSTALLATION
3.13 SAFETY CONSIDERATIONS
3.14 650 MDS SPECIFICATIONS
3-1
3-1
3-18
3-21
3-27
3-46
3-51
3-51
3-53
3-55
3-56
3-57
3-58
3-61
SECTION 4 ECOWATCH FOR WINDOWS
4.1 INTRODUCTION
4.2 DATA ACQUISITION AND ANALYSIS
4.3 ECOWATCH MENU
4-1
4-7
4-12
SECTION 5 PRINCIPLES OF OPERATION
5.1 CONDUCTIVITY
5.2 SALINITY
5.3 TOTAL DISSOLVED SOLIDS (TDS)
5.4 OXIDATION REDUCTION POTENTIAL (ORP)
5.5 pH
5.6 TEMPERATURE
5.7 FREE CHLORINE
5.8 NITRATE
5.9 AMMONIUM AND AMMONIA
5.10 CHLORIDE
5.11 TURBIDITY
5.12 CHLOROPHYLL
5.13 RHODAMINE WT
5-1
5-2
5-2
5-3
5-4
5-5
5-5
5-9
5-10
5-12
5-14
5-16
5-23
SECTION 6 TROUBLE SHOOTING
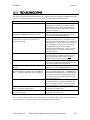
6.1 CALIBRATION ERRORS
6.2 SONDE COMMUNICATION PROBLEMS
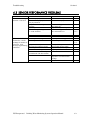
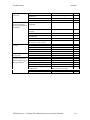
6.3 SENSOR PERFORMANCE PROBLEMS
6-1
6-2
6-3
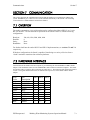
SECTION 7 COMMUNICATION
7.1 OVERVIEW
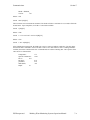
7.2 HARDWARE INTERFACE
7.3 RS-232 INTERFACE
7.4 SDI-12 INTERFACE
7-1
7-1
7-2
7.2
SECTION 8 WARRANTY AND SERVICE INFORMATION
8.1 LIMITATIONS OF WARRANTY
8.2 AUTHORIZED SERVICE CENTERS
8.3 CLEANING INSTRUCTIONS
8-1
8-2
8-2
APPENDIX A HEALTH AND SAFETY
A-1
APPENDIX B REQUIRED NOTICE
B-1
APPENDIX C ACCESSORIES AND CALIBRATION STANDARDS
C-1
APPENDIX D
D-1
EMC PERFORMANCE
APPENDIX E SPECIFICATIONS
E-1
APPENDIX F QUICK START GUIDE TO DRINKING WATER APPLICATIONS
F-1
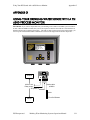
APPENDIX G USING YOUR DW SONDE WITH A YSI 6500 PROCESS MONITOR
G-1
APPENDIX H FREQUENTLY ASKED QUESTION ABOUT DW SYSTEMS
H-1
Introduction
Section 1
SECTION 1 INTRODUCTION
1.1 ABOUT YSI INCORPORATED
From a three-man partnership in the basement of the Antioch College science building in 1948, YSI has
grown into a commercial enterprise designing and manufacturing precision measurement sensors and
control instruments for users around the world. Although our range of products is broad, we focus on four
major markets: water testing and monitoring, health care, bioprocessing, and OEM temperature
measurement.
In the 1950s, Hardy Trolander and David Case made the first practical electronic thermometer using a
thermistor. This equipment was developed to supply Dr. Leland Clark with a highly sensitive and precise
temperature sensor for the original heart-lung machine. The collaboration with Dr. Clark has been critical
to the success of the company. In the 1960s, YSI refined a Clark invention, the membrane covered
polarographic electrode, and commercialized oxygen sensors and meters which revolutionized the way
dissolved oxygen was measured in wastewater treatment plants and environmental water. Today,
geologists, biologists, environmental enforcement personnel, officials of water utilities and fish farmers
recognize us as the leader in dissolved oxygen measurement.
In the 1970s, YSI again worked with Clark to commercialize one of his many inventions, the enzyme
membrane. This development resulted in the first practical use of a biosensor, in the form of a membrane
based on immobilized glucose oxidase, to measure blood sugar accurately and rapidly. In the next few
years, this technology was extended to other enzymes, including lactate oxidase for applications in
biotechnology, health care, and sports medicine.
In the early 1990s, YSI launched a line of multi-parameter water monitoring systems to address the
emerging need to measure non-point source pollution. Today we have thousands of instruments in the field
that operate with the push of a button, store data in memory, and communicate with computers. These
instruments (described in this manual) are ideal for profiling and monitoring water conditions in industrial
and wastewater effluents, lakes, rivers, wetlands, estuaries, coastal waters, and monitoring wells. If the
instrument has ‘on board’ battery power, it can be left unattended for weeks at a time with measurement
parameters sampled at your setup interval and data securely saved in the unit's internal memory. The fast
response of YSI’s sensors make the systems ideal for vertical profiling, and the small size of some our
sondes allows them to fit down 2-inch diameter monitoring wells. All of YSI’s multi-parameter systems for
surface and groundwater feature the YSI-patented Rapid Pulse Dissolved Oxygen Sensor, which exhibits
low-stirring dependence and provides accurate results without an expensive, bulky, and power-intensive
stirrer.
YSI has established a worldwide network of selling partners in 54 countries that includes laboratory supply
dealers, manufacturers' representatives, and YSI’s sales force. A subsidiary, YSI UK, distributes products
in the United Kingdom, a sales office in Hong Kong supports YSI’s distribution partners in Asia Pacific,
and YSI Japan supports distribution partners in Japan.
Through an employee stock ownership plan (ESOP), every employee is one of the owners. In 1994, the
ESOP Association named YSI the ESOP Company of the Year. YSI is proud of its products and are
committed to meeting or exceeding customers' expectations.
1.2 HOW TO USE THIS MANUAL
The manual is organized to let you quickly understand and operate the YSI 6-Series drinking water (DW)
systems. However, it cannot be stressed too strongly that informed and safe operation is more than just
YSI Incorporated
Drinking Water Monitoring Systems Operations Manual
1-1
Introduction
Section 1
knowing which buttons to push. An understanding of the principles of operation, calibration techniques,
and system setup is necessary to obtain accurate and meaningful results.
Because of the many features, configurations and applications of these versatile products, some sections of
this manual may not apply to the specific system you have purchased.
If you have any questions about this product or its application, please contact YSI’s customer service
department or authorized dealer for assistance. See Section 8, Warranty and Service Information for
contact information.
1.3 UNPACKING AND INSPECTION
Inspect the outside of the shipping box for damage. If any damage is detected, contact your shipping carrier
immediately. Remove the equipment from the shipping box. Some parts or supplies are loose in the
shipping box so check the packing material carefully. Check off all of the items on the packing list and
inspect all of the assemblies and components for damage.
If any parts are damaged or missing, contact your YSI representative immediately. If you purchased the
equipment directly from YSI, or if you do not know from which YSI representative your equipment was
purchased, refer to Section 8, Warranty and Service Information for contact information.
YSI Incorporated
Drinking Water Monitoring Systems Operations Manual
1-2
Sondes
Section 2
SECTION 2 6920DW AND 600DW-B SONDES
2.1 GETTING STARTED
The 6920DW and 600DW-B-B Drinking Water Monitoring Systems are multi-parameter, water quality
measurement, and data collection systems. Their primary application is the monitoring of drinking water
using a flow cell and a free chlorine sensor is provided with each instrument since this parameter is very
important in assessing the quality of drinking water. However, these instruments can also be used in a
variety of research, assessment, and regulatory compliance applications without a flow cell as long as the
user realizes that the performance of the free chlorine sensor will be significantly compromised under these
conditions. The primary difference between the “DW” instruments and those provided by YSI for surface
and ground water applications is that the oxygen sensor for the standard sondes has been replaced by a free
chlorine sensor in the 6920DW and 600DW-B. The free chlorine sensor also requires a different circuit
board which is resident in the instrument and this means that “DW” sondes are not capable of dissolved
oxygen measurement and, vice versa, standard sondes are not capable of free chlorine measurement even
though the probes themselves will fit in either of the instruments. Section 2 concentrates on how to set up
operate the “DW” sondes. For the purpose of terminology in this manual it should be realized that a sonde
is a torpedo-shaped water quality monitoring device that is placed in the water to gather water quality data.
Sondes may have multiple probes. Each probe may have one or more sensors that read water quality data.
The following list contains parameters that your sonde may measure. See Appendix E Specifications for
the specific parameters of each sonde.
•
•
•
•
•
•
•
•
•
•
•
•
•
•
•
•
Free Chlorine
Conductivity
Specific Conductance
Salinity
Total Dissolved Solids
Resistivity
Temperature
pH
ORP
Turbidity
Nitrate-N
Ammonia-N
Ammonium-N
Chloride
Chlorophyll
Rhodamine WT
This section is designed to quickly familiarize you with the hardware and software components of the
“DW” sondes and their accessories. You will then proceed to probe installations, cable connections,
software installation and finally basic communication with your Sonde. Diagrams, menu flow charts and
basic written instructions will guide you through basic hardware and software setup.
YSI Incorporated
Drinking Water Monitoring Systems Operations Manual
2-1
Sondes
Section 2
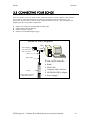
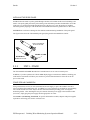
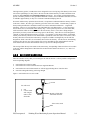
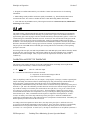
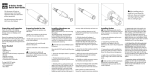
2.2 CONNECTING YOUR SONDE
There are a number of ways in which you may connect the sondes to various computers, data collection
devices and VT-100 terminal emulators. To utilize the configuration that will work best for your
application, make sure that you have all of the components that are necessary. The following list and
diagrams provide a few possible configurations.
Sonde to Lab Computer (recommended for initial setup)
Sonde to Data Collection Platform
Sonde to Portable Computer
Sonde to YSI 650 MDS Display/Logger
Sonde to Lab Computer
DB-9
Power Supply*
6651: 220 VAC
6038: 110 VAC
6095B
Adapter
MS-8
Field Cable
You will need...
+
-
YSI 6920
Sonde
* Not required if you use
sonde battery power.
YSI Incorporated
θ
θ
θ
θ
θ
Sonde
Field Cable
Computer with Com Port
6095B MS-8/DB-9 Adapter
Power Supply *
Drinking Water Monitoring Systems Operations Manual
2-2
Sondes
Section 2
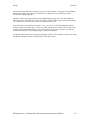
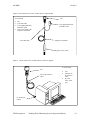
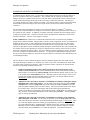
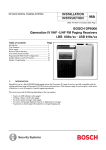
Sonde to Data Collection Platform
DCP
6096 MS-8 Adapter with Flying Leads
MS-8
Field Cable
You will need...
+
-
YSI
692
0
Sonde
T Sonde
T Field Cable
T 6096 Adapter with leads
T Data Collection Platform
Sonde to Portable Computer
DB-9
6095B
Adapter
MS-8
Field Cable
You will need...
+
-
YSI
692
0
Sonde
YSI Incorporated
T
T
T
T
Sonde
Field Cable
Computer with Com Port
6095B MS-8/DB-9 Adapter
Drinking Water Monitoring Systems Operations Manual
2-3
Sondes
Section 2
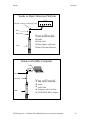
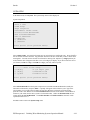
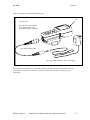
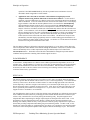
Sonde to 650 Display/Logger
YS
I
Environmental
Monitoring
Systems
610-DM
650 MDS
MS-8
You will need...
Field Cable
+
T Sonde
T Field Cable
-
Sonde
YS
I
69
20
T 650 MDS Display/Logger
YSI 650 operates on C-cells or rechargeable batteries.
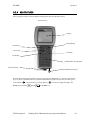
Sonde to 650 Display/Logger
Sonde to 6500 Process Monitor
You will need...
Sonde
-
Field Cable
650 MDS Display/Logger
YSI 6500 operates on 90-230 V AC Power.
YSI Incorporated
Drinking Water Monitoring Systems Operations Manual
2-4
Sondes
Section 2
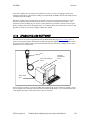
2.3 PREPARING THE SONDE FOR USE
To prepare the sonde for calibration and operation, you need to install probes (sensors) into the connectors
on the sonde bulkhead. In addition to probe installation, you need to install a new membrane on the YSI
6572 Free Chlorine Probe. It is highly recommended that you install the free chlorine membrane before
installing the probe onto the bulkhead. The next step is providing power for the sondes, through batteries or
AC, and then connecting a cable. The four steps necessary for getting your sonde ready for use are listed
below.
Step 1
Step 2
Step 3
Step 4
Installing the Free Chlorine Membrane – Section 2.3.1
Installing the Probes – Section 2.3.2
Supplying Power – Section 2.3.3
Connecting a Cable – Section 2.3.4
2.3.1 STEP 1 - INSTALLING THE FREE CHLORINE PROBE MEMBRANE
The 6572 Free Chlorine probe is shipped with a protective cap on the sensor tip which must be removed
before proceeding . Handle the probe with care. It is very important not to drop the probe and/or gouge the
probe tip. See Section 2.10.2, Probe Care and Maintenance, for information on how often the membrane
should be replaced.
Unpack the YSI 6572 Free Chlorine Probe Kit and follow the instructions below.
FREE CHLORINE SENSOR ELECTROLYTE PREPARATION
Open the 6573 membrane kit which was shipped with your instrument and prepare the electrolyte solution.
Dissolve the KCl in the dropper bottle by filling it to the neck with deionized or distilled water and shaking
until the solids are fully dissolved. After the KCl is dissolved, wait a few minutes until the solution is free
of bubbles.
1.
ADD DI OR DISTILLED
WATER
2.
PROTECTIVE CAP
FREE CHLORINE SENSOR MEMBRANE INSTALLATION
Remove the protective Teflon membrane and O-ring from the sensor end of the YSI 6572 Free Chlorine
probe. CAUTION: The Teflon membrane MUST be removed for proper sensor function.
Remove the protective cap is installed on the connector end of the probe.
YSI Incorporated
Drinking Water Monitoring Systems Operations Manual
2-5
Sondes
Section 2
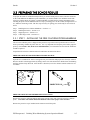
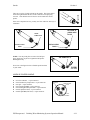
Locate the 6035 Reconditioning Kit which was supplied with your 6572 Free Chlorine Probe. Use one of
circular sanding disks the 6035 Reconditioning Kit to sand the face of the 6572 Probe according to the
following instructions.
•
Hold the probe in a vertical position, place a sanding disk under your thumb, and stroke the probe
face in a direction parallel to the platinum electrode (located between
the two silver electrodes). The motion is similar to that used in
striking a match. Usually 10-15 strokes of the sanding disk are
sufficient to remove black deposits on the silver electrodes.
However, in extreme cases, more sanding may be required to
regenerate the original silver surface.
•
Rinse the probe tip well with purified water to remove dust from
sanding.
CAUTION: You must sand your free chlorine sensor as described
above prior to installing a membrane to insure the surface tension
for probe surface/membrane interface.
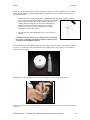
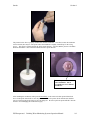
Locate the YSI 6574 O-ring Installation Kit which was shipped with your sonde. Note that the kit contains
two items – a circular plate with a threaded hole and a cylindrical tool with a screwdriver-style handle as
shown in the picture below.
Thread the nut on the end of the 6572 probe into the base plate as shown in the picture below.
Place an o-ring from the 6573 membrane kit in the groove at the bottom of the tool as shown in the picture
below left.
YSI Incorporated
Drinking Water Monitoring Systems Operations Manual
2-6
Sondes
Section 2
Apply a few drops of KCl solution to the tip of the probe as shown in the picture above right. The fluid
should completely fill the small moat around the electrodes and form a meniscus on the tip of the sensor.
Meniscus
O-Ring in Groove
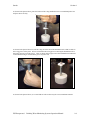
Remove a white membrane sheet from the package in the 6573 membrane kit as shown in the picture
below.
CAUTION: The blue sheets are simply protective spacers and CANNOT be used as
membranes for the free chlorine sensor.
White Membrane
As shown in the pictures below, lay the membrane on the probe tip that contains the electrolyte so that the
probe tip is approximately in the middle of the membrane.
YSI Incorporated
Drinking Water Monitoring Systems Operations Manual
2-7
Sondes
Section 2
As shown in the picture below, place the bottom of the o-ring installation tool over membrane/probe face
and press down securely.
As shown in the picture below left, roll the o-ring off of the end of the installation tool so that it resides in
the o-ring groove of the probe. Be sure to hold onto the O-ring prior to removing the installation tool so
that it does not pop out of the groove. Then, as shown below right, remove the installation tool and make
certain that the o-ring is centered in the groove on probe end.
As shown in the picture below, use a razor blade or knife to trim away the excess membrane material.
YSI Incorporated
Drinking Water Monitoring Systems Operations Manual
2-8
Sondes
Section 2
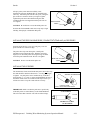
The pictures below show a properly installed free chlorine membrane. Note that, because the membrane
will not stretch, there may be some points where the membrane is slightly “bunched up” in the o-ring
groove. This effect is normal and will not affect sensor function. Also note that the presence of bubbles
under the membrane is also normal and should not affect probe function
Note the presence of a bubble
after installation. This is
acceptable for a free chlorine
membrane.
`
After installing the membrane, either proceed immediately to the sensor activation protocol described
above in the Quick Start Guide or store the probe in a beaker of tap water (NOT deioinized or distilled
water) as shown in the picture below to prevent drying out. Be sure to place the probe GENTLY into the
beaker to avoid damaging the membrane integrity.
YSI Incorporated
Drinking Water Monitoring Systems Operations Manual
2-9
Sondes
Section 2
NOTE CAREFULLY: Users who are accustomed to installing a Teflon membrane on a YSI dissolved
oxygen sensor should note that the methods recommended for the Teflon installation are not likely to work
well for the free chlorine membrane because this membrane cannot be stretched. Therefore, dissolved
oxygen membrane installation techniques which are outline in the manuals for various YSI instruments,
including standard 6-series sondes utilizing the 6562 Rapid Pulse DO sensor, are NOT RECOMMENDED
for the free chlorine membrane installation.
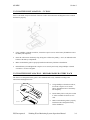
2.3.2 STEP 2 - INSTALLING THE PROBES
Remove the calibration cup from your sonde by hand as shown below to expose the bulkhead.
TRANSPORT CUP
BULKHEAD WITH
PROBE PORT PLUGS
REMOVING THE PORT PLUGS
Using the long extended end of the probe installation tool supplied in the YSI 6570
Maintenance Kit, remove the port plugs. Save all the port plugs
for possible future use.
YSI Incorporated
Drinking Water Monitoring Systems Operations Manual
2-10
Sondes
Section 2
There are a variety of probe options for the sondes. The figures below
and to the right illustrate the uses of the common tool for port plug
removal. Note that this tool will also be used to install the various
probes.
If the tool is misplaced or lost, you may use 7/64” and 9/64” hex keys as
substitutes.
DO, COND., &
pH/ORP PORT
PLUGS
OPTIC
PORT PLUG
INSTALLATION
TOOL
INSTALLATION
TOOL
NOTE: You may need pliers to remove the ISE port
plugs, but do not use pliers to tighten the ISE probes.
Hand-tighten only.
ISE PORT PLUG
Now refer to the figures below to find the probe locations
in your sonde.
PLIERS
(SLIP JAWS)
600DW-B SONDE BULKHEAD
6572 Free Chlorine = 3-pin connector
6560 Conductivity/Temperature = 6-pin connector
6561 pH = 4-pin connector
6565 Combo pH/ORP = 4-pin connector
6566 Fouling Resistant pH//ORP = 4 pin connector
6561FG pH (Flat Glass) = 4-pin connector
6565FG pH/ORP (Flat Glass) = 4-pin connector
FREE
CHLORINE
6572
CONDUCTIVITY/
TEMPERATURE
6560
ALL ISE
PROBES
YSI Incorporated
Drinking Water Monitoring Systems Operations Manual
2-11
Sondes
Section 2
6920DW SONDE BULKHEAD
6572 Free chlorine probe = 3-pin connector
6560 Conductivity/Temperature = 6-pin connector
6561 pH = 4-pin connector
6565 Combo pH/ORP = 4-pin connector
6566 Fouling Resistant pH//ORP = 4 pin connector
6561FG pH (Flat Glass) = 4-pin connector
6565FG pH/ORP (Flat Glass) = 4-pin connector
6882 Chloride Probe = leaf spring connector
6883 Ammonium Probe = leaf spring connector
6884 Nitrate Probe = leaf spring connector
6026 Turbidity Probe, Wiping = 8 pin connector
6136 Turbidity Probe, Wiping = 8 pin connector
6025 Chlorophyll Probe, Wiping = 8 pin connector
6130 Rhodamine WT Probe, Wiping = 8 pin connector
COND/TEMP
ISE1/ISE2
pH/ORP
FREE
CHLORINE
EE
TURBIDITY
CHLOROPHYLL
RHODAMINE WT
MOUNTING SCREW
1 OF 2
3
ISE3
5
4
ISE5
ISE4
LUBRICATE O-RINGS
Apply a thin coat of O-ring lubricant, supplied in the YSI 6570 Maintenance Kit, to the O-rings on the
connector side of each probe that is to be installed.
CAUTION: Make sure that there are NO contaminants
between the O-ring and the probe. Contaminants that are present
under the O-ring may cause the O-ring to leak
when the sonde is deployed.
LUBRICATE O-RINGS
NOTE: Before installing any probe into the sonde bulkhead, be sure that the probe port is free of
moisture. If there is moisture present, you may use compressed air to blow out the remaining moisture.
INSTALLING THE TURBIDITY, CHLOROPHYLL, AND RHODAMINE WT PROBES
If you have a turbidity, chlorophyll, and/or rhodamine WT probe, it is recommended that the optical
sensors be installed first. If you are not installing one of these probes, do not remove the port plug, and go
on to the next probe installation.
YSI Incorporated
Drinking Water Monitoring Systems Operations Manual
2-12
Sondes
Section 2
All optic probes, 6026 and 6136 turbidity, 6025
chlorophyll, and 6130 rhodamine WT are installed in the
same way. Install the probe into the center port, seating the
pins of the two connectors before you begin to tighten.
Tighten the probe nut to the bulkhead using the short
extended end of the tool supplied with the probe. Do not
over-tighten.
OPTIC
PROBE
INSTALLATION
TOOL
CAUTION: Be careful not to cross-thread the probe nut.
Note that the YSI 6920DW sondes can accept only a single
turbidity, chlorophyll, or rhodamine WT probe.
INSTALLING THE FREE CHLORINE PROBE, CONDUCTIVITY/TEMP AND pH/ORP PROBES
Insert the probe into the correct port and gently rotate the
probe until the two connectors align.
CL2 PROBE
The probes have slip nuts that require a small probe
installation tool to tighten the probe. With the connectors
aligned, screw down the probe nut using the long extended
end of the probe installation tool. Do not over-tighten.
CAUTION: Do not cross thread the probe nut.
PROBE INSTALLATION
TOOL
INSTALLING THE ISE PROBES
The Ammonium, Nitrate and Chloride ISE probes do not have slip
nuts and should be installed without tools. Use only your fingers
to tighten. Any ISE probe can be installed in any of the three
ports labeled “3”, “4”, and “5” on the sonde bulkhead. Be sure to
remember which sensor was installed in which port so that you
will later be able to set up the sonde software correctly.
ISE PROBE
NITRATE OR AMMONIUM
INSERT ISE PROBE,
SCREW IN AND TIGHTEN WITH FINGERS.
IMPORTANT: Make sure that the probe nut or probe body
of the ISE probes are seated directly on the Sonde Bulkhead.
This will ensure that connector seals will not allow leakage.
PROBE BODY TO SEAT
ON BULKHEAD
ISE PROBE
DO PROBE
PROBE NUT TO SEAT
ON BULKHEAD
YSI Incorporated
Drinking Water Monitoring Systems Operations Manual
2-13
Sondes
Section 2
INSTALLING THE PROBE GUARD
Included with each sonde is a probe guard although customers will seldom use this item for drinking water
studies. The probe guard protects the probes during some calibration procedures and should be used if the
sonde were ever used in field studies that did not involve the flow cell. Once the probes are installed,
install this guard by aligning it with the threads on the bulkhead and turn the guard clockwise until secure.
CAUTION: Be careful not to damage the free chlorine membrane during installation of the probe guard.
The figure below shows the YSI 6920DW probe guard; the guard for the 600DW-B is similar.
TURN CLOCKWISE BY
HAND TO SECURE
PROBE GUARD
BULKHEAD
(PROBES INSTALLED)
2.3.3
STEP 3 - POWER
The YSI 6920DW and 600DW-B sondes have internal batteries or can run on external power.
In addition, if you have purchased a YSI 650 MDS display/logger or 6500 Process Monitor, attaching your
sonde to these instruments will allow your sonde to be powered from the batteries of the 650 or the AC
power of the 6500.
POWER FOR LAB CALIBRATION
Using a YSI 6038 (110 VAC) or 6651 (100-240VAC) Power Supply to power the sondes in the lab is
often convenient and extends battery life. In addition, AC power will likely be available for many drinking
water studies and the 6651/6038 may be the most efficient method of providing power for long term
monitoring studies. After attaching the four-pin connector from the power supply to the instrument cable
(see below), simply plug the power supply into the appropriate AC outlet.
See Section 2.2, Connecting Your Sonde, for specific information on cables, adapters and power supplies
required for connecting your sonde to various devices.
YSI Incorporated
Drinking Water Monitoring Systems Operations Manual
2-14
Sondes
Section 2
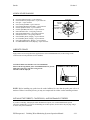
The system configuration best suited for
initial setup is shown in the figure at the
right.
Sonde to Lab Computer
DB-9
Power Supply*
6651 230VAC
6038: 110 VAC
MS-8
6095B
Adapter
Field Cable
You will need...
+
-
YSI 6920
Sonde
* Not required if you use
sonde battery power.
θ
θ
θ
θ
θ
Sonde
Field Cable
Computer with Com Port
6095B MS-8/DB-9 Adapter
Power Supply *
INSTALLING BATTERIES
The 6920DW and 600DW-B can also be powered by internal batteries and a set of batteries is supplied
with each of these sondes. See the sections below for instructions for battery installation
INSTALLING BATTERIES INTO THE YSI 600DW-B
To install 4 AA-size alkaline batteries into the sonde, refer to the following directions and the figure below.
Grasp the cylindrical battery cover and unscrew by hand in a counterclockwise direction. Then slide the
battery lid up and over the bulkhead connector. Insert batteries, paying special attention to polarity.
Labeling on the battery compartment posts describes the orientation. It is usually easiest to insert the
negative end of battery first and then “pop” the positive terminal into place.
Check the O-ring and sealing surfaces for any contaminants
that could interfere with the O-ring seal of the battery
chamber.
Lightly lubricate the o-ring on the outside of the battery
cover. DO NOT lubricate the internal o-ring.
BAIL
BULKHEAD
CONNECTOR
WITH CAP
SCREW ON
BATTERY CAP
Return the battery lid and tighten by hand.
DO NOT OVER-TIGHTEN.
SONDE BODY
(NOT SHOWN)
YSI Incorporated
Drinking Water Monitoring Systems Operations Manual
AA BATTERIES x 4
(NOTE POLARITY)
2-15
Sondes
Section 2
INSTALLING BATTERIES INTO THE 6920DW
To install the 8 AA-size alkaline batteries into the sonde, refer to
the following directions and the adjacent figures.
Position the bail so that it is perpendicular to the sonde and use it as
a lever to unscrew the battery cap by hand. Then slide the battery lid
up and over the bulkhead connector.
BULKHEAD CONNECTOR
WITH CAP
BATTERY CAP
BAIL
SONDE BODY
Insert batteries, paying special attention to polarity. Labeling on the
top of the sonde body describes the orientation.
GRASP BAIL WITH HAND.
TURN COUNTERCLOCKWISE TO LOOSEN.
F
Check the O-rings and sealing surfaces for any contaminants that could interfere with the seal of the battery
chamber.
Lightly lubricate the o-rings on the bottom of the threads and on the
connector stem as shown in the figure at the right.
Return the battery lid and tighten by hand. DO NOT OVERTIGHTEN.
BATTERY CAP
BULKHEAD
CONNECTOR
BAIL
-
+
+
-
O-RINGS
2.3.4 STEP 4 - CONNECTING A FIELD CABLE
As shown in the picture at left, the 6920DW and
600DW-B have a sonde-mounted cable connector
for attachment of cables. Two types of cables are
available – a “field cable” in various lengths up to
200 feet and a short 6067B laboratory calibration
cable.
To attach a field cable to the sonde connector,
remove the waterproof cap from the sonde
connector and set it aside for later reassembly
during deployment or storage. Then connect your
field cable to the sonde connector.
A built-in “key” will ensure proper pin alignment.
Rotate the cable gently until the “key” engages and
then tighten the connectors together by rotating
clockwise. Attach the strain relief connector to the
sonde bail. Rotate the strain relief connector nut to
close the connector's opening.
YSI Incorporated
FIELD CABLE
CONNECTOR
STRAIN RELIEF
CONNECTOR
REMOVE
WATERPROOF CAP
SONDE
CONNECTOR
Drinking Water Monitoring Systems Operations Manual
BAIL
2-16
Sondes
Section 2
The other end of the field cable is a military-style 8-pin connector (MS-8). Through use of a YSI 6095B
MS-8 to DB-9 adapter, the sonde may be connected to a computer for setup, calibration, real-time
measurement, and uploading files.
This MS-8 connector also plugs directly into the 650 MDS display/logger or the 6500 Process Monitor.
These instruments contain microprocessors with software which provides the ability to set up and calibrate
your sonde sensors in a similar way to that of a terminal interface to a PC.
As an alternative to the field cable for interface to a PC, you may use a YSI 6067B calibration cable for
laboratory interaction with the sonde. In this case, simply plug the proper end of the cable into the sonde
connector and attach the DB-9 connector of the cable to the Com port of your computer. Note that the
6067B will not interface to a 650 Display/Logger of 6500 Process Monitor
For drinking water studies involving only internal logging of data or real-time display of data on a PC using
EcoWatch for Windows software, the 6067B may be the cable of choice.
YSI Incorporated
Drinking Water Monitoring Systems Operations Manual
2-17
Sondes
Section 2
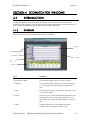
2.4 ECOWATCH FOR WINDOWS -GETTING STARTED
This section will describe how to get started with EcoWatch for Windows, but detailed information is
provided in Section 4, EcoWatch for Windows, or a convenient Windows Help section that is part of the
software. It is recommended that you thoroughly read Section 4 or use the Help function for a
comprehensive understanding of EcoWatch for Windows.
2.4.1
INSTALLING ECOWATCH FOR WINDOWS
EcoWatch for Windows software must be used with an IBM-compatible PC with a 386 (or better)
processor. The computer should also have at least 4MB of RAM and Windows Version 3.1 or later.
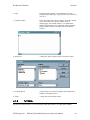
Place the EcoWatch for Windows compact disk in your CD ROM drive. Select Start, then Run and type
d:\setup.exe at the prompt. Press Enter or click on “OK” and the display will indicate that EcoWatch is
proceeding with the setup routine. Simply follow the instructions on the screen as the installation proceeds.
2.4.2
RUNNING ECOWATCH FOR WINDOWS
To run EcoWatch for Windows, simply select the EcoWatch icon on your desktop or from the Windows
Program Menu. For help with the EcoWatch program, see Section 4, EcoWatch or use the Help section of
the software.
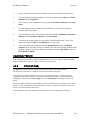
2.4.3
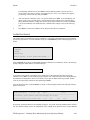
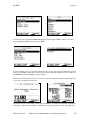
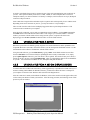
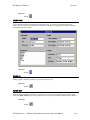
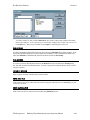
ECOWATCH FOR WINDOWS SETUP
on the toolbar, and then
To setup the EcoWatch software for use with a sonde, select the sonde icon
the proper Com port (1 or 2) to which your sonde is connected. If the default setting is correct, it does not
need to be changed. Click “OK” to open a terminal window.
From the Comm Menu, select the Settings option to check the baud rate. The baud rate should be 9600. If
it is not, select 9600 from the list and press Enter.
From the Settings Menu, select the Font/Color and Background Color options to choose a color scheme
for the EcoWatch for Windows menus.
2.5 SONDE SOFTWARE SETUP
There are two sets of software at work in any YSI environmental monitoring system. One is resident in the
sonde and the other is associated with the interface device (a PC, 650 Display/Logger, or 6500 Process
Monitor). If you are using a PC for your initial sonde setup as recommended, you will be using EcoWatch
for Windows software which was installed as described above and you should follow the instructions in the
section below to prepare your DW sonde for use. If you are using a 650 for sonde interface, see Section 5
for setup and interface instructions. If you are using a 6500 for sonde interface, see the manual which was
supplied with this instrument.
YSI Incorporated
Drinking Water Monitoring Systems Operations Manual
2-18
Sondes
Section 2
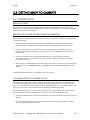
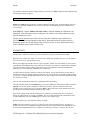
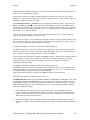
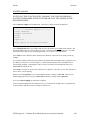
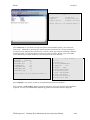
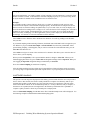
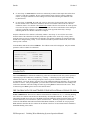
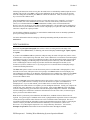
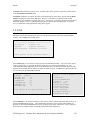
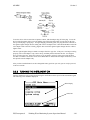
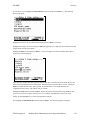
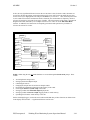
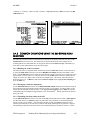
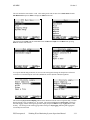
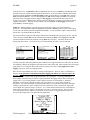
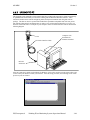
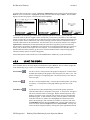
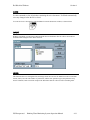
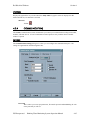
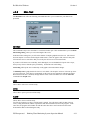
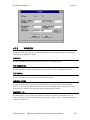
For PC-based sonde interface, run EcoWatch for Windows and click on the sonde icon,
from the
toolbar Then select the proper Com port and confirm by clicking OK. A window similar to that shown
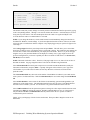
below will appear indicating connection to the sonde as shown in the figure below. Type “Menu” after the
# sign, press Enter, and the sonde Main menu will be displayed.
If your sonde has previously been used, the Main menu (rather than the # sign) may appear when
communication is established. In this case simply proceed as described below. You will not be required to
type “Menu”.
If you are unable to establish interaction with the sonde, make sure that the cable is properly connected. If
you are using external power, make certain that the YSI 6038 or 6651 power supply or other 12 vdc source
is properly working. Recheck the setup of the Com port and other software parameters. Also refer to
Section 6, Troubleshooting.
The sonde software is menu-driven. You select functions by typing their corresponding numbers. You do
not need to press Enter after choosing a selection. Type the 0 or Esc key to return to the previous menu.
YSI Incorporated
Drinking Water Monitoring Systems Operations Manual
2-19
Sondes
Section 2
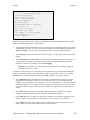
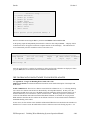
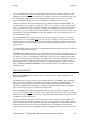
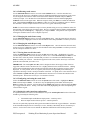
Sonde Main Menu
------------------Main----------------1-Run
5-System
2-Calibrate
6-Report
3-File
7-Sensor
4-Status
8-Advanced
Select option (0 for previous menu):
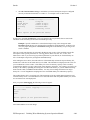
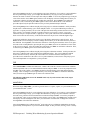
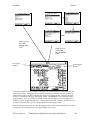
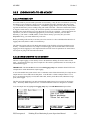
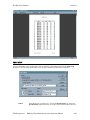
Sonde Menu Flow Chart
SONDE MENU FLOW CHART
Sonde
1. Run
1. Conductivity
1. Discrete sample
2. DO %
2. Unattended sample
3. DO mg/L
2. Calibrate
4. Others
1. Directory
3. File
4. Status
5. System
Date and Time
2. Upload
Battery Voltage
3. Quick Upload
Available Memory
1. Date & Time
Logging Status
2. Comm Setup
4. View File
5. Quick View File
3. Page Length
1. (Y) Date
4. Instrument ID
2. (Y) Time
5. SDI-12 Address
3. (Y) Temp, C
6. Delete All Files
7. Test Memory
4. ( ) Temp, F
6. Report
MORE
1. (Y) Temp
7. Sensor
8. Advanced
2. (Y) Cond
1. Cal Constants
3. (Y) DO
2. Setup
4. ( ) ISE1 pH
3. Sensor
MORE
4. Data Filter
YSI Incorporated
Drinking Water Monitoring Systems Operations Manual
2-20
Sondes
Section 2
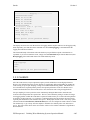
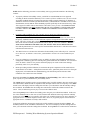
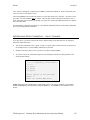
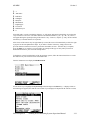
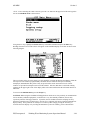
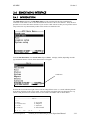
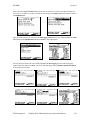
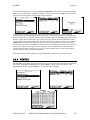
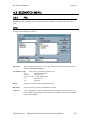
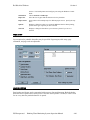
SYSTEM SETUP
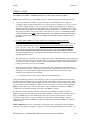
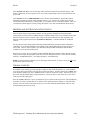
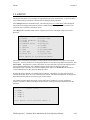
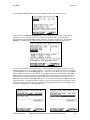
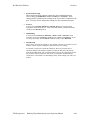
At the Main menu, select System. The System Setup menu will be displayed.
System Setup Menu
1-Date & time
2-Comm setup
3-Page length=25
4-Instrument ID=YSI Sonde
5-Circuit board SN:00003001
6-GLP filename=00003001
7-SDI-12 address=0
8-(*)English
9-( )Fran?ais
A-( )Deutsch
Select option (0 for previous menu):
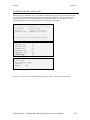
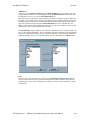
Select 1-Date & time. An asterisk will appear next to each selection to confirm the entry. Press 4 and 5 to
activate the date and time functions. Pay particular attention to the date format that you have chosen when
entering date. You must use the 24-hour clock format for entering time. Option 4- ( ) 4 digit year may be
used so that the date will appear with either a two or four digit year display. If you do not enter the correct
year format (8/30/98 for 2-digit, 8/30/1998 for 4 digit) your entry will be rejected.
-----------Date & time setup----------1-(*)m/d/y
4-( )4 digit year
2-( )d/m/y
5-Date=08/11/98
3-( )y/m/d
6-Time=11:12:30
Select option (0 for previous menu):
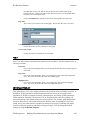
Select 4-Instrument ID from the System setup menu to record the instrument ID number (usually the
instrument serial number), and press Enter. A prompt will appear which will allow you to type in the
serial number of your sonde. This will make sure that any data that is collected is associated with a
particular sonde. Note that the selection 5-Circuit Board SN shows the serial number of the PCB that is
resident in your sonde (not the entire system as for Instrument ID). Unlike the Instrument ID, the user
cannot change the Circuit Board SN. The 6-GLP filename and 7-SDI-12 address selections will be
explained in Section 2.9.5
Press Esc or 0 to return to the System setup menu.
YSI Incorporated
Drinking Water Monitoring Systems Operations Manual
2-21
Sondes
Section 2
At the bottom of the menu choose the language you prefer for the sonde software. For example, press
7- ( ) English to use the sonde with English menus.
1-Date & time
2-Comm setup
3-Page length=25
4-Instrument ID=YSI Sonde
5-Circuit board SN:00003001
6-GLP filename=00003001
7-SDI-12 address=0
8-(*)English
9-( )Fran?ais
A-( )Deutsch
Select option (0 for previous menu):
Then press Esc or 0 again to return to the Main menu.
------------------Main----------------1-Run
5-System
2-Calibrate
6-Report
3-File
7-Sensor
4-Status
8-Advanced
Select option (0 for previous menu):
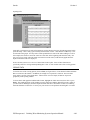
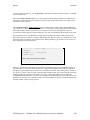
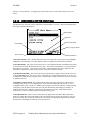
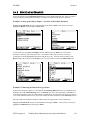
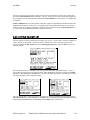
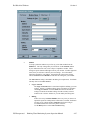
ENABLING SENSORS
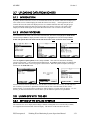
To activate the sensors that are in your sonde, select Sensor from the Sonde Main menu.
------------Sensors enabled-----------1-(*)Time
2-(*)Temperature
3-(*)Conductivity
4-(*)Free Cl2
5-(*)ISE1 pH
6-(*)ISE2 Orp
7-(*)ISE3 NH4+
8-(*)ISE4 NO39-( )ISE5 NONE
A-(*)Turbidity 6026
Select option (0 for previous menu):
YSI Incorporated
Drinking Water Monitoring Systems Operations Manual
2-22
Sondes
Section 2
Note that the exact appearance of this menu will vary depending upon the sensors that are available on your
sonde. Enter the corresponding number to enable the sensors that are installed on your sonde. An asterisk
indicates that the sensor is enabled.
When selecting any of the ISE or Optical ports, a submenu will appear. When this occurs, make a selection
so that the sensor corresponds to the port in which the sensor is physically installed. Only ORP can be
enabled as ISE2. Optic T and Optic C generate a submenu on selection. Each optical port can have one of
four probes (6026 turbidity, 6136 turbidity, chlorophyll, or rhodamine WT) installed as indicated by the
submenus.
After all installed sensors have been enabled, press Esc or 0 to return to the Main Menu.
ENABLING PARAMETERS
In order for a specific parameter to be displayed:
1.
2.
The sensor must first be enabled as described above.
That parameter must be activated in the Report Setup menu described below.
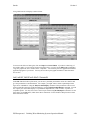
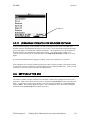
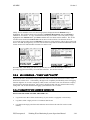
Select Report from the Main menu. A Report Setup menu similar to the one shown below will be
displayed.
--------------Report setup------------1-(*)Date m/d/y
D-(*)Orp mV
2-(*)Time hh:mm:ss E-(*)NH4+ N mg/L
3-(*)Temp C
F-( )NH4+ N mV
4-(*)SpCond mS/cm
G-( )NH3 N mg/L
5-( )Cond
H-(*)NO3- N mg/L
6-( )Resist
I-( )NO3- N mV
7-( )TDS
J-(*)Cl- mg/L
8-( )Sal ppt
K-( )Cl- mV
9-(*)Cl2 mg/L
L-(*)Turbid NTU
A-(*)Cl2chrg
B-(*)pH
C-( )pH mv
Select option (0 for previous menu):
Note that the exact appearance of this menu will vary depending upon the sensors that are available and
enabled on your sonde. The asterisks (*) that follow the numbers or letters indicate that the parameter will
appear on all outputs and reports. To turn a parameter on or off, type the number or letter that corresponds
to the parameter.
Note also that since a 6026 turbidity probe was selected in the Sensor menu above, the units of turbidity are
presented as “turbid NTU”. If a 6136 turbidity probe had been selected, the units of turbidity would be
presented as “turbid+ NTU”. This new designation is designed to differentiate the data from the two
sensors types in later analysis.
YSI Incorporated
Drinking Water Monitoring Systems Operations Manual
2-23
Sondes
Section 2
For parameters with multiple unit options such as temperature, conductivity, specific conductance,
resistivity and TDS, a submenu will appear as shown below for temperature, allowing selection of desired
units for this parameter.
--------------Select units------------1-(*)NONE
2-( )Temp C
3-( )Temp F
4-( )Temp K
Select option (0 for previous menu): 2
After configuring your display with the desired parameters, press Esc or 0 to return to the Main menu.
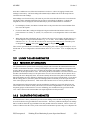
CHECKING ADVANCED SETTINGS
Select Advanced from the Main menu. The following menu will be displayed.
----------------Advanced-------------1-Cal constants
2-Setup
3-Sensor
4-Data filter
Select option (0 for previous menu):
Select Setup from the Advanced menu.
-------------Advanced setup----------1-(*)VT100 emulation
2-( )Power up to Menu
3-( )Power up to Run
4-( )Comma radix
5-(*)Auto sleep RS232
6-(*)Auto sleep SDI12
7-( )Multi SDI12
8-( )Full SDI12
Select option (0 for previous menu): 0
Make sure that, other than Auto sleep RS232, all entries are activated or deactivated as shown above.
For sondes which will be used in sampling studies where the user is present and observes readings in realtime, Auto sleep RS232 should usually be “off’. For sondes that will be used in unattended monitoring
YSI Incorporated
Drinking Water Monitoring Systems Operations Manual
2-24
Sondes
Section 2
studies, Auto sleep RS232 should usually be “on”. This is described in detail in Section 2.9, Sonde Menu.
When this setup is verified, press Esc or 0 to return to the Advanced menu.
Select 3-Sensor from the Advanced menu and make certain that the entries are identical to those shown
below.
------------Advanced sensor----------1-TDS constant=0.65
2-Cl2 temp co %/C=2.5
3-Cl2 warm up sec=60
4-( )Wait for Cl2
5-Wipes=1
6-Wipe int=1
7-SDI12-M/wipe=1
8-Turb temp co %/C=0.3
9-(*)Turb spike filter
A-Chl temp co %/C=0
B-( )Chl spike filter
Select option (0 for previous menu):
The display under 3-Sensor may be different from the one shown in the example above, depending on the
sensors that are installed in your unit. For example, if you do not have a chlorophyll probe, the last two
entries (which are relevant only to chlorophyll) will not appear.
When this setup is verified, press Esc or 0 to return to the Advanced menu. For a detailed explanation of
the choices in the Advanced menu, see Section 2.9.8, Advanced. Press Esc or 0 to back up to the Main
menu.
------------------Main----------------1-Run
5-System
2-Calibrate
6-Report
3-File
7-Sensor
4-Status
8-Advanced
Select option (0 for previous menu):
The sonde software is now set up and ready to calibrate and run.
YSI Incorporated
Drinking Water Monitoring Systems Operations Manual
2-25
Sondes
Section 2
2.6 GETTING READY TO CALIBRATE
2.6.1 INTRODUCTION
HEALTH AND SAFETY
Reagents that are used to calibrate and check this instrument may be hazardous to your health. Take a
moment to review health and safety information in Appendix A of this manual. Some calibration standard
solutions may require special handling.
PREPARING THE 6572 FREE CHLORINE PROBE FOR CALIBRATION
Before calibration of the free chlorine sensor can be carried out, it needs to be “activated” according to the
following instructions:
•
Remove the 6572 free chlorine probe from the sonde bulkhead (if it has been installed previously).
Make certain that a membrane has been installed correctly as documented in Section 2.3 above.
•
Prepare a diluted solution of commercial chlorine bleach consisting of 1 part bleach to 200 parts
purified water (distilled or deionized). For example, mix 1 mL of chlorine bleach with 200 mL of
purified water.
•
Place the free chlorine probe in the diluted bleach and leave for approximately 60 seconds.
CAUTION: Do not leave the probe in bleach for longer than 1 minute or the break-in time for the
probe will be excessive.
•
Rinse the sensor tip and membrane with purified water and set aside in a beaker of tap (NOT deionized
or distilled) water. DO NOT REINSTALL THE PROBE IN THE SONDE BULKHEAD AT THIS
TIME.
Now follow the instructions below for calibration of the other sensors.
CONTAINERS NEEDED TO CALIBRATE A SONDE
The calibration cup that comes with your sonde serves as a calibration chamber for all calibrations except
free chlorine and minimizes the volume of calibration reagents required. However, if you are using the
6026 or 6136 turbidity, the 6025 chlorophyll, or the 6130 rhodamine WT probes, you should visually verify
proper movement of the wiper mechanism before beginning the calibration procedures.
Instead of the calibration cup, you may use laboratory glassware to perform many calibrations. If you do
not use a calibration cup that is designed for the sonde, you are cautioned to do the following:
9
Perform all calibrations with the Probe Guard installed. This protects the probes from possible physical
damage.
9
Use a ring stand and clamp to secure the sonde body to prevent the sonde from falling over. Much
laboratory glassware has convex bottoms.
YSI Incorporated
Drinking Water Monitoring Systems Operations Manual
2-26
Sondes
9
Section 2
Insure that all sensors are immersed in calibration solutions. Many of the calibrations factor in
readings from other probes (e.g., temperature probe). The top vent hole of the conductivity sensor must
also be immersed during calibrations.
CALIBRATION TIPS
1.
The key to successful calibration is to insure that the sensors are completely
submersed when calibration values are entered. Use recommended volumes
when performing calibrations.
2.
For maximum accuracy, use a small amount of previously used calibration
solution to pre-rinse the sonde. You may wish to save old calibration
standards for this purpose.
3.
Fill a bucket with ambient temperature water to rinse the sonde between
calibration solutions or perform the calibration near a sink where the probes
can be rinsed from the tap.
4.
Have several clean, absorbent paper towels or cotton cloths available to dry
the sonde between rinses and calibration solutions. Shake the excess rinse
water off of the sonde, especially when the probe guard is installed. Dry off
the outside of the sonde and probe guard. Making sure that the sonde is dry
reduces carry-over contamination of calibrator solutions and increases the
accuracy of the calibration.
5.
If you are using laboratory glassware for calibration, you do not need to
remove the probe guard to rinse and dry the probes between calibration
solutions. The inaccuracy resulting from simply rinsing the probe
compartment and drying the outside of the sonde is minimal.
6.
Make certain that port plugs are installed in all ports where probes are not
installed. It is extremely important to keep these electrical connectors dry.
USING THE CALIBRATION CUP
Follow these instructions to use the calibration cup for calibration procedures with the 6920DW and
600DW-B sondes..
9
Ensure that a gasket is installed in the gasket groove of the calibration cup bottom cap, and that the
bottom cap is securely tightened. Note: Do not over-tighten as this could cause damage to the threaded
portions of the bottom cap and tube.
9
Remove the probe guard, if it is installed.
9
Inspect the installed gasket on the sonde for obvious defects and if necessary, replace it with the extra
gasket supplied.
9
Screw cup assembly into place on the threaded end of sonde and securely tighten. Note: Do not over
tighten as this could cause damage to the threaded portions of the bottom cap and tube.
9
Sonde calibration can be accomplished with the sonde upright or upside down. A separate clamp and
stand, such as a ring stand, is required to support the sonde in the inverted position.
YSI Incorporated
Drinking Water Monitoring Systems Operations Manual
2-27
Sondes
Section 2
NOTE CAREFULLY: When calibrating a turbidity sensor for use with the 6920DW, you can use either the
standard calibration cup (with certain qualifications) or an optional extended length calibration cup. Please see
the section below which describes the special calibration recommendations for this sensor.
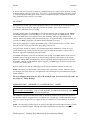
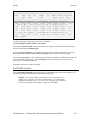
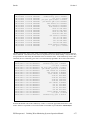
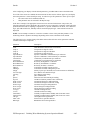
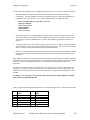
RECOMMENDED VOLUMES OF CALIBRATION REAGENTS
The approximate volumes of the reagents are specified below for both the upright and upside down
orientations.
Table 1
6920DW Sonde
Probe to Calibrate
Conductivity
pH/ORP
ISE
Turbidity, Chlorophyll, Rhodamine WT
w/ Standard Calibration Cup*
Turbidity, Chlorophyll, Rhodamine WT
w/ Extended Calibration Cup*
Upright
200 mL
100 mL
125 mL
40 mL
Upside Down
200 mL
250 mL
275 mL
N/A
220 mL
N/A
Table 2
600DW-B Sonde
Probe to Calibrate
Upright
Upside Down
Conductivity
50 mL
50 mL
pH/ORP
25 mL
50 mL
* See section below for special instructions dealing with calibration of the turbidity sensor with the two
types of calibration cup.
CALIBRATION OF THE 6136 TURBIDITY SENSOR
When used with the 6920DW sonde, the 6136 can be calibrated using two types of vessels:
• The standard calibration cup which was supplied with the sonde and which minimizes the volume of
calibration suspension required.
•
An extended calibration cup which is designed to provide both the greatest accuracy and convenience,
but which requires the use of higher volumes of calibration suspension.
If you choose to calibrate with the standard calibration cup, you should engage only ONE THREAD when
screwing the calibration cup onto the sonde in order to keep the turbidity probe face as far as possible from
the calibration cup bottom to avoid interference. Even with these techniques, there will still be a small
interference from the bottom of the calibration cup that will cause your field turbidity readings to appear up
to 1 NTU lower than the actual reading. In many cases, this small error is negligible in surface water
studies, but can be important for drinking water studies where turbidity is generally very low. For
example, a true turbidity of 0.5 NTU could appear as a value of –0.5 NTU for drinking water and this is a
significant error.
The easiest way to avoid this error due to interference from the bottom of the calibration cup is to purchase an
optional, extended-length calibration cup for your 6920DW sonde (YSI Item Number 655488). Use of these
calibration cups completely eliminates bottom interference even when the calibration cup is completely
threaded onto the sonde. The only drawback to the use of the extended length cup is that its use requires
significantly higher volumes of calibration suspension. This factor is generally of no concern if you are
YSI Incorporated
Drinking Water Monitoring Systems Operations Manual
2-28
Sondes
Section 2
reusing the standard, but can be significant if the standard must be discarded after use according to your
protocol.
For drinking water studies with the 6920DW and 600DW-B sondes where the turbidity is usually very low,
YSI highly recommends the second method described above, i.e. the one utilizing the extended length
calibration cups. If you wish to purchase these lengthened calibration cups, the parts to order are shown
below and listed in the Appendix C Accessories and Calibration Standards:
Extended Calibration Cup Sleeve for the 6920DW – YSI Item # 655488
2.6.2 CALIBRATION PROCEDURES
CAUTION: Before beginning the calibration of any sensors, make certain that the 6572 free chlorine
probe is REMOVED from the sonde bulkhead and stored in purified water. Then be sure to install
a port plug in the vacated free chlorine port. Exposure of the free chlorine sensor to some of the
reagents used to calibrate the other sensors can temporarily compromise the performance of the
sensor.
The following calibration procedures are for the most commonly used sensors. For detailed information on
all calibration procedures, refer to Section 2.9.2, Calibrate.
To ensure more accurate results, you can rinse the calibration cup with water, and then rinse with a small
amount of the calibration solution for the sensor that you are going to calibrate. Discard the rinse solution
and add fresh calibrator solution. Use tables 1-4 to find the correct amount of calibrator solution.
1.
Carefully immerse the probes into the solution and rotate the calibration cup to engage several
threads. YSI recommends supporting the sonde with a ring stand and clamp to prevent the sonde
from falling over.
2.
With the proper cable, connect the sonde to a PC, access EcoWatch for Windows and proceed to
the Main menu (for information on how to run EcoWatch for Windows software, see Section
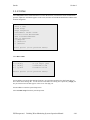
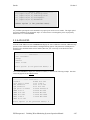
2.4.2, Running EcoWatch Software). From the sonde Main menu, select 2-Calibrate.
---------------Calibrate-------------1-Conductivity
6-ISE3 NH4+
2-Free Cl2
7-ISE4 NO33-Pressure-Abs
8-Optic T-Turbidity-6026
4-ISE1 pH
9-Optic C-Chlorophyll
5-ISE2 ORP
Select option (0 for previous menu):
3.
Note that the exact appearance of this menu will vary depending upon the sensors that are
available and enabled on your sonde. To select any of the parameters from the Calibrate menu,
input the number that is next to the parameter. Once you have chosen a parameter, some of the
parameters will have a number that appears in parentheses. These are the default values and will
YSI Incorporated
Drinking Water Monitoring Systems Operations Manual
2-29
Sondes
Section 2
be used during calibration if you press Enter without inputting another value. Be sure not to
accept default values unless you have assured that they are correct. If no default value appears,
you must type a numerical value and press Enter.
4.
After you input the calibration value, or accept the default, press Enter. A real-time display will
appear on the screen. Carefully observe the stabilization of the readings of the parameter that is
being calibrated. When the readings have been stable for approximately 30 seconds, press Enter
to accept the calibration. The calibrated value is bolded on the example screen on the following
page.
5.
Press Enter to return to the Calibrate menu, and proceed to the next calibration.
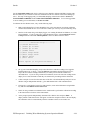
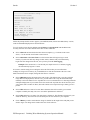
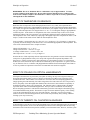
CALIBRATION EXAMPLE
The example below for calibration of specific conductance, is designed to demonstrate the general calibration
protocol for all parameters. From the Calibrate menu, press 1-Conductivity and the following display will be
shown.
------------Cond calibration----------1-SpCond
2-Cond
3-Salinity
Select option (0 for previous menu): 1
Select 1-SpCond (the generally-recommended method for calibration of a conductivity sensor), the following
prompt will appear which calls for your numerical input.
Enter SpCond in mS/cm (10):
As noted above, the number in parentheses is the default value of this parameter and will be used in the
calibration if only Enter is pressed without typing in another value. Similar prompts will be displayed during
the calibration of all parameters, but for some sensors, such as pH, no default values are provided. In these
cases, the user must input a numerical value and then press Enter.
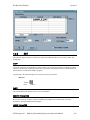
After the calibration value is input and Enter is pressed, a real-time display similar to the following will then
appear on the screen..
Date
Time
Temp SpCond Sal
Cl2
Cl2 chrg
pH
Battery
mm/dd/yy hh:mm:ss
C mS/cm
ppt
mg/L
volts
-----------------------------------------------------------------------------To calibrate, press <Enter> when the readings are stable.
05/05/97 08:39:51 20.83 9.602 8.837
1.04
8.5
7.06
10.2
Note that all parameters that have been enabled will appear - not just the one being calibrated at the moment.
The user should carefully observe the stabilization of the readings of the parameter that is being calibrated
YSI Incorporated
Drinking Water Monitoring Systems Operations Manual
2-30
Sondes
Section 2
and, when the readings are stable for approximately 30 seconds, press Enter to implement the calibration and
the following message will appear.
Calibrated.
Press <Enter> to continue.
NOTE: If an ERROR message appears, begin the calibration procedure again. Be certain that the value you
enter for the calibration standard is correct. Also see Section 8, Troubleshooting for more information on
error messages.
CAUTION: Be certain to immerse the entire sonde in solution standards for calibration of all
parameters. Most calibrations require readings not only from the sensor being calibrated but also
from the temperature sensor.
Specific start-up calibration procedures for all sensors that commonly require calibration are
provided in the following paragraphs of this section. Remember that these are basic protocols
designed to get the user up and running with your 6-series sonde. A more-detailed discussion of
sensor calibration can be found in Section 2.9.2.
CONDUCTIVITY
This procedure calibrates conductivity, specific conductance, salinity, and total dissolved solids.
Place the correct amount (see Tables 1-4) of 10 mS/cm conductivity standard (YSI 3163 is recommended)
into a clean, dry or pre-rinsed calibration cup.
Before proceeding insure that the sensor is as dry as possible. Ideally, rinse the conductivity sensor with a
small amount of standard that can be discarded. Be certain that you avoid cross-contamination of standard
solutions with other solutions. Make certain that there are no salt deposits around the pH/ORP probe,
particularly if you are employing standards of low conductivity.
Carefully immerse the probe end of the sonde into the solution. Gently rotate and/or move the sonde up
and down to remove any bubbles from the conductivity cell. The probe must be completely immersed past
its vent hole. Using the recommended volumes from the table in the previous subsection should insure that
the vent hole is covered.
Allow at least one minute for temperature equilibration before proceeding.
From the Calibrate menu, select Conductivity to access the Conductivity calibration procedure and then 1SpCond to access the specific conductance calibration procedure. Enter the calibration value of the
standard you are using (mS/cm at 25°C) and press Enter. The current values of all enabled sensors will
appear on the screen and will change with time as they stabilize.
Observe the readings under Specific Conductance or Conductivity and when they show no significant
change for approximately 30 seconds, press Enter. The screen will indicate that the calibration has been
accepted and prompt you to press Enter again to return to the Calibrate menu.
Rinse the sonde in tap or purified water and dry the sonde.
NOTE: The YSI conductivity system is very linear over its entire 0-100 mS/cm range. Therefore, it is
usually not necessary to use calibration solutions other than the 10 mS/cm reagent recommended above for
all environmental applications from low conductivity freshwater to seawater. YSI does offer the 3161
YSI Incorporated
Drinking Water Monitoring Systems Operations Manual
2-31
Sondes
Section 2
(1 mS/cm) and 3165 (100 mS/cm) conductivity standards for users who want to assure maximum accuracy
at the high and low ends of the sensor range. Users of the 1 mS/cm standard should be particularly careful
to avoid contamination of the reagent. In fact, because of contamination issues, YSI does not recommend
using standards less than 1 mS/cm. For example:
pH 2-POINT
Using the correct amount of pH 7 buffer standard (see Tables 1-4) in a clean, dry or pre-rinsed calibration
cup, carefully immerse the probe end of the sonde into the solution. Allow at least 1 minute for
temperature equilibration before proceeding.
From the Calibrate menu, select ISE1 pH to access the pH calibration choices and then press 2- 2-Point.
Press Enter and input the value of the buffer (7 in this case) at the prompt. Press Enter and the current
values of all enabled sensors will appear on the screen and change with time as they stabilize in the
solution. Observe the readings under pH and when they show no significant change for approximately 30
seconds, press Enter. The display will indicate that the calibration is accepted.
After the pH 7 calibration is complete, press Enter again, as instructed on the screen, to continue. Rinse
the sonde in water and dry the sonde before proceeding to the next step.
Using the correct amount (see Tables 1-4) of an additional pH buffer standard into a clean, dry or prerinsed calibration cup, carefully immerse the probe end of the sonde into the solution. Allow at least 1
minute for temperature equilibration before proceeding.
Press Enter and input the value of the second buffer at the prompt. Press Enter and the current values of
all enabled sensors will appear on the screen and will change with time as they stabilize in the solution.
Observe the readings under pH and when they show no significant change for approximately 30 seconds,
press Enter. After the second calibration point is complete, press Enter again, as instructed on the screen,
to return to the Calibrate menu.
Rinse the sonde in water and dry. Thoroughly rinse and dry the calibration containers for future use.
NOTE: The majority of environmental water of all types has a pH between 7 and 10. Therefore, unless
you anticipate a pH of less than 7 for your application, YSI recommends a two point calibration using pH 7
and pH 10 buffers.
The next calibration instructions are only for the 6920DW sonde. If you do not have this sonde, you
may skip to 2.7, Taking Readings.
+
-
-
AMMONIUM (NH4 ) , CHLORIDE (Cl ) and NITRATE (NO3 ) 3-POINT
WARNING: AMMONIUM AND NITRATE SENSORS CAN ONLY BE USED AT DEPTHS OF LESS
THAN 50 FEET (15 METERS). USE OF THE SENSORS AT GREATER DEPTHS IS LIKELY TO
PERMANENTLY DAMAGE THE SENSOR MEMBRANE.
The calibration procedures for ammonium, nitrate or chloride are similar to pH except for the reagents in
the calibration solutions. Suggested values for calibrants are 1 and 100 mg/L of either ammonium-nitrogen
(NH4-N) or nitrate-nitrogen (NO3-N). Suggested values for calibrants are 10 and 1000 mg/L of Chloride
(Cl-).
NOTE: The following procedure requires one portion of the high concentration calibrant and two portions
of the low concentration calibrant. The high concentration solution and one of the low concentration
YSI Incorporated
Drinking Water Monitoring Systems Operations Manual
2-32
Sondes
Section 2
solutions should be at ambient temperature. The other low concentration solution should be chilled to less
than 10°C prior to beginning the procedure.
Place the proper amount of 100 mg/L standard (1000mg/l for chloride) into a clean, dry or pre-rinsed
transport cup. Carefully immerse the probe end of the sonde into the solution. Allow at least 1 minute for
temperature equilibration before proceeding.
Select Ammonium, Nitrate, or Chloride to access the appropriate calibration choices. Then select 3-3Point. Press Enter and input the concentration value of the standard as requested. Press Enter and the
current values of all enabled sensors will appear on the screen and will change with time as they stabilize in
the solution. Observe the readings under NH4+, NO3-, or Cl- . When they show no significant change for
approximately 30 seconds, press Enter.
After the first calibration point is complete, proceed as instructed on the screen, to continue. Rinse the
sonde in water and dry the sonde prior to the next step.
Place the proper amount of 1 mg/L standard for Ammonium or Nitrate (10 mg/l for Chloride) into a clean,
dry or pre-rinsed transport cup. Carefully immerse the probe end of the sonde into the solution. Allow at
least 1 minute for temperature equilibration before proceeding.
Press Enter and input the concentration value of the standard as requested.
Press Enter and the current values of all enabled sensors will appear on the screen and will change with
time as they stabilize in the solution. Observe the readings under NH4+, NO3-, or Cl-.and when they have
show no significant change for approximately 30 seconds, press Enter.
After the second value calibration is complete, press Enter to continue. Place the proper amount of chilled
1 mg/L standard (10 mg/L for the chloride) into a clean, dry or pre-rinsed calibration cup. Carefully
immerse the probe end of the sonde into the solution. Allow at least 5 minutes for temperature
equilibration before proceeding.
Press Enter and input the concentration value of the standard as requested.
Press Enter and the current values of all enabled sensors will appear on the screen and will change with
time as they stabilize in the solution. Observe the readings under NH4+, NO3-. or Cl-. and when they show
no significant change for approximately 30 seconds, press Enter.
After the third value calibration is complete, press Enter to return to the Calibrate menu.
Thoroughly rinse and dry the calibration cups for future use.
CALIBRATION TIP: HOW TO AVOID DRIFT DURING CALIBRATION OF THE NH4+, NO3- AND
Cl- PROBES AFTER pH CALIBRATION. Exposure to the high ionic content of pH buffers can cause a
significant, but temporary, drift in these ISE probes (ammonium, nitrate and chloride probes). Therefore,
when calibrating the pH probe, YSI recommends that you use one of the following methods to minimize
errors in the subsequent readings:
¾
Calibrate pH first, immersing all of the probes in the pH buffers. After calibrating pH, place the
probes in 100 mg/L nitrate or ammonium standard or 1000 mg/L chloride standard and monitor the
reading. Usually, the reading starts low and may take as long as 30 minutes to reach a stable value.
When it does, proceed with the calibration.
¾
When calibrating pH, remove ISE modules from the sonde bulkhead and plug the ports. After pH
calibration is complete, replace the ISE sensors and proceed with their calibration with no stabilization
delay.
YSI Incorporated
Drinking Water Monitoring Systems Operations Manual
2-33
Sondes
Section 2
TURBIDITY 2-POINT
Select Optic T (or Optic C) –Turbidity-6136 from the Calibrate Menu and then 2-2-Point.
NOTE: Before calibrating your 6136 turbidity sensor, pay particular attention to the following cautions:
•
To properly calibrate YSI turbidity sensors, you MUST use standards that have been prepared
according to details in Standard Methods for the Treatment of Water and Wastewater (Section 2130 B).
Acceptable standards include (a) formazin prepared according to Standard Methods; (b) dilutions of
4000 NTU formazin concentrate purchased from Hach; (c) Hach StablCalTM standards in various NTU
denominations; and (d) AMCO-AEPA standards prepared specifically for the 6026 and 6136 by either
YSI or approved vendors who are listed on the YSI website (www.ysi.com). STANDARDS FROM
OTHER VENDORS ARE NOT APPROVED FOR THE YSI TURBIDITY SYSTEM AND THEIR
USE WILL LIKELY RESULT IN BOTH CALIBRATION ERRORS AND INCORRECT FIELD
READINGS.
•
For AMCO-AEPA standards, the value entered by the user during the calibration protocol is
DIFFERENT depending on which sensor (6026 or 6136) is being calibrated. This reflects the
empirically determined fact that 6026 and 6136 sensors that have been calibrated to the same value in
the primary standard formazin, will have different responses in suspensions of the AEPA-AMCO
beads. This effect is likely due to the larger optical cell volume of the 6136. Thus, for example, the
label of the YSI 6073 turbidity standard bottle indicates that the value of the standard is 100 NTU
when used for calibration of the 6026 sensor, but 123 NTU when used to calibrate the 6136.
Note that the phenomenon of a sensor-specific formazin/AEPA-AMCO ratio is well known for sensors
other than the 6026 and 6136.
•
When calibrating a 6136 turbidity sensor you MUST use either a modified calibration cup arrangement, an
extended length calibration cup or laboratory glassware with the probe guard installed for the calibration.
See section 2.6.1 above for details. Failure to carry out the calibration properly can result in inaccurate
readings, particularly water of very low turbidity.
•
Before proceeding with the calibration, be certain that the probe compartment of the sonde has been
cleaned and is free of debris. Solid particles from this source, particularly those carried over from past
deployments, will contaminate the standards during your calibration protocol and cause either
calibration errors and/or inaccurate field data.
•
One standard must be 0 NTU, and this standard must be calibrated first.
To begin the calibration, place the correct amount (see Tables 1-5) of 0 NTU standard (clear deionized or
distilled water) into the calibration cup provided with your sonde. Immerse the sonde in the water. Input
the value 0 NTU at the prompt, and press Enter. The screen will display real-time readings that will allow
you to determine when the readings have stabilized. Activate the wiper 1-2 times by pressing 3-Clean
Optics as shown on the screen, to remove any bubbles. After stabilization is complete, press Enter to
“confirm” the first calibration and then, as instructed, press Enter to continue.
Dry the sonde carefully and then place the sonde in the second turbidity standard (100 NTU is
suggested) using the same container as for the 0 NTU standard. Input the correct turbidity value in
NTU, press Enter, and view the stabilization of the values on the screen in real-time. As above,
activate the wiper with the “3” key or manually rotate the sonde to remove bubbles. After the
readings have stabilized, press Enter to confirm the calibration and then press Enter to return to the
Calibrate menu.
NOTE CAREFULLY: If you are calibrating a 6136 turbidity sensor you MUST use either a modified
calibration cup arrangement or laboratory glassware with the probe guard installed for the calibration. See
YSI Incorporated
Drinking Water Monitoring Systems Operations Manual
2-34
Sondes
Section 2
section 2.6.1 above for details. Failure to carry out the calibration properly can result in inaccurate readings,
particularly in water of very low turbidity.
Thoroughly rinse and dry the calibration cups for future use.
CHLOROPHYLL 1-POINT
Select Optic C -Chlorophyll from the Calibrate Menu, Chl µg/L and then 1-1 point.
NOTE: This procedure will zero your fluorescence sensor and use the default sensitivity for calculation of
chlorophyll concentration in µg/L, allowing quick and easy fluorescence measurements that are only semiquantitative with regard to chlorophyll. However, the readings will reflect changes in chlorophyll from site
to site, or over time at a single site.
To increase the accuracy of your chlorophyll measurements, follow the 2-point or 3-point calibration
protocols outlined in Section 2.9, Sonde Menu.
Before making any field readings, carefully read Section 5.12, about chlorophyll that describes practical
aspects of fluorescence measurements.
To begin the calibration, place the correct amount of clear deionized or distilled water, from Tables 1, 2 and
3, into the YSI clear calibration cup provided. Immerse the sonde in the water. Input the value 0 µg/L at
the prompt, and press Enter. The screen will display real-time readings that will allow you to determine
when the readings have stabilized. Activate the wiper 1-2 times by pressing 3-Clean Optics as shown on
the screen to remove any bubbles from the sensor. After stabilization is complete, press Enter to
“confirm” the calibration and then, as instructed, press Enter to return to the Calibrate menu.
Thoroughly rinse and dry the calibration cups for future use. For additional information related to
calibrating the chlorophyll sensor, see Sections 5.12.
RHODAMINE WT 2-POINT
Select Rhodamine from the Calibrate Menu and then 2-2-Point.
NOTE: One standard must be 0 ug/L in rhodamine WT, and this standard must be calibrated first.
To begin the calibration, place the correct amount (see Tables 1-4) of 0 standard (clear deionized or
distilled water) into the calibration cup provided with your sonde and immerse the sonde in the water.
Input the value 0 ug/L at the prompt, and press Enter. The screen will display real-time readings that
will allow you to determine when the readings have stabilized. Activate the wiper 1-2 times by
pressing 3-Clean Optics as shown on the screen, to remove any bubbles. After stabilization is
complete, press Enter to “confirm” the first calibration and then, as instructed, press Enter to
continue.
Dry the sonde carefully and then place the sonde in the second rhodamine WT standard (100 ug/L is
recommended) using the same container as for the 0 ug/L standard. Input the correct rhodamine WT
concentration in ug/L, press Enter, and view the stabilization of the values on the screen in real-time.
As above, activate the wiper with the “3” key or manually rotate the sonde to remove bubbles. After
the readings have stabilized, press Enter to confirm the calibration and then press Enter to return to
the Calibrate menu.
YSI Incorporated
Drinking Water Monitoring Systems Operations Manual
2-35
Sondes
Section 2
Thoroughly rinse and dry the calibration cups for future use.
FREE CHLORINE 1-POINT
The 6572 free chlorine sensor MUST be calibrated in situ, i.e. in flowing drinking water whose free
chlorine content has been determined by an independent method. In many cases, the independent method
involves the use of the DPD Colorimetric Method as defined in Section 4500-Cl G of Standard Methods for
the Examination of Water and Wastewater. Relatively inexpensive colorimeters, such as the YSI Models
9000 and 9100 and the Hach Model 5870000, are available for carrying out the DPD method to determine
the free chlorine in the effluent of the flow cell associated with the 6920DW or 600DW-B drinking water
studies.
After activation of the sensor according to the instruction in Section 2.6.1 above and AFTER the calibration
of all other sensors present, reinstall the free chlorine probe in the sonde bulkhead after removing the port
plug. Make certain that no moisture is present in the port before installing the probe and, if moisture is
present from the previous calibration procedures, use compressed air to dry the port.
After installing the free chlorine sensor in the sonde bulkhead, locate the flow cell which you purchased
with your drinking water sonde and install the sonde in the flow cell according to the instruction supplied
with the flow cell and as provided below:
•
Attach inlet and outlet hoses to the barbed fittings supplied with the flow cell and then insert the
fittings into the proper ports of the flow cell. Make certain that the hoses are attached very snugly
to the barb fittings to prevent any possibility of catastrophic leakage. If necessary, standard hose
clamps can be used to secure the hoses to the barbed fittings.
•
Connect the inlet line of the flow cell to a drinking water tap and run the outlet line to a drain.
Make certain that the inlet line is securely attached to the tap and that the outline line will not pop
out of the drain under flow conditions.
NOTE CAREFULLY: Make certain that the inlet line is attached to the bottom fitting of the
flow cell and the drain line is attached to the top fitting.
•
Turn on the water with a flow rate of 500-1000 mL/minute (500 mL/min minimum).
•
Break in the sensor by running it continuously in flowing tap water by one of the following
methods:
•
If using a PC with EcoWatch for sonde interface, start a Discrete Sample study at a 4 second
interval as described below and continue the study for 2-3 hours while displaying the readings
on the PC monitor.
•
If using a 650 Display/Logger for sonde interface, choose the Sonde Run selection from the
Main menu and continue the study for 2-3 hours while displaying the readings on the 650
screen.
•
If using a 6500 Process Monitor for sonde interface, simply allow the system to run for 2-3
hours while displaying the readings on the 6500 screen.
During the 2-3 hour break-in period, the Free Chlorine and Chlorine Charge readings should drop
significantly and show reasonable stability for periods of 5 minutes.
YSI Incorporated
Drinking Water Monitoring Systems Operations Manual
2-36
Sondes
Section 2
NOTE: At the end of the break-in period, the Cl2 Charge value should have a value between zero (0)
and 35. If the Cl2 charge value is greater than 35, a new membrane should be installed and the
activation and break-in process should be repeated.
The free chlorine system should be calibrated using the same basic methods employed for other sonde
sensors. The important thing to remember is to calibrate your sensor versus a flow cell effluent in the
mode which you will be using to measure free chlorine. There are four basic modes of operation as
described below with their corresponding calibration instructions:
1.
Stand-alone applications where data is being logged only to the internal memory of the
sonde at a user selected interval. For this mode of operation, make certain that the Autosleep
RS232 feature is activated in the Advanced|Setup menu and that the Chlorine warm-up time is set
to 60 seconds in the Advanced|Sensor menu. With these software entries in place, the user will
input the free chlorine value from the DPD analysis of the flow cell effluent, and the unit will
automatically calibrate after the selected warm up time. This method is described in greater detail
below.
2.
Applications where the sonde is attached to a YSI 6500 Process Monitor utilizing the Sample
and Hold feature of the sonde software. For this mode of operation, first activate the Sample
and Hold feature from the Setup sonde menu of the 6500 (Press the Esc and Enter keys of the
6500 front panel simultaneously to access this menu). Then select the desired interval for data to
be sent to the 6500. Exit to the main display mode of the 6500 by pressing the Esc key
repetitively and then press the Cal key on the 6500 front panel. Highlight the free chlorine sensor
entry, enter the value from the DPD analysis of the effluent and press Enter. Then press Enter
again to confirm the calibration. See Section 4 of the 6500 manual for detailed calibration
instructions.
3.
Applications where the sonde is attached to a YSI 6500 Process Monitor and is outputting
data continuously to the 6500. For this mode of operation, access the Sonde setup menu of the
6500 as described above and make certain that the Sample and Hold feature is INACTIVE. Then
exit to the main display mode of the 6500 by pressing the Esc key repetitively and press the Cal
key on the 6500 front panel. Highlight the free chlorine sensor entry, enter the value from the
DPD analysis of the effluent and press Enter. Observe the free chlorine readings in real-time
and, when stable, press the Enter key to confirm the calibration. See Section 4 of the 6500
manual for detailed calibration instructions. Note that this mode of operation is NOT
RECOMMENDED by YSI due to sensor maintenance issues which are explained in detail in
Appendix G of this manual.
4.
Applications where the sonde is attached to a PC and data is being displayed to the
computer monitor using the Real-Time mode of Ecowatch for Windows. For this mode of
operation, your must calibrate the free chlorine sensor before activating the Real-Time EcoWatch
mode or after activating the Real-time feature of EcoWatch. Access the sonde menu after
connection of the sonde to a PC or 650 Display logger and make certain that the Autosleep RS232
feature is activated in the Advanced|Setup menu and that the Chlorine warm-up time is set to 60
seconds in the Advanced|Sensor menu. With these software entries in place, the user will input
the free chlorine value from the DPD analysis of the flow cell effluent, and the unit will
automatically calibrate after the selected warm up time. Following calibration, attach the sonde to
the PC and click on the Real-Time entry in the top toolbar (Do NOT click on the sonde icon in the
lower toolbar). The Real-Time study will start automatically with data displayed graphically on
the PC monitor and logged to the hard drive of the PC under the file name which you have
selected. See Section 4.3.5 of this manual for detailed instruction in using the EcoWatch RealTime mode.
Details of the calibration for the simple Unattended sample mode of operation (#1 above) are provided
below. The initial instructions involving the setup of the flow cell/sonde system are also valid for
calibration in the other modes of operation.
YSI Incorporated
Drinking Water Monitoring Systems Operations Manual
2-37
Sondes
Section 2
For the Unattended sample mode, the free chlorine sensor should be calibrated AFTER a logging study
has been underway for 2-3 hours to assure the stabilization of the free chlorine sensor in the flowing tap
water. The setup of the logging study (or Unattended Sampling) is described in detail in Section 2.7
UNATTENDED SAMPLING and 2.9.1 Run UNATTENDED SAMPLING. To view the logged data
to assure stability prior to calibration, see Section 2.9.3 File.
To calibrate the free chlorine sensor, carry out the following steps:
•
Make certain that the flow of water through the flow cell is 500-1000 mL per minute (minimum
500 mL/min) and that the flow is set to the rate at which you will carry out your monitoring study.
•
Interface to the sonde using a 650 display/logger, a PC running EcoWatch for Windows, or a 6500
Process Monitor. If you are using a PC or the 650 Display/Logger, select 8-Advanced and then
2-Setup and make certain that Autosleep RS232 is active as shown in the box below.
-------------Advanced setup----------1-(*)VT100 emulation
2-( )Power up to Menu
3-( )Power up to Run
4-( )Comma radix
5-(*)Auto sleep RS232
6-(*)Auto sleep SDI12
7-( )Multi SDI12
8-( )Full SDI12
Select option (0 for previous menu): 0
•
Set up your Unattended Sampling study as described above and allow readings to be logged to
internal memory for 2-3 hours. Using the File|View command as described in Section 2.9.3,
inspect the free chlorine readings and after they are stable proceed with the calibration as
described below. If you are using a 6500 Process Monitor, observe the real-time readings on the
display for 2-3 hours and make certain they are stable before proceeding with the calibration.
•
Collect a sample of water from the outlet hose of the flow cell and immediately analyze it for free
chlorine using an independent method, e.g., the DPD method with a YSI 9100 Photometer.
•
If using a PC or 650 Display/Logger for sonde interface, return to the Main menu using the Esc
key and select 2-Calibrate and then 4-Free Cl2.
•
NOTE: If using a 6500 Process Monitor for the sonde interface, perform the calibration according
to the instructions in Section 4 of the 6500 manual.
•
At the prompt, input the independently determined free chlorine value and press Enter. A
display similar to that shown below will appear on either the computer monitor or the 650 display.
The calibration will occur automatically after the countdown on the screen reaches zero.
YSI Incorporated
Drinking Water Monitoring Systems Operations Manual
2-38
Sondes
Section 2
===================================================================
Temp SpCond
Sal DOsat
Cl2
Depth
pH NH4+ N NO3- N Turbid
C mS/cm
ppt
%
mg/L
feet
mg/L
mg/L
NTU
------------------------------------------------------------------Stabilizing: 38
•
After the warm-up time is complete, the readings just before and just after calibration are
displayed. When you press Enter, the screen returns to the Free Chlorine Calibration menu.
2.7 TAKING READINGS
After you have (1) enabled the sensors, (2) set the report to show the parameters that you want to see, and
(3) calibrated the sensors, you are now ready to take readings.
There are two basic approaches to sampling, Discrete and Unattended. Using discrete sampling, the sonde
is connected via a communication cable to a PC or terminal. The sampling frequency is likely to be rapid
(seconds) in order to obtain a representative sampling as you move from site to site. Readings will probably
be logged to several different files.
Unattended sampling is normally done with sondes that have internal batteries as do the 600DW-B and the
6920DW. The sampling frequency is likely to be longer (minutes). A sonde is typically deployed for days
or weeks at a time, and readings will be logged to a single file. The communication cable may be
disconnected and internal battery power used to operate the sonde. Alternatively, the sonde may connect
via SDI-12 communication to a data collection platform (DCP). Sondes without batteries need to be
connected to an external power source for unattended sampling.
NOTE: The 600DW-B and 6920DW are designed around the long-term, continuous monitoring of
drinking water if flow cell applications. Thus, for most studies data will either be stored at relatively
long sample intervals (5-60 minutes) to the internal memory of the sonde using the Unattended mode
or the sonde will be attached to a 6500 Process Monitor and the data will be output in 4-20 mA or
Modbus format and stored in a SCADA system or similar external logger. Thus, while the Discrete
sample mode may be required in some set-up and troubleshooting operations, most studies will be
done using the Unattended mode.
Select 1-Run from the Main menu to begin taking readings or to set/verify the parameters required for a
study. There are two options in the Run menu as shown below.
---------------Run setup--------------1-Discrete sample
2-Unattended sample
Select option (0 for previous menu): 1
YSI Incorporated
Drinking Water Monitoring Systems Operations Manual
2-39
Sondes
Section 2
DISCRETE SAMPLING
NOTE THAT THIS FUNCTION WILL NORMALLY BE USED IN DRINKING
WATER STUDIES ONLY DURING THE BREAK-IN OF THE SENSOR AFTER
RECONDITIONING.
Select 1-Discrete sample from the Run menu. The Discrete sample menu will be displayed.
------------Discrete sample-----------1-Start sampling
2-Sample interval=4
3-File=
4-Site=
5-Open file
Select option (0 for previous menu):
Select 2-Sample Interval to type a number that represents the number of seconds between samples. The
maximum sample interval is 32767 seconds (9+ hours). The factory default sample interval is 4 seconds
and works best for most discrete sampling applications. See section 2.9.1 for more details.
Select 3-File to enter a filename with a maximum of 8 characters. This is the file to which you will log
readings.
If you started sampling without entering a filename, the default name NONAME1 will be assigned to your
file. Whenever you press 1-LOG last sample or 2-LOG ON/OFF from the menu, NONAME1 will be
opened during sampling. If this happens, and you want to restart the file with a different name, press
5-Close file and rename the file.
Select 4-Site to assign a site name with a maximum of 31 characters. This allows you to enter the name of
the site where you are sampling.
When you select 5-Open File, a file is opened and the number 5 changes to Close File. When you are
finished logging data to the file, press 5-Close File and number 5 changes back to Open File.
Now select 1-Start sampling to start discrete sampling.
After the initial sampling time interval has passed, (e.g. 4 seconds in the example above), sequential lines
of data (similar to that shown below) will appear on the screen.
YSI Incorporated
Drinking Water Monitoring Systems Operations Manual
2-40
Sondes
Section 2
============================================================
Temp
Sal
DO%
pH
Depth
pH
NH4+ N NO3- N Turbid
C
ppt
%SAT
feet
mg/L
mg/L
NTU
-----------------------------------------------------------*** 1-LOG last sample
2-LOG ON/OFF, 3-Clean optics ***
23.54
0.00 96.5
8.20
1.001 5.20 0.853 0.522
0.3
*** LOG is ON, hit 2 to turn it OFF, 3-Clean optics ***
23.53
0.00 96.5
8.20
1.001 5.20 0.856 0.520
0.3
23.53
0.00 96.5
8.20
1.000 5.20 0.854 0.521
0.3
23.53
0.00 96.5
8.20
1.000 5.19 0.852 0.522
0.3
*** 1-LOG last sample
2-LOG ON/OFF, 3-Clean optics ***
23.53
0.00 96.5
8.20
1.000 5.19 0.852 0.522
0.3
Sample logged.
The following prompt will appear just below the screen header:
1-LOG last sample, 2-LOG ON/OFF, 3-Clean optics.
By entering 1–LOG last sample, a single line of data can be logged to sonde memory and the following
message will be displayed: Sample logged.
By entering 2-LOG ON/OFF, a set of data can be logged to memory and the following message will be
displayed: LOG is ON, hit 2 to turn it OFF, 3-Clean optics. Press 2 again to terminate logging.
By entering 3-Clean optics, if your unit has an optical (turbidity, chlorophyll, or rhodamine WT) probe, the
wiper will clean the optical surface. The 3-Clean optics portion of the prompt will only appear if an
optical probe was installed and enabled.
Select Esc or press 0 to exit discrete sampling.
UNATTENDED SAMPLING
Select 2-Unattended Sampling from the Run menu. The Unattended sample menu will be displayed. Use
the following example to understand the unattended sampling option.
Example: You are going to deploy the sonde for 2 weeks, collecting a set of
readings every 15 minutes. You start at 6:00 PM on July 17, 1996 and end the
sampling at 6:00 PM on July 31, 1996. The site is Clear Lake, near the spillway,
and you want to log all of the readings to a single file CLRLAKE3.
YSI Incorporated
Drinking Water Monitoring Systems Operations Manual
2-41
Sondes
Section 2
------------Unattended setup----------1-Interval=00:15:00
2-Start date=07/17/96
3-Start time=18:00:00
4-Duration days=365
5-File=
6-Site=
7-Bat volts: 11.6
8-Bat life 25.1 days
9-Free mem 41.3 days
A-1st sample in 8.10 minutes
B-View params to log
C-Start logging
Follow the prompts on this screen to prepare your 600XLM, 6600, 6920 or 600 OMS (battery version)
sonde for unattended deployment as described below:
To verify and/or correct the time and date enter 4-Status or 5-System menu from the Main menu.
You may enter the correct date and time from either of these submenus.
Select 1-Interval and enter the desired time between samples (e.g. 15 minutes in the screen
above). Use the 24-hour clock format to enter interval.
Select 2-Start Date and 3-Start Time to set the time that data will begin to log to sonde
memory. If you do not make any change to these entries, then the study will automatically
begin at the next integral time interval, once you have pressed C-Start logging.
Example: If the current time is 17:20:00 and your sample interval is 15 minutes, logging
will automatically begin at 17:30:00.
It is better to start the study prior to taking the unit to the field so that you can confirm that
readings are being saved to memory. If you should desire to start the instrument at the site at 6:00
PM as noted in the above example, change the Start Time to 18:00:00.
Select 4-Duration and set the length of the study in days. The default value is 365 days (which is
longer than most deployments). In most cases, you will either want to stop the unattended study
manually or allow the batteries to be expended. It is wise to set the duration to a value longer than the
anticipated deployment. If you cannot retrieve the sonde at the expected time due to factors beyond
your control such as weather or illness, data will continue to be acquired as long as battery power is
present.
Select 5-File and enter a name of no more than 8 characters that will be used by your external
computer to identify the study. Be sure to use ONLY alpha/numeric characters.
Select 6-Site and enter a site name of no more than 31 characters. This filename will appear in your
sonde file directory, but will not be used to identify the file after transfer to your computer.
Check 7-Battery to make certain that the voltage is suitable for the length of the study that you are
about to begin. No change can be made to this item via the software.
YSI Incorporated
Drinking Water Monitoring Systems Operations Manual
2-42
Sondes
Section 2
Skip B-View params to log in this initial test study. This feature will be explained in detail in Section
2.9, Sonde Menu.
After making the above entries, the sonde software will automatically calculate the expected battery life,
and the time it will take for the sonde memory to be filled. This information is displayed on the screen for
your consideration as items 8, 9, and A. If the battery life or the free memory capacity will be exceeded
sooner than the duration, you may want to make some changes to the entries. For example, you can free up
memory in the sonde by uploading all existing data from the sonde memory to your PC and then deleting
them out of the sonde (see 3-File from Main Menu). You may want to change the batteries for longer
battery life. You can lengthen the sampling interval to extend both battery life and memory capacity.
Review the screen below, which now displays the entries made above and reflects your logging conditions.
------------Unattended setup----------1-Interval=00:15:00
2-Start date=07/17/96
3-Start time=18:00:00
4-Duration days=365
5-File=clrlake3
6-Site=Clear Lake at Spillway
7-Bat volts: 11.6
8-Bat life 25.1 days
9-Free mem 41.3 days
A-1st sample in 4.10 minutes
B-View params to log
C-Start logging
Once you press C-Start logging, a screen will appear to request confirmation.
-------------Start logging------------Are you sure?
1-Yes
2-No
Select option (0 for previous menu):
Select 1-Yes and the screen will change.
YSI Incorporated
Drinking Water Monitoring Systems Operations Manual
2-43
Sondes
Section 2
----------------Logging---------------1-Interval=00:15:00
2-Next at 07/17/96
3-Next at 18:00:00
4-Stop at 07/31/96
5-Stop at 18:00:00
6-File=clrlake3
7-Site=Clear Lake at Spillway
8-Bat volts: 11.7
9-Bat life 25.5 days
A-Free mem 41.3 days
B-Stop logging
Select option (0 for previous menu):
The display now shows the next date and time for logging, and the stop date and time for the logging study.
Most importantly, note that the bottom command now shows B-Stop logging, a confirmation that the
logging has indeed been initiated.
The Unattended study will terminate when the duration you specified has expired or the batteries are
expended. If you want to terminate sooner, simply select 2-Unattended sample from the Run menu, then
B-Stop logging. Select 1-yes and return to the Unattended setup menu.
Stop logging?
1-Yes
2-No
Select option (0 for previous menu):
YSI Incorporated
Drinking Water Monitoring Systems Operations Manual
2-44
Sondes
Section 2
2.8 USING ECOWATCH TO CAPTURE, UPLOAD AND
ANALYZE DATA
CAPTURE
EcoWatch for Windows can be used to capture data in real-time to your PC’s hard drive or to a floppy disk.
To utilize this function, interface the sonde to your PC via a COM port, run EcoWatch for Windows, and
follow the step by step instructions below.
, choose the proper Com port, and confirm.
1.
Click on the sonde icon
2.
From the Main sonde menu press 1-Run and then 1-Discrete Sample.
3.
Make sure that the sample interval is set to the correct value. If it is not, change it to the correct
value.
4.
Close the terminal window by clicking on the X in the upper right hand corner. Do not close
EcoWatch for Windows.
5.
Open the Real-Time menu, click on New and select the location where you want to data
transferred. Name the file, making sure that the name has extension .RT. The default location for
the file is in the Data subdirectory of the ECOWWIN directory.
6.
Click OK. After EcoWatch sets up the sonde for the study, data transfer will begin at the sample
rate you selected. The data will be automatically plotted with autoscaling and saved as a .DAT file
at your chosen selection.
7.
To terminate the study, open the Real-Time menu, choose Close, and click OK.
UPLOAD DATA
EcoWatch for Windows software is reporting and plotting software for use with the YSI 6-Series sondes.
Instructions for installing this software were included in Section 2.1, Getting Started. This program can
also be used to upload and view data logged to sonde memory during either discrete or unattended
sampling.
If the sonde was deployed unattended (without a cable), clear debris and water from the bulkhead connector
cap. Then remove the cap and connect the calibration cable (or field cable and adapter) from the sonde to
your computer.
You may now retrieve data files using the following procedure. Remember these are files in the sonde
directory, not files in the EcoWatch directory.
from the menu bar. A terminal
Run EcoWatch software on your PC and select the Sonde icon
interface window (like that shown below) will appear. If a “#” prompt appears instead of the Main sonde
menu, type “menu” at the prompt to generate the display as shown. Then press 3-File to view data
handling options.
YSI Incorporated
Drinking Water Monitoring Systems Operations Manual
2-45
Sondes
Section 2
-----------------File----------------1-Directory
4-View file
2-Upload
5-Quick view file
3-Quick Upload
6-Delete all files
Select option (0 for previous menu): 1
Select 1-Directory to view all files currently stored in the sondes flash disk memory, the screen below
shows 6 files. All data files (.dat extension) could be uploaded to EcoWatch for viewing or plotting, but
you do not need to upload all files in the directory. The file with the .glp extension contains the calibration
record of the sonde. It is fully described in Sections 2.9.2 and 2.9.3 below. Details of any of the studies
can be obtained by pressing the number key associated with the file in the Directory.
Filename
Samples
1-BRIDGE1.dat
19
2-BRIDGE2.dat
27
3-UPLAKE.dat
33
4-CLRLAKE2.dat
167
5-DWNLAKE2.dat
31
6-00003001.glp
3
Select option (0 for previous menu): 4
-------------File details------------1-View file
2-File:CLRLAKE2.dat
3-Samples:
167
4-Bytes:
4421
5-First:08/23/2001
6-First:08:33:40
7-Last :08/23/2001
8-Last :09:04:20
9-Interval:00:00:10
A-Site:Clear Lake
Select 2-Upload to view file lists in memory, and upload the data to PC-based software.
Prior to upload, a “Time window” display appears that will allow you to select portions of the logged data
to upload. You may select 1-Proceed to upload all logged data from the dates and times displayed.
YSI Incorporated
Drinking Water Monitoring Systems Operations Manual
2-46
Sondes
Section 2
--------------Time window-------------1-Proceed
2-Start date=08/14/96
3-Start time=18:00:00
4-Stop date=08/28/96
5-Stop time=11:00:00
Select option (0 for previous menu):
Select 1-Proceed. Choose the appropriate file transfer protocol (in this example, PC6000) and a status box
will show the progress of the upload. Verification of a successful transfer is indicated when all of the
requested data have been transferred to the C:\ECOWIN\DATA subdirectory of your PC and automatically
assigned a “.DAT” extension.
---------------File type--------------1-PC6000
2-Comma & ' ' Delimited
3-ASCII Text
Select option (0 for previous menu):
Select 3-Quick Upload to transfer the last logged file in its entirety to your computer. As noted above, the
file will then be resident in the C:\ECOWIN\DATA subdirectory.
Select 4-View File to examine the data in any file currently stored in the sondes flash disk memory. You
will first view the same screen as viewed in the Directory menu. From this menu choose the file of interest,
then, using the Time window menu, choose the dates and/or times of interest. If you choose dates or times
that are not within the designated start and stop times, no data will be displayed.
You also may choose the entire file. You can use the Space Bar to stop and restart the scrolling at any
time. Use the Esc key to stop the view.
YSI Incorporated
Drinking Water Monitoring Systems Operations Manual
2-47
Sondes
Section 2
Select 5-Quick view file to view the last page of data from the last data file in flash disk memory. This
feature is particularly useful to quickly review any recently acquired data so that system performance can
be assessed.
Select 6-Delete all files to IRREVERSIBLY remove all files (INCLUDING the .glp file that contains
calibration information) from the sonde flash disk memory. It is critical not to use this option until all
relevant data from sonde memory is transferred to your computer via one of the upload options. There is a
verification screen that appears, so that pressing the number 6-key does not immediately delete all files.
REPORTING AND PLOTTING DATA WITH ECOWATCH
There are many features in EcoWatch related to viewing, plotting, manipulating and reporting data
collected from a 6-Series sonde. EcoWatch includes a Windows Help section for convenient reference that
describes all of the software’s features. This section of the manual describes the most commonly used
functions of the program and Section 4, EcoWatch for Windows, is a detailed manual for EcoWatch
software.
For the purposes of describing and demonstrating EcoWatch plotting, reporting and data manipulation
capabilities, we use the file SAMPLE.DAT available on the compact disk that was enclosed with your 6series sonde. This file will be copied to your hard drive during EcoWatch installation and should be
available to you for the instructions below.
When you are ready to move beyond the example SAMPLE.DAT file and analyze data collected from the
sonde, locate and open the appropriate .DAT file from your data upload exercise. These data are normally
found at C:\ECOWWIN\DATA\. An example filename is 1097CM01.DAT.
NOTE: In the instructions below that refer to clicking the mouse button, we always refer to the left mouse
button unless otherwise specified.
OPENING A DATA FILE
If EcoWatch is not running, open the program by double clicking on the EcoWatch icon. Click on File to
view a drop-down menu similar to the one shown in the figure below. From this menu click on Open, then
locate the drive and directory where SAMPLE.DAT (or your file of interest) resides. Alternatively, if you
have been using EcoWatch during setup and checkout, you may be able to click on the file of your choice
in the most recently opened files.
Once the SAMPLE.DAT file is open you should see a plot, as shown in the figure below, which graphically
represents seven days of sonde data for six different water quality parameters plotted as a function of date
and time. Each set of data is autoscaled to allow you to see the minimum and maximum values for each
parameter during the one-week study.
YSI Incorporated
Drinking Water Monitoring Systems Operations Manual
2-48
Sondes
Section 2
Opening a File
Some daily variations may be noticed in parameters such as dissolved oxygen, pH and temperature in this
particular study. This is fairly typical in many natural bodies of water. Note also that conductivity is low
at both ends of the graph. You may notice similar perturbations in some of the other readings as well. In
this example, the sonde was not in the water for a short time at the beginning and end of the study. Not
only can you see exactly when the sonde went in and out of the water, but the bottom graph shows the
depth at which the sonde was deployed.
Notice also that you now see a new set of menu items in the top line. Some of these functions are
specifically related to viewing and manipulating data. Next we will examine some of the viewing options.
VIEWING DATA
To look at some of the viewing options, click on View (see figure below). Note that the Toolbar and Status
Bar are turned on (check mark). In addition, the 4-Digit Year expression is checked. Also note that a
check mark is just left of the Graph choice. When a check is next to Graph, all data are expressed
graphically in the opening window.
To show data in both graphical and data table format, highlight the Table menu item, then click or press
Enter. The graphical portion of the window becomes compressed, and the data table becomes visible. If
you then click on View again, both the Graph and Table items have check marks to their left, indicating
that both functions are turned on. You may use your mouse to scroll up/down and left/right to view data.
YSI Incorporated
Drinking Water Monitoring Systems Operations Manual
2-49
Sondes
Section 2
Viewing Options
It may be somewhat awkward to scan the data table in this manner; therefore you have the option to turn
off the graphical representation and allow the table to fill the window. See the figure below. Notice now
that when you click on View, the Graph item is no longer checked.
Viewing the Data in Table Format
YSI Incorporated
Drinking Water Monitoring Systems Operations Manual
2-50
Sondes
Section 2
Viewing features such as Grid, Marker, Zoom In, Zoom Out and Unzoom are all available when you
activate the Graph function. Give each a try as you practice and learn more about the many features of
EcoWatch.
The Statistics and Study functions of EcoWatch are shown in the figure below. Both provide overview
information related to the study data. The Statistics function lists minimum, maximum, mean and standard
deviation information for each parameter activated. The Study function provides useful information about
the design of the study including sample interval, date/time, number of samples, sensor identification and
parameters reported. The Statistics and Study windows may be activated over either graph or table
presentations.
To view either of these windows, click on View, highlight the desired function and click again. The
window opens on top of the table or graph, similar to what is shown in the figure below. Only one of these
windows may open at one time. To continue, you must close the Statistics or Study window to return to the
graph or table and activate the top line menu again.
As before practice viewing the functions mentioned above to gain more familiarity with these features.
YSI Incorporated
Drinking Water Monitoring Systems Operations Manual
2-51
Sondes
Section 2
Statistics and Study Information
Next, with the Statistics and Study windows closed, return to the View menu, close Table and activate
Graph.
Using the right mouse button, click at any point on the graph. A dotted vertical line appears along with
specific data values in boxes to the left of the displayed graphs, as shown in the figure below. You can
hold down the right mouse button and move the mouse to scan the entire graph that is displayed in the
window. The values in the boxes change as you move the mouse. This feature is very useful for
quantifying specific data without the need to open the data table and scroll through what may be thousands
of data points. Note also that the exact time and date change to let you know specifically when an event of
interest occurred.
YSI Incorporated
Drinking Water Monitoring Systems Operations Manual
2-52
Sondes
Section 2
Viewing the Data with Right-Button Mouse Function
CHANGING DISPLAY FORMATS USING SETUP
Beyond selecting data viewing options such as table format or graphical format, you may also customize
your data displays. For example, you may change the order in which parameters are viewed, you may add
and delete parameters, you may change plot appearance using different interval times and different units,
and you may change the x-axis if you prefer a parameter other than date or time.
The Top Line menu selection that allows you to select some of these parameter changes is Setup. Click on
Setup, then Parameters. From here there are four submenus that allow you to Add/Remove parameters,
change Units, change sample interval and/or x-axis (Attributes) and change the Names of the parameters
you have assigned, as shown in the figure below.
YSI Incorporated
Drinking Water Monitoring Systems Operations Manual
2-53
Sondes
Section 2
Changing the Appearance of a Graph or Table
If you are displaying the graph, you may change the appearance by changing font, font style, size and text
color. You may also change page color, trace color and graph background color. You may assign a custom
2-line title for the graph, and finally, you may display 1 trace or 2 per set of axes. For display of table
formatted results you may change font, font style, size and text color. In addition, you may change table
color and highlight color.
The menu structure is easy to follow. Try some changes to gain familiarity with these Setup display
options.
YSI Incorporated
Drinking Water Monitoring Systems Operations Manual
2-54
Sondes
Section 2
CHANGING DISPLAY FORMATS USING ‘GRAPH’ FUNCTION
The top line menu labeled Graph, as the name suggests, can be used to examine critical events within the
graphical format. You may be able to more clearly understand an event by zooming in/out, centering an
event of interest, and setting limits to focus in on a specific area of the graph. In addition to modifying
along the x-axis, you may also manually scale the y-axis. This may allow you to discard a noise spike and
obtain better resolution of events unrelated to the noise. Functions like Autoscale, Redraw and Cancel
Limits are all used to “undo” some of the customization functions. You will see some of these functions in
the figures below.
One very commonly used function is Limit Data Set. If you choose this function by clicking on the
highlighted item as shown below, you then use the mouse to move your cursor to the left limit of an area of
interest, click once, then move the mouse to the right limit of interest and click again. The result will be a
close up look at the specific area of the graph you have defined.
Selecting a Subset of Data within a Graph
YSI Incorporated
Drinking Water Monitoring Systems Operations Manual
2-55
Sondes
Section 2
Using Limit Data Set to Display a Subset of Data
To return to the full set of data again, click on Graph, then Cancel Limits. If you desire a hard copy of
any graph or table, or even a subset expression as shown above, you may use the Edit, Copy command to
‘copy’ the graph in the active window to the “Clipboard”. You can then ‘paste’ this graph to the Windows
application program of your choice. You may also be able to print graphs and tables as described in the
next section.
SAVE, IMPORT, EXPORT AND PRINT COMMANDS
Under File function in the top line menu, you can save a particular presentation version of a data file and
give the presentation a customized name. For example, you might want to call the expanded plot in the
figure above “DIURNAL” using the File|Save Data Display command. This presentation will be saved
with your data file and can be recalled in further by using the File|Load Data Display command. You can
also export your custom data display as a spreadsheet compatible file (.CDF or .TXT) or print it to a
compatible printer. You may also create a custom report format using the File|Report command. See the
figure below for the File menu, which shows these commands. Use the Window’s Help function to learn
more about these features.
YSI Incorporated
Drinking Water Monitoring Systems Operations Manual
2-56
Sondes
Section 2
Saving, Exporting, Printing and Related Functions
EXAMPLE OF CUSTOMIZING A SUBSET OF SAMPLE.DAT
To conclude this section we have used a few of the many tools available in EcoWatch to demonstrate how
you might use this powerful plotting and reporting program to express study results. We encourage you to
try some of the tools and learn more about EcoWatch by using the Window’s Help function, which is
available when the EcoWatch program is running.
Using SAMPLE.DAT we decided that some of the data were not of particular interest, so using top line
menu item Setup, then Parameters, then Add/Remove, we removed ORP and Depth results from the data
set. Note that we have not deleted this information from the file, but rather we are choosing not to display
it. You can always return to this function and add original data back. Under the same Parameters
function, we have selected Attributes and changed the Average Interval from the default 0 to 60. Since
data was collected every 15 minutes, the change to a 60 minute interval helps to smooth out the graph and
average out any short term “noise” events.
Next, we again select Setup, then Graph. From the functions available, we first selected Title Page… and
typed in a name (Clear Lake Study #2) and below that we typed the parameters that are shown in the graph.
Just below Title Page, we clicked on 2 Traces per Graph. This combines adjacent parameters which is
sometimes useful in parameter and event evaluation. For example, in the second graph shown in the figure
below, you see that DO concentration and pH seem to track rather closely and change in a diurnal rhythm.
In actuality, when DO levels drop in a natural body of water, CO2 often builds up forming carbonic acid
which leads to lower pH readings. DO rises again during the day due to photosynthesis, CO2 then falls and
pH increases again. The final plot after making these changes in shown in the figure below.
YSI Incorporated
Drinking Water Monitoring Systems Operations Manual
2-57
Sondes
Section 2
Customizing a Graph from SAMPLE.DAT
Finally, we selected File|Save Data Display and gave the custom plot the name “4PARAM” to that the
presentation can be immediately recalled in the future.
As you become more familiar with EcoWatch for Windows, the plotting, analysis and reporting functions
can be accomplished easily and quickly. Practice with all of the functions and, again, do not forget to use
Window’s Help for more detail, or see Section 4, EcoWatch for Windows.
YSI Incorporated
Drinking Water Monitoring Systems Operations Manual
2-58
Sondes
Section 2
2.9 SONDE MENU
The functions of the sondes are accessible through the sonde menu. The sonde menu structure makes it
simple and convenient to select functions. This section provides a description of the menus and their
capabilities.
When moving between menus within the sonde software structure, use the 0 or Esc to back up to the
previous menu. To exit menus and return to the sonde command line (the # sign), press 0 or Esc until the
question “Exit menu (Y/N)?” appears. Type Y and the command prompt (“#”) will be shown. To return
to the Main sonde menu, type menu and press Enter. To return to the Main menu of the sonde, type
“menu” after the “#” and press Enter.
IMPORTANT MESSAGE!
WHAT IF THERE IS NO RESPONSE TO A KEYSTROKE?
To save power, the sondes will power down automatically if no interaction from the keyboard occurs for
approximately 60 seconds when an Autosleep function (RS232 or SDI12) is activated in the Advanced
Setup menu. When the software is in this “sleep” mode, the first subsequent keystroke simply “wakes it
up” and has no visible effect on the display. The next keystroke after the unit is “awakened” will be input
to the software in the intended manner. Thus, if you press a key after the sonde has been inactive for some
time and nothing seems to happen, press the key again.
To gain experience with the sonde menus, select the sonde icon in EcoWatch for Windows and press
Enter. See the figure below for the Sonde Menu Flow Chart.
In the following subsections you will learn about the functions of the various menu items and when to use
them. The discussion of the menu and submenu functions is organized in numerical order, beginning with
Section 2.9.1 RUN.
YSI Incorporated
Drinking Water Monitoring Systems Operations Manual
2-59
Sondes
2.9.1
Section 2
RUN
Select 1-Run from the Main menu to begin taking readings or to set/verify the parameters required for a
study. There are two options in the Run menu.
---------------Run setup--------------1-Discrete sample
2-Unattended sample
Select option (0 for previous menu): 1
DISCRETE SAMPLING
Discrete sampling is usually used in short term, spot sampling applications when the user is present at the
site and the unit is attached to a data logger or laptop PC. It could be used in the vertical profiling of a lake
or river where the user lowers the sonde incrementally into the water, and data acquired for a few minutes
at each depth. In this section, you will learn how to use the sonde menu structure to open and close files,
set the interval between samples, start the sampling operation, and log data to the internal memory of the
sonde.
Select 1-Discrete sample from the Run menu. The Discrete sample menu will be displayed.
------------Discrete sample-----------1-Start sampling
2-Sample interval=4
3-File=
4-Site=
5-Open file
Select option (0 for previous menu):
YSI Incorporated
Drinking Water Monitoring Systems Operations Manual
2-60
Sondes
Section 2
Select 1 – Start sampling option to start discrete sampling. After the initial sampling time interval has
passed (4 seconds in the screen above), sequential lines of data will appear on the screen.
=============================================================================
Date
Time Temp SpCond
Sal Cl2
Depth
pH
Turbid Battery
mm/dd/yy hh:mm:ss
C mS/cm
ppt mg/L
feet
NTU volts
-----------------------------------------------------------------------------*** 1-LOG last sample
2-LOG ON/OFF, 3-Clean optics***
05/05/97 10:04:40 21.57 0.009
0.00 0.95 -0.293 7.55
0.3
10.2
05/05/97 10:04:44 21.57 0.009
0.00 0.96 -0.300 7.55
0.3
10.3
*** LOG is ON, hit 2 to turn it OFF, 3-Clean optics***
05/05/97 10:04:48 21.58 0.009
0.00 0.95 -0.302 7.55
0.3
10.3
05/05/97 10:04:52 21.58 0.009
0.00 0.95 -0.302 7.55
0.3
10.3
05/05/97 10:04:56 21.58 0.009
0.00 0.95 -0.303 7.55
0.3
10.2
05/05/97 10:05:00 21.58 0.009
0.00 0.96 -0.303 7.55
0.3
10.3
*** 1-LOG last sample
2-LOG ON/OFF , 3-Clean optics***
05/05/97 10:05:04 21.58 0.009
0.00 0.96 -0.304 7.55
0.3
10.3
Sample logged.
05/05/97 10:05:08 21.58 0.009
0.00 0.95 -0.305 7.55
0.3
10.3
The following prompt will appear just below the screen header:
1-LOG last sample, 2-LOG ON/OFF, 3-Clean optics
•
By entering 1–LOG last sample, A single line of data can be logged to sonde memory and the
following message will be displayed: Sample logged.
•
By entering 2-LOG ON/OFF, a set of data can be logged to memory and the following message will
be displayed: LOG is ON, hit 2 to turn it OFF, 3-Clean optics. Press 2 again to terminate logging.
•
By entering 3-Clean optics, if your unit has an optical (turbidity, chlorophyll or rhodamine WT)
probe, the wiper will clean the optical surface. The 3-Clean optics portion of the prompt will only
appear if an optical probe was installed and enabled.
Select Esc or press 0 and return to the Discrete Sampling menu.
From the Discrete Sampling menu, select 2-Sample Interval to type a number that represents the number
of seconds between samples. The maximum sample interval is 32767 seconds (9+ hours). The factory
default sample interval is 4 seconds and works best for most discrete sampling applications. The shortest
possible sample interval for obtaining new free chlorine readings is 4 seconds. If a smaller interval is
selected, then the Cl2 readings remain constant for the number of samples necessary to fill 4 seconds.
NOTE: If your have used your sonde with a 650 MDS data logger, the Sample Interval automatically be
changed to 0.5 seconds.
YSI Incorporated
Drinking Water Monitoring Systems Operations Manual
2-61
Sondes
Section 2
Sampling Faster Than 0.5 Seconds
For special applications, your sonde is capable of faster sampling. The only limitation is a reduction of the
number of sensors selected. To determine the maximum sampling frequency for your sensor setup, divide
36 by the number of enabled sensors in addition to the free chlorine sensor.
Example:
If you enable any three sensors plus DO, divide 36 by 3 to obtain 12 samples/second (12 Hz) or 0.083
seconds between samples as the maximum sampling frequency. Remember that for sample intervals less
than 4 seconds, free chlorine readings are updated only every 4 seconds. Thus, at 12 Hz, the display will
show 48 identical Cl2 readings before a change occurs. Note also that at a faster sampling rate, consecutive
readings are closer together, the threshold for any one sensor is less likely to be exceeded, and the data
filter is less likely to disengage. For these applications you may want to adjust your threshold settings
accordingly. See Section 2.9.8 for more information on the data filter.
Select 3-File to enter a filename with a maximum of 8 characters. You will log readings to the filename
that you enter.
If you started sampling without entering a filename, the default name NONAME1 will be assigned to your
file. Whenever you press 1-LOG last sample or 2-LOG ON/OFF from the menu, NONAME1 will be
opened during sampling. If this happens, and you want to restart the file with a different name, press 5Close file and rename the file.
Select 4-Site to assign a site name with a maximum of 31 characters This allows you to enter the name of
the site where you are sampling.
When you select 5-Open File, a file is opened and the number 5 changes to Close File. When you are
finished logging data to the file, press 5-Close File and designation changes back to Open File. When you
start logging the Open File designation changes automatically to Close File.
Now select 1-Start sampling to start discrete sampling.
After the initial sampling time interval has passed, sequential lines of data will appear on the screen and
you can log single or sequential data points and wipe the surface of your optical probe as described above.
UNATTENDED SAMPLING
This option is used for long-term deployment of the battery-powered sonde when the user is not present at
the site. Prior to this selection, the sonde is usually attached to a computer in a laboratory and set up to
automatically log data to sonde memory at a fairly long time interval (15-60 minutes). The unit is then
taken to the field site and left for an extended time period (30 – 60 days). When the study is complete, or
the batteries are expended, the unit is brought back to the laboratory and the data file is uploaded to a
computer. Quality assurance checks are performed prior to redeployment.
Select 2-Unattended Sampling from the Run menu. The Unattended sample menu will be displayed. Use
the following example to understand the unattended sampling option.
YSI Incorporated
Drinking Water Monitoring Systems Operations Manual
2-62
Sondes
Section 2
------------Unattended setup----------1-Interval=00:15:00
2-Start date=07/17/96
3-Start time=18:00:00
4-Duration days=14
5-File=clrlake3
6-Site=Clear Lake at Spillway
7-Bat volts: 9.1
8-Bat life 21.2 days
9-Free mem 18.9 days
A-1st sample in 8.10 minutes
B-View params to log
C-Start logging
Follow the prompts on this screen to prepare your 600XLM, 6600, 6920, or 600 OMS (battery version)
sonde for unattended deployment as described below:
•
Verify that the current time and date are correct to ensure that your unattended sampling study begins
and ends when you desire. To verify correct the time and date, return to the Main menu and enter 4Status or 5-System. You may enter the correct date and time from either of these submenus.
•
Select 1-Interval and enter the desired time between samples. Use the 24-hour clock format to enter
interval.
•
Select 2-Start Date and 3-Start Time to set the time that data will begin to log to sonde memory. If
you do not make any change to these entries, then the study will automatically begin at the next
integral time interval once you have pressed C-Start logging.
Example: If the current time is 17:20:00 and your sample interval is 15 minutes, logging will
automatically begin at 17:30:00.
It is better to start the study prior to taking the unit to the field so that you can confirm that readings are
being saved to memory and carry out initial quality assurance measurements. However, if your study
demands that you start the instrument at the site at 6:00 PM, change the Start Time to 18:00:00.
•
Select 4-Duration and set the length of the study in days. The default value is 365 days (which is
longer than most deployments). In most cases, you will either want to stop the unattended study
manually or allow the batteries to be expended. It is wise to set the duration to a value longer than the
anticipated deployment. If you cannot retrieve the sonde at the expected time due to factors beyond
your control such as weather or illness, data will continue to be acquired as long as battery power is
present.
•
Select 5-File and enter a name of no more than 8 characters that will be used by your external
computer to identify the study. Be sure to use ONLY alpha/numeric characters.
•
Select 6-Site and enter a site name of no more than 31 characters. This filename will appear in your
sonde file directory, but will not be used to identify the file after transfer to your computer.
•
Check 7-Battery to make certain that the voltage is suitable for the length of the study that you are
about to begin. No change can be made to this item via the software.
YSI Incorporated
Drinking Water Monitoring Systems Operations Manual
2-63
Sondes
•
Section 2
Select B-View Parameters to log to confirm that your sensor and report setups are configured
correctly as described in Sections 2.9.6 and 2.9.7. An example screen is shown below.
-------------Params
1-Temp C
2-Cond mS/cm
3-Cl2 mg/L
4-Cl2chrg
5-pH
to log------------6-Orp mV
7-NH4+ N mg/L
8-NO3- N mg/L
9-Turbid NTU
A-Battery volts
Select option (0 for previous menu):
In some cases, the View params to log screen only identifies the raw parameters that are used in the
calculation of the items that you have selected in the Report setup.
Example: f specific conductance is selected in the Report setup, it does not appear under
Parameters to log because it is calculated from Conductivity and Temperature. In all but a few
cases, the proper configuration of Parameters to log will be automatically set up as long as the
sensor is enabled.
There are several items that must be activated in the Report setup so they will be available from the file
after upload. These special parameters are: Cl2 Chg, pH mV, NH4+ mV, NO3- mV, Cl -mV, and
Fluorescence %FS. If you want to log any of these parameters to your data file, be certain that they are
active in the Report setup before you begin the unattended study.
After making the above entries, the sonde software will automatically estimate the expected battery life,
and the time it will take for the sonde memory to be filled. This information is displayed on the screen for
your consideration as items 9 and A. If the battery life or the free memory capacity will be exceeded
sooner than the duration, you may want to make some changes to the entries. For example, you can free up
memory in the sonde by uploading all existing files from the sonde memory to your PC and then deleting
them from the sonde (see 3-File from Main Menu). You may want to change the batteries for longer
battery life. You can lengthen the sampling interval to extend both battery life and memory capacity.
The predicted battery life is an estimate only. The temperature of the site and the brand of batteries used
can affect battery life. It is recommended to recover the sonde earlier than the predicted battery life, and to
use new batteries for each deployment.
Once you press C-Start logging, the following screen will appear.
-------------Start logging------------Are you sure?
1-Yes
2-No
Select option (0 for previous menu):
Select 1-Yes and the screen will change.
YSI Incorporated
Drinking Water Monitoring Systems Operations Manual
2-64
Sondes
Section 2
----------------Logging---------------1-Interval=00:15:00
2-Next at 07/17/96
3-Next at 18:00:00
4-Stop at 07/31/96
5-Stop at 18:00:00
6-File=clrlake3
7-Site=Clear Lake at Spillway
8-Bat volts: 9.0
9-Bat life 21.2 days
A-Free mem 18.9 days
B-Stop logging
Select option (0 for previous menu):
The display now shows the next date and time for logging and the stop date and time for the logging study.
Most importantly, note that the bottom command now shows B-Stop logging, a confirmation that the
logging has indeed been initiated.
The Unattended study will terminate when the duration you specified has expired or the batteries are
expended. If you want to terminate sooner, simply select 2-Unattended sample from the Run menu, then
B-Stop logging. Select 1-Yes and return to the Unattended setup menu.
Stop logging?
1-Yes
2-No
Select option (0 for previous menu):
2.9.2 CALIBRATE
All of the sonde sensors (except temperature) require periodic calibration to assure high performance.
However, the calibration protocols for free chlorine are significantly different depending on whether the
sonde is being set up for spot sampling or longer term unattended monitoring studies. This difference is
user-selectable and is required primarily because the optimal performance of the free chlorine sensor
cannot be attained unless the control of this sensor varies from short term to long term applications.
For spot sampling it is best to pulse the sensor continuously during the Run mode to attain the most
accurate results and optimize the response time. However, this continuous pulsing is not ideal for longer
term logging studies in which the sonde data is captured to sonde memory or to a data collection platform
at much less frequent intervals (e.g. 15 minutes). Continuous pulsing not only shortens the time between
required probe maintenance, but consumes more power. With proper selection of the “Auto sleep” option
(discussed in detail in Section 2.9.8, Advanced Menu), the user can configure the sonde software to either
run continuously or “go to sleep” between samples to minimize free chlorine probe wear and conserve
power. The effect of this choice on the user interface relative to free chlorine calibration is significant as
described below:
YSI Incorporated
Drinking Water Monitoring Systems Operations Manual
2-65
Sondes
Section 2
If “Auto sleep” is deactivated, the sonde runs continuously no matter what sample interval has been
selected. Under these conditions, the user retains manual control of the free chlorine calibration
routine, viewing the stabilization of the readings in real time and confirming the calibration with
keyboard entries.
If “Auto sleep” is activated, the sonde will ‘warm up’ the sensors for the period of time selected for
the free chlorine sensor. Under these conditions, the user loses manual control of the free chlorine
calibration routine. Free chlorine will automatically calibrate after the selected time for warm up of the
Cl2 sensor has expired. In this mode of calibration, you do not observe stabilization of the readings in
real time, but instead will observe a countdown of the warm up period followed by a message
indicating that the free chlorine calibration is complete.
Only the calibration of free chlorine is affected by whether “Auto sleep” is on or off; the user retains
manual control of the calibration of all other parameters regardless of the “Auto sleep” setting. Once a
particular warm up time (in seconds) has been utilized in free chlorine calibration, the length of that time
should not be changed during a study. A new calibration should be performed whenever the value of the
warm up time is altered.
From the Main sonde menu select 2-Calibrate. The Calibrate menu will be displayed. Only the enabled
parameters will be available for calibration.
---------------Calibrate-------------1-Conductivity
6-ISE3 NH4+
2-Free Cl2
7-ISE4 NO33-Pressure-Abs
8-ISE5 Cl4-ISE1 pH
9-Turbidity
5-ISE2 ORP
A-Chlorophyll
Select option (0 for previous menu):
CONDUCTIVITY
Select 1-Conductivity to calibrate the conductivity probe and a second menu will offer you the options of
calibrating in specific conductance, conductivity, or salinity. Calibrating any one option automatically
calibrates the other two. After selecting the option of choice (specific conductance is normally
recommended), you will be asked to enter the value of the standard used during calibration. Be certain that
the units are correct. After pressing Enter, you will be able to follow the stabilization of the readings and
confirm the calibration when the readings are stable by pressing Enter as instructed on the screen. Then,
as instructed, press Enter again to return to the Calibrate menu.
FREE CHLORINE WITH FOR UNATTENDED STUDIES WITH INTERNAL LOGGING OF DATA
NOTE CAREFULLY: The 6572 free chlorine sensor MUST be calibrated in situ, i.e. in flowing drinking
water whose free chlorine content has been determined by an independent method. In many cases, the
independent method involves the use of the DPD Colorimetric Method as defined in Section 4500-Cl G of
Standard Methods for the Examination of Water and Wastewater. Relatively inexpensive colorimeters,
such as the YSI Models 9000 and 9100 and the Hach Model 5870000, are available for carrying out the
DPD method to determine the free chlorine in the effluent of the flow cell associated with the 6920DW or
600DW-B drinking water studies.
YSI Incorporated
Drinking Water Monitoring Systems Operations Manual
2-66
Sondes
Section 2
In most cases, the free chlorine sensor should be calibrated AFTER a logging study has been underway for
2-3 hours to assure the stabilization of the free chlorine sensor in the flowing tap water. The setup of the
logging study (or Unattended Sampling) is described in detail in Section 2.7 UNATTENDED
SAMPLING and 2.9.1 Run UNATTENDED SAMPLING. To view the logged data to assure stability
prior to calibration, see Section 2.9.3 File.
To calibrate the free chlorine sensor carry out the following steps:
Following the calibration of all other sensors present, reinstall the free chlorine probe in the sonde bulkhead
after removing the port plug. Make certain that no moisture is present in the port before installing the
probe and, if moisture is present from the previous calibration procedures, use compressed air to dry the
port.
•
Break in the sensor according to the instructions in Section 2.6 above.
•
Locate the flow cell which was supplied with your 6920DW or 600DW-B and attach it to the sonde
according to the instructions that were supplied with the flow cell. Note that for flow cell studies on
drinking water with the 600DW-B, YSI recommends that users purchase a 655488 Extended
Calibration Cup Sleeve and substitute the extended length sleeve from the calibration cup for the
shorter sleeve in the flow cell kit. The extra length will eliminate any bottom interference on the
turbidity readings and will be compatible with calibration of the turbidity sensor using the extended
length calibration cup.
•
Attach inlet and outlet hoses to the barbed fittings supplied with the flow cell and then insert the
fittings into the proper ports of the flow cell. Make certain that the hoses are attached very snugly to
the barb fittings to prevent any possibility of catastrophic leakage. If necessary, standard hose clamps
can be used to secure the hoses to the barbed fittings.
•
Connect the inlet line of the flow cell to a drinking water tap and run the outlet line to a drain.
Make certain that the inlet line is securely attached to the tap and that the outline line will not pop
out of the drain under flow conditions.
•
Turn on the water to the cell so that the flow is 500-1000 mL per minute (minimum 500 mL/min)
and allow water to flow through the cell for at least 1 hour before proceeding.
•
Set up your Unattended Sampling study as described above and allow readings to be logged to
internal memory for 2-3 hours. Using the File|View command as described in Section 2.9.3,
inspect the free chlorine readings and after they are stable proceed with the calibration as
described below.
•
Collect a sample of water from the outlet hose of the flow cell and immediately analyze it for free
chlorine using an independent method, e.g., the DPD method with a YSI 9100 Photometer.
•
Interface to the sonde using a 650 display/logger or a PC running EcoWatch for Windows.
Choose 8-Advanced and then 2-Setup and make certain that Autosleep RS-232 is active as
shown in the box below.
YSI Incorporated
Drinking Water Monitoring Systems Operations Manual
2-67
Sondes
Section 2
-------------Advanced setup----------1-(*)VT100 emulation
2-( )Power up to Menu
3-( )Power up to Run
4-( )Comma radix
5-(*)Auto sleep RS232
6-(*)Auto sleep SDI12
7-( )Multi SDI12
8-( )Full SDI12
Select option (0 for previous menu): 0
Return to the Main menu using the Esc key and select 2-Calibrate and then 4-Free Cl2.
At the prompt, input the independently determined free chlorine value and press Enter. A display similar
to that shown below will appear on either the computer monitor or the 650 display. The calibration will
occur automatically after the countdown on the screen reaches zero.
===================================================================
Temp SpCond
Sal Cl2 Cl2 Chrg
Depth
pH NH4+ N NO3- N Turbid
C mS/cm
ppt mg/L
feet
mg/L
mg/L
NTU
------------------------------------------------------------------Stabilizing: 38
After the warm-up time is complete, the readings just before and just after calibration are displayed. When
you press Enter, the screen returns to the Free Chlorine Calibration menu.
FREE CHLORINE WITH SONDE ATTACHED TO 6500 PROCESS MONITOR
See Appendix G. Using Your Drinking Water Sonde with a YSI
6500 Process Monitor for enhanced calibration instructions and a detailed description of the Sample and
Hold feature.
NOTE CAREFULLY: The 6572 free chlorine sensor MUST be calibrated in situ, i.e. in flowing drinking
water whose free chlorine content has been determined by an independent method. In many cases, the
independent method involves the use of the DPD Colorimetric Method as defined in Section 4500-Cl G of
Standard Methods for the Examination of Water and Wastewater. Relatively inexpensive colorimeters,
such as the YSI Models 9000 and 9100 and the Hach Model 5870000, are available for carrying out the
DPD method to determine the free chlorine in the effluent of the flow cell associated with the 6920DW or
600DW-B drinking water studies.
In most cases, the free chlorine sensor should be calibrated AFTER it has been attached to the 6500 Process
Monitor for 2-3 hours to assure the stabilization of the free chlorine sensor in the flowing tap water. See
YSI Incorporated
Drinking Water Monitoring Systems Operations Manual
2-68
Sondes
Section 2
the manual which was supplied with your 6500 for the setup of the overall system and a description of the
displayed information.
To calibrate the free chlorine sensor using a 6500, carry out the following steps:
•
Following the calibration of all other sensors present, reinstall the free chlorine probe in the sonde
bulkhead after removing the port plug. Make certain that no moisture is present in the port before
installing the probe and, if moisture is present from the previous calibration procedures, use
compressed air to dry the port.
•
Break in the sensor according to the instructions in Section 2.6 above.
•
Locate the flow cell which was supplied with your 6920DW or 600DW-B and attach it to the sonde
according to the instructions that were supplied with the flow cell. Note that for flow cell studies on
drinking water with the 600DW-B, YSI recommends that users purchase a 655488 Extended
Calibration Cup Sleeve and substitute the extended length sleeve from the calibration cup for the
shorter sleeve in the flow cell kit. The extra length will eliminate any bottom interference on the
turbidity readings and will be compatible with calibration of the turbidity sensor using the extended
length calibration cup.
•
Attach inlet and outlet hoses to the barbed fittings supplied with the flow cell and then insert the
fittings into the proper ports of the flow cell. Make certain that the hoses are attached very snugly to
the barb fittings to prevent any possibility of catastrophic leakage. If necessary, standard hose clamps
can be used to secure the hoses to the barbed fittings.
•
Connect the inlet line of the flow cell to a drinking water tap and run the outlet line to a drain.
Make certain that the inlet line is securely attached to the tap and that the outline line will not pop
out of the drain under flow conditions.
•
Turn on the water to the cell so that the flow is 500-1000 mL per minute (minimum 500 mL/min)
and allow water to flow through the cell for at least 1 hour before proceeding.
•
Connect the drinking water sonde to the 6500 using a YSI 609X field cable. Make sure that
readings are displayed on the screen in real-time.
•
Activate the Sample and Hold feature of the software by pressing the Esc and Enter keys on the
6500 front panel simultaneously and then selecting the Setup sonde menu. After activation of
the feature, use the arrow keys to set the sample interval.
•
Observe the displayed free chlorine readings for 2-3 hours to assure that they are stable. Then
proceed with the calibration as described below.
•
Collect a sample of water from the outlet hose of the flow cell and immediately analyze it for free
chlorine using an independent method, e.g., the DPD method with a YSI 9100 Photometer.
•
Press the “Cal” key on the 6500 face plate and then select Free Cl2. Press Enter and then input
the correct chlorine value in mg/L as determined by the DPD test. Press Enter and the calibration
will occur automatically. See the 6500 manual for additional details about the calibration
procedure.
pH
When selecting 4–ISE1 pH, you will be given the choice of 1-point, 2-point, or 3-point calibrations.
YSI Incorporated
Drinking Water Monitoring Systems Operations Manual
2-69
Sondes
Section 2
Select the 1-point option only if you are adjusting a previous calibration. If a 2-point or 3-point calibration
has been performed previously, you can adjust the calibration by carrying out a one point calibration.
Immerse the sonde in a buffer of known pH value and press Enter. You will be prompted to type in the pH
value of the solution. Press Enter again, and the screen will display real-time readings that will allow you
to determine when the pH and temperature readings have stabilized. Pressing Enter will confirm the
calibration. Then, as instructed, press Enter again to return to the Calibrate menu. This calibration
procedure adjusts only the pH offset and leaves the previously determined slope unaltered.
Select the 2-point option to calibrate the pH probe using only two calibration standards. In this procedure,
the pH sensor is calibrated using a pH 7 buffer and pH 4 buffer. A two point calibration procedure (as
opposed to a 3-point procedure) can save time if the pH of the media being monitored is known to be either
basic or acidic. For example, if the pH of a pond is known to vary between 5.5 and 7, a two-point
calibration with pH 7 and pH 4 buffers is appropriate. Three point calibration with an additional pH 10
buffer will not increase the accuracy of this measurement since the pH is not within this higher range.
To begin the calibration, immerse the sonde in one of the buffers and enter the actual pH value. Press
Enter, and the screen will display real-time readings that will allow you to determine when the pH sensor
has stabilized. Pressing Enter will confirm the calibration. Following the instructions on the screen, place
the sonde in the second pH buffer, input the pH value, press Enter, and view the stabilization of the values
on the screen in real time. After the readings have stabilized, press Enter to confirm the calibration. Then,
as instructed, press Enter again to return to the Calibrate menu.
Select the 3-point option to calibrate the pH probe using three calibration solutions. In this procedure, the
pH sensor is calibrated with a pH 7 buffer and two additional buffers. The 3-point calibration method
assures maximum accuracy when the pH of the media to be monitored cannot be anticipated. The
procedure for this calibration is the same as for a 2-point calibration, but the software will prompt you to
select a third pH buffer to complete the 3-point procedure.
ORP
Select 5-ISE2 ORP to calibrate the ORP sensor. Immerse the sonde in a solution with a known oxidation
reduction potential value (we recommend Zobell solution) and press Enter. You will be prompted to enter
the ORP value of the solution. Press Enter, and monitor the stabilization of the ORP and temperature
readings. After no changes occur for approximately 30 seconds, press Enter to confirm the calibration.
Then, as instructed, press Enter again to return to the Calibrate menu.
The following calibrations are for the 6920DW sonde only. If you do not have this sonde, skip to
Section 2.9.6, Report.
AMMONIUM
When selecting 6–ISE3-NH4+, you will be given the choice of 1-point, 2-point, or 3-point calibrations for
your ammonium (NH4+) sensor.
Select the 1-point option only if you are adjusting a previous calibration. If a 2-point or 3-point calibration
has been performed previously, you can adjust the calibration by doing a one point calibration. Immerse
the sonde in any solution of known ammonium concentration and press Enter. You will be prompted to
type in the NH4+ value (in mg/L of NH4-N) of the solution you are using. Press Enter again, and the screen
will display real-time readings that will allow you to determine when the NH4+ readings have stabilized.
Pressing Enter will confirm the calibration.
Select the 2-point option to calibrate the NH4+ probe using only two calibration standards that are both at
approximately the temperature of your environmental sample. In this procedure, the NH4+ sensor is usually
YSI Incorporated
Drinking Water Monitoring Systems Operations Manual
2-70
Sondes
Section 2
calibrated using solutions that contain 1 and 100 mg/L of NH4-N . Be certain that the calibration solution
and sensor are thermally equilibrated prior to entering NH4+ values.
To begin the calibration immerse the sonde in the 1 mg/L standard, press Enter, input the NH4-N value,
and again press Enter. The screen will display real-time readings that will allow you to determine when
the sensor has stabilized. Pressing Enter will confirm the first calibration. Following the instructions on
the screen, place the sonde in the second NH4+ standard, press Enter, input the correct concentration value,
again press Enter, and view the stabilization of the values on the screen in real time. After the readings
have stabilized, press Enter to confirm the calibration. Then, as instructed, press any key to return to the
Calibrate menu.
Select the 3-point option to calibrate the NH4+ probe using three calibration solutions, two at ambient
temperature and one at a temperature significantly different from ambient. The 3-point calibration method
should be used to assure maximum accuracy when the temperature of the media to be monitored cannot be
anticipated. The procedure for this calibration is the same as for a 2-point calibration, but the software will
prompt you to place the sonde in the additional solution to complete the 3-point procedure. Be certain that
the calibration solution and sensor are thermally equilibrated prior to proceeding with the calibration. The
recommended order of calibration standards is (1) 100 mg/L standard at ambient temperature, (2) 1 mg/L
standard at ambient temperature, and (3) 1 mg/L standard at a different temperature (usually lower) than
ambient. For best results, insure a temperature difference of at least 10 C° between the two 1 mg/L
standards.
NOTE: YSI strongly recommends the use of the 3-point protocol to ensure the best possible performance
from all ISE sensors (ammonium, nitrate, and chloride)
NITRATE
When selecting 7–ISE4 NO3, you will be given the choice of 1-point, 2-point, or 3-point calibrations for
your nitrate (NO3-) sensor. The procedure is identical to that for the ammonium sensor, except that the
calibrant values are in mg/L of NO3-N instead of NH4-N.
NOTE: YSI strongly recommends the use of the 3-point protocol to ensure the best possible performance
from all ISE sensors (ammonium, nitrate, and chloride)
CHLORIDE
When selecting 8–ISE5-CL-, you will be given the choice of 1-point, 2-point, or 3-point calibrations for
your chloride (Cl-) sensor. The procedure is identical to that for the ammonium sensor, except that the
calibrant values are in mg/L of Cl instead of NH4-N. IMPORTANT: We recommend that the user employ
standards for chloride that are 10 times greater than for ammonium and nitrate. Thus, the low calibration
value should be 10 mg/L and the high calibration value should be 1000 mg/L Cl-. The difference is due to
the fact that the effect of contamination of standards from inadvertent leakage of chloride ion from either
the free chlorine probe or the reference junction of the pH probe will be less significant at higher
concentrations.
NOTE: YSI strongly recommends the use of the 3-point protocol to ensure the best possible performance
from all ISE sensors (ammonium, nitrate, and chloride)
OPTIC TURBIDITY
YSI Incorporated
Drinking Water Monitoring Systems Operations Manual
2-71
Sondes
Section 2
NOTE: Before calibrating your 6026 or 6136 turbidity sensor, pay particular attention to the following
cautions:
•
To properly calibrate YSI turbidity sensors, you MUST use standards that have been prepared
according to details in Standard Methods for the Treatment of Water and Wastewater (Section 2130 B).
Acceptable standards include (a) formazin prepared according to Standard Methods; (b) dilutions of
4000 NTU formazin concentrate purchased from Hach; (c) Hach StablCalTM standards in various NTU
denominations; and (d) AMCO-AEPA standards prepared specifically for the 6026 and 6136 by either
YSI or approved vendors who are listed on the YSI website (www.ysi.com). STANDARDS FROM
OTHER VENDORS ARE NOT APPROVED FOR THE YSI TURBIDITY SYSTEM AND THEIR
USE WILL LIKELY RESULT IN BOTH CALIBRATION ERRORS AND INCORRECT FIELD
READINGS.
•
For AMCO-AEPA standards, the value entered by the user during the calibration protocol is
DIFFERENT depending on which sensor (6026 or 6136) is being calibrated. This reflects the
empirically determined fact that 6026 and 6136 sensors that have been calibrated to the same value in
the primary standard formazin, will have different responses in suspensions of the AEPA-AMCO
beads. This effect is likely due to the larger optical cell volume of the 6136. Thus, for example, the
label of the YSI 6073 turbidity standard bottle indicates that the value of the standard is 100 NTU
when used for calibration of the 6026 sensor, but 123 NTU when used to calibrate the 6136.
Note that the phenomenon of a sensor-specific formazin/AEPA-AMCO ratio is well known for sensors
other than the 6026 and 6136.
•
The details below are relevant to the calibration of both turbidity sensors offered by YSI – 6026 and
6136. However, to calibrate a 6136 sensor, you should have Version 2.16 or later installed in your
sonde.
•
If you are calibrating a 6136 turbidity sensor you MUST use either a black bottomed calibration cup
arrangement or laboratory glassware with the probe guard installed for the calibration. See section 2.6.1
above for details. Failure to carry out the calibration properly can result in inaccurate readings,
particularly water of very low turbidity.
•
Before proceeding with the calibration, be certain that the probe compartment of the sonde has been
cleaned and is free of debris. Solid particles from this source, particularly those carried over from past
deployments, will contaminate the standards during your calibration protocol and cause either
calibration errors and/or inaccurate field data.
When selecting Optic T (or OpticC)-6026-Turbidity (or 6136-Turbidity), there will be a choice of 1point, 2-point, or 3-point calibrations for your turbidity sensor.
The 1-point option is normally used to zero the turbidity probe in 0 NTU standard. Place the sonde in clear
water (deionized or distilled) with no suspended solids, and input 0 NTU at the screen prompt. Press Enter
and the screen will display real-time readings that will allow you to determine when the turbidity readings
have stabilized. Press Enter after the readings have stabilized to confirm the calibration and zero the
sensor. Then, as instructed, press any key to return to the Calibrate menu.
Select the 2-point option to calibrate the turbidity probe using only two calibration standards. In this case,
one of the standards must be clear water (0 NTU) and the other should be in the range of known turbidity
for the water to be monitored. For example, if the water to be evaluated is known to be low in turbidity, an
appropriate choice of standards might be 0 and 10 NTU. However, for general purpose measurements an
appropriate choice of standards is usually 0 and 100 NTU.
To begin the calibration, immerse the sonde in the 0 NTU standard, as instructed, and press Enter. It is
mandatory that the 0 NTU standard be calibrated first. The screen will display real-time readings that will
allow you to determine when the readings have stabilized. Pressing Enter will confirm the first calibration.
YSI Incorporated
Drinking Water Monitoring Systems Operations Manual
2-72
Sondes
Section 2
Following the instructions on the screen, place the sonde in the second turbidity standard, input the correct
turbidity value in NTU, press Enter, and view the stabilization of the values on the screen in real-time.
After the readings have stabilized, press Enter to confirm the calibration. Then, as instructed, press any
key to return to the Calibrate menu.
Select the 3-point option for maximum accuracy over the entire range of 0 to 1000 NTU. As for the 2point procedure, one of the standards must be 0 NTU. Because of the linearity characteristics of the
sensors, we recommend that the other two standards have turbidity values of 100 and 1000 NTU.
However, the user can select any values that are deemed appropriate. The procedure for this calibration is
the same as for a 2-point calibration, but the software will prompt you to place the sonde in the additional
solution to complete the 3-point procedure.
For all turbidity calibration procedures, be certain that the standard and sensor are thermally equilibrated
prior to proceeding with the calibration.
For further information related to setting up, calibrating and running turbidity measurements, refer to
Section 5.11.
OPTIC CHLOROPHYLL
When selecting 10-Optic Chlorophyll, there will be a choice of zeroing the full scale range of the
fluorescence sensor (Fluor Zero), or calibrating with actual chlorophyll standards (µg/L 1-point, 2-point,
or 3-point).
If you have selected Fluor %FS as a parameter in Report Setup, the sonde will report only relative values
of fluorescence in the sample being measured. These values could then be converted into actual chlorophyll
concentrations in µg/L by using a post-calibration procedure, after the chlorophyll content of grab-samples
taken during a sampling or monitoring study has been analyzed in a laboratory. This determination can
involve conducting the extractive analysis procedure described for chlorophyll in Methods for the
Examination of Water and Wastewater or by carrying out an in situ measurement of chlorophyll using a
commercial benchtop fluorometer.
The Fluor zero option is used to zero the fluorescence probe in a medium that is chlorophyll-free. Place
the sonde in clear water, and input 0 at the screen prompt. Press Enter and the screen will display realtime readings that will allow you to determine when the fluorescence readings have stabilized. Press Enter
after the readings have stabilized to confirm the calibration and zero the sensor. Then, press any key to
return to the Calibrate menu.
If you select Chl µg/L in the initial calibration routine, there will be a choice of 1-point, 2-point, or 3-point
options. The 1-point selection is normally used to zero the fluorescence probe in a medium that is
chlorophyll-free. If you use this method, you will either choose to utilize the default sensitivity for
chlorophyll in the sonde software or to update a previous multipoint calibration. Usually you will place the
sonde in clear water, and input 0 µg/L at the screen prompt. After pressing Enter the screen will display
real-time readings allowing you to determine when the chlorophyll readings have stabilized. Press Enter
after the readings have stabilized to confirm the calibration and zero the sensor. Then, as instructed, press
any key to return to the Calibrate menu.
Note: For the 2-point and 3-point calibrations described below, standards of known fluorescence are
required. Two general types of standards can be used: (a) phytoplankton suspensions of known chlorophyll
content, and (b) dye solutions whose fluorescence can be correlated to that of chlorophyll. The user is
responsible for determining the chlorophyll content of phytoplankton suspensions, either by employing the
extractive analysis procedure described in Standard Methods for the Examination of Water and
Wastewater, or by analyzing the suspension in situ using a laboratory fluorometer. See Section 5,
Principles of Operation of this manual for more information about chlorophyll standards.
YSI Incorporated
Drinking Water Monitoring Systems Operations Manual
2-73
Sondes
Section 2
Select the 2-point option to calibrate the chlorophyll probe using only two calibration standards. In this
case, one of the standards must be clear water (0 µg/L) and the other should be in the range of a known
chlorophyll content of the water to be monitored. For example, if the water to be evaluated is known to be
low in chlorophyll, an appropriate choice of standards might be 0 and 10 µg/L. However, for generalpurpose measurements an appropriate choice of standards is usually approximately 100 µg/L.
To begin the calibration, immerse the sonde in the 0 µg/L standard, as instructed, and press Enter. It is
mandatory that the 0µg/L standard be calibrated first. The screen will display real-time readings that will
allow you to determine when the readings have stabilized. Pressing Enter will confirm the first calibration.
Following the instructions on the screen, place the sonde in the second chlorophyll standard, input the
correct value in µg/L, press Enter, and view the stabilization of the values on the screen in real-time. After
the readings have stabilized, press Enter to confirm the calibration. Then, as instructed, press any key to
return to the Calibrate menu.
Select the 3-point option for maximum accuracy over the entire range of 0 to 400 µg/L. As with the 2point procedure, one of the standards must be 0 µg/L. The user can select any values for the second and
third standards that are deemed appropriate. The procedure for this calibration is the same as for a 2-point
calibration, but the software will prompt you to place the sonde in the additional solution to complete the 3point procedure.
For all chlorophyll calibration procedures, be certain that the standard and sensor are thermally equilibrated
prior to proceeding with the calibration
CAUTION: To be assured of the accuracy for field measurements made with your chlorophyll sensor, you
must either initially calibrate the sensor using a phytoplankton suspension of known chlorophyll content or
post calibrate you sensor in a spreadsheet by comparing the fluorescence values obtained in field studies
with those obtained by laboratory analysis for chlorophyll on grab samples collected during the field study.
The use of chemical dye standards for “calibration” of the sensor may not result in accurate correlation
between fluorescence and actual chlorophyll readings and is designed primarily to evaluate the sensor for
drift. See Section 5. Principles of Operation for more information on the proper calibration of your
chlorophyll sensor.
OPTIC RHODAMINE WT
When selecting Rhodamine, there will be a choice of 1-point, 2-point, or 3-point calibrations for your
rhodamine WT sensor.
The 1-point option is normally used to zero the rhodamine probe in 0 ug/L standard. Place the sonde in
clear water with no suspended solids, and input 0 ug/L at the screen prompt. Press Enter and the screen
will display real-time readings that will allow you to determine when the rhodamine readings have
stabilized. Press Enter after the readings have stabilized to confirm the calibration and zero the sensor.
Then, as instructed, press any key to return to the Calibrate menu.
Select the 2-point option to calibrate the rhodamine probe using only two calibration standards. In this
case, one of the standards must be clear water (0 ug/L) and the other should be in the range of the predicted
rhodamine concentration projected for the study. For general purpose measurements an appropriate choice
of standards is usually 0 and 100 ug/L.
To begin the calibration, immerse the sonde in the 0 ug/L standard, as instructed, and press Enter. It is
mandatory that the 0ug/L standard be calibrated first. The screen will display real-time readings that will
allow you to determine when the readings have stabilized. Pressing Enter will confirm the first calibration.
Following the instructions on the screen, place the sonde in the second rhodamine standard, input the
correct rhodamine value in ug/L, press Enter, and view the stabilization of the values on the screen in real-
YSI Incorporated
Drinking Water Monitoring Systems Operations Manual
2-74
Sondes
Section 2
time. After the readings have stabilized, press Enter to confirm the calibration. Then, as instructed, press
any key to return to the Calibrate menu.
Select the 3-point option for maximum accuracy over the entire range of 0 to 200 ug/L. As for the 2-point
procedure, one of the standards must be 0 NTU. The procedure for this calibration is the same as for a 2point calibration, but the software will prompt you to place the sonde in the additional solution to complete
the 3-point procedure.
For all rhodamine calibration procedures, be certain that the standard and sensor are thermally equilibrated
prior to proceeding with the calibration.
REESTABILISHING DEFAULT CALIBRATION – “UNCAL” COMMAND
If, for any reason, you want to return to the factory default settings (slope and offset) for any parameter,
follow the instructions below:
•
Activate any calibration screen (1-point, 2-point, or 3-point) where a numerical entry is requested. In
the example below, a 2-point turbidity calibration was selected.
•
Instead of entering a numeric value, type the word “uncal” and press Enter.
•
An “uncal” entry at any calibration prompt will reset both slope and offset for this parameter to the
factory default settings.
---------Turbidity calibration-------1-1 point
2-2 point
3-3 point
Select option (0 for previous
menu): 2
Enter 1st Turbid NTU:uncal
NOTE: When using the 650 MDS as the sonde interface device, the “uncal” operation is performed by
holding the Escape key down and then pressing the Enter key. See Section 3 of this manual for more
details.
YSI Incorporated
Drinking Water Monitoring Systems Operations Manual
2-75
Sondes
Section 2
CALIBRATION RECORD – THE GLP FILE
When any sensor is calibrated, most 6-series sondes will automatically create a file in sonde memory that
provides details of the calibration coefficients before and after the calibration. The file will have a .glp
extension and will have the Circuit Board Serial # as the default filename. The file can be viewed by
following the path File|Directory|File Details|View from the Main sonde menu.
------------------File----------------1-Directory
4-View file
2-Upload
5-Quick view file
3-Quick Upload 6-Delete all files
Select option (0 for previous menu): 1
Filename
Samples
1-BRIDGE1.dat
19
2-BRIDGE2.dat
27
3-UPLAKE.dat
33
4-CLRLAKE2.dat
167
5-DWNLAKE2.dat
31
6 - 00003001.glp
39
-------------File details-------------1-View file
2-File:00003001.glp
3-Samples:
39
4-Bytes:
790
Pressing 1-View file will show the calibration record for the sonde. An example is shown below:
YSI Incorporated
Drinking Water Monitoring Systems Operations Manual
2-76
Sondes
Section 2
m/d/y hh:mm:ss
08/23/2001 17:07:50
08/23/2001 17:07:50
08/23/2001 17:07:50
08/23/2001 17:07:50
08/23/2001 17:07:50
08/23/2001 17:07:50
08/23/2001 17:07:50
08/23/2001 17:07:50
08/23/2001 17:07:50
08/23/2001 17:07:50
08/23/2001 17:07:50
08/23/2001 17:07:50
08/23/2001 17:07:50
08/23/2001 17:07:50
08/23/2001 17:07:50
08/23/2001 17:07:50
08/23/2001 17:07:50
08/23/2001 17:07:50
S/N
00003001
00003001
00003001
00003001
00003001
00003001
00003001
00003001
00003001
00003001
00003001
00003001
00003001
00003001
00003001
00003001
00003001
00003001
Type
Value
Conductivity gain 1.000000
Cl2 gain 1.000000
pH gain (pH-7)*K/mV -5.05833
pH offset (pH-7)*K 0.000000
ORP offset mV 0.000000
TDS constant 0.650000
Turb Offset 0.000000
Turb A1 500.0000
Turb M1 500.0000
Turb A2 1000.000
Turb M2 1000.000
Chl Offset 0.000000
Chl A1 100.0000
Chl M1 100.0000
Chl A2 200.0000
Chl M2 200.0000
Fluor Offset 0.000000
Cl2 gain 1.103424
The data in the display shows a new sonde (Circuit Board # 00003001) which has just had its free chlorine
sensor calibrated. Note that the initial values for all parameters are the default settings. Only the last entry
(Cl2 gain) has been affected by the calibration of the free chlorine sensor. If the conductivity sensor is now
calibrated, the new conductivity gain value is now automatically appended to the record as shown below:
m/d/y hh:mm:ss
08/23/2001 17:07:50
08/23/2001 17:07:50
08/23/2001 17:07:50
08/23/2001 17:07:50
08/23/2001 17:07:50
08/23/2001 17:07:50
08/23/2001 17:07:50
08/23/2001 17:07:50
08/23/2001 17:07:50
08/23/2001 17:07:50
08/23/2001 17:07:50
08/23/2001 17:07:50
08/23/2001 17:07:50
08/23/2001 17:07:50
08/23/2001 17:07:50
08/23/2001 17:07:50
08/23/2001 17:07:50
08/23/2001 17:07:50
08/23/2001 17:23:13
S/N
00003001
00003001
00003001
00003001
00003001
00003001
00003001
00003001
00003001
00003001
00003001
00003001
00003001
00003001
00003001
00003001
00003001
00003001
00003001
Type
Value
Conductivity gain 1.000000
Cl2 gain 1.000000
pH gain (pH-7)*K/mV -5.05833
pH offset (pH-7)*K 0.000000
ORP offset mV 0.000000
TDS constant 0.650000
Turb Offset 0.000000
Turb A1 500.0000
Turb M1 500.0000
Turb A2 1000.000
Turb M2 1000.000
Chl Offset 0.000000
Chl A1 100.0000
Chl M1 100.0000
Chl A2 200.0000
Chl M2 200.0000
Fluor Offset 0.000000
Cl2 gain 1.103424
Conductivity gain 0.979114
Note that the default value of the conductivity “Value” is 1.00 in the .glp format shown above. This
relative number is equivalent to a real cell constant of 5.00 which is provided in the Advanced|Cal
YSI Incorporated
Drinking Water Monitoring Systems Operations Manual
2-77
Sondes
Section 2
Constants and is described in Section 2.9.8. All other values in the .glp file are equivalent to those shown
in the Advanced|Cal Constants menu.
CAUTION: Calibration records for all sensors will automatically be stored in the .glp file until the Delete
All Files command is used from the File menu. However, if the Delete command is issued, all files,
including the .glp (calibration record) file will be lost. Therefore, it is extremely important to remember to
upload the .glp file to a PC or a 650 Display/Logger prior to deleting files from the sonde. See Section
2.9.3 for instructions on the upload and viewing of the .glp file.
2.9.3 FILE
Selections from the File menu allow the user to access data that has been stored in the sonde flash disk
memory. Select 3-File from the Main menu.
------------------File----------------1-Directory
4-View file
2-Upload
5-Quick view file
3-Quick Upload 6-Delete all files
Select option (0 for previous menu): 1
Select 1-Directory to view all files currently stored in sonde flash disk memory. The screen below shows
5 files of varying sizes. To examine the details of each file, press the associated number (e.g., 4 for
CLRLAKE2.dat) and an additional screen will be displayed as shown below that quantifies the time of the
deployment, the sample interval, and the site where the sonde was used. In addition, the data in the file can
be viewed by using the 1-View file command
Filename
Samples
1-BRIDGE1.dat
19
2-BRIDGE2.dat
27
3-UPLAKE.dat
33
4-CLRLAKE2.dat
167
5-DWNLAKE2.dat
31
6-00003001.glp
3
Select option (0 for previous menu): 4
-------------File details------------1-View file
2-File:CLRLAKE2.dat
3-Samples:
167
4-Bytes:
4421
5-First:08/23/2001
6-First:08:33:40
7-Last :08/23/2001
8-Last :09:04:20
9-Interval:00:00:10
A-Site:Clear Lake
Select 2-Upload to view file lists in memory (same as shown above) and then upload the data to a PC or to
the YSI 650 MDS Display/Logger. The uploaded data can then be processed with YSI EcoWatch for
Windows to allow data manipulation and to easily generate reports, plots, and statistics. Three formats for
file transfer are available: PC6000, Comma & Quote Delimited, and ASCII text.
YSI Incorporated
Drinking Water Monitoring Systems Operations Manual
2-78
Sondes
Section 2
•
PC6000 format will transfer the data so that it will be compatible with the EcoWatch for Windows
(supplied with your sonde) software package. YSI recommends data transfer in this format since it is
significantly more rapid than other transfer options. If this data is required in Comma & Quote
Delimited and/or ASCII formats, the user can quickly generate data in these formats using the Export
function in EcoWatch for Windows.
•
Comma & Quote Delimited format is commonly used to generate files that can be imported into
spreadsheet software in your PC, where you can perform custom data analysis. A comma is still the
delimiter, but the radix is corrected to a period. In most cases you should set the Page Length to 0
before using this type of upload format. See the Windows Help section in EcoWatch for information
on setting the page length.
•
ASCII Text is another alternative to transferring data directly to your computer into spreadsheet or
other PC-based software.
Prior to upload, a “Time window” display appears to allow you the option to select portions of the logged
data to upload. You may select 1-Proceed to upload all data logged from the dates and times shown.
--------------Time window-------------1-Proceed
2-Start date=07/17/96
3-Start time=12:00:00
4-Stop date=07/31/96
5-Stop time=12:00:00
Select option (0 for previous menu):
Select 1-Proceed. Choose the appropriate file transfer protocol. A status box will appear in the lower right
quadrant of the screen. Verification of a successful transfer is indicated when all of the requested data are
transferred.
---------------File type--------------1-PC6000
2-Comma & ' ' Delimited
3-ASCII Text
Select option (0 for previous menu):
Press 0 or Esc to return to the File menu.
When you select the 3–Quick Upload option, the same operation as 2-Upload is performed, except that
only the most recent flash disk file is uploaded and it is uploaded in its entirety. You still must choose the
transfer format from the three options provided.
Select 4-View File to examine the data in any file currently stored in sonde flash disk memory. You will
first view the same screen as viewed in the Directory menu. From this menu choose the file of interest,
then, using the Time window menu, choose the dates and/or times of interest. If you choose dates or times
that are not within the designated start and stop times, no data will be displayed.
YSI Incorporated
Drinking Water Monitoring Systems Operations Manual
2-79
Sondes
Section 2
You may choose the entire file. Use the Space Bar to alternately stop and to resume scrolling. Use the Esc
key to cancel the view.
Select the 5–Quick View File option to view the last page of data from the last data file in sonde memory.
This feature is particularly useful in quickly reviewing recently acquired data at field sites so that system
performance can be assessed.
Select 6–Delete all files to IRREVERSIBLY remove all files from the sonde memory (INCLUDING the
.glp file that may contain valuable calibration data). It is critical not to use this option until all relevant data
from sonde memory has been transferred to your computer via one of the upload options. There is a
verification screen that appears, so that pressing the 6 key does not immediately delete all files at this point.
The management of the .glp calibration record file that is automatically stored in sonde memory and is
described in Section 2.9.2 above is similar to that for data files. However, there are some differences in the
upload procedure of which the user should be aware. When uploading a .glp file there will be a choice of
three upload protocols as shown below:
---------------File type--------------1-Binary
2-Comma & '' '' Delimited
3-ASCII Text
Select option (0 for previous menu):
The binary upload choice should ONLY be used when uploading the .glp file to a 650 Display/Logger; if
the binary protocol is used in a direct upload to PC, a .glp file will indeed be transferred, but it will not be
possible to open it using the current YSI software or any other text editor. Thus, during a direct transfer of
the .glp file to your PC, either the CDF or ASCII formats should be used. The result will be the conversion
of the file with a .glp extension in the sonde to one with a .txt extension which is now stored in the
ECOWWIN\DATA subdirectory of your PC. For example, the file 00003001.glp in the sonde will become
00003001.txt on transfer to PC and the file will be in a format which can easily be viewed and edited using
Notepad or other word processing software.
YSI Incorporated
Drinking Water Monitoring Systems Operations Manual
2-80
Sondes
Section 2
2.9.4 STATUS
Select 4-Status from the Sonde Main menu to obtain general information about the sonde and its setup.
-----------------Status---------------1-Version:1.00
2-Date=07/22/96
3-Time=09:04:28
4-Bat volts: 9.0
5-Bat life 21.2 days
6-Free bytes:129792
7-Logging:Inactive
Select option (0 for previous menu):
•
Select 1-Version to identify the specific version of sonde software loaded in the sonde. This number is
especially useful if you are calling YSI Customer Service. It may also be useful to you if you are
comparing 2 or more sondes purchased at different times.
•
Select 2-Date and 3-Time to display current date and time in 24-hour format. This is not a “live”
display, but may be updated by pressing the 2 or 3 key again. This may be useful for viewing or
setting real time. You may correct date or time from this submenu, by entering the corrected date or
time as described in System setup. However, you cannot alter date format from this screen.
•
•
In options 4, 5, and 6, you can view battery voltage, battery life, and available free memory in your
sonde to help you evaluate whether the current setup is appropriate to complete an active logging or to
begin a study in which you have defined your logging parameters. If you press key 4, 5 or 6 before
you exit this screen, it may change, since this triggers the Status screen to update information.
7-Logging provides one of two messages, active or inactive, indicating whether your sonde is in the
unattended logging mode. This logging status indicator is not relevant to logging in the discrete mode,
since there is no way to enter the Status screen without stopping discrete logging.
Press 0 or Esc to exit the Status screen and return to Main menu.
YSI Incorporated
Drinking Water Monitoring Systems Operations Manual
2-81
Sondes
Section 2
2.9.5 SYSTEM
Select 5-System from the Sonde Main menu to set the date and time, customize the sonde communication
protocol, adjust how information appears on the screen, and enter an instrument identification number and a
GLP file designation.
1-Date & time
2-Comm setup
3-Page length=25
4-Instrument ID=YSI Sonde
5-Circuit board SN:00003001
6-GLP filename=00003001
7-SDI-12 address=0
8-(*)English
9-( )Fran?ais
A-( )Deutsch
Select option (0 for previous menu):
Select Date & time.
-----------Date & time setup----------1-(*)m/d/y
4-( )4 digit year
2-( )d/m/y
5-Date=08/11/98
3-( )y/m/d
6-Time=11:12:30
Select option (0 for previous menu):
Press 4 and 5 to activate the date and time functions. Pay particular attention to the date format that you
have chosen when entering date. Use the 24-hour clock format for entering time. Option 4- ( ) 4 digit year
may be chosen to have the date appear with a two or four digit year.
Press 0 or Esc to return the System Setup menu.
Select 2-Comm setup From the System Setup menu.
YSI Incorporated
Drinking Water Monitoring Systems Operations Manual
2-82
Sondes
Section 2
---------------Comm
1-(*)Auto baud
2-( )300 baud
3-( )600 baud
4-( )1200 baud
setup------------5-( )2400 baud
6-( )4800 baud
7-(*)9600 baud
Select option (0 for previous menu): 0
The default is 9600, but you may change it to match your host communication interface protocol by typing
in the corresponding number, 1 through 7. An asterisk confirms the selection. Auto baud may be selected
along with any of the choices. The Auto baud option allows the sonde to recognize and adjust to the
received characters and we recommend that it is activated.
NOTE: If you change the baud rate, exit the sonde interaction and immediately change the baud rate in
EcoWatch for Windows, Comm Settings. If you do not adjust the baud rate in the PC software, the sonde
will not be able to communicate with the computer or any display/logger and your system will appear to be
"locked-up."
Select 3-Page length from the System Setup menu and press Enter. This will allow you to control how
many lines of data are sent to your display before a new header is shown. The smaller the page number, the
fewer the lines of data will be transmitted to your display between headers. However, if you set the page
length to zero (0), only the initial header will be displayed. In many cases, a page length of zero is the
preferred configuration if you choose to upload your data in an ASCII or CDF format. See Section 2.9.3,
File Menu, for more details.
NOTE: The header itself takes 4 lines. Therefore, if the page length is set to 25, there will be 21 lines of
data and one header. Any page length less than 5 will result in no header being transmitted.
Select 4-Instrument ID from the System setup menu to record the instrument ID number (usually the
instrument serial number), and press Enter. A prompt will appear which will allow you to type in the
serial number of your sonde. This will make sure that any data that is collected is associated with a
particular sonde.
The 5-Circuit Board SN entry shows the serial number of the PCB that is resident in your sonde (not the
entire system as for Instrument ID). Unlike the Instrument ID, the user cannot change the Circuit Board
SN.
Select 6-GLP filename to enter a name for the file that is automatically generated and appended as you
calibrate any of the sonde sensors. The default designation for the GLP file is the Circuit Board SN and
this name can be retained if you wish. See section 2.9.3 for general information on the GLP file.
Select 7-SDI-12 address from the System Setup menu to change the value. Input a number between 0 and
9 and then press Enter to confirm the selection. The SDI-12 default address is zero (0). This feature is
fully described in Section 7, Communication and only utilized if the unit is to operate in a SDI-12
communication protocol network.
Finally, select your language of choice for the sonde menus. Then press Esc or 0 again to return to the
Main menu.
YSI Incorporated
Drinking Water Monitoring Systems Operations Manual
2-83
Sondes
Section 2
2.9.6 REPORT
The Report menu allows you to configure all reports displayed by the sonde software. You will be able to
select which parameters and units of measure that are displayed during operation.
Select 6-Report from the sonde Main menu. The following menu, or a similar menu, will be displayed.
The parameters listed depend on both the sensors available and enabled on your sonde. Therefore your
screen may not be identical to that shown below.
Select Report from the Main sonde menu to setup the report section. The Report Setup menu will be
displayed.
-------------Report
1-(*)Date
2-(*)Time hh:mm:ss
3-(*)Temp C
4-(*)SpCond uS/cm
5-( )Cond
6-( )Resist
7-( )TDS
8-( )Sal ppt
9-(*)Free Cl2
setup-------------A-( )Cl2 chrg
B-( )pH
C-( )pH mV
D-(*)Orp mV
E-( )PAR1
F-( )PAR2
G-(*)Turbid NTU
H-(*)Chl ug/L
I-( )Fluor %FS
Select option (0 for previous menu):
The asterisks (*) that follow the numbers or letters indicate that the parameter will appear on all outputs
and reports. To turn a parameter on or off type the number or letter, that corresponds to the parameter, after
Select option. The parameters “PAR1” and “PAR2” are associated with a special sonde equipped with a
sensor for Photosynthetically Active Radiation (PAR) which can be purchased from the YSI
Massachusetts, but is not likely to be useful in drinking water studies See Section 8 of this manual for
contact information if you have questions about this sensor.
Note that the units of turbidity are automatically presented as “turbid NTU” if a 6026 sensor has been
selected and “turbid+ NTU” if a 6136 sensor has been selected. The different designations are designed to
differentiate the data from the two sensors types in later analysis.
For parameters with multiple unit options such as temperature, conductivity, specific conductance,
resistivity and TDS, a submenu will appear as shown below, allowing selection of desired units for this
parameter.
--------------Select units------------1-(*)NONE
2-( )Temp C
3-( )Temp F
4-( )Temp K
Select option (0 for previous menu): 2
YSI Incorporated
Drinking Water Monitoring Systems Operations Manual
2-84
Sondes
Section 2
After configuring your display with the desired parameters, press Esc or 0 to return to the Main menu.
Even if all of the sensors are enabled, the measurements for those sensors will not appear on your display
unless the parameter is selected in Report setup. In order for a specific parameter to show up on a report:
1.
The sensor must first be enabled (turned on).
2.
That parameter must be activated in the Report setup.
In the above example, if the appropriate sensors have been activated in the Sensor setup section, the
following parameters will be displayed to the computer screen or captured to a computer or data collection
platform when the sonde is sampling: Temperature in C, Specific Conductance in uS/cm, Free chlorine in
mg/L, pH, ORP in millivolts, Turbidity in NTUs and Chlorophyll in ug/L. Date and time will also be
displayed.
NOTE: Do not attempt to memorize or associate a number or letter with a particular parameter. The
numbering scheme is dynamic and changes depending on the sensors which have been enabled.
The following list is a complete listing of the abbreviations utilized for the various parameters and units
available in the Report setup menu.
Parameter
Date
Time
Temp C
Temp F
Temp K
SpCond mS/cm
SpCond uS/cm
Cond mS/cm
Cond uS/cm
Resist MOhm*cm
Resist Kohm*cm
Resist Ohm*cm
TDS g/L
TDS kg/L
Sal ppt
Free Cl2 mg/L
Cl2 chrg
pH
pH mV
Orp mV
NH4+ N mg/L
NH4+ N mV
NH3 N mg/L
NO3- N mg/L
NO3- N mV
Cl- mg/L
Cl- mV
Turbid NTU
Turbid+ NTU
Chl ug/L
Fluor %FS
Rhod ug/L
YSI Incorporated
Description
Day/Month/Year (format selectable)
Hour:Minute:Second (24-hour clock format)
Temperature in degrees Celsius
Temperature in degrees Fahrenheit
Temperature in degrees Kelvin
Specific Conductance in milliSiemens per centimeter
Specific Conductance in microSiemens per centimeter
Conductivity in milliSiemens per centimeter
Conductivity in microSiemens per centimeter
Resistivity in MegaOhms * centimeter
Resistivity in KiloOhms * centimeter
Resistivity in Ohms * centimeter
Total dissolved solids in grams per liter
Total dissolved solids in kilograms per liter
Salinity in parts per thousand (set to local barometer at calibration)
Free chlorine concentration in mg/L
Free chlorine sensor charge
pH in standard units
millivolts associated with the pH reading
Oxidation reduction potential value in millivolts
Ammonium Nitrogen in milligrams/liter
Ammonium Nitrogen in millivolt reading
Ammonia Nitrogen in milligrams/liter
Nitrate Nitrogen in milligrams/liter
Nitrate Nitrogen in millivolt reading
Chloride in milligrams/liter
Chloride in millivolt reading
Turbidity in nephelometric turbidity units from 6026 sensor
Turbidity in nephelometric turbidity units from 6136 sensor
Chlorophyll in micrograms/liter
Fluorescence in percent Full Scale
Rhodamine WT in micrograms/liter
Drinking Water Monitoring Systems Operations Manual
2-85
Sondes
Section 2
2.9.7 SENSOR
The Sensor menu allows you to Enable or Disable (turn on or off) any available sensor and, in some cases,
to select the port in which your sensor is installed.
From the Sonde Main menu select 7-Sensor and the following display will appear.
------------Sensors
1-(*)Time
2-(*)Temperature
3-(*)Conductivity
4-(*)Free Cl2
5-(*)ISE1 pH
6-(*)ISE2 Orp
enabled-----------7-( )ISE3 NONE
8-( )ISE4 NONE
9-( )ISE5 NONE
A-( )Optic
B-( )Battery
Select option (0 for previous menu):
Note that the exact appearance of this menu will vary depending upon the sensors available on your sonde.
When a particular sensor is active, an asterisk will appear in the parentheses associated with the selection.
In this example the time, temperature, conductivity, free chlorine, pH, ORP, and battery sensors are
enabled. To disable a sensor, simply press the number of the active sensor or port, and the asterisk will
disappear.
For the ISE and Optic selections, press the appropriate number, and then enable or disable the sensor using
the submenu choices. Be certain that the appropriate sensor is “enabled” in the submenu according to the
sonde bulkhead port in which it is physically installed. For example, if an ammonium sensor is placed in
the port labeled “3” on the bulkhead, enable the sensor as ISE3 in the menu structure.
The following screen is the submenu selection structure for ISE3, ISE4 and ISE5.
--------------Select type-------------1-( )ISE3 NH4+
2-( )ISE3 NO33-( )ISE3 Cl4-( )ISE3 PAR1
Select option (0 for previous menu):
As noted above, the ISE3 PAR1 selection is used in a special instrument mated to a sensor for
Photosynthetically Active Radiation that is available from YSI Massachusetts but is not likely to be useful
in drinking water studies. See Section 8 for contact information if you have questions about this sensor.
A submenu similar to that below will appear if either “Optic T” or “Optic C” is chosen as a sensor.
YSI Incorporated
Drinking Water Monitoring Systems Operations Manual
2-86
Sondes
Section 2
--------------Select type-------------1-(*)Optic-T(or C) Turbidity-6026
2-( )Optic-T(or C) Turbidity-6136
2-( )Optic-T(or C) Chlorophyll
3-( )Optic-T(or C) Rhodamine
Select option (0 for previous menu):
Any available optical probe can be installed in any optical port on YSI 6-series sondes. The single optical
port in the 6920DW will be designated “Optic T” in the software even though the port is not physically
labeled with a “T” on the bulkhead.
2.9.8 ADVANCED
From the Sonde Main menu select 8-Advanced to display the sensor calibration constants, additional setup
options, sensor coefficients and constants, and digital filtering options. The parameters listed depend on
both the sensors installed and the sensors enabled, therefore your screen may not be identical to those
shown below.
----------------Advanced-------------1-Cal constants
2-Setup
3-Sensor
4-Data filter
Select option (0 for previous menu): 1
Select 1-Cal constants to display the calibration constants, as shown in the following example. Note that
values only appear for the enabled sensors.
-------------Cal constants------------1-Cond:5
B-NO3 A:2.543
2-Cl2 gain:1.3048
C-Cl J:99.5
3-mV offset:0
D-Cl S:-0.195
4-pH offset:0
E-Cl A:2.543
5-pH gain:-5.05833
F-Turb Offset:0
6-NH4 J:51.2
G-Turb A1:500
7-NH4 S:0.195
H-Turb M1:500
8-NH4 A:1.092
I-Turb A2:1000
9-NO3 J:99.5
J-Turb M2:1000
A-NO3 S:-0.195
Select option (0 for previous menu): 0
YSI Incorporated
Drinking Water Monitoring Systems Operations Manual
2-87
Sondes
Section 2
The following table provides the default value, operating range, and comments relative to the calibration
constants. Error messages will appear during calibration if values are outside the indicated operating range
unless the designation is “not checked”.
Parameter
Cond:
Cl2 gain:
mV offset:
pH offset:
pH gain:
NH4 J
NH4 S
NH4 A
NO3 J
NO3 S
NO3 A
Cl J
Cl S
Cl A
Turb Offset
Turb A1
Turb M1
Turb A2
Turb M2
Chl Offset
Chl A1
Chl M1
Chl A2
Chl M2
Rhod Offset
Rhod A1
Rhod M1
Rhod A2
Rhod M2
Default
5
1
0.0
0.0
-5.0583
51.2
0.195
1.092
99.5
-0.195
2.543
99.5
-0.195
2.543
0
500
500
1000
1000
0
500
500
1000
1000
0
500
500
1000
1000
Operating range
4 to 6
0.5 to 2.0
-100 to 100
-400 to 400
-6.07 to -4.22
Not checked
0.15 to 0.217
Not checked
Not checked
-0.217 to -0.15
Not checked
Not checked
-0.217 to -0.15
Not checked
-10 to 10
0.6 to 1.5
Comments
Traditional cell constant
Range is ratio of M1 to A1
0.6 to 1.5
Range is ratio of (M2-M1) to (A2-A1)
-30 to 20
0.6 to 1.5
Range is ratio of M1 to A1
0.6 to 1.5
Range is ratio of (M2-M1) to (A2-A1)
-10 to 10
0.6 to 1.5
Range ratio of M1 to A1
0.6 to 1.5
Range is ratio of (M2-M1) to (A2-A1)
To reset a calibration cell constant, access the sonde Calibrate menu. Then select the sensor and type
“UNCAL” instead of the value. This action will change that sensors calibration constants back to the
factory default.
From the Advanced menu, select 2-Setup to display miscellaneous options. Type the appropriate number to
activate/deactivate any of the displayed features.
YSI Incorporated
Drinking Water Monitoring Systems Operations Manual
2-88
Sondes
Section 2
-------------Advanced setup----------1-(*)VT100 emulation
2-( )Power up to Menu
3-( )Power up to Run
4-( )Comma radix
5-(*)Auto sleep RS232
6-( )Auto sleep SDI12
7-( )Multi SDI12
8-( )Full SDI12
9-( )Sample and Hold
Select option (0 for previous menu): 0
1-(*)VT100 emulation. Activate this option for VT100 terminal emulation. This feature allows the sonde
to send escape sequences to clear the screen which in turn results in an improved display. Usually this
feature should be activated, but, if your terminal or terminal emulator shows odd characters at the
beginning of each menu title, then turn this item off. With the feature off, the sonde will send several
carriage returns and line feeds to 'clear' the display. The number of <cr>'s and <lf>'s is determined by the
page length setting.
2-( )Power up to Menu. When this item is enabled, the sonde will go directly to menu mode when power
is applied to the sonde. If the command line mode is not useful for your applications, then enabling this
item will negate the need to type “Menu” and Enter at the # prompt to access the Main sonde menu.
Activation of this item is NOT recommended except for special applications.
3-( )Power up to Run.
When this item is enabled the sonde will start sampling and output data as soon
as power is applied to the sonde. If “Power up to menu” is also enabled, the sonde will first enter the menu
mode and then the run mode where it will start sampling. If “Power up to menu” is not enabled, the sonde
will go to command line mode and then start the run function. With “Power up to Run” disabled, the sonde
will wait for your command at power up (in either command line or menu mode) as set by “Power up to
Menu”. If you are using your sonde for Unattended sampling, do not activate this mode. Activation of this
item is NOT recommended except for special applications.
4-( )Comma radix. When this item is enabled, the sonde will replace decimal points with commas when
printing numbers. NOTE: Regardless of this setting, SDI-12 'D' commands will still respond using a
decimal point.
5-(*)Auto sleep RS232. Activation of this feature enables a power savings system when communicating
with the sonde in RS-232 mode. When enabled, power is only applied to the sensors during sampling or
calibration. The most important aspect of this feature is its effect on the free chlorine protocol as described
in Section 2.9.2. For this reason, this feature should be activated for long term monitoring studies in the
RS-232 communication mode and deactivated for sampling studies where the user is present and the sonde
runs continuously. Even with Autosleep inactive, the sonde will “sleep” after one minute with no
communications.
6-(*)Auto sleep SDI12. Activation of this feature enables the power savings system when communicating
with the sonde in SDI-12 mode. This is basically the same as item 5 above except that it is used in
communication via the SDI-12 interface. Also, the sonde will “sleep” in about 100 milliseconds in the
absence of communication, rather that waiting one minute in the Auto sleep RS-232 mode.
YSI Incorporated
Drinking Water Monitoring Systems Operations Manual
2-89
Sondes
Section 2
7-( ) Multi SDI12. Modifies the SDI12 protocol as follows: (1) No SDI12 service request will be issued.
(2) Break commands will not cause a measurement reading to be aborted. Normally, you should leave this
feature “off”.
8-( ) Full SDI12. Enabling this feature forces full SDI-12 specification in order to pass the NR Systems
SDI-12 Verifier. Disabling this feature will allow the unit to be more fault tolerant and will save some
power. We recommend that you leave this feature “off”.
9-( ) Sample and Hold. This feature is designed to be activated ONLY for studies in which your drinking
water sonde is attached to a YSI Process Monitor. When “Sample and Hold” is active, the 6500 display
and the SCADA output of the 6500 becomes equivalent to the internal memory of the sonde while an
Unattended study is running. In the Unattended mode, the sonde “sleeps” between periodic samples with
the interval between samples defined by the user. This method of operation results the extension of both
the sonde battery life (not important in 6500 applications) and the time between required sensor
maintenance procedures (which is important to 6500 drinking water applications). After activation of the
feature another entry will appear automatically which will allow you to input your sample interval which
defines how often data is transmitted to the 6500 display. This new sample interval will automatically
become the sample interval for the Run|Discrete sample mode of operation and you will not be able to
change the interval until Sample and Hold is deactivated. In addition, the interval in the Run|Unattended
sample mode will also change to the Sample and Hold interval. In this case, however, you will be able to
change the Unattended Sample interval, but with the caveat that the Sample and Hold interval will also
change, i.e., the Unattended sample interval and the Sample and Hold interval MUST be synchronized
and the software assures that this will be the case.
REMEMBER: DO NOT ACTIVATE THIS FEATURE UNLESS (A) YOUR SONDE IS ATTACHED
TO A 6500 AND (B) YOU HAVE READ THE DETAILED DESCRIPTION OF THE FEATURE IN
APPENDIX G. USING YOUR DRINKING WATER SONDE WITH A 6500 PROCESS MONITOR.
Select 3-Sensor to display and change user-configurable constants as shown in the following display. Type
the appropriate number to change to these parameters.
------------Advanced sensor----------1-TDS constant=0.65
2-Cl2 temp co %/C=2.5
7-Cl2 warm up sec=60
8-(*)Wait for Cl2
9-Wipes=1
A-Wipe int=1
B-SDI12-M/wipe=1
C-Turb temp co %/C=0.3
D-(*)Turb spike filter
E-Chl temp co %/C=0
Select option (0 for previous menu):
NOTE: The number of items on this menu depends greatly on the sensors that are available and enabled on
your sonde. Below we describe every possible item on this menu. Your sonde probably may not have
every item described below.
YSI Incorporated
Drinking Water Monitoring Systems Operations Manual
2-90
Sondes
Section 2
To edit one of the following menu items choose the number or letter that corresponds to it.
TDS constant=0.65 This selection allows you to set the constant used to calculate TDS. TDS in g/L is
calculated by multiplying this constant times the specific conductance in mS/cm. This
item will only appear if the conductivity sensor is enabled in the “Sensors enabled”
menu. See Section 5, Principles of Operation for more information on the TDS
parameter.
Cl2 temp co=2.5 %/C
This selection allows you to input the free chlorine temperature coefficient. Do
not change this value unless you consult YSI Customer Service. This item will only
appear if the free chlorine sensor is enabled in the Sensors menu.
Cl2 warm up=60 This selection allows you to set the amount of time allowed for Cl2 warm up in seconds.
Normally the default value of 60 seconds is adequate for most applications. However,
there may be certain situations in which greater free chlorine accuracy can be attained by
increasing this time. Consult YSI Customer Service if you feel that your Cl2 warm up
time is incorrect. This item will only appear if the free chlorine sensor is enabled in the
Sensors menu.
(*)Wait for Cl2 When this feature is enabled, the sonde is forced to wait for the Cl2 warm up time to
expire before displaying any readings. Note that in SDI12 mode or while calibrating the
Cl2 sensor, the warm up time is used regardless of the activation of this item. Disabling
this item allows you to see data without having to wait during the Cl2 warm up time.
Under normal operating conditions, this item should be turned off. If you are using
the sonde with a data logger in RS232 mode and will be turning the sonde “on” and “off”
for each sample, then you may want to enable this item so that only stable Cl2 data are
recorded. This item will only appear if the Cl2 sensor is enabled in the Sensors menu.
Wipes=1
If a turbidity, chlorophyll, or rhodamine WT sensor is enabled, this selection will
determine the number of cleaning cycles which will occur when the wiper is activated
manually or automatically. Since the wiper functions bidirectionally, a selection of “1”
results in two passes of the wiper over the optical face. In most applications, a single
cleaning cycle is adequate to keep the optical surface free of bubbles and fouling.
However, in particularly harsh environments additional cleaning cycles may be needed
and can be selected here. This item will only appear if a turbidity, chlorophyll, or
rhodamine WT sensor is enabled in the Sensors menu.
Wipe Int=1
In applications where a turbidity, chlorophyll, or rhodamine WT probe is installed in the
sonde and the instrument is collecting data in the SDI-12 communication mode, the wiper
mechanism of the probe should be activated automatically in a periodic manner to clean
the optical surface for fouling and bubbles. The value entered at this selection is the
number of minutes between each automatic cleaning cycle. Thus, if Wipe Int is set to
“5” and the instrument is in the Run mode, the wiper will activate every 5 minutes with
no manual input. This item will only appear if a turbidity, chlorophyll, or rhodamine WT
sensor is enabled in the Sensors menu.
The value of Wipe Int is sometimes overridden when the instrument is set up in the
Unattended sampling mode. Under these conditions, the wiper will be automatically
activated at the interval assigned in the Unattended setup rather than that assigned in
Wipe Int. Thus, in an Unattended study setup at a 15 minute sampling interval, the wiper
will be activated only once every 15 minutes rather than at the indicated Wipe Int of 1
minute.
YSI Incorporated
Drinking Water Monitoring Systems Operations Manual
2-91
Sondes
Section 2
CAUTION: If Wipe Int is set to zero, then no wiping will occur either in Discrete or
Unattended Sampling. Make certain that Wipe Int is set to some finite value prior to
setting up an Unattended study or no automatic cleaning will occur.
SDI12-M/Wipe=1 This is the number of wiping cycles when the sonde is in SDI12 mode. The wiper for
the 6026 and 6136 turbidity, 6025 chlorophyll, and 6130 rhodamine WT sensors will
automatically wipe each time this many SDI12 “M” commands have been issued. If this
value is set to zero, then no automatic wiping will occur. This item will only appear if a
turbidity, chlorophyll, or rhodamine WT sensor is enabled in the Sensors menu.
Turb temp co %/C=0.3 This entry sets the coefficient for the temperature compensation of turbidity
readings from the 6026 and 6136 sensors. The default values of 0.3 (6026) and 0.6
(6136) should not be changed by the user without consulting YSI Customer Service. This
item will only appear if a turbidity sensor is enabled in the Sensor menu.
(* ) Turb Spike Filter When this item is activated, the output of the turbidity sensor is mathematically
processed to minimize the effect of unusual (or “bad”) readings on the overall data
presentation. In most cases, these “spike” events are the result of the chance passage of
large suspended particles across the probe optics just at the time a reading is taken.
Activation of this option generally results in a better display of the “average” turbidity of
the water under examination and its use is recommended for most sampling and
unattended applications. This item will only appear if a turbidity sensor is enabled in the
Sensors menu.
Chl temp co %/C=0.0 This entry sets the coefficient for the temperature compensation of chlorophyll
readings from the 6025 sensor. The default value of zero should only be changed by the
user after establishing the temperature compensation factor for the phytoplankton sample
in question. See Section 5.12 of this manual for more information. This item will only
appear if a chlorophyll sensor is enabled in the Sensors menu.
From the Advanced menu, select 4-Data filter to display filtering options. Type the appropriate number to
activate/deactivate any of the displayed features.
Sondes with no optical (turbidity, chlorophyll, or rhodamine WT) probes enabled will display the
following menu.
------------Data filter setup---------1-(*)Enabled
2-( )Wait for filter
3-Time constant=4
4-Threshold=0.001
Select option (0 for previous menu):
If any optical probe (turbidity, chlorophyll, or rhodamine WT) is enabled, then the menu will appear as
follows.
YSI Incorporated
Drinking Water Monitoring Systems Operations Manual
2-92
Sondes
Section 2
------------Data filter setup---------1-(*)Enabled
2-( )Wait for filter
3-Time constant. . .
4-Threshold. . .
Select option (0 for previous menu):
Choosing 3-Time Constant will display the following:
------------Time constant ---------1- Turbid=12
2- Chl=12
3- Other=4
Select option (0 for previous menu):
Recommended settings for time constants are turbidity 12, rhodamine WT 12, chlorophyll 12, and “other”
4. Note that the time constant can be set independently for turbidity, chlorophyll, and rhodamine WT and
that time constant choices are only available for activated sensors. Rhodamine WT would appear in the
display below if it had been activated as a sensor. All “other” sensors use the same time constant as shown
below.
Choosing 4-Threshold will display the following:
---------------Threshold-------------1-Turbid=0.01
2-Chl=1
3-Other=0.001
Select option (0 for previous menu):
Setting thresholds is done in the same manner. Recommended threshold settings are 0.01 for turbidity, 1.0
for chlorophyll, 1.0 for rhodamine WT, and 0.001 for “other”.
The following descriptions provide additional information about the Data Filter feature.
1-(*) Enabled. Activating this item will result in data filtering according to the values set in (2), (3), and
(4).
2-(*) Wait for filter. If this feature is activated, readings will be available for output only after the unit has
warmed up for a time period equal to the Time Constant plus an extra 4 seconds. This feature is useful, for
example, if you are operating in SDI12 mode and want to average the data over a particular period of time.
In such a case, you would not want the filter to be engaging and disengaging, so the value of the Threshold
should be set to a large value like 1. This feature should not be activated for normal use of the sonde.
YSI Incorporated
Drinking Water Monitoring Systems Operations Manual
2-93
Sondes
Section 2
3-Time Constant. This value is the time constant in seconds for the software data filter. Increasing the
time constant will result in greater filtering of the data, but will also slow down the apparent response of the
sensors.
4-Threshold. This value determines when the software data filter will engage/disengage. When the
difference between two consecutive unfiltered readings is larger than the threshold, then the reading is
displayed unfiltered. When the difference between two consecutive readings drops below the threshold,
readings will be filtered again. For the purposes of the filter, consecutive readings are never more than 0.5
seconds apart. When sampling faster than 0.5 seconds consecutive readings will be at the faster rate and
you may want to adjust the threshold accordingly. See section 2.9.1 for details on fast sampling.
The threshold feature is intended to speed response to large changes in a reading. For example, when
changing from pH 7 buffer to a pH 4 buffer in a calibration, it is likely that the filter will disengage for a
time showing unfiltered readings until the sensor has nearly equilibrated with the new buffer. At that time,
the filter will re-engage and show filtered readings. Without disengaging the filter for awhile, much more
time would be required to come to equilibrium after large changes in reading.
During the first time constant after the filter first engages, the output reflects a simple average of all the
readings from the time the filter engaged until the present. Once the filter has been engaged for the period
of the time constant, it becomes a simple filter with a time constant equal to that set in 3-Time Constant.
Each time the filter disengages and then re-engages, this process is repeated.
Filter engagement and disengagement occurs for each sensor independently. One parameter may be filtered
while another is not because readings from one sensor are changing more than another.
Example: Moving a sonde from the air to a river water sample. Assume that the temperature of the sonde is
similar to the temperature of the water, and that the water is in equilibrium with the air. The temperature
and oxygen readings taken in the water will be very similar to those taken in the air. The conductivity
reading in air is near zero, and quite likely, is a very different reading in the water. The filter for the
conductivity readings will likely disengage when the sonde is first placed in the river water, but stay
engaged for the temperature and free chlorine readings.
The filters for turbidity, chlorophyll, and rhodamine WT are somewhat different. For these sensors, the
filter is temporarily disengaged during mechanical wiping so that when wiping is finished, the reading is
the most current. The filter then reengages if possible. Optical sensor readings are frozen to the output
during wiping so that “bad” values are not output.
A value of 0.001 for the threshold roughly corresponds to the following changes in sensor readings:
Temp: 0.1 °C
Conductivity in the 100 mS/cm range: 0.1 ms/cm
Conductivity in the 10 mS/cm range: 0.01 ms/cm
Conductivity in the 1 mS/cm range: 0.001 ms/cm
Conductivity in the 100 µS/cm range: 0.1 us/cm
Free Chlorine: 0.01 mg/L
pH, ORP, Ammonium, Nitrate and Chloride: 0.6 mV
A value of 0.01 for the threshold roughly corresponds to a 10NTU change in turbidity. A value of 1.0 for
the chlorophyll and rhodamine WT sensors threshold effectively means that the filter will be engaged under
all conditions.
YSI Incorporated
Drinking Water Monitoring Systems Operations Manual
2-94
Sondes
Section 2
2.10
CARE, MAINTENANCE AND STORAGE
This section describes the proper procedure for storage of the sensors that will maximize their lifetime and
minimize the time required to get the sonde ready for a new application. This section will describe interim
or short-term storage between applications where the sonde is being used at a regular interval (daily,
weekly, biweekly, etc.). and long term storage, (e.g., over-the-winter), where the sonde will not be used on
a regular basis for several months.
In the descriptions and instructions below, it is assumed that the user has retained the vessels (bottles,
boots, etc.) in which the individual sensors were stored on initial delivery. If these specific items have been
misplaced or lost, they can be replaced by contacting YSI Customer Service. Alternatively, the user may
have similar (and equally acceptable) storage equipment on hand even though it was not part of the original
YSI package. Common sense should be the guide on substitution of storage vessels.
REMEMBER: DO NOT ATTEMPT TO GAIN ACCESS TO THE INTERNAL CIRCUITRY OF
THE SONDE.
2.10.1
SONDE CARE AND MAINTENANCE
The YSI 6570 Maintenance Kit is available for use with your sonde. The kit includes several items that will
be helpful or necessary to perform the proper routine maintenance on your sonde.
The 6570 Maintenance Kit includes two types of O-rings (for probes and cable connector),
probe/installation/replacement tools, two cleaning brushes for the conductivity sensor, O-ring lubricant, and
a syringe for cleaning the depth sensor port.
The 6570 Maintenance Kit can be ordered from any authorized YSI dealer, or directly from YSI. See
Appendix C for details.
When caring for your sonde, remember that the sonde is sealed at the factory, and there is never a need to
gain access to the interior circuitry of the sonde. In fact if you attempt to disassemble the sonde, you would
void the manufacturer's warranty.
O-RING CARE AND MAINTENANCE
Your 6-series sondes utilize user-accessible o-rings as seals to prevent environmental water from entering
the battery compartment and the sensor ports. Please read the following instructions carefully prior to
deploying your YSI Sonde. Following the recommended procedure will assure that no problems will occur
with regard to water influx into your sonde.
If the o-rings and sealing surfaces on the sondes are not maintained properly, it is possible that water can
enter the battery compartment and/or sensor ports of your sonde. If water enters these areas, it can severely
damage the battery terminals or probe ports causing loss of battery power during a deployment, false
readings and corrosion to the probes. Therefore, when the battery compartment lid is removed from
600XLM, 6920, 6600, and 600 OMS (battery version) sondes, the o-rings that provide the seal should be
carefully inspected for contamination (e.g. hair, grit, etc.) and cleaned if necessary using the instructions
provided below. The same inspection should be made of the o-rings associated with the probes, port plugs,
and field cable connectors when they are removed. If no dirt or damage to the o-rings is evident, then they
should be lightly greased without removal from their groove. However, if there is any indication at all of
damage, the o-ring should be replaced with an identical item from the YSI 6570 Maintenance Kit supplied
with your sonde. At the time of o-ring replacement, the entire o-ring assembly should be cleaned as
described below.
YSI Incorporated
Drinking Water Monitoring Systems Operations Manual
2-95
Sondes
Section 2
To remove the o-rings:
Use a small, flat-bladed screwdriver or similar blunt-tipped tool to remove the o-ring from its groove.
Check the o-ring and the groove for any excess grease or contamination. If contamination is evident, clean
the o-ring and nearby plastic parts with lens cleaning tissue or equivalent lint-free cloth. Alcohol can be
used to clean the plastic parts, but use only water and mild detergent on the o-ring itself. Also, inspect the
o-rings for nicks and imperfections.
CAUTION:
¾ Using alcohol on o-rings may cause a loss of elasticity and may promote cracking.
¾ Do not use a sharp object to remove the o-rings. Damage to the o-ring or the groove itself may result.
Before re-installing the o-rings, make sure that you are using a clean workspace, clean hands and are
avoiding contact with anything that may leave fibers on the o-ring or grooves. Even a very small bit of
contamination (hair, grit, etc.) may cause a leak.
To re-install the o-rings:
¾
Place a small amount of Teflon stopcock grease between your thumb and index finger. (More grease is
NOT BETTER!)
¾
Draw the o-ring through the grease while pressing the fingers together. Use this action to place a
VERY LIGHT covering of grease to all sides of the o-ring. Place the o-ring into its groove making
sure that it does not twist or roll.
¾
Use the previously grease-coated finger to once again lightly go over the mating surface of the o-ring.
DO NOT use excess grease on the o-ring or the o-ring groove.
CAUTION: Do not over-grease the o-rings. The excess grease may collect grit particles that can
compromise the seal. Excess grease can also cause the waterproofing capabilities of the o-ring to diminish,
potentially causing leaks into the compartment. If excess grease is present, remove it using lens cloth or
lint-free cloth.
SONDE PROBE PORTS
Whenever you install, remove or replace a probe, it is extremely important that the entire sonde and all
probes be thoroughly dried prior to the removal of a probe or a probe port plug. This will prevent water
from entering the port. Once you remove a probe or plug, examine the connector inside the sonde probe
port. If any moisture is present, use compressed air to completely dry the connector. If the connector is
corroded, return the sonde to your dealer or directly to YSI Customer Service, see Section 8, Warranty
and Service Information, for details. When you reinstall a probe or port plug, lightly grease the O-ring
with lubricant supplied in the YSI 6570 Maintenance Kit.
CABLE CONNECTOR PORT
The cable connector port at the top of the sonde should be covered at all times. While communicating with
the sonde, a cable should be installed and tightened in place. This will assure that a proper connection is
being made and prevent moisture and contaminants from entering.
When a communications cable is not connected to the cable connector port, the pressure cap supplied with
the instrument should be securely tightened in place.
YSI Incorporated
Drinking Water Monitoring Systems Operations Manual
2-96
Sondes
Section 2
If moisture has entered the connector, dry the connector completely using compressed air, a clean cloth, or
paper towel. Apply a very thin coat of lubricant from the 6570 Maintenance Kit to the O-ring inside the
connector cap before each installation.
2.10.2
PROBE CARE AND MAINTENANCE
Once the probes have been properly installed, remember that periodic cleaning and free chlorine membrane
changes are required.
6572 FREE CHLORINE PROBES
For best results, we recommend that the KCl solution and the membrane at the tip of the 6572 probe be
changed prior to each sonde deployment and, or more frequently if the sensor appears to be drifting as
determined by quality assurance tests with a DPD colorimeter. See Section 2.3 for instructions on
changing the free chlorine sensor membrane.
After removing the used membrane from the tip of the 6572 probe, examine the electrodes at the tip of the
probe. If either or both of the silver electrodes are black in color, the probe should be resurfaced using the
fine sanding disks which are provided in the 6035 reconditioning kit.
To resurface the probe using the fine sanding disk, follow the
instructions below.
First dry the probe tip completely with lens cleaning tissue. Next, hold
the probe in a vertical position, place one of the sanding disks under
your thumb, and stroke the probe face in a direction parallel to the
platinum electrode (located between the two silver electrodes). The
motion is similar to that used in striking a match. Usually 10-15 strokes
of the sanding disk are sufficient to remove black deposits on the silver
electrodes. However, in extreme cases, more sanding may be required
to regenerate the original silver surface.
After completing the sanding procedure, repeatedly rinse the probe
face with clean water and wipe with lens cleaning tissue to remove any grit left by the sanding disk. After
cleaning, thoroughly rinse the entire tip of the probe with distilled or deionized water and install a new
membrane.
IMPORTANT: Be sure to: (1) Use only the fine sanding disks provided in the 6035 maintenance kit in the
resurfacing operation and (2) Sand in a direction parallel to the platinum electrode. Not adhering to either
of these instructions can seriously damage the electrodes.
NOTE: If this procedure is unsuccessful, as indicated by improper probe performance, it may be necessary
to return the probe to an authorized service center. See Section 8, Warranty and Service Information,
for contact information.
6560 CONDUCTIVITY/TEMPERATURE PROBES
The openings that allow fluid access to the conductivity electrodes must be cleaned regularly. The small
cleaning brush included in the 6570 Maintenance Kit is ideal for this purpose. Dip the brush in clean water
and insert it into each hole 15-20 times. In the event that deposits have formed on the electrodes, it may be
necessary to use a mild detergent with the brush. After cleaning, check the response and accuracy of the
conductivity cell with a calibration standard.
YSI Incorporated
Drinking Water Monitoring Systems Operations Manual
2-97
Sondes
Section 2
NOTE: If this procedure is unsuccessful, or if probe performance is impaired, it may be necessary to
return the probe to an authorized dealer service center See Section 8, Warranty and Service Information
for contact information.
The temperature portion of the probe requires no maintenance.
6561/6561FG pH AND 6565/6565FG/6566/COMBINATION pH-ORP PROBES
Cleaning is required whenever deposits or contaminants appear on the glass and/or platinum surfaces of
these probes or when the response of the probe becomes slow.
Remove the probe from the sonde. Initially, simply use clean water and a soft clean cloth, lens cleaning
tissue, or cotton swab to remove all foreign material from the glass bulb (6561 and 6565) and platinum
button (6561). Then use a moistened cotton swab to carefully remove any material that may be blocking
the reference electrode junction of the sensor.
CAUTION: When using a cotton swab with the 6561 or 6565, be careful NOT to wedge the swab tip
between the guard and the glass sensor. If necessary, remove cotton from the swab tip, so that the cotton
can reach all parts of the sensor tip without stress. You can also use a pipe cleaner for this operation if
more convenient.
If good pH and/or ORP response is not restored by the above procedure, perform the following additional
procedure:
1.
Soak the probe for 10-15 minutes in clean water containing a few drops of commercial dishwashing
liquid.
2.
GENTLY clean the glass bulb and platinum button by rubbing with a cotton swab soaked in the
cleaning solution.
3.
Rinse the probe in clean water, wipe with a cotton swab saturated with clean water, and then rerinse
with clean water.
If good pH and/or ORP response is still not restored by the above procedure, perform the following
additional procedure:
1.
Soak the probe for 30-60 minutes in one molar (1 M) hydrochloric acid (HCl). This reagent can be
purchased from most distributors. Be sure to follow the safety instructions included with the acid.
2.
Rinse the probe in clean water, wipe with a cotton swab saturated with clean water, and then rerinse
with clean water. To be certain that all traces of the acid are removed from the probe crevices, soak
the probe in clean water for about an hour with occasional stirring.
If biological contamination of the reference junction is suspected or if good response is not restored by the
above procedures, perform the following additional cleaning step:
1.
Soak the probe for approximately 1 hour in a 1 to 1 dilution of commercially-available chlorine bleach.
2.
Rinse the probe with clean water and then soak for at least 1 hour in clean water with occasional
stirring to remove residual bleach from the junction. (If possible, soak the probe for period of time
longer than 1 hour in order to be certain that all traces of chlorine bleach are removed.) Then rerinse
the probe with clean water and retest.
YSI Incorporated
Drinking Water Monitoring Systems Operations Manual
2-98
Sondes
Section 2
Dry the sonde port and probe connector with compressed air and apply a very thin coat of O-ring lubricant
to all O-rings before re-installation.
6882 CHLORIDE, 6883 NITRATE AND 6884 AMMONIUM SENSORS
You should clean these probes whenever deposits or contaminants appear on the ion selective membranes
located on the tips of these sensor modules. If possible, the
PLIERS (SLIP-JAW)
module should be cleaned while installed in the sonde
bulkhead. Use clean water and a moist piece of lens
cleaning tissue to gently wipe the sensor membranes until no
more contaminants are removed. However, under some
conditions, it may be necessary to remove the module from
the sonde bulkhead for cleaning and/or storage. To remove
the module, follow the diagram at the side. Remove the
module with finger pressure only, if possible. However, it is
acceptable to use small pliers if necessary to loosen the
module for final removal by hand. Be very careful not to
squeeze the module any more than is necessary for a firm AMMONIUM OR
NITRATE PROBE
grip. Use slipjaw pliers to minimize the chance of
applying too much pressure on the module. While the module is removed from the sonde, be sure to dry
the sonde port and probe connector with compressed air and apply a very thin coat of lubricant to the
O-ring before re-installation.
NOTE: The ion selective membranes are fragile. Be certain to: (1) Use only moist, high quality lens
cleaning tissue for the cleaning procedure (not paper towels or other coarse materials); and (2) Stroke the
probe face very gently with the tissue during the procedure. If you do not adhere to these instructions, you
can seriously damage the sensors.
OPTICAL PROBES–6026 AND 6136 TURBIDITY; 6025 CHLOROPHYLL;
6130 RHODAMINE WT
The 6026, 6136, 6025, and 6130 probes require only minimal maintenance. After each deployment, the
optical surface on the tip of the turbidity probe should be
inspected for fouling and cleaned if necessary by gently wiping
WIPING
OPTICAL PROBE
the probe face with moist lens cleaning paper. In addition, for
the 6025, 6026, 6136, and 6130 probes, we recommended
replacing the wiper periodically. The frequency of this
replacement depends on the quality of water under examination.
A replacement wiper is supplied with the probes, along with the
small hex driver required for its removal and reinstallation.
WIPER
Follow the instructions supplied with the probe to ensure proper
ASSEMBLY
NON-WIPING
installation of the new wiper assembly. Additional wipers are
TURBIDITY PROBE
available from YSI.
2.10.3
SONDE STORAGE
Proper storage of the your Sonde between periods of usage will not only extend the life of the sensors, but
will also ensure that the unit will be ready to use as quickly as possible in your next application.
YSI Incorporated
Drinking Water Monitoring Systems Operations Manual
2-99
Sondes
Section 2
GENERAL RECOMMENDATIONS FOR SHORT TERM STORAGE
The recommended short term or interim storage procedure is identical for both the 600DW-B and the
6920DW.
No matter what sensors are installed in the instrument, it is important to keep them immersed in water.
YSI recommends that short term storage of the 600DW-B and 6920DW be done by placing enough water
in the sonde calibration/storage cup to completely cover the sensors. The calibration cup should be
sealed to prevent evaporation.
GENERAL RECOMMENDATIONS FOR LONG-TERM SONDE STORAGE
The following are long term storage recommendations for the 600DW-B and the 6920. They will be
applicable for sondes with typical sensor configurations.
Remove the pH or pH/ORP probe from the sonde and store it according to the instructions found in the
following section on individual sensors. Cover the empty port with the provided plug. Leave the
conductivity/temperature and the free chlorine probes in the sonde with a membrane and electrolyte on the
free chlorine sensor. Place enough of deionized, distilled, or tap water in the calibration cup to cover the
sensors, insert the sonde into the vessel, and seal with the cap/O-ring to minimize evaporation.
2.10.4
PROBE STORAGE
LONG-TERM STORAGE OF PROBES
The following sections provide additional details on the storage of individual sensors associated with
instruments in the drinking water (DW) product line from YSI.
TEMPERATURE
No special precautions are required. Sensors can be stored dry or wet, as long as solutions in contact with
the thermistor probe are not corrosive (for example, chlorine bleach).
CONDUCTIVITY
No special precautions are required. Sensors can be stored dry or wet, as long as solutions in contact with
thermistor probe and conductivity electrodes are not corrosive (for example, chlorine bleach). However, it
is recommended that the sensor be cleaned with the provided brush prior to long term storage.
FREE CHLORINE
Free chlorine sensors should always (short-term or long-term) be stored with a membrane and electrolyte in
place and the probe tip immersed in tap water (NOT deionized or distilled water). The probe can either be
left in the sonde or be removed and stored in a vessel containing water.
Thus, for the 600DW-B and the 6920DW, two long-term storage methods are equally acceptable.
YSI Incorporated
Drinking Water Monitoring Systems Operations Manual
2-100
Sondes
Section 2
1.
Remove all probes other than free chlorine, conductivity, and temperature from the sonde and seal
the vacant ports with the provided port plugs. Leave the electrolyte and membrane in place on the
free chlorine sensor. Fill the calibration cup with tap water and insert the sonde. Make certain the
water level is high enough to completely cover the free chlorine sensor. Seal the vessel to prevent
evaporation of the water. At the end of the storage time, remove the existing membrane and remembrane the probe using new electrolyte.
2.
Remove the free chlorine sensor from the sonde leaving the electrolyte and membrane in place.
Store the probe in tap water in a beaker, flask, or other vessel of the user’s choice. Be sure not to
damage the membrane or the probe tip when placing the probe on the bottom of the vessel.
If possible cover the vessel with parafilm or plastic wrap to minimize evaporation of the water
during long-term storage. Monitor the water level in the storage vessel periodically and replenish
if loss due to evaporation occurs. At the end of the storage time, remove the existing membrane
and re-membrane the probe using new electrolyte.
pH/ORP
The key to pH/ORP probe storage, short or long-term, is to make certain that the reference electrode
junction does not dry out. Junctions which have been allowed to dry out due to improper storage
procedures can usually be rehydrated by soaking the sensor for several hours (overnight is recommended)
in a solution which is 1 molar in potassium chloride (see free chlorine section above for preparation of this
solution). If potassium chloride solution is not available, soaking the sensor in tap water or commercial pH
buffers may restore probe function. However in some cases the sensor may have been irreparably damaged
by the dehydration and will require replacement. It is also important to remember not to store the pH
sensor in distilled or deionized water as the glass sensor may be damaged by exposure to this medium.
The recommended long-term storage method for the pH sensor in the 600DW-B and the 6920DW are as
follows. Remove the probe from the sonde and seal the vacant port with the provided plug. Place the
probe in the storage vessel (plastic boot or bottle) which was in place on delivery. The vessel should
contain a solution which is 2 molar in potassium chloride. Make certain that the vessel is sealed to prevent
evaporation of the storage solution.
AMMONIUM, NITRATE AND CHLORIDE
The active element in the ammonium and nitrate ion selective electrode (ISE) sensors is a polyvinyl
chloride (PVC) membrane that is impregnated with the reagent that provides specificity for either
ammonium or nitrate. The useful life of this sensor can be reduced if the membrane is stored immersed in
water. Thus, storage in dry air is recommended for long term storage. While dry air is slightly preferable
for general storage, the short-term storage of these sensors in the sonde, with the entire sensor array in
moist air, will have no significant detrimental effect on the life of the membrane. Remove the sensor
module from the 6920DW sonde and cover the vacant port with the provided plug. Place the sensor back
in the storage boot that was provided, and set aside in room air.
The chloride ISE sensor utilizes a solid state membrane that provides specificity. For long-term storage, the
module should be removed from the sonde, wiped clean with moist lens cleaning tissue, and placed in its
storage boot to prevent abrasion.
TURBIDITY, CHLORPHYLL, AND RHODAMINE
No special precautions are necessary for either the short or long-term storage of the chlorophyll, rhodamine
WT, and turbidity probes. However, for long-term storage, the user may wish to remove the probe from
YSI Incorporated
Drinking Water Monitoring Systems Operations Manual
2-101
Sondes
Section 2
the sonde, replace it with a port plug, and store the probe in dry in air to minimize any cosmetic
degradation of the probe body and to maximize the life of the wiper.
YSI Incorporated
Drinking Water Monitoring Systems Operations Manual
2-102
650 MDS
Section 3
SECTION 3 650 MDS DISPLAY/LOGGER
3.1 INTRODUCTION
The YSI 650 Multiparameter Display System (650 MDS) is a powerful, hand held microcomputer based
instrument that allows the user to display sonde readings, configure sondes, store and recall data, upload
data from sondes and transfer data to computers for analysis and plotting.
Key features of the YSI 650 MDS:
• Completely waterproof case that is submersible to 1 m. Meets IP-67 specification.
• Rugged design with high impact resistance
• Large, non-volatile memory
• Simple cellular phone style keypad.
• Simple intuitive user-interface
• Choice of alkaline batteries or optional rechargeable battery pack
• Fuel gauge display of battery capacity
• User selectable backlight
• Handstrap (standard) or hands free harness (optional) for user comfort
• Optional barometer
• Optional GPS interface
• Compatibility with YSI EcoWatch for Windows data analysis software
• User upgradeable software via the YSI Web page
• CE and Australian C-Tick Compliance.
Partnered with a YSI 6-Series sonde, the 650 will allow the user to easily:
• Display real-time readings from YSI 6-series sondes.
• Log real-time sonde data to internal meter memory with custom site lists.
• Calibrate 6-series sondes.
• Set up 6-series sondes for deployment.
• Upload data from sondes for transfer to PC.
3.2
GETTING STARTED
This section is designed to quickly familiarize you with the hardware and software components of the YSI
650 and its accessories. By the end of Section 3.2 you will have...
R
R
R
R
R
R
Unpacked the YSI 650 and confirmed that all components are present
Become familiar with the general features and setup configurations of your YSI 650.
Installed batteries in the YSI 650.
Established communication between your 6-series sonde and the YSI 650.
Viewed data from your 6-series sonde on the YSI 650 display.
Learned the basics of making alphanumeric entries from the keypad by setting the YSI 650 clock and
entering an Instrument ID name.
Successful completion of the above list is essential for you to continue on to Section 3.3, which focuses on the
custom setup of the 650. In subsequent sections, you will learn about how to set up sonde menus via the 650
interface, log data to both sonde and 650 memory, and use the GPS and barometer features of the 650.
YSI, Incorporated
Drinking Water Monitoring Systems Operations Manual
3-1
650 MDS
Section 3
3.2.1 UNPACKING
Remove the instrument from the shipping box, being careful not to discard any parts or supplies. Use the
packing list to ensure all items are included, and inspect all assemblies and components for damage. If any
parts are damaged or missing, contact your YSI representative immediately. If you do not know which YSI
dealer you obtained your YSI 650 from, refer to Section 8 of your 6-series sonde manual for contact
information.
The 650 is offered in four configurations:
•
•
•
•
650-01 – Low memory with no barometer
650-02 – High memory with no barometer
650-03 – Low memory with barometer
650-04 – High memory with barometer
All configurations include the 650 with hand strap and strain relief lanyard installed and the 655174 PC
interface cable for use in data transfer to a PC and software updates from a PC. Make certain that you have
received these two items (650 itself and PC Interface Cable) during the unpacking process.
The following optional accessories are offered for use with the 650.
•
•
•
•
•
•
•
•
•
•
•
6113 Rechargeable Battery Pack Kit with 6116 charger adapter cable, 6114 110 volt wall charger, and
6117 battery pack included
6126 Rechargeable Battery Pack Kit with 6116 charger adapter cable, 6123 universal charger,
European power cable, British power cable, and 6117 battery pack included
6127 Rechargeable Battery Pack Kit with 6116 charger adapter cable, 6123 universal charger,
China/Australia power cord, and 6117 battery pack included
4654 Tripod
614 Ultra Clamp
5085 Hands Free Harness
5065 Form-fitting Case
5081 Hard-sided Case
6117 Extra Rechargeable Battery Pack
6115 GPS Cable for interface with user-supplied GPS unit
616 Cigarette Lighter Charger
If you have ordered any of these accessories with your 650, make certain during the unpacking process that
you have received them.
3.2.2 UNDERSTANDING THE 650 MEMORY
The 650 is available with two memory options – “low” and “high”.
The less expensive low memory option (650-01 and 650-03) is designed for users who typically use their 6series sondes in sampling applications and store limited data to their logger. The available memory of the
low memory option (ca. 10 kB) will allow the user to log approximately 150 field readings to a single file
in the 650 although the exact logging capability is dependent on the number of parameters active in the 6series sonde. Note also that if multiple files are utilized, the number of logged field readings will be
reduced. In addition, the low memory option will also allow the user to upload small files to the 650 that
have been logged to the internal memory of sondes during Discrete or Unattended sampling studies.
YSI, Incorporated
Drinking Water Monitoring Systems Operations Manual
3-2
650 MDS
Section 3
The high memory option (1.5 mB) of the 650 is designed for users who log large files directly to the 650 or
who wish to upload large (or many) files to the 650 from the internal memory of sondes which have been
used to log data in Discrete or Unattended sampling applications. For example, with the high memory
option, it would be possible to easily upload the data from 7 sondes, each of which have data files in excess
of 200 kB or approximately 75 days at a 15-minute Unattended sampling interval.
No matter which memory option has been selected, it is important to understand that the memory resident
in the 650 is “Flash”, the same type of memory present in YSI 6-series sondes. Flash memory requires no
battery backup and therefore stored data cannot be lost due to instrument malfunction – a significant
advantage. However, it is not possible to erase individual files from flash memory – to free-up memory,
the user must erase (or format) the entire memory chip. From a practical point of view, this means that,
while named files which are already present in the 650 memory can be “overwritten” during multiple
uploads, the previously written files still occupy space in the memory. These files are in fact designated
“deleted” as will be described in Section 3.6.5 below. For example, if a file named “TEST” is uploaded
initially with a memory allocation of 50 kB and then is uploaded at a later time (and “overwritten”) with a
memory allocation of 100 kB, the total memory occupied is 150 KB even though only one file with the
designation “TEST” and a file size of 100 kB is shown in the file directory. For this reason, when dealing
with large files, the user may wish to transfer files to a PC immediately after upload and then erase the
entire flash in order to assure that maximum memory is present for subsequent uploads.
The storing of data directly from sondes to the 650 memory, the uploading of data stored in 6-series sondes
to the 650, and the management of these data files are described in detail in Sections 3.5, 3.6, and 3.7 of
this manual.
3.2.3 650 CONFIGURATIONS
There are a number of ways that you can configure the YSI 650. Below is a list of possible configurations
and corresponding diagrams.
•
•
•
•
650 interfaced to a 6-Series sonde.
650 interfaced to a 6-Series Sonde and a user-supplied GPS unit.
650 interfaced to a PC for data transfer or software upgrade using the PC interface cable
650 with rechargeable battery pack being charged
Figure 1. 650 interfaced to a 6-series sonde.
650
You will need:
•
•
650
6-series sonde
with integral
cable or YSI
field cable
Integral or field cable
with sonde connector
YSI 6-series sonde
YSI, Incorporated
Drinking Water Monitoring Systems Operations Manual
3-3
650 MDS
Section 3
Figure 2. 650 interfaced to a 6-series sonde with user-supplied GPS.
You will need:
•
•
•
•
650
650
6115 GPS cable
User-supplied GPS unit
with DE-9 cable
YSI 6-series sonde with
integral or field cable
User-supplied GPS unit
with DE-9 cable
6115 GPS cable
Integral or field cable
YSI 6-series sonde
Figure 3. 650 interfaced to PC for data transfer or software upgrade.
650
655174 PC Interface
Cable
You will need:
•
•
•
650
YSI 655174
PC interface
cable
PC with
active serial
port
PC Serial port
(DE-9)
YSI, Incorporated
Drinking Water Monitoring Systems Operations Manual
3-4
650 MDS
Section 3
Figure 4. Charging of 650 rechargeable battery pack.
650
You will need:
650 with battery pack installed
6116 Charger adapter cable
6114 Wall charger or equivalent
6116 Charger adapter cable
6114 wall charger (shown) or 6123 power supply
The setup of these configurations is described in detail in subsequent sections of this manual. They are
presented here so that your will be able to ascertain if you have all of the parts necessary for your
applications.
YSI, Incorporated
Drinking Water Monitoring Systems Operations Manual
3-5
650 MDS
Section 3
3.2.4 650 FEATURES
The key physical features of the 650 display and keypad are shown in the figures below.
650 Front View
Display
Backlight Key
On/Off Key
Arrow Keys
Enter Key
Escape Key
Cellular Phone-Style Keypad
MS-8 Connector
Strain Relief Lanyard
Note that the YSI 650 keypad consists of 20 keys as shown in the diagram above. There are four function
keys, up, down, right and left arrow keys and an alpha/numeric keypad. The top left key that has a green
circle and line,
, is the ON/OFF key. The top right key,
Escape key is labeled
YSI, Incorporated
and
, activates the display backlight. The
is the Enter key.
Drinking Water Monitoring Systems Operations Manual
3-6
650 MDS
650 Back View
Section 3
Accessory Connections
Barometer Vent
Patch
Battery Lid
Battery Lid Screws
Note that the back of the case contains the battery lid that is attached to the main case with four captive
screws and has three fittings for attachment of the ultraclamp and tripod accessories. In addition, the
battery lid has a hole that is covered with water-impermeable patch for venting of the optional barometer.
CAUTION: The barometer-venting patch is resident on the inside of the battery lid. Removal of or
damage to this patch will result in water leakage into the battery compartment.
The short cord with loop (lanyard) which is attached to the bottom of the case is attached to the strain relief
of the sonde cable. Simply open the D-ring, pass the lanyard loop through the opening, and then close the
D-ring.
3.2.5 BATTERIES AND CHARGING
The YSI 650 can be powered either with 4 alkaline C cells or a rechargeable NiMH battery pack. With the
C-cell configuration, the user will be able to power a typical YSI 6-series sonde (active dissolved oxygen
and one optical sensor) for approximately 45 hours of continuous operation. The rechargeable battery pack
will allow for about 15 hours of continuous use under these conditions. If the sonde is being powered by its
own internal batteries, the 650 batteries will last much longer. YSI Sondes with internal battery capability
are the 6920, 6600, 600XLM, and 600 OMS.
YSI, Incorporated
Drinking Water Monitoring Systems Operations Manual
3-7
650 MDS
Section 3
3.2.5.1 BATTERY INSTALLATION – C CELLS
Four C cells install easily into the back of the 650. Follow the instructions and diagrams below to install
the batteries properly:
•
Using a Phillips or slotted screwdriver, loosen the 4 captive screws on the battery lid and then remove
the battery lid completely.
•
Insert the cells between the battery clips, being sure to follow the polarity (+ and -) as indicated on the
bottom of the battery compartment.
•
Make certain that the gasket is properly installed on the battery lid before reinstallation.
•
Reinstall battery lid and tighten the 4 captive screws securely and evenly using a Phillips or slotted
screwdriver. Do not overtighten.
3.2.5.2 BATTERY INSTALLATION – RECHARGEABLE BATTERY PACK
The YSI 6113 rechargeable battery pack is self-contained and is easily installed according to the
instructions and diagrams below:
•
Using a Phillips or slotted screwdriver,
loosen the 4 captive screws on the
battery lid and then remove the battery
lid completely.
•
Put the battery lid in a safe place so that
it will be available for future use of C
cells.
•
Make certain that the gasket is properly
installed on the rechargeable battery
before installation.
Gasket
(4) Screws
YSI, Incorporated
Drinking Water Monitoring Systems Operations Manual
3-8
650 MDS
Section 3
•
Insert the rechargeable battery pack assembly into the battery compartment of the 650.
•
Tighten the 4 captive screws securely and evenly using a Phillips or slotted screwdriver. Do not
overtighten
3.2.5.3 BATTERY CHARGING – RECHARGEABLE BATTERY PACK
The 6117 rechargeable battery pack is charged via the MS-8 connector on the bottom of the instrument and
thus the pack must be installed in the 650 for charging. To perform the charging operation, the user will
need to locate the proper power supply (6114 for US/Canada/Japan or 6123 with proper power cord for all
other countries) and the 6116 charger adapter cable which were supplied with your rechargeable battery
pack (6113 for US/Canada, 6126 for Europe, 6127 for China/Australia). As shown in Figure 4 above, first
attach the charger adapter cable to the 650, then insert the barrel connector of the power supply into the
barrel of the adapter cable, and finally plug the power supply into an appropriate AC power outlet. The
pack can be recharged with the 650 either “on “or “off”. However, if the instrument is “on”, the progress
of the charging operation can be viewed in the Status Bar (see Section 3.2.10 below).
To ensure that you get maximum operational time from the rechargeable battery pack, the user should
follow the procedures below:
1.
2.
3.
4.
5.
6.
Place your display/logger on charge for approximately 2 hours to obtain an 80-90 % regeneration of
battery capacity.
Place your display/logger on charge for approximately 6 hours to get a full charge.
Do not charge the batteries continuously for more than 48 hours.
For long term storage, keep your battery pack between the temperatures of –20 C and 30 C and remove
it from the 650 case.
Do not charge your batteries at temperatures below 0 C or above 40 C.
Do not use or store the battery pack at high temperature, such as in strong direct sunlight, in cars
during hot weather, or directly in front of heaters.
If the above steps are not followed, it may result in a decrease in the operational lifetime of your battery
pack. In addition, pay particular attention to the method of long term storage of the battery pack as is
outlined in the following warning:
CAUTION: If the battery pack/650 will not be used for extended periods of time, the user should remove
the battery pack from the instrument. Failure to do this may result in overdischarge of the pack which can
have a detrimental effect of its lifetime
Note that YSI provides recharge options for many countries in the selection or the 6116, 6126, and 6127
kits. However, it is possible that the power cord options in these kits will not be correct for some users. In
these cases, users should purchase the 6126 or 6127 kit and substitute their local PC type power cord for
the power cord shipped with the kit. This power cord is usually readily available at any local electronics
store.
An optional automotive cigarette lighter charger (YSI 616) is also available for recharging the 650 battery
pack. Note that the user will require the 6116 adapter cable to use the cigarette lighter adapter. Instructions
and diagrams for configuring your cigarette lighter charger and changing fuses are shown below and are
found on the back of the 616 package. The user should save these instructions when unpacking the
accessory and keep them for later reference.
YSI, Incorporated
Drinking Water Monitoring Systems Operations Manual
3-9
650 MDS
Section 3
To use the device with an American or Japanese vehicle, slide the adapter ring off of the plug. To use the
device with a European vehicle, leave the adapter ring on the plug and position it so the slots on the ring
line up with the plug’s spring clips. To begin charging your battery pack, first plug the barrel connector of
the cigarette lighter charger into the mating end of the 6116 adapter cable. Then attach the MS-8 end of the
6116 adapter cable to the 650. Finally, plug the other end of the cigarette lighter charger into the vehicle’s
lighter socket.
The 616 cigarette lighter charger contains a 2-ampere fast-blow type fuse. If the power cord stops working
properly, unscrew the adapter’s cap, remove the tip, and then pull out and check the fuse. See diagram
above to remove the fuse. If the fuse is blown or you are unsure, replace it with a new 2-amp fast-blow
fuse that is available at electronics stores such as Radio Shack. Reassemble the adapter and securely screw
the cap back onto the adapter body.
After you have installed batteries or the rechargeable battery pack into your 650, you are ready to proceed
to the next sections.
3.2.6 TURNING THE INSTRUMENT ON
Turn the instrument on by pressing and releasing the on/off button on the top left of the instrument keypad.
The following screen should be displayed.
Main Display
Status Bar
YSI, Incorporated
Drinking Water Monitoring Systems Operations Manual
3-10
650 MDS
Section 3
Note that the screen is divided into two sections – the “Main Display” at the top and a “Status Bar” at the
bottom. The Main Display will provide access to the 650 and sonde menus and will be used to view sonde
sensor readings in real-time, to configure the 650 and the sonde, to calibrate the sonde sensors, and to log
data to either sonde or 650 memory. The Status Bar will always show the date and time of the 650 clock
(updated in real-time), the remaining battery capacity, the current barometer reading if you have purchased
this option, the GPS readings from a user-supplied GPS instrument, and will indicate whether the menu
being viewed in the Main Display is associated with your sonde or the 650. Additional information about
the Status Bar will be provided in Section 3.2.10 of this manual.
You may also want to take the instrument into a dark room and, with the instrument turned ON, press the
backlight key which is located at the top right of the keypad. The instrument backlight should illuminate
the LCD so that the display can be read. Pushing the backlight key again will turn the backlight off. The
backlight will power off automatically after two minutes of non-use.
3.2.7 ADJUSTING THE DISPLAY CONTRAST
The contrast of the 650 display is automatically temperature compensated to provide a proper display under
most field conditions (-10 to 40 C). Some users, however, may wish to alter the display contrast to meet
their own preference. In addition, if the instrument is used at more extreme temperatures, the display is
likely to require some adjustment.
The contrast is easily adjusted by pressing and holding down the backlight key in the upper right of the
keypad and then pressing repeatedly or holding down the up/down arrow keys while observing the display.
Pressing the up arrow while holding down the backlight key increases (darkens) the contrast; pressing the
down arrow under these conditions decreases (lightens) the contrast.
NOTE: The backlight itself will only be activated if the backlight key is pressed and released. You must
hold down the backlight key to adjust the contrast.
YSI, Incorporated
Drinking Water Monitoring Systems Operations Manual
3-11
650 MDS
Section 3
3.2.8 USING THE YSI 650 KEYPAD
On/Off
Backlight
Arrows
Escape Key
Enter Key
Alpha/Numeric Keys
Minus/Hyphen (-) Key
Period (.) Key
The 650 keypad allows the user to navigate various sonde and 650 menu selections and to make
alpha/numeric entries into both the 650 and sonde software. The arrow keys are used to select various
options in the menus; the cellular phone-style alpha/numeric keys allow data entry; the Enter key is used to
confirm selections; and the Escape key returns the user to the previous position in the menu structure.
The alpha/numeric keys of the 650 can be used to enter both numbers and letters. For many entries,
however, where only numbers are appropriate, the software automatically allows ONLY numeric entry,
e.g., the letters (ABC) associated with the “2” key cannot be activated. Examples of this type of fixed
numeric entry include setting the clock of the 650 or sonde, entering calibration parameters for sonde
sensors, and changing entries such as DO warm-up time and optical wiper interval in the Sonde
Advanced|Sensor submenu. You will follow an example of this type of entry when you set the 650 clock
in the example below.
When both numeric and alpha entry are appropriate for input, the 650 keypad provides a cellular phonestyle interface for choosing the proper character. As shown in the above diagram, the 2-9 keys can also be
used to input alpha characters. Basically, to activate a particular alpha/numeric character, the user must
press the appropriate key repeatedly until the desired letter or number appears in the display. For example,
to enter an M, press the numeric 6 key once and release. To enter an N, press the numeric 6 key twice in
rapid succession and then release. Lower case letters are also available for input using this basic method.
The following chart shows the alpha/numeric sequence available for each numeric key in the order they
will appear as the key is pressed repeatedly.
YSI, Incorporated
Drinking Water Monitoring Systems Operations Manual
3-12
650 MDS
Section 3
1 -- 1
2 – ABC2abc2
3 – DEF3def3
4 – GHI4ghi4
5 – JKL5jkl5
6 – MNO6mno6
7 – PQRS7pqrs7
8 – TUV8tuv8
9 – WXYZ9wxyz9
0 -- 0
Using this guide, it can be seen that the character “p” will appear and remain in the display by pressing the
7 key six times in succession. The other characters associated with this key (“P”, “Q”, “R”, “S”, and “7”)
will appear during the repeated pressing of the numeric 7 key. However, only the “p” entry will be retained
after the key is released after the six keystrokes.
After release of the numeric key for approximately 1second, the cursor will automatically scroll to the right
to prepare for the next alphanumeric input. If you make a mistake in the entry, simply return to the
previous character with the left arrow key and reenter the number or letter. After the entry is complete,
press the Enter key to confirm it. You will follow an example of this type of entry when you enter an
Instrument ID name for your 650 in the example below.
To familiarize yourself with the basics of the keypad entry system, follow the instructions below to set the
date and time for your 650 and to enter an Instrument ID:
Turn the instrument on to display the 650 Main menu.
Use the arrow keys to highlight the System setup selection and press the Enter key. A display similar to
the following will appear (Note that the exact format of your displays will depend on the software version):
YSI, Incorporated
Drinking Water Monitoring Systems Operations Manual
3-13
650 MDS
Section 3
Use the arrow keys to highlight the Date and Time selection and press the Enter key. The following
display will appear:
Highlight the selection for your desired date format and press Enter to confirm it.
Highlight the 4-digit year selection and press Enter to toggle between 2-digit (no check mark present) and
4-digit (check mark present) options.
Highlight the Date selection and press Enter. A cursor will appear over the first number in the date as
shown in the following display.
Enter the proper number from the keypad for the first date digit. Note that when you release the key, the
cursor moves automatically to the next number. Repeat this process until the date is correct. Then press
Enter to confirm the Date entry. Note also that, as described above, since alpha characters are
inappropriate for this entry, only numeric entry is possible.
Highlight the Time selection and press Enter. Repeat the process described above for the Date to enter
your correct local time using the military format. For example, 2:00 PM must be entered as 14:00.
Finally, press the Escape key to return to the System setup menu.
Now highlight the Instrument ID selection and press Enter. The following display will appear.
YSI, Incorporated
Drinking Water Monitoring Systems Operations Manual
3-14
650 MDS
Section 3
As shown above, enter the designation “YSI 650” using the general instructions outlined above. Start by
pressing the numeric 9 key three times in rapid succession while viewing the characters on the display until
a “Y” appears. After the entry is complete, pause and the cursor will automatically move to the next entry
position. Now press the numeric 7 four times in succession while viewing the characters on the display.
When an “S” appears, pause and the cursor will move automatically to the next entry position. Continue
with the entries in this way until ID designation is complete. If you make a mistake, you can use the left
arrow key to highlight the flawed entry and correct it. When the entry is complete, press Enter to confirm
it. Note that for this example, where both alpha and numeric entries are appropriate, the user must press the
numeric 2 key 4 times in succession to generate the number 2, as opposed to the previous clock-setting
example where a single press of the numeric 2 key generated the number 2.
After completing the above example, press the Escape key repeatedly to return to the 650 Main menu and
then proceed to the next section.
3.2.9 CONNECTING TO A SONDE
The primary use of the 650 is to interface with YSI 6-series sondes. In this configuration, you will be able
to see data from the sonde sensors in real-time on the 650 display as well as to configure the sonde for your
particular application. In addition, once sonde interface is established, you will be able to easily log data
from the sonde sensors to either the memory of the sonde or the memory of the 650 for later analysis.
The connection between the sonde and the 650 is made via the mating of MS-8 connectors on the standard
YSI field cable and the bottom of the 650 case. To make the connection, hold the 650 in one hand, place
the 650 and cable connectors together, and rotate the field cable connector until engagement occurs. Then
rotate the field cable connector approximately 1-quarter turn until it is fully engaged as evidenced by a
YSI, Incorporated
Drinking Water Monitoring Systems Operations Manual
3-15
650 MDS
Section 3
“click”. After connecting the sonde to the 650, press the “on” button on the upper left of the 650 keypad to
activate the 650 Main menu as shown below:
Using the arrow keys, highlight the Sonde run entry in the Main 650 Menu and press the Enter key.
Readings from the 6-series sonde sensors will appear on the 650 Main Display in real-time as shown in the
following diagram.
The two windows at the top of the display give the capability of logging the displayed readings to either the
650 (top left) or the sonde (top right) memory and allow the user to activate the wiper on turbidity,
chlorophyll, and rhodamine WT probes if they are present in the sonde. Instructions for use of these
windows are provided in subsequent sections of this manual. Note also that there is a disk with rotating
segments in the upper right corner of the display whose movement confirms that the 650/sonde interface is
functional.
To return to the 650 Main menu, press the Escape key.
CAUTION: When using the 650 MDS in field applications which are in close proximity to communication
towers and heavy industrial equipment, or which involve very low humidity conditions, the user may
experience problems with logger function. If possible, the user should relocate the sampling site away
from these potential sources of interference. In most cases, symptoms will involve instrument shutdown or
display lockup. These problems can usually be overcome by either simply pressing the on/off key to
reactivate the meter display or by resetting the instrument by removal of battery power as described in
YSI, Incorporated
Drinking Water Monitoring Systems Operations Manual
3-16
650 MDS
Section 3
Section 3.11 of this manual. If symptoms persist after these actions, consult YSI Customer Service for
advice.
3.2.10 UNDERSTANDING THE STATUS BAR
The diagram below shows the various components of the Status Bar of your 650. Each item identified in the
drawing is explained in detail below.
Main Display
Status Bar
Barometer Reading
GPS Reading
Battery Capacity Status
Date and Time
Menu Indicator
2.10.1 Date and Time. This is the date and time for the clock in the 650, set by the user from the System
setup menu as described above. The date and time entries are updated in real-time in the Status Bar.
2.10.2 GPS Reading. This value will be present only if a user-supplied GPS unit with NMEA 0183 format
is connected to the 650 by the optional YSI 6115 cable. The setup of a GPS interface is described in more
detail in Section 3.8 below. Once properly connected to a GPS instrument, the values displayed in the
Status Bar are updated in real-time as the system is moved from location to location.
2.10.3 Barometer Reading. This value is the current local barometer reading in units selected by the user
in the System setup menu. The value is can be used simply as a meteorological parameter or can be used
in calibration of sonde dissolved oxygen sensors. The barometer reading is NOT corrected to sea level and
is updated in real-time.
2.10.4 Battery Capacity Status. The graphic indicator shows the portion of the battery capacity that is
remaining, either for the 4-C cell configuration or for the optional rechargeable battery pack. If a 6117
rechargeable battery pack is in place, a “NiMH” label will appear as part of the indicator. During charging
of the battery pack, the black portion of the icon will pulse horizontally until charging is complete. In
addition, the entire battery indicator will flash when your batteries are almost exhausted and require
replacement (C-cells) or recharge (optional rechargeable battery pack).
2.10.5 Menu Indicator. This icon is located in the lower right portion of the Status Bar and provides a
guide as to whether the menu on the display of the 650 originates in the sonde or the 650 itself. The icon
shown in the figure above represents a 650 menu; if the menu on the display had originated in the sonde,
the Status bar would display a sonde-like icon as shown below.
YSI, Incorporated
Drinking Water Monitoring Systems Operations Manual
3-17
650 MDS
Section 3
Sonde Icon
3.2.11 UPGRADING ECOWATCH FOR WINDOWS SOFTWARE
To utilize the full capability of the 650 MDS, you will need to upgrade your version of EcoWatch for
Windows from the YSI World Wide Web page (www.ysi.com). Access the YSI Environmental Web Page,
select “tech support” from the header, and then “Downloads”. After registration, select the EcoWatch for
Windows upgrade entry and follow the instructions provided. After the upgrade is complete, your
software version (viewed from the EcoWatch toolbar entry Help|About EcoWatch) should be 3.13.00 or
higher.
If you encounter difficulties in the upgrade procedures, contact YSI Customer Service for advice.
After reading the above sections and participating in the simple examples provided, you should be familiar
with the basics of battery installation, keypad and display function, and keypad data entry. Please proceed
to Section 3.3 where the setup of your 650 is described in detail.
3.3 SETTING UP THE 650
The 650 has a number of features which are user-selectable or which can be configured to meet the user’s
preferences. Most of these choices and selections are found in the System setup selection in the Main 650
Menu. To explore the various setup possibilities of the 650, turn the instrument on, select System setup,
and press Enter. The following display will appear. The second display can be observed by scrolling to
the bottom of the System setup entries with the down arrow.
YSI, Incorporated
Drinking Water Monitoring Systems Operations Manual
3-18
650 MDS
Section 3
YSI suggests that the user become familiar with the features provided in the list below prior to using the
650 in field applications. Each item is described in some detail below.
3.3.1 Software version
The software version of your 650 is shown in the first line of the System setup menu. As enhancements
are introduced to the 650, you will be able to upgrade your 650 from the YSI web page. This item will be
used to track those upgrades and will be useful to YSI Customer Service personnel if you have questions
about the function of the instrument.
3.3.2 Date and time:
As described above in Section 3.2.8, activate this selection to set the date and time from the 650 keypad.
3.3.3 Power sonde:
If this choice is active, your 6-series sonde will be powered directly from the 650 batteries. The choice
MUST be active if you are using a sonde with no internal batteries (600R, 600XL, or 6820). If using a
sonde with internal batteries (600XLM, 6920, 600 OMS battery version, or 6600), you can extend the life
of your 650 batteries by deactivating this selection. Note that the selection MUST BE OFF in order to
determine the voltage of the internal batteries of sondes – important information for Unattended studies.
3.3.4 Baud rate to sonde:
This entry allows the user to adjust the baud rate for communication with the sonde. It does not affect
communication for upload of files to a PC. Highlight the entry and press Enter. Then select the baud rate
of choice and press Enter to confirm it. CAUTION: The baud rate for the 650 MUST match that in the
sonde (usually set at 9600) or communication with the sonde will not be possible. Unless you know that
your sonde is set to a baud rate different than 9600, YSI strongly recommends that you leave the baud rate
for the 650 set to the default value of 9600.
3.3.5 Shutoff Time:
This value represents the number of minutes until the 650 automatically shuts down to save batteries.
Values can be integers from 1 to 15 or enter “0” to disable the shutoff completely.
3.3.6 Comma radix:
The user can toggle between a period (default) and comma for the radix mark by selecting this item and
pressing the Enter key. If you change your radix mark in the 650, make sure that you also change it to the
same symbol in the sonde Advanced|Setup menu.
YSI, Incorporated
Drinking Water Monitoring Systems Operations Manual
3-19
650 MDS
Section 3
3.3.7 ID
Activate this item and Enter choice of instrument identification (limit 11 characters) for your 650 as
described in Section 3.1.8 above.
3.3.8 Circuit board SN
This item identifies the serial number of the circuit board resident in your 650. It cannot be changed by the
user.
3.3.9 Barometer Units:
Highlighting this selection and pressing Enter will activate a display which will allow you to select the
units of barometric pressure which will appear in real-time in the display Status Bar. Highlight the desired
units and press Enter to confirm the selection. This entry will only appear if you have ordered your 650
with the barometer option.
3.3.10 Calibrate Barometer
You may need to scroll down with the arrow keys to view this selection which allows you to calibrate the
optional barometer to your local barometric pressure. While the barometer has been factory calibrated and
should provide accurate readings on receipt, some sensor drift may occur over time, requiring occasional
calibration by the user. Proceed as follows:
Determine your local barometric pressure. This value is usually obtained from an independent laboratory
barometer. You can also obtain a barometric pressure value from your local weather service. This latter
value has usually been corrected to sea level and therefore must be “uncorrected” before it can be used in
calibration of the 650 barometer. See Section 3.9 of this manual for details.
Select Calibrate barometer and press Enter. Input the known barometric pressure from the 650 keypad
in the selected units (mm Hg in the following example) and press Enter. Note that in the example, the
barometer output has changed from 733.4 (the previous incorrect value) to 740 (the correct value from your
laboratory barometer). Note also that a value of the approximate barometer offset which occurred during
the calibration (6.3 mm Hg) is present in the display. The offset value is approximate due to the variation
in the tenths of a mm digit of the sensor. This value can be used to return the sensor to its factory
calibration; simply recalibrate the sensor to a new value which is determined by (current value) – (offset).
Note that this entry will only appear if your have ordered your 650 with the barometer option.
NOTE: After initial calibration of the barometer, a file with a name defined by the Circuit Board ID and a
.glp extension (e.g., 00003245.glp) will automatically be generated and stored in 650 memory. Each
additional barometer calibration record for will also be stored. See Section 6.3 below for the transfer of
this file to a computer for viewing and storage.
YSI, Incorporated
Drinking Water Monitoring Systems Operations Manual
3-20
650 MDS
Section 3
3.4 SONDE MENU INTERFACE
3.4.1 INTRODUCTION
The Sonde menu selection in the 650 Main menu provides a terminal-like interface simulating the
connection of the sonde to a PC as described in detail in Section 2 of the 6-series manual. Thus, this item
provides access to the entire menu structure of your 6-series sonde software so that you can perform custom
setup in the same way that would be possible if the sonde were attached to a PC.
From the 650 Main Menu, select Sonde menu and press Enter. A display similar (depending on sonde
type and sonde software version) to that shown below will appear:
Sonde Icon
Note that the icon in the lower right of the screen has changed from “meter” to “sonde” indicating that the
menu shown originates in the 6-series sonde. Note also that the 650 display has been designed to be very
similar to that presented on a monitor when a 6-series sonde is attached to a PC as shown below.
------------------Main---------------1-Run
5-System
2-Calibrate
6-Report
3-File
7-Sensor
4-Status
8-Advanced
S l t
ti
YSI, Incorporated
(0 f
i
Drinking Water Monitoring Systems Operations Manual
3-21
650 MDS
Section 3
In fact, the only significant difference between the two interfaces is that, for the PC mode, submenus are
accessed by entering the number associated with the specific item, while for the 650 mode the user must
use the arrow keys to highlight the item and press the Enter key to activate it. Thus, the description of the
6-series sonde menu structure and function which is found in your sonde manual is completely valid as a
reference for setting up your sonde for all types of studies. The menu structure of the sonde is presented in
diagram form below, followed by two examples in Section 3.4.2 of how to use the 650 Sonde Menu
interface. In addition, brief instructions for frequently performed sonde operation are provided as a
reference in Section 3.4.3 below.
SONDE MENU FLOW CHART
Sonde
1. Run
1. Conductivity
1. Discrete sample
2. DO %
2. Unattended sample
3. DO mg/L
2. Calibrate
4. Others
1. Directory
3. File
2. Upload
Date and Time
3. Quick Upload
Battery Voltage
4. Status
Available Memory
Logging Status
5. System
4. View File
1. Date & Time
5. Quick View File
2. Comm Setup
3. Page Length
1. (Y) Date
4. Instrument ID
2. (Y) Time
5. SDI-12 Address
3. (Y) Temp, C
6. Delete All Files
7. Test Memory
4. ( ) Temp, F
6. Report
MORE
1. (Y) Temp
7. Sensor
8. Advanced
2. (Y) Cond
1. Cal Constants
3. (Y) DO
2. Setup
4. ( ) ISE1 pH
3. Sensor
MORE
4. Data Filter
NOTE: When using the 650, all sonde functions are accessed through the Sonde menu prompt. These
include:
•
•
•
•
•
•
•
•
•
Activating/Deactivating sensors
Setting up the desired Report output
Calibrating the sensors
Changing the sample interval for Discrete Sample studies
Performing file management functions on the memory in the sonde
Checking the Status or System setup of the sonde.
Setting up sondes for Unattended sample deployments.
Setting up sondes for Discrete sample logging studies to sonde memory.
Uploading files from the sonde memory to the 650.
Earlier YSI display/loggers, such as the 610 D and 610 DM, had many of these functions as distinct items
in the display menu structure – a significant difference from the 650.
YSI, Incorporated
Drinking Water Monitoring Systems Operations Manual
3-22
650 MDS
Section 3
3.4.2 SONDE MENU EXAMPLES
To become familiar with the 650 Sonde menu function, YSI recommends that the user connect a sonde to
their 650 and proceed through the following two examples of common sonde interface operations.
Example 1: Setting up the Report Output – Activation of the Salinity Parameter
Highlight the Sonde menu selection in the 650 Main menu and press Enter. Then use the arrow keys
highlight the Report selection and press Enter again.
Use the arrow keys to highlight the Salinity selection and then press the Enter key to activate the
parameter as shown by a dot in the open circle. Note that the entire report list can be accessed by
continuing to scroll the highlighting block down with the arrow key. After activation of salinity in the
Report setup of the sonde, press the Escape key twice in succession to return to the Main sonde menu.
Example 2: Calibrating the Dissolved Oxygen Sensor
NOTE: In the following example, it is assumed that the Autosleep RS232 function of your sonde has been
disabled in the sonde Advanced|Setup menu. If Autosleep were active, then the display would indicate a
countdown of the DO warm-up time and calibrate automatically at the end of this time period. See Section
3.4.9 of this manual and Section 2 of your 6-series manual for more information on the Autosleep function.
Place the sonde in the calibration chamber with the dissolved oxygen probe in water-saturated air.
Highlight the Sonde menu selection in the 650 Main menu and press Enter. Then, use the arrow keys to
highlight the Calibration selection and press Enter.
YSI, Incorporated
Drinking Water Monitoring Systems Operations Manual
3-23
650 MDS
Section 3
Use the arrow keys to highlight the Dissolved Oxygen selection and press Enter. Then, Use the arrow
keys to highlight the DO% selection and press Enter.
Use the 650 numeric entry keys and the right/left arrow keys to enter the current local barometric pressure.
Then, press the Enter key and observe the dissolved oxygen reading until stabilization occurs. Make sure
the Calibrate selection is highlighted in upper window.
NOTE: The current barometric pressure as read by your 650 will automatically appear as the default value
if your 650 is equipped with a barometer.
When the dissolved oxygen reading is stable, press the Enter key to confirm the calibration as indicated by
the message “Calibrated” in the header. In addition, the message in the upper window will change from
YSI, Incorporated
Drinking Water Monitoring Systems Operations Manual
3-24
650 MDS
Section 3
“Calibrate” to “Continue”. Make sure that “Continue” is highlighted and press Enter to return to the DO
calibration menu.
3.4.3 COMMON OPERATIONS USING THE 650 SONDE MENU
SELECTION
The following section provides brief instructions for carrying out frequently used sonde activities via the
Sonde menu selection of the 650. The instructions do not provide the detail of the examples above,
assuming that the user understands how to navigate the menus with the Enter, Escape, and Arrow keys
and is able to make alpha/numeric entries from the keypad.
3.4.3.1 Running the sonde in real-time
This function can be accomplished either automatically from the Sonde run selection of the 650 menu or
by using the Sonde menu selection to activate the Run|Discrete Sample submenu of the Main 6-series
menu. If the Sonde run selection is made, data automatically appears on the screen at a sample interval of
approximately 1 second. However, if the user chooses to use the Run function from the sonde menu, the
sample rate can be set to higher values in the Discrete Sample menu. This feature will be described in
detail in Section 3.5.2. To Run the sonde from the Discrete sample menu, highlight Start sampling and
press the Enter key.
3.4.3.2 Setting up a sonde for deployment
Use the 650 Sonde menu selection to access Run|Unattended sample and then proceed with the setup for
the monitoring study as described in detail in Section 2 of the 6-series manual. Use the keypad to set the
sample interval and input file and site names. Then highlight Start logging and press Enter to begin the
Unattended study in which data is logged directly to the sonde memory. Finally, disconnect the 650 and
deploy the sonde.
3.4.3.3 Uploading data from sondes to the 650
Use the 650 Sonde menu selection to access the sonde File menu and then choose either a Quick upload
(all data in the last file) or Upload (complete or partial data in any sonde file) as described in detail in
Section 2 of the 6-series manual. After the proper selection is made, press Enter and the file will be
transferred automatically to the 650 memory with the 650 display indicating that an upload is in progress.
The uploading of data files from sondes to the 650 is demonstrated in greater detail in Section 3.7 below.
YSI, Incorporated
Drinking Water Monitoring Systems Operations Manual
3-25
650 MDS
Section 3
3.4.3.4 Calibrating sonde sensors
Use the 650 Sonde menu selection to access the sonde Calibrate menu. Once the menu has been
activated, use the arrow keys to highlight a sensor for calibration and follow the instructions on the screen.
Use the keypad to enter numeric values associated with the calibration standards and press Enter to
confirm your input. View the data from each calibration standard in real-time and then highlight the
Calibrate selection in the upper frame. When the output is stable, press Enter to confirm the calibration
point. Then highlight Continue and press Enter to either move to the next calibration point or to finalize
the calibration. See the example in Section 3.4.2 above for a typical calibration procedure.
NOTE: To return a sensor calibration setup to its factory default setting, access any calibration routine for
that particular sensor which asks for numeric input. However, instead of entering numbers, hold the Enter
key down and press the Escape key. Highlight “yes” and press Enter. This protocol is the equivalent of
entering the command “uncal” from a computer keyboard.
3.4.3.5 Changing the sonde Sensor setup
Use the 650 Sonde menu selection to access the sonde Sensor menu. Once the menu has been activated,
use the arrow keys to highlight a sensor for activation/deactivation and press Enter to confirm your choice.
3.4.3.6 Changing the sonde Report setup
Use the 650 Sonde menu selection to access the sonde Report menu. Once the menu has been activated,
use the arrow keys to highlight a sensor for activation/deactivation and press Enter to confirm your choice.
See the example in Section 3.4.2 above.
3.4.3.7 Viewing data stored in the sonde
Utilize the 650 Sonde menu selection to access the File menu of the sonde. Highlight the “View file”
selection and press Enter. Select the file that you want to view. Choose Proceed and press Enter to view
the entire file or select the portion of the data that you want to view and then select Proceed and press
Enter to confirm your selection. After data has appeared on the screen, use the arrow keys to select the
particular sensor data that you wish to view.
IMPORTANT: The sonde Quick view file, which is designed to show the last page of data of the last
logged file when the sonde is interfaced to a PC is slightly different for the sonde/650 interface. Making
this selection will indeed show data from the last logged file, but all data (not just the last page) will be
displayed. It is still possible, however, to quickly view the last few logged data points which may be
important in checking a sonde’s current performance in the field. To rapidly move to the end of the file (in
either View file or Quick view file), press and HOLD the down arrow to accelerate the transition to the
final data points. Then use the arrow keys to view the data of interest.
3.4.3.8 Configuring and setting the sonde clock
Utilize the 650 Sonde menu selection to access the System menu of the sonde. Highlight the Date &
Time selection and press Enter. Use the arrow keys to highlight the preferred date format and press
Enter to confirm your selection. Activate/deactivate the 4-digit year selection, as desired, using the Enter
key to toggle between choices. Finally, set the date and time by highlighting the entries and inputting new
values from the keypad.
3.4.3.9 Setting the sonde Autosleep configuration
As explained in Section 2 of the 6-series manual, the setup of the Autosleep RS-232 function of the sonde
should be governed by the following rules:
•
•
Unattended sample studies/Remote deployments – Autosleep Active
Discrete sample studies with user present – Autosleep Inactive
The rules are particularly important with regard to the method of dissolved oxygen calibration – automatic
at the Unattended sample interval if Autosleep is Active; manually controlled by the user if Autosleep is
inactive. See Section 2 of the 6-series manual for additional information on the Autosleep function.
YSI, Incorporated
Drinking Water Monitoring Systems Operations Manual
3-26
650 MDS
Section 3
To set the Autosleep function, utilize the 650 Sonde menu selection to access the Advanced|Setup menu
of the sonde. Use the up/down arrow keys to highlight the Autosleep RS232 selection and toggle the
function on/off with the Enter key until it is correct for your application.
3.5 LOGGING DATA WITH THE 650
3.5.1 INTRODUCTION AND BASICS OF LOGGING
A primary function of the 650 is to facilitate the storage of field data from 6-series sonde sensors for later
analysis. It is important to understand that sonde sensor data can be logged to two memory locations using a
system consisting of a 650 interfaced with a sonde: (1) memory resident in the sonde and (2) memory resident
in the 650 itself. Different applications may favor one logging choice over another. In addition, data can be
logged either as single points (after the user has verified stabilization) or as a continuous data stream at a fixed
sample interval. No matter where or how the user decides to log field data with a 650/sonde system, the 650
software plays the key role in controlling the process.
When setting up the 650/sonde system for your logging application, it important to realize that the 650 Run
display, from which all logging is initiated can be activated by two methods. The first is to simply highlight
the Sonde run selection from the 650 menu. The second is to use the Sonde menu command from the 650
Main menu to enter the sonde menu structure and then to activate a Discrete sample study. Either of these
methods can be used to log data to both the sonde and the 650. However, for most applications, the latter
method (Run screen from sonde Discrete sample) should be used to activate logging to sonde memory with
the sample interval between logged points in a continuous data stream set from the Discrete sample menu of
the sonde. Likewise, the former method (direct activation of the 650 Run display from the Sonde run
command) should usually be used to activate logging to 650 memory with the sample interval set in the
Logging setup menu of the 650.
NOTE: Logging to sonde memory may not be possible for some older version 600R, 600XL, and 6820 sondes
that were purchased prior to September 1999.
YSI, Incorporated
Drinking Water Monitoring Systems Operations Manual
3-27
650 MDS
Section 3
Sample Interval
Set in 650
Logging setup
menu
Sample Interval
Set in Sonde
Discrete sample
menu
650 Logging
Window
Sonde Logging
Window
The user should also note the two windows in the upper portion of the display above, one designated “650”
and the other “Sonde”. All logging, either to sonde or 650 memory is controlled from these windows. As
indicated, data storage to the 650 is controlled from the upper left logging window. Storage to the sonde
memory is controlled from the upper right logging window. The highlighting cursor associated with the
logging windows can be moved within a particular window using the up/down arrows and toggled from
window to window using the left/right arrows. Note also that, if your sonde contains an optical sensor, it is
possible to activate the probe wiper prior to logging from the Sonde logging window.
While the following sections will show that the logging functions of the 650 have a high degree of flexibility
and capability, from a basic point of view, logging with the 650 is simple:
YSI, Incorporated
Drinking Water Monitoring Systems Operations Manual
3-28
650 MDS
Section 3
•
Decide if you want to log data continuously, and, if so, determine what sample interval between data
points is appropriate for you study. If you will be logging to 650 memory, highlight the Logging setup
selection from the 650 Main menu, then highlight the Interval selection and set the interval as desired. If
you will be logging to sonde memory, select the 650 Sonde menu and then Run|Discrete sample from
the sonde menu. Set the sample interval and then activate the data display by selecting Start sampling.
•
Select the memory (sonde or 650) in which you want to store your data by toggling between the logging
windows.
•
Highlight the logging method desired – “Log one sample” for a single logged point or “Start logging” to
store a continuous data stream.
•
Press Enter to activate the logging selection.
•
To end the study if a continuous data stream was selected, press Enter with the highlight cursor on the
Stop logging command or press the Escape key.
Sections 3.5.2 and 3.5.3 below provide details and real-life examples of logging data to sonde memory and to
650 memory, respectively, using the 650 as the interface.
3.5.2 LOGGING DATA TO SONDE MEMORY
3.5.2.1 INTRODUCTION
All YSI 6-series sondes sold since September 1999 have memory present on their internal PCBs. In addition,
all 600XLM, 6920, and 6600 sondes have internal memory, regardless of the date of purchase. Interface of
these sondes to a 650 allows the user to easily store data (either a single point or a continuous stream) to the
sonde memory. If a continuous stream of data is desired, the interval between the stored points is controlled
by the Sample interval in the sonde’s Discrete sample function. The file name under which this data is
stored and the site name associated with the file are also input in the Discrete sample function of the sonde
using the 650 keypad as the input method. When logging to sonde memory, be sure to follow the instructions
above with regard to entering the 650 Run display either directly from the 650 Sonde run menu or indirectly
from the 650 Sonde menu selection to control your sample interval.
The following examples show the setup and implementation of logging to sonde memory using the 650 as the
interface device.
3.5.2.2 EXAMPLE 1 – SIMPLE SINGLE POINT LOGGING TO SONDE MEMORY
A user with a 600XL/650 system wants to store data electronically from a single site rather than writing down
the information manually in the field.
To log this data point to the sonde memory, the user highlights the Sonde run selection in the 650 Main
menu and presses Enter to begin data display.
YSI, Incorporated
Drinking Water Monitoring Systems Operations Manual
3-29
650 MDS
Section 3
The user places the sonde in the water and watches the readings on the 650 display until they are stable.
When stable, the Log one sample selection in the Sonde logging window (upper right) is highlighted as
shown above and the Enter key is pressed. The header changes from “Run” to “Sample logged” to confirm
that the data storage to sonde memory was successful and then returns automatically to the Sonde run
display. The user turns the 650 off and returns to the office to retrieve the data.
The single data point is stored in the sonde memory under the automatically generated file name NONAME1.
The file can be viewed by selecting Sonde menu from the 650 Main menu and pressing Enter.
To view the data on return from the site, the user selects the sonde menu File selection, presses Enter to
confirm the entry, and then highlights theView file selection and presses Enter. Following these instructions
generates a display of the data that is stored in the sonde memory under the default name NONAME1. Use
the right/left arrow keys to scroll horizontally to view all of the data.
The user manually records the data from the site and turns the system off.
3.5.2.3 EXAMPLE 2 – CONTINUOUS LOGGING APPLICATION TO SONDE
MEMORY
A user wants to carry out a vertical profile of a lake from 0 to 30 feet in order to detect the presence of a
thermocline, and, if identified, to locate its position in the water column. The experiment will involve
lowering a 6920 sonde in 1 foot increments until the bottom of the lake is detected, leaving the sonde at each
depth for 3 minutes to allow the sensor readings to stabilize while logging data continuously. Thus, the user
will generate data over a 90 minute time period (30 increments times 3 minutes per increment). If data were
logged directly to sonde memory at the default 0.5 second sample interval, a very large data file containing
5400 data points would be generated, with little benefit gained from its size.
With this in mind, the user decides to increase the sample interval to 16 seconds, thus greatly reducing the
amount of data in the file with no loss of real resolution. As explained above, the sample interval for logging
to sonde memory is set in the Discrete sample menu of the sonde, and thus the user MUST activate the 650
Run display indirectly using the 650 Sonde menu selection as detailed above.
YSI, Incorporated
Drinking Water Monitoring Systems Operations Manual
3-30
650 MDS
Section 3
The user attaches the 6920 sonde to a 650. After turning on the 650, the user selects Sonde menu from the
650 Main menu and presses Enter to display the Main sonde menu.
The user then selects Run from the sonde Main menu and Discrete sample from the Run menu, pressing
Enter to confirm each selection.
To set up the desired study parameters, the user uses the 650 keypad to change the Sample interval from 0.5
seconds to 16 seconds and inputs custom file (PROFILE1) and site (WEST LAKE) designations.
The user then highlights Start sampling and lowers the instrument into the water to begin the study. The data
displayed on the screen is updated every 16 seconds. The user then highlights the Start logging selection in
the sonde logging window in the upper right of the display and presses Enter to begin logging data to sonde
memory. The message in the sonde logging window changes to Stop logging, indicating that logging has
successfully been activated.
YSI, Incorporated
Drinking Water Monitoring Systems Operations Manual
3-31
650 MDS
Section 3
At the end of the 90 minute profile determination, the user either confirms the Stop logging command by
pressing Enter or simply presses the Escape key to return to the sonde Discrete sample menu, highlights the
Close file selection, and confirms the file closing by pressing Enter.
The profile data taken at a 16 second sample interval is now stored in the sonde memory under the file name
PROFILE1. It can be viewed on the 650 display and/or uploaded to the 650 memory or directly to a PC by
accessing the sonde File menu.
3.5.2.4 SONDES WITHOUT MEMORY
If your sonde is a 600R, 600XL, or 6820 purchased prior to September 1999, it may contain a circuit board
that does not have memory. With sondes of this type, you will not be able to log data to the sonde – only to
the 650 as detailed in the following section. With these no-memory sondes attached to your 650, the Run
display will show a blank Sonde logging window as shown below.
YSI, Incorporated
Drinking Water Monitoring Systems Operations Manual
3-32
650 MDS
Section 3
3.5.3 LOGGING DATA TO 650 MEMORY
3.5.3.1 INTRODUCTION
Even if the sonde in your 650/sonde system has its own memory, it may be more convenient for you to log
data directly to the 650 memory simply because you eliminate the need to upload the data after logging,
i.e., it will already be resident in 650 memory. In addition, logging directly to 650 memory allows you to
log GPS and barometric pressure readings along with sonde sensor data. Barometer and GPS data cannot
be logged to sonde memory. Finally, the file/site list capability associated with the 650 is more powerful
than that of the sonde, allowing you to log data from several sites to a single file. If these applications are
important to you, then it is likely that logging directly to 650 memory should be your first choice.
Naturally, if your sonde is a 600R, 600XL, or 6820 with no memory (pre-1999), then you will be
REQUIRED to log your sonde data directly to the 650.
Before proceeding in this section, be sure that you review Section 3.5.1 above which describes the basics of
logging with a 650 (either to sonde or to 650 memory).
The following sections will provide details and examples of the flexibility of logging sonde data to 650
memory. The distinction between (a) simple occasional logging with file and site names entered at the
logging site and (b) logging to a more sophisticated file structure where file parameters are entered into a
site list prior to going to the field will be described.
3.5.3.2 SIMPLE LOGGING TO 650 MEMORY
The term “simple logging” to 650 memory refers to the method of defining file and site names for the
study. In applications of this type, the user inputs new file and site (optional) names for each study at the
time the data is logged.
IMPORTANT: The Use site list selection in the 650 Logging setup menu should be INACTIVE for the
example below which demonstrates simple logging.
A user with a 600XL/650 system wants to store a continuous stream of data electronically for a single site at a
sample interval of 10 seconds between data points. Note that this is a similar example to that in 3.5.2.2
above, except that the logging is to 650, rather than sonde, memory and a data stream, rather than a single
point, will be logged.
The first step in this application is to make certain that the sample interval is set correctly for the logging
study. The factory default sample interval of 1 second will therefore need to be changed to 10 seconds.
To set the sample interval, highlight the Logging setup entry in the 650 Main menu and press Enter.
YSI, Incorporated
Drinking Water Monitoring Systems Operations Manual
3-33
650 MDS
Section 3
Press Enter at the highlighted Interval selection and use the arrow keys to scroll to the right and change the
interval from 1 second to 10 seconds. Confirm the selection by pressing Enter and then press Esc to return to
the 650 Main menu.
Once the sample interval is set correctly in the 650 Logging setup menu, the user simply highlights the Sonde
run selection in the 650 Main menu and presses Enter to begin data display.
The user places the sonde in the water and then highlights the Start logging selection in the 650 logging
window (upper left) and presses Enter. The user is then prompted to enter a Filename and Site description
for the study as shown below.
YSI, Incorporated
Drinking Water Monitoring Systems Operations Manual
3-34
650 MDS
Section 3
Using the arrow keys, the Filename window is highlighted, the user presses the Enter key and then inputs the
file name (in this case, WEST) from the keypad as shown above. A site name (BLUE LAKE) is then entered
from the keypad by highlighting the Site description window and proceeding as for the File name. Pressing
Enter confirms the Site entry. The user then highlights the OK window and presses Enter to log the point.
The header of the 650 logging windows changes to Stop logging to confirm that the data storage to 650
memory is active and a countdown timer appears at the top of the display to show the exact moment a point is
logged to 650 memory. When the study is complete, the user highlights the Stop logging selection and
presses Enter to terminate logging.
NOTE: For ultimate simplicity, it was not necessary to enter either a file or a site name in the above
application. If the OK window had been highlighted immediately and Enter pressed, a point will be logged
to a file in the 650 memory under the designation NONAME1. It is also possible to input a custom file name,
but not enter a site name and then log the point.
The stream of data is stored in the 650 memory under the file name WEST that was input by the user. The file
can be viewed by selecting File from the 650 Main menu and pressing Enter. Then highlight the View file
selection and then the selected file (WEST), pressing Enter after each entry. The data in the file will be
displayed as shown below. Use the arrow keys to scroll horizontally in order to view all of the data.
Note that, using these same basic guidelines, data could have been logged at another site on the same day with the
user inputting a different site designation (file name and site name) in the field. Data could also have been logged
single points or as a continuous data stream at each site simply by the choice of Log single point or Start
logging, respectively, in the 650 Logging window.
Data can also be appended at later times to existing site designations. However, there is a limitation on
this process: the parameter setup during subsequent logging runs MUST be exactly the same as for
the first entry. For example, if you add a sonde parameter to the Report for the second logging run to a
particular site, you will not be able to append this data to the existing file. If you logged Barometer or
GPS readings to the initial file you will be required to maintain the logging of these files on subsequent
logging runs. If your current parameter setup is different from the one used initially, a “Parameter
Mismatch” screen similar to that shown below will appear when you try to log data to the old site
designation. The screen should help in pinpointing the change in your parameter setup that is causing the
inability to append the file. In the example below, the old parameter setup is shown on the right of the
screen and the new parameter setup is on the left. It is evident that the mismatch occurs in the third line
where salinity from the new setup is “mismatched” with “DO %” from the old setup. The screen thus
shows that salinity has been added to the parameter list between the two logging studies and must be
removed if the original file is to be appended with further data.
YSI, Incorporated
Drinking Water Monitoring Systems Operations Manual
3-35
650 MDS
Section 3
3.5.3.3 LOGGING TO 650 MEMORY WITH A SITE LIST
In the example above, you learned how to log data to 650 memory that had file and site designations input
to the logger at the time that the data was logged in the field. It is also possible, and in most cases more
convenient, to place file and site designations into the 650 memory in the office or laboratory before
moving to field for logging studies. This is particularly true if you are aware of the sites at which you will
be determining water quality data and/or which you will be visiting on a regular basis. The following
section describes how to set up site lists which contain entries designated “Site Designations” that will be
instantly available to the user in the field to facilitate the logging of data in the field with pre-established
naming of files and sites. There are two kinds of Site Designations available for use in Site lists:
•
Site Designations associated with applications where data from a single site is always logged to a
single file. This type is referred to as a “Single-Site Designation” and is characterized by two
parameters – a file name and a site name. Files logged to 650 memory under a Single-Site
Designations will be characterized primarily by the file name, but will also have the Site name
attached, so that it is viewable in either the 650 File directory or in EcoWatch for Windows after
upload to a PC
•
Site Designations associated with applications where data from multiple sites are logged to a single
file. This type is referred to as a “Multi-site Designation” and is characterized by three parameters – a
file name, a site name, and a site number. Files logged to 650 memory under Multi-site Designations
are characterized by a file name, but not a site name, since multiple sites are involved. However, each
data point has a Site Number attached to it so that the user can easily determine the sampling site when
viewing the data from the 650 File menu or processing the data in EcoWatch for Windows after upload
to a PC.
When reading the following section on the use of the 650 Site list, remember that a Site List is a
compilation of individual entries called Site Designations. Single-Site Designations are used when the
data from a particular location is always logged to the same single file. A Single-Site Designation is
characterized by a unique file name. Multi-Site Designations are used when data from several locations
are logged to a single file. For Multi-site Designations, there will a single File Name with multiple Site
Names and Site Numbers. The following displays show examples of Single and Multi-Site Designations.
Site List
Single-Site Designations
with Different File Names
YSI, Incorporated
Drinking Water Monitoring Systems Operations Manual
3-36
650 MDS
Section 3
Site List
Multi-Site Designations with
the Same File Name
Note that Site lists containing Single Site Designations are usually input with the designation Store
Site Number INACTIVE in the 650 Logging setup menu. Thus, no site numbers appear in the first Site
list example. Conversely, Site lists containing Multi-Site Designations MUST be input with the Store
Site Number selection ACTIVE as shown in the second example.
As noted above, establishment of either of these two types of Site Designations that are stored in 650
memory in a Site List will allow you to log field data to the 650 memory without entering file/site
information from the 650 keypad in the field at each site. You will easily be able to access previously
entered Site Designation information from this the Site List at each field site and thus simplify your record
keeping and logging procedures. To utilize the full capability of the 650 logging system, you will need to
understand how to set up and use these two types of Site Designations, particularly if you are performing
multiple or replicate logging studies at various field sites. The following discussion and examples should
help you understand how to set up site lists for various applications.
LOGGING OF DATA TO 650 MEMORY FROM SINGLE SITES TO SINGLE FILES – USE OF
SINGLE-SITE DESIGNATIONS IN A SITE LIST
The setup and use of Single-Site Designations will be provided in the following application example:
Water quality data needs to be collected for two sites at the West and East ends of a lake (Blue Lake) at
various time intervals for 30 days. The environmental scientists want all of the data for each site to be in a
separate data file that can be reported from EcoWatch for Windows or from a spreadsheet. The key to this
application is that each physical location will need to be characterized by a different File Name in the Site
Designation.
To establish a site list in the 650 memory for this application, highlight the Logging setup selection in the
650 Main menu and press Enter. The following screen will appear. Make certain that the selection Use
Site list is active to display the full capability of the Logging setup as shown below. To set up a list with
Single-Site Designations the selection Store Site number should be INACTIVE (as shown below) before
proceeding.
YSI, Incorporated
Drinking Water Monitoring Systems Operations Manual
3-37
650 MDS
Section 3
Note also that if you have purchased a 650 without the barometer option, the selection Store barometer
will not be present. Decide whether or not you want to store GPS and barometer information with your
data file and activate/deactivate the Store Lat and Long and Store Barometer selections appropriately.
Leaving these selections active will occupy memory in the 650 during logging and this factor may be a
consideration if you have purchased a 650 with “Low” memory and you do not really require this
information in your file. Once these selections have been made, highlight the Edit site list selection and
press Enter to display the screen below. Note that you can use the left/right arrows to scroll between the
Filename and Site name selections and that tips about the meaning of these terms is provided at the bottom
of the display depending on the position of the cursor.
To make Site list entries for this application, begin by highlighting the Filename position, pressing Enter
and inputting the file name (WEST, in this case) from the keypad. Press Enter to confirm the entry and the
cursor will automatically move to the right for the entry of a Site name. Enter BLUE LAKE for the site
and press Enter to confirm the entry. The cursor will move automatically to the next Filename entry
position. Now enter EAST for the file name and BLUE LAKE for the site name, pressing Enter after each
entry to confirm. Your site list should appear like that in the following display.
You have now established a site list that will be available in the field for logging of data to two files on
BLUE LAKE -- EAST and WEST. To use this list, you need to first make certain that the entry Use site
list is active in the 650 logging setup. Then travel to the first location, identified by the Filename WEST,
activate the 650 Run display, and then select either a continuous data stream (Start logging) or a single
data entry (Log single point) from the 650 logging window.
YSI, Incorporated
Drinking Water Monitoring Systems Operations Manual
3-38
650 MDS
Section 3
Then press Enter. When the logging prompt is activated, the site list will automatically appear on the
display and be available for use in your study as shown below. First highlight the WEST file (since you are
at that location) and press Enter to log data to the 650 memory. An indication that the logging was
successful will appear in the 650 logging window. Then move to the next location (EAST), activate the
650 logging function, and repeat the logging process, but this time highlighting the EAST Filename entry.
NOTE: If you want to return to the Edit site list display for changes before logging, use the RIGHT
ARROW KEY to highlight the Configure selection and press Enter. The up/down arrows will only scroll
within the Site list.
The data from the two locations has been logged to the selected files that can be either viewed manually
using the 650 View file menu or uploaded to EcoWatch for Windows from the 650 File menu. This means
that all data for the West and East sites are located in separate files identified by the Filenames WEST and
EAST as shown in the 650 File Directory below.
Details of the files (shown by pressing Enter when the File is highlighted in Directory) are shown below.
Note that the site name (BLUE LAKE) is listed in the file since the data was logged using Single-Site
Designations.
YSI, Incorporated
Drinking Water Monitoring Systems Operations Manual
3-39
650 MDS
Section 3
These files will remain “open” in 650 memory so that you can return to each location at a future time and
log more data to the file designations WEST and EAST (but see note below). The key for this Site list
setup is that all data logged will be stored in a separate file for each location (WEST and EAST) which
were designated as file names at the site BLUE LAKE.
NOTE CAREFULLY: As described above for non-site list files, there is a limitation on appending data to
existing files: the parameter setup during subsequent logging runs MUST be exactly the same as for the
first entry. For example, if you add a sonde parameter to the Report for the second logging run to a
particular site, you will not be able to append this data to the existing file. If you logged Barometer or
GPS readings to the initial file you will be required to maintain the logging of these files on subsequent
logging runs. If your current parameter setup is different from the one used initially, the Site Designation
for that file will be “grayed-out” in the Site list and will not be available until you adjust your parameter
setup. If you try to log data to the grayed-out file, you will be shown a “Parameter Mismatch” screen
similar to that for non-site list files which will aid in diagnosing the differences in the parameter setup that
is preventing the existing file from being appended with new data
LOGGING OF DATA FROM SEVERAL DIFFERENT SITES TO THE SAME FILE – USE OF A
“MULTI-SITE” LIST
The setup and use of Multi-Site Designations will be provided in the following example which deals with
a different approach to the application in the previous example on Single-Site Designations: Water quality
data needs to be collected for two sites at the West and East ends of a lake (Blue Lake) at various time
intervals for 30 days. In this case, the environmental scientists want all of the data in a single file for
recording keeping convenience. The key to this application is that the Site list will need to contain MultiSite Designations with the same Filename, but with different Site names and Site numbers to
characterize each physical location.
To make Site list entries for this application, highlight the Logging setup selection in the 650 main menu
and press Enter. The following screen will appear. As in the previous Site list setup, make certain that you
have activated/deactivated the Store barometer and Store Lat and Long settings as appropriate for your
application. The real key, however, in configuring the Logging setup display for use with a Multi-site list
is that you MUST make certain that the selection Store Site number is ACTIVE (as shown below) before
proceeding.
YSI, Incorporated
Drinking Water Monitoring Systems Operations Manual
3-40
650 MDS
Section 3
Then highlight the Edit site list selection and press Enter to display the following screen.
To generate a list of Multi-Site Designations for storing readings from various sites to the same file,
establish two entries in the site list with the same file name (BLUELAKE). The entries will be
differentiated by different Site names (WEST and EAST), and, more importantly, by different Site
Numbers (1 for WEST and 2 for EAST) so that your site list appears as shown in display below.
You have now established a site list that will be available in the field for logging of data from two sites
(WEST and EAST) to a single file (BLUELAKE). To use this list, you need to first make certain that the
entry Use site list is active in the 650 logging setup. Then travel to the WEST site, activate the 650 Run
display and then select either a continuous data stream (Start logging) or a single data entry (Log single
point) from the 650 logging window, and press Enter When the logging prompt is activated, the site list
will automatically appear on the display and be available for use in your study as shown below. First
highlight the entry with the WEST Site name (since your are at that location) and press Enter to log data
to the 650 memory. An indication that the logging was successful will appear in the 650 logging window.
Then move to the next location (EAST), activate the 650 logging function, and repeat the logging process,
but this time highlighting the EAST Site name entry.
YSI, Incorporated
Drinking Water Monitoring Systems Operations Manual
3-41
650 MDS
Section 3
NOTE: If you want to return to the Edit site list display for changes before logging, use the RIGHT
ARROW KEY to highlight the Configure selection and press Enter. The up/down arrows will only scroll
within the Site list.
The data for two different sites has now been logged to the single file (BLUELAKE) that can be either
viewed manually using the 650 View file menu or uploaded to EcoWatch for Windows from the 650
File|Upload to PC menu. The Site Number (“1” for the WEST site and “2” for the EAST site) will be
stored with each data point and will be thus be available for identifying where the data was taken. The file
BLUELAKE can be examined by use of the 650 File selection. In the 650 File menu, highlight Directory
and press Enter as shown below. Then press Enter with the cursor on the BLUELAKE file to show the
file details.
Note that there is NO Site name listed for the file BLUELAKE since data from more than on site was
logged to it. Now highlight the View file selection and press Enter to display the data in BLUELAKE as
shown below.
Note that the data from two sites is identified by the Site Number attached to each data record. To index
these numbers to the appropriate locations, the user must consult the Site list by activating Edit site list
from the 650 Logging setup menu. The correlation between site names and numbers is found here,
indicating that Site 1 is WEST and Site 2 is EAST.
YSI, Incorporated
Drinking Water Monitoring Systems Operations Manual
3-42
650 MDS
Section 3
This file will remain in 650 memory so that you can return to each location at a future time and log more
data to the Site designations WEST and EAST. The key for this site list setup is that all data logged will
be stored in the same file (BLUELAKE) under different Site Numbers for each location (1 for WEST and
2 for EAST).
NOTE CAREFULLY: The same limitation noted above applies for appending the file BLUELAKE with
additional data from these or other sites – the logging setup (sonde parameters, barometer, GPS) must be
identical to that for the initially-stored data. If there has been a change in setup, the Site Designation will
be “grayed-out” in the Site List indicating a parameter mismatch.
3.5.3.4 EDITING YOUR SITE LIST
The 650 software provides powerful tools for editing your site list. Actions such as inserting (adding) new
entries, deleting existing entries, and moving entries within the list can be carried out easily from the
keypad. Highlight the Edit site list entry in the 650 Logging setup display and press Enter to show the
following screen.
Note that the keystrokes for editing the site list are shown in the bottom of the Main Display. Thus, to
insert (add) a file above the present cursor position, simply highlight the proper entry and press the Right
arrow key while holding down the Enter key as shown in the following example. Note that two sites were
inserted in the initial site list using this method.
The two inserted entries can be moved either up or down in the list by highlighting them and pressing the
Up or Down arrow key while holding down the Enter key or completely deleted by highlighting the entry
and pressing the Left arrow key while holding down the Enter key as shown below.
YSI, Incorporated
Drinking Water Monitoring Systems Operations Manual
3-43
650 MDS
Section 3
Finally, the user should be aware of a timesaving tip that is displayed when the Filename entry is
highlighted. The tip allows much easier generation of Multi-Site Designations where the Filename is
identical for several files. To “copy” the Filename from the previous file to a new entry below, simply
highlight the new Filename block, press Enter and then enter site names and site numbers. The site list
will show these blanks in the Edit site list mode as shown on the left below, but when the site list is
accessed for logging studies the actual Filename will appear to avoid confusion. This is shown at the right
below. Note that, by using this tip, two new sites have been easily added to the BLUELAKE Multi-site list
with no need to enter “BLUELAKE” Filename for each new site.
Remember that, when editing your Site list, you will have no effect on the actual files which were
previously logged to 650 memory nor on the data in the files. See Section 3.6 below.
3.5.4 650 LOGGING – “CANS” AND “CAN’TS”
The use of the 650 to facilitate the storage of data from YSI 6-series sondes has been described in some
detail in the sections above. Unfortunately, the high levels of capability and flexibility of the 650 logging
function might also be viewed as complexity which, in turn, can confuse some users about how to employ
the 650 in their particular application. This section is designed to help with any confusion that exists by
listing what “can” be done with the 650 logging system and what “can’t” be done.
3.5.4.1 SUMMARY OF 650 LOGGING CAPABILITIES
WITH A 650/YSI SONDE SYSTEM, THE USER CAN:
•
Log sonde sensor data to either sonde memory (if your sonde is so equipped) or 650 memory.
•
Log data as either a single point or as a continuous data stream.
•
Log data in both single point form and continuous stream form to the same file in 650 or sonde
memory.
YSI, Incorporated
Drinking Water Monitoring Systems Operations Manual
3-44
650 MDS
Section 3
•
Log continuous data stream data at long or short sample intervals to sonde memory, as long as the
study is started from the Run menu of the sonde.
•
Log continuous data stream data at long or short sample intervals up to 15 minutes to 650 memory
using the Sample interval selection in the Logging setup menu of the 650.
•
Log data from the 650 internal barometer to the memory of the 650.
•
Log data from a user-supplied GPS unit to the memory of the 650, as long as the GPS unit is set up in
NMEA format and has the proper cable.
•
Log data with minimal keypad entry from the 650 display by using default file naming.
•
Assign custom file and site names using the 650 keypad at the logging site.
•
Set up custom site lists in the office or laboratory that are instantly available in the field to simply
file/site management.
•
Set up Site Designations that are characterized by a File Name and a Site Name for simple logging of
data from a single site to a single file.
•
Set up Site Designations that are characterized by a File Name, a Site Name, and a Site number which
correlates with the Site name. These lists allow the logging of data from more than one site to the
same file.
•
Easily view data on the 650 display that has been stored to either sonde or 650 memory.
•
Easily upload data that has been stored in either sonde or 650 memory to a PC for analysis using
EcoWatch for Windows software from YSI.
3.5.4.2 SUMMARY OF 650 LOGGING LIMITATIONS
WITH A 650/YSI SONDE SYSTEM, THE USER CANNOT:
•
Log GPS and/or barometer data to sonde memory.
•
Log GPS and/or barometer to 650 memory without a sonde attached and the 650 in Run mode. See
Sections 3.8.2 and 3.9.4 below.
•
Log data to existing files in 650 memory if the data format does not EXACTLY match that of the data
already in the file. Typical examples of this type of “file mismatch” include:
•
Attempting to append existing data files after changing the parameter list.
•
Attempting to append existing data containing a Site Number to a file that contains data
without Site numbers.
•
Attempting to append existing data containing NO site number to a file that contains data with
Site numbers.
•
Attempting to append existing files containing GPS and/or barometer data after deactivating
the storage of these parameters in Logging setup.
YSI, Incorporated
Drinking Water Monitoring Systems Operations Manual
3-45
650 MDS
Section 3
•
Delete individual files from 650 or sonde memory. The memory is “flash” and therefore all files must
be deleted in order to regenerate the storage capacity.
•
Enter more than 8 characters for a File name or more than 13 characters for a Site name.
3.6 MANAGING 650 FILES
3.6.1 INTRODUCTION
This section deals with the management of data that have been placed in 650 memory either through direct
logging from your sonde or from the upload of data stored in sonde memory. A “file” by definition contains
data and is distinct from the Site Designations in a Site list that are used to configure actual data files. For
example, deleting an entry from the site list after points have been logged under this designation will have no
effect on the actual logged data, i.e., the file itself will still be present in 650 memory. Conversely, deleting
data files from the 650 memory will not delete the Site Designations from the Site list. The management of
data stored in the 650 is controlled from the 650 File command; the management of the list of file/site
designations is controlled from the Edit site list command in the 650 Logging setup menu as described in
Section 3.5.3.4 above. Understanding this distinction will help the user avoid confusion in file and site list
management.
It is also important to remember that, as described in Section 3.2.2 above, the memory of the 650 is “flash”
and that, while this type of memory has many advantages, its use does impose two limitations on file
management.
1.
The files are listed in the order that they are logged to memory and this order cannot be changed.
2.
It is not possible to delete individual files to free up memory. The only way to regenerate the 650
memory is to delete ALL files present, i.e., format the flash.
To proceed with the details of 650 File management, turn the instrument on, highlight the File entry in the 650
Main menu, and press Enter to display the File commands as shown below.
YSI, Incorporated
Drinking Water Monitoring Systems Operations Manual
3-46
650 MDS
Section 3
3.6.2 DIRECTORY
Use the arrow keys to highlight the Directory selection in the 650 File menu and press Enter to display the
list of files resident in the 650 memory.
Note that the size of the file is shown in two different ways: (1) the number of samples (logged data points of
several parameters) and (2) the total number of bytes of memory occupied by the file. Highlight the top file
(PROFILE1) and press Enter to generate a display of the details of this file. Press Escape and then highlight
the second file (DEPLOY1) and press Enter to again display information about the file.
For both files, the file name, site name, file size and time of the first and last samples logged are shown. The
information under Interval will identify whether the data were logged by manual control of the system
(Discrete) or to the memory of a sonde set up in an Unattended sampling study. Only for Unattended
sampling studies will the actual sample interval be displayed. When the Interval has the designation
“Discrete”, the time between samples can be determined by viewing the data as described below.
YSI, Incorporated
Drinking Water Monitoring Systems Operations Manual
3-47
650 MDS
3.6.3
Section 3
UPLOAD TO PC
This frequently used command is used to transfer data files resident in the 650 memory (either logged directly
or uploaded from sonde memory) to a PC that is running YSI EcoWatch for Windows software. Once
transferred, the data can be custom configured, plotted, and reported in tabular form using this software
package. The data can also be exported from EcoWatch in spreadsheet compatible form if the user prefers
this method of data analysis and management. In order to carry out the upload of data files to your PC, you
must first connect the 650 to a serial port of your computer via the 655174 PC Interface cable as shown in the
following diagram:
650
655174 PC Interface Cable
Computer with
EcoWatch for
Windows Installed
DE-9
PC
PC Serial
port
Serial
Port
(DE-9)
After the connection is made, run EcoWatch for Windows, click on the sonde icon in the upper toolbar, and
set the Comm port number to match your interface. After this setup procedure, the following screen will be
present on your PC monitor:
YSI, Incorporated
Drinking Water Monitoring Systems Operations Manual
3-48
650 MDS
Section 3
To transfer data from the 650 to your PC, highlight the Upload to PC selection in the 650 File menu and press
Enter to view a list of the files. Highlight the file that you wish to transfer and press Enter. The 650 and PC
displays will show the progress of the file transfer until completion.
Note that there are three file types (with different extensions) in the above directory: (1) Files with .dat
extensions which are data files logged to either sonde memory of 650 memory and which are in YSI PC6000
format; (2) Files with a .txt extension which are data files logged to sonde memory and then transferred to 650
memory in either ASCII or CDF format; and (3) Files with a .glp extension which are calibration records of
either the sonde sensors or the 650 barometer. For files with a .dat or .txt extension, transfer to a PC using the
Upload to PC command will proceed automatically and retain the file type that is present in 650 memory.
For files with a .glp extension, an additional screen will appear on activating the transfer that gives a choice of
binary, CDF, or ASCII for moving the file to the computer. You currently MUST use either the CDF or
ASCII format for transfer so that the .glp file can be viewed in NotePad or other word processing program.
The binary transfer option is for future YSI upgrades.
After transfer the file will be located in the C:\ECOWWIN\DATA subdirectory of your PC hard drive.
3.6.4 VIEW FILE
The View file selection in the 650 File menu allows the user to examine the data in files logged or uploaded to
650 memory. Highlight the View file selection and press Enter to display a list of files present. Then
highlight the file of interest and press Enter to view the data on the 650 display.
YSI, Incorporated
Drinking Water Monitoring Systems Operations Manual
3-49
650 MDS
Section 3
Use the arrow keys to scroll vertically to view more data points with regard to time or horizontally to view
more sensor data within a particular data entry. The vertical and horizontal scroll bars identify your location
within the data file.
3.6.5 FILE MEMORY
The File memory selection in the 650 File menu allows the user to get a complete picture of how the
memory of the instrument is presently allocated. To view details of the allocation, highlight File memory and
press Enter to display the following screen.
The key number in the File bytes used display is the Free memory listing which can be used to determine
when you need to format the 650 memory (“Delete all files” as described in the next section). The value
under Total memory will reflect whether you purchased a 650 with high or low memory. The top three items
in the display summarize the allocation of the used memory space. In the example above, 6400 bytes are used
in defining the memory directory, 512 bytes are taken up with accessible files, and 0 bytes are taken up in
“deleted” files. As described in Section 3.2.2 above, “deleted” files arise when the same file is uploaded from
a sonde several times with the file “overwritten”.
There is a lot of information on the File memory display, but the number of greatest importance is the Free
memory value.
3.6.6 DELETE ALL FILES
Use this selection to remove all files from the 650 memory. Remember that you cannot delete individual files
from flash memory. Highlight the selection and press Enter. Use the arrow keys to confirm that you really
want to delete all files and press Enter.
CAUTION: When you use this command, all data currently stored in the 650 memory will be irretrievably
lost, so make certain that you have transferred all files of interest to your PC before carrying out the
procedure. Note, however, that use of the Delete all files command will have no effect on any Site
Designations which have been entered from the Edit site list selection.
YSI, Incorporated
Drinking Water Monitoring Systems Operations Manual
3-50
650 MDS
Section 3
3.7 UPLOADING DATA FROM SONDES
3.7.1 INTRODUCTION
A primary function of the 650 is to serve as an intermediate location for transfer of data stored in deployed 6series sondes to a PC without bringing the sondes back to the base facility. In this application, the user
connects the 650 to the sonde at the deployment site via a standard YSI field cable and, using the proper
keypad commands, transfers the data stored in the sonde to the memory of the 650. The sonde is then
redeployed without disturbing the study and the data transferred to a PC on return to the base facility.
3.7.2 UPLOAD PROCEDURE
After attachment of the sonde to the 650 with a YSI field cable, turn on the 650, highlight the Sonde menu
selection and press Enter to display the Main sonde menu. Highlight the File selection and press Enter.
NOTE: The upload MUST be made from the File menu of the sonde, not the File menu of the 650.
Select the Upload or Quick upload (last file) and press Enter. Then follow the instructions including
selection of file format – YSI recommends the PC6000 format. Press Enter and the display will indicate that
upload of data from sonde to 650 is in progress as shown below. When the upload is complete, the display
will return to the Sonde File menu.
After the sonde file has been uploaded to the 650, the data is resident in the flash memory of both sonde and
650. Note that, if you choose to upload files from the sonde in CDF or ASCII format, the files will be
characterized by a .txt extension in the 650 Directory and will NOT be viewable on the 650 display. To view
the files, you must first transfer them from the 650 to your PC and then open them in a spreadsheet.
3.8 USING GPS WITH THE 650
3.8.1 SETTING UP THE GPS-650 INTERFACE
The 650 allows the user to display GPS readings of latitude and longitude from a commercially-available,
user-supplied unit in the Status Bar of the 650 display. The interface of the GPS unit to the 650 is
YSI, Incorporated
Drinking Water Monitoring Systems Operations Manual
3-51
650 MDS
Section 3
accomplished via the 6115 GPS cable that can be purchased as an optional accessory. Using the 6115 cable,
GPS readings can also be logged to the 650 memory along with sonde sensor readings taken at a particular
geographical location, which can then be relocated for subsequent studies.
The use of the GPS interface is easy, but the user must configure the hardware and software of the GPS unit as
follows before proceeding:
•
•
Consult the user manual of the GPS unit and configure the instrument so that readings in the NMEA 0183
protocol are generated.
Purchase from your GPS manufacturer a cable that connects at one end to the GPS unit and has at its
other end a male DE-9 connector for interface with the YSI 6115 GPS cable.
Once these requirements are met, proceed according to the following instructions, consulting Figure 2 in
Section 3.2.3 above for assistance:
•
•
•
•
Connect the 6115 GPS cable to the 650 via the MS-8 connector.
Connect the other MS-8 connector of the 6115 GPS cable to the MS-8 connector or your sonde cable.
Attach the male DE-9 connector of the 6115 GPS cable to the mating female connector of your GPS unit.
Turn on the 650 and make certain that appropriate GPS readings are displayed in the upper left corner of
the Status Bar as shown in the following display.
3.8.2 LOGGING GPS READINGS
To log latitude and longitude readings from a user-supplied GPS unit, the following conditions must be
met:
•
GPS readings can ONLY be logged to 650 memory – the system does NOT support logging to sonde
memory.
•
The GPS readings must be logged to 650 memory from the 650 Run display along with sonde sensor
readings. This means that you must have a sonde attached to your 650 via the 6115 cable in order to
log GPS readings. Logging of GPS readings is not supported without sonde attachment even though
these readings can be viewed in the Status Bar with no sonde attached.
•
If your want to log the GPS readings to 650 memory along with sonde sensor readings at a particular
location, you must make certain that the Store Lat and Long option is active in the Logging setup
menu of the 650.
YSI, Incorporated
Drinking Water Monitoring Systems Operations Manual
3-52
650 MDS
Section 3
Once these conditions are met, follow the instructions in Section 3.5.3 above for logging of sonde sensor
readings to 650 memory. The GPS readings will automatically be added to the file at the sample interval
selected for the sonde readings.
GPS readings stored in 650 memory will remain as part of the sensor data file that can be viewed from the
650 display and/or uploaded with the data file for analysis in EcoWatch for Windows. Latitude and
longitude are, however, displayed somewhat differently by the 650 and EcoWatch as noted below:
•
For both display formats, the GPS are indexed relative to the point where the Greenwich Mean Time
line crosses the equator.
•
For the 650 Status Bar, readings are displayed in degrees and then decimal minutes relative to this
point with actual “N” (north), “S” (south), “E” (east) and “W” (west) designations relative to the index
point.
•
When analyzing data in EcoWatch, the user will have the choice of two formats, decimal degrees (e.g.,
47.5400 degrees) or degrees/decimal minutes (e.g., 47 o 32.400’). For EcoWatch, alpha directional
characters (“N”, “S”, “E”, and “W”) are NOT used. Instead, points north and east of the index point
are designated as positive, while points south and west are designated as negative.
These criteria mean that the GPS coordinates of Yellow Springs, Ohio, USA are approximately 39 o 47.33’
latitude and -83 o54.13’ longitude as read in EcoWatch, but N 39 o 47.33’ W 83 o 54.13’ as displayed by the
650.
3.9 USING THE 650 BAROMETER
3.9.1 PRINCIPLES OF OPERATION
The optional barometer operates on the strain-gauge principle and is located on the internal PCB of the 650.
To make certain that the barometer is sensing true atmospheric pressure under conditions of temperature and
pressure changes, the interior of the case is vented to the atmosphere with patches of material which are
permeable to air, but impermeable to water. One of these patches is located in the rear section of the case and
the other is attached to the battery lid. The patch on the case rear is not accessible to the user, but the one on
the battery lid can be damaged by abuse. Be certain to identify the location of the patch on the interior of the
battery lid and take care not to puncture it with sharp objects or to peel it away from the plastic. If you suspect
that the venting patch on your battery lid has been damaged, make certain that you do not expose the 650 to
water (either spraying or submersion). Then contact YSI Customer Service as soon as possible for advice.
The 650 barometer reads true barometric pressure and therefore is unlikely to agree with values from your
local weather service which are usually corrected to sea level before being distributed. Note, however, that
the primary purpose of the barometer is for use in calibrating your sonde dissolved oxygen sensor and the
“true” value as shown in the 650 Status Bar is the required parameter for this procedure.
3.9.2 CALIBRATING THE BAROMETER
The 650 barometer is factory calibrated to provide accurate readings in the 500-800 mm Hg range which will
be useful for dissolved oxygen calibration at most locations. This factory calibration should provide readings
that are useful for dissolved oxygen calibration for many months with no user attention. However, if the user
wishes to either increase the accuracy of the sensor in the local barometric pressure range or to compensate for
YSI, Incorporated
Drinking Water Monitoring Systems Operations Manual
3-53
650 MDS
Section 3
the small drift associated with any sensor, the 650 provides a single point calibration routine which is accessed
in the 650 System setup menu and is described in Section 3.3.5 above.
The critical factor in carrying out the single point calibration is the accuracy of the “standard” barometer that
is used to determine the true barometric pressure. Common sources of this “standard” reading are high
quality laboratory barometers (either mercury-based or electronic) and data from your local weather service.
Laboratory barometer readings are usually “true” (uncorrected) values of air pressure and can be used “as is”
for a standard as long as the system is known to be accurate. Weather service readings are usually not “true”,
i.e., they are corrected to sea level, and therefore cannot be used until they are “uncorrected”. An
approximate formula for this “uncorrection” (where the BP readings MUST be in mm Hg) is:
True BP = [Corrected BP] – [2.5 * (Local Altitude/100)]
Overall, the key point to remember in calibration of your barometer is to make certain that your “standard”
reading is correct. If the “standard” is not accurate, you are likely to do more harm than good with your usercalibration.
3.9.3 CHANGING BAROMETER UNITS
The 650 offers the user a choice of six commonly used units of barometric pressure which can be displayed
in the Status Bar. When received from the factory, the 650 will show values in mm Hg. If the user wants
to change to other units, the selection is found in the 650 System setup menu as shown below. Highlight
the selection and press Enter to show the possible units. Then highlight the unit of choice and press Enter
to activate it. The barometer reading in the Status Bar will automatically change to the newly selected unit.
3.9.4 LOGGING BAROMETER READINGS
To log barometric pressure readings with the 650, the following conditions (similar to those above for
logging GPS readings) must be met:
•
Barometer readings can ONLY be logged to 650 memory – the system does NOT support logging to
sonde memory.
•
The barometer readings must be logged to 650 memory from the 650 Run display along with sonde
sensor readings. This means that you must have a sonde attached to your 650 in order to log barometer
readings. Logging of barometer readings is not supported without sonde attachment even though these
readings can be viewed in the Status Bar with no sonde attached.
•
If your want to log barometer readings to 650 memory, you must make certain that the Store
Barometer option is active in the Logging setup menu of the 650.
YSI, Incorporated
Drinking Water Monitoring Systems Operations Manual
3-54
650 MDS
Section 3
Once these conditions are met, follow the instructions in Section 3.5.3 above for logging of sonde sensor
readings to 650 memory. The barometer readings will automatically be added to the file at the sample interval
selected for the sonde readings.
Barometer readings stored in 650 memory will remain as part of the sensor data file that can be viewed
from the 650 display and/or uploaded with the data file for analysis in EcoWatch for Windows. The
barometric pressure readings are processed as a normal parameter by EcoWatch, with the user having the
ability to change units from the EcoWatch menus. For example, data stored in 650 memory in units of mm
Hg units can easily be converted to readings in mBar after upload.
3.10 UPGRADING 650 SOFTWARE
The 650 software can easily be upgraded from the YSI World Wide Web page (www.ysi.com). However,
before accessing the Web page, the instrument should be prepared for upgrade by attaching the MS-8 end of
the YSI 655174 PC Interface cable to the 650 and the DE-9 end of the 655174 to a serial port of a PC which
has Internet access as shown below:
650
655174 PC Interface
Cable
Computer
with Internet
Access
DE-9 Serial
Port
Once the setup is complete, access the YSI Web Page and locate the section on software upgrades. Select
the 650 upgrade entry and follow the instructions provided on the Web Page. If you encounter difficulties
in the upgrade procedure, contact YSI Customer Service for advice.
YSI, Incorporated
Drinking Water Monitoring Systems Operations Manual
3-55
650 MDS
Section 3
3.11 TROUBLESHOOTING
The following sections describes problems which you might encounter when using the 650 MDS and provides
suggestions which might allow the user to overcome the symptom without additional assistance.
PROBLEM
No display is visible after pressing the on/off key.
No interaction with the sonde occurs when pressing
Sonde run or Sonde menu from the 650 menu.
Instrument software appears to be locked up as
evidenced by no response to keypad entries or
display not changing.
Upload of files to 650 from sonde fails.
Upload of files from 650 to PC fails
GPS and/or barometer data is not stored with sonde
data file.
Site Designations in the Site List are “grayed-out”
and not available for appending files with additional
data. A “Parameter Mismatch” screen is displayed.
GPS data is not shown in Status Bar.
The 650 display flashes and the instrument speaker
makes a continuous clicking sound.
The sonde/650 resets when optical wipers are
activated in the sonde.
POSSIBLE SOLUTION
If C cells are used, make certain that they are
installed properly with regard to polarity and that
good batteries are used. If a rechargeable battery
pack is used, place the pack in the instrument and
charge for 30 minutes.
Make certain that (a) the cable is connected properly
between sonde and 650 and (b) that Sonde power is
activated in the 650 System setup menu.
First, attempt to reset the instrument by simply
turning off and then on again. If this fails, remove
battery power from the instrument for 30 seconds and
then reapply power. When using C cells, remove the
battery lid and one of the batteries; when using the
rechargeable battery pack, remove the pack
completely from the instrument. After 30 seconds
replace the battery or battery pack and check for
instrument function.
(1) Make sure that cable is connected properly to
both 650 and sonde; (2) Make certain that you are
accessing the upload routine from the sonde File
menu and NOT from the 650 File menu.
1) Make sure that cable is connected properly to both
650 and PC; (2) Make certain that the proper Comm
port is selected in EcoWatch for Windows.
Make sure Store barometer and Store Lat and
Long are active in 650 Logging setup menu.
There is a parameter mismatch between the current
650 setup and that initially used. Use 650 File view
and the Parameter Mismatch screen to determine the
sonde parameter, barometer, and GPS format of file
already present in memory and readjust the setup to
match that initially used.
Make sure that (a) the cables are attached properly;
(b) that the GPS unit is configured for NMEA 0183
format; (c) that the GPS unit is “locked in” and that
the GPS unit display is showing proper readings.
The battery voltage is low. Change to new C cells or
recharge the 6117 battery pack.
The battery voltage is low. Change to new C cells or
recharge the 6117 battery pack.
If these guidelines and tips fail to correct your problem or if any other symptoms occur, contact YSI Customer
Service for Advice. See Section 8 of the 6-series manual for contact information.
YSI, Incorporated
Drinking Water Monitoring Systems Operations Manual
3-56
650 MDS
Section 3
3.12 FERRITE BEAD INSTALLATION
WARNING: If you are using your 650 in a European Community (CE) country or in Australia or New
Zealand, you must attach a ferrite bead to the 655174 PC Interface Cable and the 6116 Charger Adapter Cable
in order to comply with the Residential, Commercial and Light Industrial Class B Limits for radio-frequency
emissions specified in EN55011 (CISPR11) for Industrial, Scientific and Medical laboratory equipment.
These ferrite assemblies are supplied as part of cable kits.
To install the beads, follow these steps:
•
Make a small loop (approximately 5 cm in diameter) in the cable near the 650 MS-8 connector.
•
Lay the open ferrite bead assembly under the loop with the cable cross-over position within the cylinder
of the ferrite bead. See the drawing below for assistance.
•
Snap the two pieces of the bead together making certain that the tabs lock securely.
When the installation is complete, the 655174 and 6116 cables should resemble the following schematic
drawings.
YSI, Incorporated
Drinking Water Monitoring Systems Operations Manual
3-57
650 MDS
Section 3
3.13 650 SAFETY CONSIDERATIONS
IMPORTANT SAFETY INSTRUCTIONS!
SAVE THESE INSTRUCTIONS!
In essence, the most important safety rule for use of the 650 is to utilize the instrument ONLY for
purposes documented in this manual. This is particularly true of the 6117 rechargeable battery pack that
contains nickel metal hydride (NiMH) batteries. The 650 user should be certain to read all of the safety
precautions outlined below before using the instrument.
6113 Rechargeable Battery Pack Safety Information
Restrictions on Usage
1.
Never dispose of the battery pack in a fire.
2.
Do not attempt to disassemble the 6117 battery pack.
3.
Do not tamper with any of the electronic components or the batteries within the battery pack.
Tampering with either the electronic circuitry or the batteries will result in the voiding of the warranty
and the compromising of the system performance, but, more importantly, can cause safety hazards
which result from overcharging such as overheating, venting of gas, and loss of corrosive electrolyte.
4.
Do not charge the battery pack outside the 0-40 C temperature range.
5.
Do not use or store the battery at high temperature, such as in strong direct sunlight, in cars during hot
weather, or directly in front of heaters.
6.
Do not expose the battery pack to water or allow the terminals to become damp.
7.
Avoid striking or dropping the battery pack. If the pack appears to have sustained damage from these
actions or malfunctions after an impact or drop, the user should not attempt to repair the unit. Instead,
contact YSI Customer Service.
8.
If the battery pack is removed from the 650, do not store it in pockets or packaging where metallic
objects such as keys can short between the positive and negative terminals.
Precautions for Users with Small Children
Keep the battery pack out of reach of babies and small children.
YSI, Incorporated
Drinking Water Monitoring Systems Operations Manual
3-58
650 MDS
Section 3
Danger Notifications – Misuse creates a STRONG possibility of
death or serious injury.
FAILURE TO CAREFULLY OBSERVE THE FOLLOWING PROCEDURES AND
PRECAUTIONS CAN RESULT IN LEAKAGE OF BATTERY FLUID, HEAT GENERATION,
BURSTING, AND SERIOUS PERSONAL INJURY.
1.
Never dispose of the battery pack in a fire or heat it.
2.
Never allow the positive and negative terminals of the battery pack to become shorted or connected
with electrically conductive materials. When the battery pack has been removed from the 650, store it
in a heavy plastic bag to prevent accidental shorting of the terminals.
3.
Never disassemble the battery pack and do not tamper with any of the electronic components or the
batteries within the battery pack. The battery pack is equipped with a variety of safety features.
Accidental deactivation of any of these safety features can cause a serious hazard to the user.
4.
The NiMH batteries in the battery pack contain a strong alkaline solution (electrolyte). The alkaline
solution is extremely corrosive and will cause damage to skin or other tissues. If any fluid from the
battery pack comes in contact with a user’s eyes, immediately flush with clean water and consult a
physician immediately. The alkaline solution can damage eyes and lead to permanent loss of eyesight.
Warning Notifications – Misuse creates a possibility of death or
serious injury
1.
Do not allow the battery pack to contact freshwater, seawater, or other oxidizing reagents that might
cause rust and result in heat generation. If a battery becomes rusted, the gas release vent may no
longer operate and this failure can result in bursting.
2.
If electrolyte from the battery pack contacts the skin or clothing, thoroughly wash the area immediately
with clean water. The battery fluid can irritate the skin.
Caution Notifications – Misuse creates a possibility of mild or serious
injury or damage to the equipment.
1.
Do not strike or drop the battery pack. If any impact damage to the battery pack is suspected, contact
YSI Customer Service.
2.
Store the battery pack out of reach of babies and small children.
3.
Store the battery pack between the temperatures of –20 and 30 C.
4.
Before using the battery pack, be sure to read the operation manual and all precautions carefully. Then
store this information carefully to use as a reference when the need arises.
YSI, Incorporated
Drinking Water Monitoring Systems Operations Manual
3-59
650 MDS
Section 3
616 Cigarette Lighter Charger Safety Information
1.
This section contains important safety and operating instructions for the 650 cigarette lighter battery
charger (YSI Model 616; RadioShack Number 270-1533E). BE SURE TO SAVE THESE
INSTRUCTIONS.
2.
Before using the 616 cigarette lighter charger, read all instructions and cautionary markings on battery
charger, battery pack, and Model 650.
3.
Charge the 6117 battery pack with the 616 cigarette lighter charger ONLY when the 6117 is installed
in the YSI 650.
4.
Do not expose charger to rain, moisture, or snow.
5.
Use of an attachment not recommended or sold by the battery charger manufacturer may result in a
risk of fire, electric shock, or injury to persons.
6.
To reduce risk of damage to cigarette lighter and cord, pull by cigarette lighter rather than cord when
disconnecting charger.
7.
Make sure that the cord is located so that it will not be stepped on, tripped over, or otherwise subjected
to damage or stress.
8.
Do not operate charger with damaged cord or cigarette lighter connector – replace it immediately.
9.
Do not operate charger if it has received a sharp blow, been dropped, or otherwise damaged in any
way; contact YSI Customer Service.
10. Do not disassemble charger other than to change the fuse as instructed. Replace the part or send it to
YSI Product Service if repair is required. Incorrect reassembly may result in a risk of electric shock or
fire.
11. To reduce risk of electric shock, unplug charger before attempting any maintenance or cleaning.
Turning off controls will not reduce this risk.
650 Water Leakage Safety Information
The 650 has been tested and shown to comply with IP67 criterion, i.e. submersion in 1 meter of water for
30 minutes with no leakage into either the battery compartment or the main case. However, if the
instrument is submersed for periods of time in excess of 30 minutes, leakage may occur with subsequent
damage to the batteries, the rechargeable battery pack circuitry, and/or the electronics in the main case.
If leakage into the battery compartment is observed when using alkaline C cells, remove batteries, dispose
of batteries properly, and dry the battery compartment completely, ideally using compressed air. If
corrosion is present on the battery terminals, contact YSI Customer Service for instructions.
If leakage into the battery compartment is observed when using the 6117 rechargeable battery pack,
remove the battery assembly and set aside to dry. Return the battery pack to YSI Product Service for
YSI, Incorporated
Drinking Water Monitoring Systems Operations Manual
3-60
650 MDS
Section 3
evaluation of possible damage. Finally dry the battery compartment completely, ideally using compressed
air. If corrosion is present on the battery terminals, contact YSI Customer Service for instructions.
CAUTION: If water has contacted the rechargeable battery pack, do not attempt to reuse it until it has
been evaluated by YSI Product Service. Failure to follow this precaution can result in serious injury to the
user.
If it is suspected that leakage into the main cavity of the case has occurred, remove the batteries
immediately and return the instrument to YSI Product Service for damage assessment.
CAUTION: Under no circumstances should the user attempt to open the main case.
3.14 650 MDS SPECIFICATIONS
Resistance to Water Leakage: IP 67 for both the standard alkaline battery configuration and for the
rechargeable battery pack option.
Operating Temperature Range for Visible Display: -10 to 60 Degrees Celsius
Storage Temperature Range: -20 to 70 Degrees Celsius
Dimensions: 9.13 inches long by 4.75 inches wide by 2.25 inches deep
Weight with 4 Alkaline C cells and no attached sonde or cable: Approximately 2.1 lbs.
(960 g).
Display: ¼ VGA; LCD with 320 by 240 pixels with backlight
Connector: MS-8; Meets IP 67 specification
Standard Battery Configuration:
4 Alkaline C Cells with detached battery cover
Optional Battery Configuration:
Nickel Metal Hydride Battery Pack with attached battery cover and 110 volt charger
Battery Life:
Approximate battery life for typical sampling applications with 4 alkaline C cells – 3 hours of
“on” time per day for 0.5 month (10 working days) with the meter powering a 6600 sonde with all
probes active.
Approximate battery life for typical sampling applications with rechargeable battery pack – 3
hours of “on” time per day for 0.2 months (4 working days) with the meter powering a 6600 sonde
with all probes active. Battery capacity restored completely with a 6-hour charge and charged to
approximately 85 % with a 2-hour charge.
YSI, Incorporated
Drinking Water Monitoring Systems Operations Manual
3-61
650 MDS
Section 3
Barometer:
Range: 500 to 800 mm Hg
Resolution: 0.1 mm Hg
Accuracy: +/- 3 mm Hg within +/- 15 C of the calibration temperature
Communication Protocol:
RS-232 to all sondes and for data transfer to PC and for software updates
GPS via Y-cable – NMEA 0183
Standard Backlight Feature: 4 LEDs illuminating LCD
Keyboard: 20 keys including Meter On/Off, Backlight On/Off, Enter, Escape, 10 Number/Letter Entry
Keys, 2 Vertical arrow keys, 2 Horizontal arrow keys, 1 minus/hyphen entry key, 1 decimal point/period
YSI, Incorporated
Drinking Water Monitoring Systems Operations Manual
3-62
EcoWatch for Windows
Section 4
SECTION 4 ECOWATCH FOR WINDOWS
4.1
INTRODUCTION
EcoWatch for Windows is intended to be the PC software interface to YSI’s 6-Series environmental
monitoring systems equipment. From EcoWatch you can program field equipment, upload data collected
on the equipment, and format the data in easy to understand graphs and tables.
4.1.2
GLOSSARY
These are a few of the more commonly used terms used in EcoWatch.
4 - Graph
1 - Data Display Window
2 - Parameter
6 - Page
3Trace
5 - Table
Term
Definition
1 - Data display window
The window that appears when you open a .DAT file.
2 - Parameter
A measurement such as temperature, dissolved oxygen, pH,
etc. On a graph, the data of a parameter is displayed as a
trace.
3 - Trace
The plot of the data of any one parameter. There may be one
or two traces per graph.
4 - Graph
There may be one or more graphs depending upon how many
parameters are selected. Each graph may have one or two
traces. Data can be displayed either in graphs or in a table, or
both.
5 - Table
Numbers arranged in rows and columns. Data can be
displayed either in graphs or in a table, or both.
YSI Incorporated
Drinking Water Monitoring Systems Operation Manual
4-1
EcoWatch for Windows
Section 4
6 - Page
The Data Display Window can be divided in two pages, a
graph page and a table page. A page becomes active when you
click on it.
7 - Terminal window
This is the window that is open to display the sonde’s internal
menu. Allows the user to interact with the sonde or
display/logger. The terminal window is a communication
interface with another piece of equipment, whereas the Data
Display Window is direct interaction with the EcoWatch
software.
8 - Dialog box
A dialog box opens to display choices. Such as File Open.
9 – PC6000 data file
A data file that is in a format compatible with EcoWatch for
Windows or PC6000 software.
9 – Study
A single data file in PC6000 format.
4.1.3
TUTORIAL
This brief EcoWatch tutorial is to be used with the sample data file that is provided with EcoWatch.
YSI Incorporated
Drinking Water Monitoring Systems Operation Manual
4-2
EcoWatch for Windows
Section 4
EcoWatch starts without an open data file (or .DAT file). When a data file is not open, a shortened menu
bar is visible and many of the tools in the toolbar appear dimmed. Opening a data file will better
demonstrate the capabilities of EcoWatch software.
To open the sample data file:
button in the toolbar.
1. Click the File menu
2. Select the SAMPLE.DAT file.
3. Click OK to open the file.
Note that the data in this file appears as a graph of temperature, specific conductance, dissolved oxygen,
pH, ORP, and depth, all versus time. The graphs are scaled automatically so that all data fits comfortably
on the computer screen.
and Graph
buttons on the toolbar are on/off switches that are used to display or hide
The Table
the graph and table pages respectively. When displaying a graph and a table at the same time, you can
control the relative size of the two pages by placing the cursor over the small bar that separates them and
then dragging it to the desired location.
From the Setup menu, click Graph. Click 2 Traces per Graph and notice that the parameters are now
graphed in pairs. Click 1 Trace per Graph to return the display to the original setting.
Move the cursor to any position in the graph, then click and hold the right mouse button. Note that the
exact measurements for this point in time are displayed to the left of the graph. While holding down the
right mouse button, move to another area on the graph. Notice how the measurements change as you move.
When you release the mouse button, the display returns to normal.
button on the toolbar. On the
To view statistical information for the study, click the Statistics
statistics window, click on any min or max value to display the time when it occurred. Double-click in the
upper left of the Statistics window to return to the normal display.
End the tutorial by saving the Data Display in the format shown. To do this:
1. From the File menu, click Save Data Display.
2. Type Default for the file name when prompted for the Data Display Name.
3. Click Save.
The parameters, colors, format, and x-axis time interval associated with the current display are now saved
and can be accessed any time in the future. Nine different data displays may be saved for any data file.
You can easily switch between various displays of the data.
This demonstration shows only a small part of the capability of EcoWatch. You may wish to also review
the procedures involved in the Section 4.1.5, Typical Application.
4.1.4
USING THE TOOLBAR
The EcoWatch toolbar includes buttons for some of the most common commands in EcoWatch, such as
File Open. To display or hide the toolbar, open the View menu and click on the Toolbar command. A
check mark appears next to the menu item when the toolbar is displayed.
The toolbar is displayed across the top of the application window, below the menu bar.
Click
To:
YSI Incorporated
Drinking Water Monitoring Systems Operation Manual
4-3
EcoWatch for Windows
Section 4
Open an existing data file (.DAT). EcoWatch displays the Open dialog box, in which you can
locate and open the desired file.
Save the working Data Display of the active data file. EcoWatch displays the Save Data Display
dialog box in which you can overwrite existing Data Display or save to a new one.
Export data as a graph in Window Meta File (.WMF) format or as data in Comma Delimited
(.CDF) format.
Copy the whole graph page or data from the selection on the table to the clipboard.
Print the active graph page or table page depending on which one is currently active.
Open a new terminal window to communicate with the sonde.
Access context sensitive help (Shift+F1).
Toggle table window during file processing.
Toggle graph window during file processing.
Display study statistics.
Display study info.
Limit the data to be processed in a study.
Enlarge a selective portion of graph.
Center the graph under the cursor.
Enlarge graph or table 20%.
Reduce graph or table 20%.
Return graph or table to its normal state (unzoom)
Redraw the graph.
YSI Incorporated
Drinking Water Monitoring Systems Operation Manual
4-4
EcoWatch for Windows
4.1.5
Section 4
TYPICAL APPLICATION
Suppose you want to measure Dissolved Oxygen, pH, Temperature, and Turbidity in a nearby stream and
decide to start with a 30-day deployment using the YSI 6920 sonde. The task can be organized into several
steps:
1. Calibrate and setup the sonde.
First connect your sonde to one of the serial communications ports on your PC. In the Comm menu, click
Sonde and you will get a terminal window where you can calibrate the sonde and set it up for logging. You
are now communicating directly with the sonde software. See Section 2.6, Calibration for more detailed
instructions on calibration of sensors. See Section 2.5, Sonde Software Setup for sonde setup.
2. Deploy the Sonde
For more details, see Section 2, Sondes and Section 3, Displays/Loggers.
3. Retrieve the Sonde and Upload the Data
After retrieving the sonde, connect it to your PC and upload the data. As with calibration and setup, you
can use the Sonde
button in EcoWatch to communicate with the sonde. Using the sonde menu, upload
the data to EcoWatch. The data will now be in a .DAT file on your PC.
4. Graph the Data and Adjust the Graphs to Your Liking
Open the newly uploaded .DAT file. In this example, the file is called JONES2.DAT. Upon opening the
file it looks like the graphic at the end of this tutorial. You can then use the commands in the Graph menu
to Zoom to the portion of the graph that you are most interested in. You can use the Setup menu to add a
title or change colors, scale the graphs or select the parameters to be shown.
YSI Incorporated
Drinking Water Monitoring Systems Operation Manual
4-5
EcoWatch for Windows
Section 4
5. Print Your Graph
To print the graph, open the File menu, choose Print Setup or Print to choose exactly how the print should
look.
YSI Incorporated
Drinking Water Monitoring Systems Operation Manual
4-6
EcoWatch for Windows
Section 4
4.2 DATA ACQUISTION AND ANALYSIS
4.2.1 CONNECT A YSI SONDE OR A 650 DISPLAY/LOGGER
EcoWatch may be used with various sondes or display/loggers. To utilize the configuration that will work
best for your application, make sure that you have all of the components that are necessary.
Sonde to Lab Computer
DB-9
Power Supply*
6037: 220 VAC
6038: 110 VAC
6095B
Adapter
MS-8
Field Cable
You will need...
T
T
T
T
T
+
-
Sonde
YS
I
69
20
* Not required if you use
sonde battery power.
650
Sonde
Field Cable
Computer with Com Port
6095B MS-8/DB-9 Adapter
Power Supply *
650 MDS to Lab Computer
You will need:
655174 PC Interface
Cable
•
•
•
650
YSI 655174
PC interface
cable
PC with
active serial
port
PC Serial port
(DE-9)
YSI Incorporated
Drinking Water Monitoring Systems Operation Manual
4-7
EcoWatch for Windows
Section 4
A sonde or 650 display/logger must be connected to one of the serial communication ports on the back of
your PC. These ports are usually referred to as COM1, COM2, etc. Most computers have at least two
COM ports but they are often not labeled. To identify a COM port, look for unused 9 or 25 pin, D-shaped
connectors with pin contacts.
Some sondes have integral cables and others require a separate cable sold especially for use with the sonde.
Depending on the exact connector on your PC, you may also need a 9 to 25 pin adapter.
There is an PC interface cable for the 650 display/loggers that has a 9 pin D-shaped connector. This
connector must be attached to your computer.
Once physically connected, you are ready to communicate using EcoWatch. Use the Sonde command in
the Comm menu or the sonde button on the toolbar. This will give you a terminal window. From this
window you interact with the sonde software using its menu system, or upload a file from a 650
display/logger. See Section 2, Sondes for details on how to use the sonde software.
4.2.2
UPLOAD A FILE FROM A SONDE
Data that is processed in EcoWatch typically originates in a sonde with batteries and is uploaded to a PC.
To upload data from a YSI sonde, connect the sonde to your PC and open the EcoWatch software. Use the
Sonde button on the toolbar to communicate with the sonde software.
Using the sonde software, go to the Main menu by typing “menu” on the blank terminal screen. Then
choose 3-File Menu. You will most likely be uploading the most recently recorded data. If so, simply
press 3-Quick Upload. Otherwise, press 2 to choose a file to upload. The sonde will ask you to choose a
format for the file. Be sure to choose PC6000 format. After it is uploaded, the data will be in a .DAT file
on your PC. You can then use EcoWatch to view, manipulate and print the data file.
4.2.3
UPLOAD A FILE FROM A 650 DM DISPLAY/LOGGER
To transfer data files resident in the 650 memory (either logged directly or uploaded from sonde memory) to a
PC that is running YSI EcoWatch for Windows software, you must first connect the 650 to a serial port of
your computer via the 655174 PC Interface cable as shown in the diagram above.
After the connection is made, run EcoWatch for Windows, click on the sonde icon in the upper toolbar, and
set the Comm port number to match your interface. After this setup procedure, the following screen will be
present on your PC monitor:
YSI Incorporated
Drinking Water Monitoring Systems Operation Manual
4-8
EcoWatch for Windows
Section 4
To transfer data from the 650 to your PC, highlight the Upload to PC selection in the 650 File menu and press
Enter to view a list of the files. Highlight the file that you wish to transfer and press Enter. The 650 and PC
displays will show the progress of the file transfer until completion.
Note that there are three file types (with different extensions) in the above directory: (1) Files with .dat
extensions which are data files logged to either sonde memory of 650 memory and which are in YSI PC6000
format; (2) Files with a .txt extension which are data files logged to sonde memory and then transferred to 650
memory in either ASCII or CDF format; and (3) Files with a .glp extension which are calibration records of
either the sonde sensors or the 650 barometer. For files with a .dat or .txt extension, transfer to a PC using the
Upload to PC command will proceed automatically and retain the file type that is present in 650 memory.
For files with a .glp extension, an additional screen will appear on activating the transfer that gives a choice of
binary, CDF, or ASCII for moving the file to the computer. You currently MUST use either the CDF or
ASCII format for transfer so that the .glp file can be viewed in NotePad or other word processing program.
The binary transfer option is for future YSI upgrades.
After transfer the file will be located in the C:\ECOWWIN\DATA subdirectory of your PC hard drive.
4.2.4
USING THE GRAPH
Once uploaded, data can be easily displayed in EcoWatch. Open a .DAT file. The six buttons on right side
of the toolbar help you get a closer view of that portion of the graph you desire.
Zoom Window
Use this to select a certain portion of the graph to be displayed. Click the button
and then click and drag on the graph to select the portion you want to view. The
pointer will change to a magnifying glass. The button will stay active until you
click on it again.
Center Scroll
Use this to scroll through the study. Click the button and the pointer will change
to a bullseye. Click anywhere on the graph and that spot will move to the
center.
Limit Data Set
Use this button to reduce the data being processed and speed up operations.
Click the button and move the pointer to the graph. A vertical arrow will appear
with an N on the left and an Y on the right. Bracket the desired portion of the
graph by moving the cursor to the left limit, clicking, moving to the right limit
and clicking again. To limit the data in a table, move the pointer to the far left
of the table into the row numbers area and highlight from the desired cutoff
point to the beginning or end of the data set, whichever is desired. Then select
the Limit Data Set option from the Graph menu or use the toolbar shortcut. To
remove the limits, from the Graph menu choose Cancel Limits. You may also
remove the limits using this button by clicking first on the right and then the left.
YSI Incorporated
Drinking Water Monitoring Systems Operation Manual
4-9
EcoWatch for Windows
Section 4
Unzoom
Use this button to view the study from the beginning limit to the end limit. This
command can be used on both graphs and data tables.
Zoom In
Click this button to magnify by 20%. This command can be used on both graphs
and data tables.
Zoom Out
Click this button to reduce magnification by 20%. This command can be used on
both graphs and data tables.
YSI Incorporated
Drinking Water Monitoring Systems Operation Manual
4-10
EcoWatch for Windows
4.2.5
Section 4
GRAPH DATA IN REAL TIME
Choosing the New command from the Real-time menu will bring up a window with graphs that plot data
from the sonde as the measurements are being taken. If you do not have a default COM port set in the
Communications Settings dialog, then you will be asked which COM port to use for the real-time
measurements. If you do have a default port selected, then the program will use that port automatically.
The number of parameters displayed during real-time is set by the sonde. If four parameters are set in the
Report setup in the sonde, then those same parameters will be displayed in real-time. If you want to change
the parameters displayed, then you must close the real-time window, open a sonde terminal window,
change the number of parameters in the sonde software menu, and then return to real-time measurements.
The Settings command in the Real-time menu takes you to a dialog where you can set the x-axis time and
the sample interval.
YSI Incorporated
Drinking Water Monitoring Systems Operation Manual
4-11
EcoWatch for Windows
Section 4
4.3 ECOWATCH MENU
4.3.1
FILE
The File menu offers the following list of commands. Some commands are available only when a file is
open.
OPEN
Use this to open sonde data file (.DAT).
File Name
Type or select the filename you want to open. This box lists files with the extensions you
select in the List Files of Type box.
List of Files of Type
Select the type of file that you want to open.
*.dat
Sonde binary data file
*.txt, *prn
ASCII text file
*.cdf, .csv, .sdf Comma delimited file
*.rt
Real-time file
*.cr1
CR10 file
Drives
Select the drive where the PC6000 data file resides.
Directories
Select the directory where the PC6000 data file resides.
Network...
Choose this button to connect to a network location, assigning it a new drive letter. This
button is hidden if your computer is not connected to a network. The screen above has the
network button hidden.
YSI Incorporated
Drinking Water Monitoring Systems Operation Manual
4-12
EcoWatch for Windows
Section 4
CLOSE
Use this command to close all windows containing the active document. EcoWatch automatically
saves any changes before the file is closed.
You can also close a document by using the Close icon on the document's window, as shown below:
IMPORT
With this command, you can import common ASCII files into EcoWatch. The file will be converted into
PC6000 format and again with a .DAT extension.
MERGE
This function takes two existing data files and merges them into one new file. Both files must be in PC6000
format (.DAT), have the same number of parameters, and the same parameter types (the parameter setup
must be identical). Data record time-stamps in the destination data file will be stored in ascending order.
YSI Incorporated
Drinking Water Monitoring Systems Operation Manual
4-13
EcoWatch for Windows
Section 4
COPY TO CLIPBOARD
If a graph or table is active, then choosing this command will send its contents to the Windows clipboard so
that it can be pasted into other programs. This is a normal method of transfer data between different
Windows programs.
Shortcuts
Toolbar:
Keys:
YSI Incorporated
CTRL+C
Drinking Water Monitoring Systems Operation Manual
4-14
EcoWatch for Windows
Section 4
SAVE DATA DISPLAY
When opening a data file, you will probably want to look at the data in graph form. You may also want to
rearrange the default graph by selecting or reordering parameters, zooming in to a portion of the graph, or
even changing colors or changing fonts. You may sometimes choose to look at the data or a portion of it in
table form. All of this work is done in the Data Display window.
This command allows you to save the settings and content of the Data Display window so that you can load
it at another time and have it look exactly the same as when you saved it. This saved display is associated
with the data file. Up to 9 data displays can be saved per data file. When you save a display you will be
asked to give it a name in the following dialog box.
There must be an open data file for this command to be available. See also Load Data Display.
Shortcuts
Keys:
CTRL+S
LOAD DATA DISPLAY
This command is only available when a data file is open. If you have previously used the Save Data
Display command for the open data file, then you can load the saved display and have it look exactly the
same as when you saved it. Saved displays are associated with the data file. You can have as many as nine
saved displays for each data file. When loading a display you will be asked to choose from among the
names of saved displays.
YSI Incorporated
Drinking Water Monitoring Systems Operation Manual
4-15
EcoWatch for Windows
Section 4
EXPORT
Use this command to send the current data to a file. Typically, some other program will read the file. You
will see the following dialog box.
You may export the file in either of two forms: a WMF file, or a .CDF file.
WMF stands for Windows MetaFile and is a format that describes any image in a way that is independent
of the program that generated the image. For example, you can generate a graph in EcoWatch, export it as a
.WMF file and then import it into another Windows program.
CDF stands for Comma Delimited, sometimes referred to as a Comma and Quote Delimited File. This
format is commonly used by spreadsheet and database programs. In this type of file, commas separate
YSI Incorporated
Drinking Water Monitoring Systems Operation Manual
4-16
EcoWatch for Windows
Section 4
individual data entries, quotation marks surround any text and no formatting or marking is performed on
numbers. EcoWatch can also open files in CDF formats.
When the exported file is to be imported into a spreadsheet, it is sometimes convenient to reduce the
number of data. Averaging them can easily do this. See Change Parameter Attributes for more
information.
Shortcuts
Toolbar:
REPORT
Use this command to send data or statistics to an ASCII text file. The information is easy to read in this
format. When choosing this command the following dialog box will appear.
¾ You must enter a filename (under File; use the Browse button if needed). If you
want to simply have a report Type listing the data, then click Data. If you want
Statistics (minimum, maximum, average, and standard deviation), then the statistics
frequency button applies.
¾
If you want to have Daily statistics, keep in mind that every day actually starts at midnight. It
would be likely then that the first and last days would have very different statistics because
they would only be partial days. Daily, Weekly and Monthly statistics behave similarly.
¾ When you click OK, EcoWatch will send the report to the specified file and open
Windows Notepad where you can view and/or print the report. Note: Notepad can
only open report files that are 64K or less in size. You can use the Windows
Wordpad to open reports that are larger than 64K. Unless you change it, the report
file will have the same location as your data file (.DAT) and has the same name with
a .RPT file extension.
YSI Incorporated
Drinking Water Monitoring Systems Operation Manual
4-17
EcoWatch for Windows
Section 4
PRINT
Use this command to print a document. If a graph is selected, this command presents a Print
Option dialog box with the options below. When a table is selected, a standard print window is
presented.
Shortcut
Toolbar:
Keys:
CTRL + P
Printer
If you have a color printer, you can choose to print in Color. Otherwise you should
choose Mono (black and white).
Size
If you choose Max size, then the program will size the graph so that it fits on one page.
If you choose Exact size, then program will print the graph as close as possible to the
size that is displayed.
Maintain Aspect Ratio
If you choose to maintain the aspect ratio, then the program will size the graph until
either the height or the width is maximized and then leave the graph in the same height
width ratio that is displayed.
Border
You can also choose whether or not to print a border.
PRINT PREVIEW
This command allows the user to preview how the document will appear when it is printed. This command
only works for data that is displayed in a table format, not when the data is in graph format.
YSI Incorporated
Drinking Water Monitoring Systems Operation Manual
4-18
EcoWatch for Windows
Section 4
PRINT SETUP
Use this command to select a printer and a printer connection. This command presents the Print Setup
dialog box. The following options allow you to select the destination printer and its connection.
Printer
YSI Incorporated
Select the printer you want to use. Choose the Default Printer; or choose the
Specific Printer option and select one of the current installed printers shown in
Drinking Water Monitoring Systems Operation Manual
4-19
EcoWatch for Windows
Orientation
Paper Size
Paper Source
Options
Network
Section 4
the box. You install printers and configure ports using the Windows Control
Panel.
Choose Portrait or Landscape.
Select the size of paper that the document is to be printed on.
Some printers offer multiple trays for different paper sources. Specify the tray
here.
Displays a dialog box where you can make additional choices about printing,
specific to the type of printer you have selected.
Displays a dialog box that allows you to choose a printer if you are on a
network.
PAGE SETUP
Layout options for printable data tables may be specified. Page margins, table setup, page
orientation, and page order are adjustable.
HEADER/FOOTER
Page headers and footers can be customized with respect to font and placement. Both the header
and footer have separate tabs as shown below. Once the desired profile is created, it can be saved
for use every time the particular data file is opened.
YSI Incorporated
Drinking Water Monitoring Systems Operation Manual
4-20
EcoWatch for Windows
4.3.2
Section 4
EDIT
The edit menu appears whenever a data file is opened in EcoWatch. It allows you to locate, format, and
manage data.
COPY
Copies the selection to the clipboard. If a graph or table is active, then choosing this command will send its
contents to the Windows clipboard so that it can be pasted into other programs. This is a normal method of
transfer data between different Window programs.
Copying data to the clipboard replaces the contents previously stored there.
Shortcuts
Toolbar:
Keys:
CTRL+C
PASTE
This command does not function in this version of EcoWatch.
REMOVE PARAMETERS
When entire column(s) of data is selected, including the heading(s), this command will remove the
parameter(s) from both the data table and graph.
INSERT PARAMETER
YSI Incorporated
Drinking Water Monitoring Systems Operation Manual
4-21
EcoWatch for Windows
Section 4
Adds an additional parameter to the data table and graph. All available parameters that can be added are
shown on a list.
FIND
Locates text within the selected parameter. Only one parameter may be searched at a time. A system beep
indicates that there are no more occurrences of the desired text.
FIND AGAIN
Locates the text that was most recently searched for within the selected parameter. Only one parameter may
be searched at a time.
4.3.3
VIEW
The View menu offers the following commands:
TOOLBAR
Use this command to display and hide the Toolbar, which includes buttons for some of the most
common commands in EcoWatch, such as File Open. A check mark appears next to the menu
item when the Toolbar is displayed.
Shortcut:
To hide or display the Toolbar, choose Toolbar from the View menu.
See Section 4.2.6, Using the Toolbar, for a list of the toolbar icons and their functions.
STATUS BAR
Use this command to display and hide the Status Bar, which describes the action to be executed by the
selected menu item or statuses of keyboard latch state. A check mark appears next to the menu item when
the Status Bar is displayed.
The right areas of the status bar indicate which of the following keys are latched down:
CAP
NUM
The Caps Lock key is latched down.
The Num Lock key is latched down.
SCRL
The Scroll Lock key is latched down
YSI Incorporated
Drinking Water Monitoring Systems Operation Manual
4-22
EcoWatch for Windows
Section 4
4-DIGIT YEAR
Use this command to toggle between a date with a two or four digit year on the graph and table.
GRAPH
Use this command to display and hide the Graph page when viewing a file. The graph page
contains plots of data.
Shortcuts
Toolbar:
TABLE
Use this command to display and hide the Table page while viewing a data file.
Shortcuts
Toolbar:
GRID
Turns on or off the gridlines on graphs.
MARKERS
Turns on or off data point markers on the graphs. For graphs with more than a few data points we
recommend that Markers be left off.
STATISTIC
This command will display statistics for the current study. It will show the minimum, maximum, mean,
and standard deviation for each of the current parameters. If you click on any minimum or maximum
value, then a small box will appear showing the date and time when the minimum or maximum point
occurred.
YSI Incorporated
Drinking Water Monitoring Systems Operation Manual
4-23
EcoWatch for Windows
Section 4
Shortcuts
Toolbar:
STUDY INFO
This command will display a dialog box describing the study. It will show the sonde type and serial
number that was used to collect the data, the parameters available, the logging interval, and the beginning
and ending times of the sample.
Shortcuts
Toolbar:
ZOOM IN
Enlarges graph or data table (whichever is currently active) by 20%.
Shortcuts
Toolbar:
ZOOM OUT
Reduces graph or data table (whichever is currently active) by 20%. If the graph already extends to both
ends of the Study Limits, then it is not possible to zoom out any farther and this command will be dimmed.
Shortcuts
Toolbar:
YSI Incorporated
Drinking Water Monitoring Systems Operation Manual
4-24
EcoWatch for Windows
Section 4
UNZOOM
Displays the graph all the way to both ends of the Study Limit if a graph is selected. Displays the data
table in default size, if a data table is selected.
Shortcuts
Toolbar:
4.3.4
COMM(UNICATION)
The Comm (Communications) menu commands let you control your communications settings with sondes,
modems, and other devices. Several communication menu options are only available when a terminal
window is opened.
SETTINGS
The Communications Settings dialog box is where you can configure the communications ports. The
settings are organized into the following three tabs.
Port Setup
This is where you can set port parameters, file transfer protocol and handshaking for each
of the ports that you will use.
YSI Incorporated
Drinking Water Monitoring Systems Operation Manual
4-25
EcoWatch for Windows
•
Section 4
Port Parameter Setup
These include the most common settings for each communication port.
These settings are Baud Rate, number of Data bits, and Parity. These
settings must be identical to the settings on the device that is connected to the
port. You may choose independent settings for each communication port.
•
Protocol
You may choose Kermit, Xmodem or Xmodem 1K protocol for file transfer
through the communications port. 6820, 6920, 600R, 600XL, 600XLM and 6600
sondes use only Kermit protocol.
•
Handshaking
You may choose Xon/Xoff, or RTS/CTS, or Both or None. Xon/Xoff is often
referred to as software handshaking and RTS/CTS as hardware handshaking. If you
are using a YSI sonde select Xon/Xoff. Modems usually require RTS/CTS.
•
Modem Setup
This is where you enter the settings for your modem. Note that you can have several
modems, each on separate COM ports, and each with its own settings.
If a modem is selected for a particular COM port, then every time that port is
opened, EcoWatch will attempt to initialize a modem on that port. If the attempt
fails, then EcoWatch will open a terminal window and you can communicate to that
port with the computer keyboard. This can be very helpful in troubleshooting a
connection to your modem or in determining exactly which settings work with your
modem.
YSI Incorporated
Drinking Water Monitoring Systems Operation Manual
4-26
EcoWatch for Windows
•
Section 4
Modem
To setup a particular modem on your first try, select that modem from the
Modem list. The only settings that you can edit are for the Custom modem.
If your modem does not work, select “Hayes Compatible” modem. Those
settings are quite common and might work for your modem. If neither approach
works, then you will have to define your own settings. You will need the
instruction manual for your modem. It should list all of the proper settings.
Choose Custom from the Modem list and enter the settings for your modem.
The Auto Answer setting is included in the dialog for completeness. EcoWatch
currently does not use Auto Answer.
YSI Incorporated
•
Copy to Custom
The Copy to Custom button is sometimes helpful in defining your own
settings. If there is a similar modem, choose it from the list, and then
click Copy to Custom. Choose Custom from the list and edit the
settings. It transfers all modem settings from the currently selected
modem to the “Custom” modem so you can modify the setting later.
•
Dialing
If there is no entry for Phone Number, then every time you choose an
option that opens the COM port that connected to a modem, EcoWatch
will ask you for a phone number. Timeout specifies how long in
seconds EcoWatch will wait for the phone to answer.
Use the Dial option to select Tone or Pulse dialing.
Drinking Water Monitoring Systems Operation Manual
4-27
EcoWatch for Windows
Section 4
Other Setup
This is where you choose a default port for communicating with a sonde and
default capture files for each sonde port. This tab addresses several COM port
settings not covered on the other two tabs.
•
Default Capture File
While communicating to a sonde in terminal mode using the Sonde
command, you may want to capture measurements to a file. You may
type in a default file name in the accompanying text box.
If you specify a file name here and select the Use on Capture check
box, then whenever you capture data, the program will write to that file
without first asking you to confirm. If you specify a file but do not
select the check box, then you will have to confirm that this is the file
you wish to have your data written to before starting to capture.
•
Default Sonde Port
This refers to the COM port you will most commonly use to connect to
your sonde. If you select a port here, EcoWatch will automatically use
this port as the default COM port when you use the Sonde command.
The Apply button in the bottom of this dialog box is not used in EcoWatch.
SONDE
This command opens a terminal window for communicating with a sonde. From the terminal window you
can communicate to a sonde using the sonde menus. Unless you have chosen a default sonde port in the
YSI Incorporated
Drinking Water Monitoring Systems Operation Manual
4-28
EcoWatch for Windows
Section 4
Communications Settings dialog box the following dialog box will appear asking you which COM port to
use.
Shortcuts
Toolbar:
TERMINAL
Opens a new terminal window for communicating with any compatible RS-232 devices.
FONT/COLOR
Adjust font color, size, and style for any text that appears in the terminal window.
BACKGROUND COLOR
Adjust the background color of the terminal window.
CAPTURE
Turns COM port capture On or Off. This is typically used while communicating with a sonde that is taking
measurements. Capture will send all communications received on the COM port to a file. After selecting
the command, a dialog box will appear for selecting the name of the file to use. If “Use default capture” file
was checked in Communications Settings, EcoWatch will not display this dialog.
YSI Incorporated
Drinking Water Monitoring Systems Operation Manual
4-29
EcoWatch for Windows
Section 4
A common example is using a sonde in Run Mode. The sonde is simply taking readings and sending
them to the COM port. If you want to keep a record of these readings, then a simple way to do so is to
turn Capture on. When you are finished, run the Capture command again to turn it off.
FILE UPLOAD
Use this command to upload files from any device that uses Xmodem file transfer protocol. First
initiate the upload from the device, then choose this command. This command is enabled only
when the Xmodem or Xmodem 1K protocol has been selected in Port Setup.
DIAL MODEM
If you have specified a default phone number in the Modem tab of the communications Settings dialog
box, then this command will call that number. If you have not specified a default number, then you will be
asked for a number.
HANG-UP MODEM
Hangs up phone and halts communication with the modem.
SEND ASCII FILE
Sends a file in to the device connected to the terminal using plain ASCII protocol. No handshaking or error
correction is involved.
SEND XMODEM FILE
Sends a file to the device connected to the terminal using XModem protocol.
YSI Incorporated
Drinking Water Monitoring Systems Operation Manual
4-30
EcoWatch for Windows
4.3.5
Section 4
REAL-TIME
The Real-time menu offers the following commands that allow you to control how your data will be
presented.
SETTINGS
This command is only active when there is a real-time window open. This command takes you to the Realtime Settings dialog where you can set the length of the x-axis.
In the Real-Time Settings box you will set the number of samples graphed across the axis. (The interval
between samples is set in the sonde using the sonde menus.) After the graph is full, each new data point
will cause the trace to scroll left so that you see only the most recent set of measurements.
If you have a YSI 6026 or 6136 turbidity, 6025 chlorophyll, or 6130 rhodamine WT probe with a wiper,
then you may want to clean the optics periodically. Set that interval in this dialog.
Autoscaling will keep the trace comfortably on the graph as the measurement changes.
To Manually Scale a graph; double-click on its Y-axis labels. The Graph Y-Axis box will come up where
you can set the scale. Note that you can manually set the scale for some parameters and autoscale others.
When the autoscale box is checked, the high and low limits will be unavailable. See also the Autoscale
command in the Graph menu.
NEW
Choose this to start a new real time study.
OPEN
Choose this to open a previous real time study.
CLOSE
Choose this to close a real time study.
Two files are formed every time a real time study is started. You will choose a .RT file that will store
colors, scaling information, number of parameters and other information useful to the program. At the
same time, the program starts another file with the same name but a .DAT extension for the actual
measurements that are taken during the study.
YSI Incorporated
Drinking Water Monitoring Systems Operation Manual
4-31
EcoWatch for Windows
4.3.6
Section 4
GRAPH
ZOOM WINDOW
Enlarges a section of the graph. The pointer will change to a magnifying glass and then you can click and
drag on the graph to indicate the section you want to view. This command stays active until you execute it
again.
Shortcuts
Toolbar:
CENTER SCROLL
Centers graph at the mouse cursor. The pointer will change to a bullseye. Clicking anywhere on the graph
will cause that point to be moved to the center. This command stays active until you execute it again.
Shortcuts
Toolbar:
LIMIT DATA SET
This command limits the amount of data being processed. If you are not presently interested in
portions of the graph or table at the beginning or end of the study, you may want to use this
command to indicate only that portion that you are interested in. The program will have fewer
data points to handle and will respond to your commands quicker. Executing this command when
modifying a graph will change the pointer to a vertical arrow. Click once on the left end of that
part of the graph that you want and then click again at the right end. This command stays active
until you execute it again.
To limit the data in a table, move the pointer to the far left of the table into the row numbers area
and highlight from the desired cutoff point to the beginning or end of the data set, whichever is
desired. Then select the Limit Data Set option from the graph menu or use the toolbar shortcut.
To undo the limits choose Cancel Limits below. Alternately, you may remove the limits on a
graph by executing this command backwards. That is, click anywhere on the right side of the
graph first, and then click anywhere on the left side. The limits will be moved to the ends of the
file.
Shortcuts
Toolbar:
AUTOSCALE
Sets the scale of each parameter so that the minimum and maximum points fit comfortably on the
graph.
YSI Incorporated
Drinking Water Monitoring Systems Operation Manual
4-32
EcoWatch for Windows
Section 4
MANUAL SCALE
Takes you to the Graph Y-Axis dialog box where you can set the scale for each parameter.
Graph Y-axis dialog box
To manually scale a graph, double click on its Y-axis labels. A dialog will come up
where you can set the scale. Note that you can manually set the scale for some
parameters and autoscale others. When the autoscale box is checked, the high and low
limits will be dimmed. See also the Autoscale command in the Graph menu.
.
REDRAW
If part of a graph is not displayed it could be because your window is sized too small to display it or
because you have just returned to EcoWatch from some other application. Maximizing the window and
choosing this command should display your graph correctly
Shortcuts
Toolbar:
CANCEL LIMITS
Choose this command to cancel the limits set by the Limit Data Set command.
4.3.7
SETUP
PARAMETER
Lets you select which parameters you want to analyze and how they will appear.
YSI Incorporated
Drinking Water Monitoring Systems Operation Manual
4-33
EcoWatch for Windows
Section 4
Add/Remove
There are two lists, Selected Parameters and Available Parameters. If, for example, you wish
to graph another parameter, you must highlight it on the Available Parameter list and then click
the Add button to move it over to the Selected Parameters list.
This is also where you decide the order in which the parameters will appear in both the table and
the graphs. If you choose to have two traces per graph, then the first graph will have the first and
second parameters on this list, the second graph will have the third and fourth parameters and so
forth. The parameters will appear in the Selected Parameters list in the order that they were
added. To rearrange the order, highlight the parameter you wish to move and then use the up and
down buttons to move it to the desired spot in the order.
The TSS parameter (only available if your sonde has a Turbidity sensor) is a parameter that is not
part of your original collected data. TSS is calculated by EcoWatch, which uses the Turbidity data
and a set of correlation points that you enter. When you add TSS, a TSS calibration window will
popup and prompt you for a set of correlation points. For more information see Calibrate TSS.
Units
Select the units for any parameter. It will take you to the Change Parameter Units dialog box.
You may choose the units for each of the selected parameters. Many parameters have only one
possible choice of units. DO concentration, for example; can only be expressed in mg/L. pH has
no units at all.
YSI Incorporated
Drinking Water Monitoring Systems Operation Manual
4-34
EcoWatch for Windows
Section 4
Attributes
This command takes you to the Change Parameter Attributes dialog box where you have access
to two powerful features. You can choose to display an average of your data, or graph the data
with some parameter other than time for the x-axis. The most common use for this latter feature is
to graph temperature and DO versus depth. Other combinations are possible. You may choose to
average the data before it is graphed. An interval of 0 will cause there to be no averaging at all.
The larger the averaging interval, the more points will be used in each average. For example, if
you acquired data every 15 minutes and you set the average interval to 60 minutes, each set of four
points will be averaged and then plotted as a single point. This feature will not only smooth a
graph, but will also reduce the amount of data exported that is sometimes convenient when
exporting to a spreadsheet.
The x-axis parameter is normally Time, but you can choose any parameter you like. By default,
data files are sorted by increasing time. If you have chosen another parameter for the x-axis, then
you may want to have the data sorted before graphing it.
Change name
This command takes you to the Define Parameter Name dialog box where you may change the
default names of the parameters.
This dialog is intended to make changes like "degrees Celsius" to "degrees C". If you change
"degrees Celsius" to "degrees Fahrenheit", then the data displayed will be in degrees Celsius even
though the graph says "degrees Fahrenheit." To change the units for that parameter, use the
Change Parameter Units dialog box.
YSI Incorporated
Drinking Water Monitoring Systems Operation Manual
4-35
EcoWatch for Windows
Section 4
Calibrate TSS
TSS is an abbreviation for Total Suspended Solids. TSS is a unit derived from a
Turbidity (NTU) measurement and correlated TSS-NTU measurements. The Calibrate
TSS feature is only used if the TSS parameter has been added to the current data file
using Add/Remove Parameters. This command opens the TSS Calibration window and
allows calibration adjustment.
How do I add TSS to my data file?
You must have a data set that includes Turbidity data points.
It is also common to use a 0 to 0 correlation as a base point in these measurements. This
can be used as the first correlation point. You need to establish a correlation between
your Turbidity reading and a TSS value. This is done by taking a sample and noting its
Turbidity in NTU’s. Then run a lab analysis to obtain a total suspended solids reading.
You have now determined one correlation point.
Once you have at least two correlation points, you have established a linear correlation
between the two measurements. EcoWatch allows you to enter up to five correlation
YSI Incorporated
Drinking Water Monitoring Systems Operation Manual
4-36
EcoWatch for Windows
Section 4
points. The more correlation points you have, the higher that your accuracy will be.
To add the TSS parameter to your data file, go to the Setup menu. Choose Parameters,
then Add/Remove. Select the TSS parameter and click the Add button. The Calibrate
TSS window will appear.
Name the file for identification in the future. Multiple calibration files may be created.
Any previously created calibration files will be located in the drop-down name list box.
Once you have entered the desired number of correlation points, click OK. EcoWatch
will calculate the TSS values by doing a linear interpolation of the Turbidity (NTU) data
and the correlation chart .
GRAPH
The Setup menu, Graph submenu has the following commands:
Font/Color
Goes to the Font Dialog Box where you can change the font and color of text that appears in the
graph.
•
Font
Type or select a font name. EcoWatch lists the fonts available with the current
printer driver and additional fonts installed in your system.
•
Font Style
Select a font style. To use the default type style for a given font, select Regular.
•
Size
Type or select a font size. The sizes available depend on the printer and the selected
font. If the size you type is not available on the current printer, EcoWatch chooses
the closest available size.
•
Effects
Choosing Strikeout will draw a line through all text in the table. Choosing
underline will underline the text.
•
Color
YSI Incorporated
Drinking Water Monitoring Systems Operation Manual
4-37
EcoWatch for Windows
Section 4
Type or select one of the 16 predefined colors. To display color, you must have a
color monitor; to print color, you must have a color plotter or a color printer.
•
Sample
Shows the effects of the formatting you specify before you apply it to the document.
Page Color
Goes to the Color Dialog Box where you can change the color of the graph page. This is
the background for all of the graphs rather than the background for each individual graph
that is set with the next command.
Trace Color
Goes to the Change Trace Color dialog box where you can change the color of the trace
and the background for each of the individual graphs. For setting the background color
for all graphs, see the previous command.
YSI Incorporated
Drinking Water Monitoring Systems Operation Manual
4-38
EcoWatch for Windows
Section 4
Note that there are two color buttons, one for the trace color and the other for the
background color. Clicking on either of these buttons will take you to the Color dialog
box where you can change the color.
Use the Set All buttons to quickly set all traces or backgrounds to the same color.
Page Title
This is where you can enter a title for the graph. The title may have one or two lines.
1 Trace per Graph
Choose this to have just one parameter on each graph.
2 Traces per Graph
Choose this to have two parameters on each graph.
TABLE
If there is no table, then the commands on this submenu will be unavailable. The Table submenu offers the
following commands:
Font/Color
Goes to the Font Dialog Box where you can change the font and color of text that appears
in the table.
Page Color
Goes to the Color Dialog Box where you can change the color of the table background
color. That is the part of the table where the readings appear.
Highlight Color
Goes to the Color Dialog Box where you can change the color of the table highlight
color. That is the part of the table where the reading units appear.
SET DEFAULT TEMPLATE
This option allows you to select display parameters for your data when you initially open a file in
EcoWatch. Display parameters include background and trace colors on your graph, which
parameters are displayed, parameter ordering, parameter units, and scaling of those parameters
(either manual or automatic). The first time you use EcoWatch with a data file, graphing will
proceed according to the default settings present in EcoWatch. For example, graph backgrounds
will all be black, traces will be plotted each with a different color, all parameters will be autoscaled, and if your sonde measures conductivity and dissolved oxygen, EcoWatch will display
specific conductance in mS/cm and dissolved oxygen in mg/L. You can change the default
settings by using Set Default Template.
YSI Incorporated
Drinking Water Monitoring Systems Operation Manual
4-39
EcoWatch for Windows
Section 4
1-
Open a data file and observe the presentation of the data in graphic and tabular form.
2-
You can change the background and trace colors by going into the Graph and/or Table
submenus of the Setup Menu.
3-
You can add or remove parameters by going into the Parameter submenu of the Setup
Menu.
4-
You can change the units of the displayed parameters by going into the Parameter
submenu of the Setup Menu.
5-
You can change the order of the parameters by going into the Add/Remove Parameters
dialog box in the Parameter submenu of the Setup Menu.
6-
You can set the scaling options for your data by double-clicking on the Y-axis of the
graph and using the Graph Y-Axis dialog box to set the scales.
7-
After setting the display parameters enter the Setup Menu and choose Set Default
Template. Now every data file that you initially open will use the display parameters that
you have chosen. If you want to delete your template, enter the Setup Menu and choose
Clear Default Template.
CLEAR DEFAULT TEMPLATE
This command will eliminate a default template that has been saved. With no default template,
all new EcoWatch files open in whatever form they were saved in.
4.3.8
APPL(ICATIONS)
The Appl menu is the link to other Application programs that can be used with EcoWatch.
For Help using a GIS software, consult the menu that came with the GIS system.
To upload from a Campbell Scientific CR10 Logger, first connect the logger to a COM port using a
Campbell Scientific SC32A Adapter. Set the port for 9600 Baud, 8 data bits, no parity and Xon/Xoff
handshaking. Then from the EcoWatch Appl menu, select CR10 Upload. The dialog box below will
appear.
The items Number of Filled Locations and DSP Locations are information from the logger that you cannot
change. FS Area, First Upload Location, and Number of Arrays to Upload are fields that you must enter.
Refer to your CR10 manual for instructions.
Select a destination file (under Upload File; use the Browse button as needed) and click Upload.
YSI Incorporated
Drinking Water Monitoring Systems Operation Manual
4-40
EcoWatch for Windows
4.3.9
Section 4
WINDOW
The Window menu offers the following commands that enable you to arrange multiple views of multiple
documents in the application window:
CASCADE
Use this command to arrange multiple opened windows in an overlapped fashion
TILE HORIZONTAL
Use this command to vertically arrange multiple opened windows in non-overlapped horizontal tiles.
TILE VERTICAL
Use this command to arrange multiple opened windows side by side.
ARRANGE ICONS
Use this command to arrange the icons for minimized windows at the bottom of the main EcoWatch
window. If there is an open document window at the bottom of the main window, then some or all of the
icons may not be visible because they will be underneath this document window.
WINDOW 1, 2...
EcoWatch displays a list of currently open document windows at the bottom of the Window menu. A
check mark appears in front of the document name of the active window. Choose a document from this list
to make its window active.
YSI Incorporated
Drinking Water Monitoring Systems Operation Manual
4-41
EcoWatch for Windows
4.3.10
Section 4
HELP
The Help menu offers the following commands, which provide you assistance with this application:
CONTENTS
Offers you a list of the available Help topics.
USING HELP
Use this command for instructions about using Help.
TECHNICAL SUPPORT
YSI Technical support phone number.
ABOUT
Displays the version number of this application.
YSI Incorporated
Drinking Water Monitoring Systems Operation Manual
4-42
Principles of Operation
Section 5
SECTION 5 PRINCIPLES OF OPERATION
5.1 CONDUCTIVITY
The sondes utilize a cell with four pure nickel electrodes for the measurement of solution conductance.
Two of the electrodes are current driven, and two are used to measure the voltage drop. The measured
voltage drop is then converted into a conductance value in milli-Siemens (millimhos). To convert this value
to a conductivity value in milli-Siemens per cm (mS/cm), the conductance is multiplied by the cell constant
that has units of reciprocal cm (cm-1). The cell constant for the sonde conductivity cell is approximately
5.0/cm. For most applications, the cell constant is automatically determined (or confirmed) with each
deployment of the system when the calibration procedure is followed. Solutions with conductivities of
1.00, 10.0, 50.0, and 100.0 mS/cm, which have been prepared in accordance with recommendation 56-1981
of the Organization International De Metrologie Legale (OIML), are available from YSI. The instrument
output is in mS/cm or uS/cm for both conductivity and specific conductance. The multiplication of cell
constant times conductance is carried out automatically by the software.
CALIBRATION AND EFFECT OF TEMPERATURE
The conductivity of solutions of ionic species is highly dependent on temperature, varying as much as 3%
for each change of one degree Celsius (temperature coefficient = 3%/°C). In addition, the temperature
coefficient itself varies with the nature of the ionic species present.
Because the exact composition of a natural media is usually not known, it is best to report a conductivity at
a particular temperature, e.g. 20.2 mS/cm at 14 oC. However, in many cases, it is also useful to compensate
for the temperature dependence in order to determine at a glance if gross changes are occurring in the ionic
content of the medium over time. For this reason, the sonde software also allows the user to output
conductivity data in either raw or temperature compensated form. If Conductivity is selected, values of
conductivity that are NOT compensated for temperature are output to the report. If Specific Conductance is
selected, the sonde uses the temperature and raw conductivity values associated with each determination to
generate a specific conductance value compensated to 25°C. The calculation is carried out as in equation
(1) below, using a temperature coefficient of 1.91%/°C (TC = 0.0191):
Specific Conductance (25oC)
=
Conductivity
1 + TC * (T - 25)
As noted above, unless the solution being measured consists of pure KCl in water, this temperature
compensated value will be somewhat inaccurate, but the equation with a value of TC = 0.0191 will provide
a close approximation for seawater and for solutions of many common salts such as NaCl and NH4Cl.
MEASUREMENT AND CALIBRATION PRECAUTIONS
1 - When filling the calibration vessel prior to performing the calibration procedure, make certain that the
level of calibrant standard is high enough in the calibration cup or beaker to cover the entire conductivity
cell.
2 - After placing the sonde in the calibration solution, agitate the sonde to remove any bubbles in the
conductivity cell.
3 - During calibration, allow the sensors time to stabilize with regard to temperature (approximately 60
seconds) before proceeding with the calibration protocol. The readings after calibration are only as good as
the calibration itself.
YSI Incorporated
Drinking Water Monitoring Systems Operation Manual
5-1
Principles of Operation
Section 5
4 - Perform sensor calibration at a temperature as close to 25oC as possible. This will minimize any
temperature compensation error.
5.2 SALINITY
Salinity is determined automatically from the sonde conductivity and temperature readings according to
algorithms found in Standard Methods for the Examination of Water and Wastewater (ed. 1989). The use
of the Practical Salinity Scale results in values that are unitless, since the measurements are carried out in
reference to the conductivity of standard seawater at 15 °C. However, the unitless salinity values are very
close to those determined by the previously used method where the mass of dissolved salts in a given mass
of water (parts per thousand) was reported. Hence, the designation “ppt” is reported by the instrument to
provide a more conventional output.
5.3 TOTAL DISSOLVED SOLIDS (TDS)
The electrical conductivity of environmental water is due to the presence of dissolved ionic species. Thus,
the magnitude of the conductivity (or specific conductance) value can be used as a rough estimate of
amount (in g/L) of these ionic compounds which are present. The 6-series software provides a conversion
from specific conductance to total dissolved solids (TDS) by the use of a simple multiplier. However, this
multiplier is highly dependent on the nature of the ionic species present. To be assured of even moderate
accuracy for the conversion, the user must determine this multiplier for the water at the site of interest. Use
the following protocol to determine the conversion factor:
1.
2.
3.
4.
5.
6.
Determine the specific conductance of a water sample from the site;
Filter a portion of water from the site;
Completely evaporate the water from a carefully measured volume of the filtered sample to yield a dry
solid;
Accurately weigh the remaining solid;
Divide the weight of the solid (in grams) by the volume of water used (in liters) to yield the TDS value
in g/L for this site; Divide the TDS value in g/L by the specific conductance of the water in mS/cm to
yield the conversion multiplier. Be certain to use the correct units.
Enter the determined constant into the sonde software from the Advanced|Sensor menu to view the
correct TDS values from a computer/sonde interface.
CAUTION: The default value (0.65) for conversion of specific conductance in mS/cm to TDS in g/L
which is resident in the Advanced|Sensor menu of the software is only useful for a gross estimate of the
TDS. As noted above, to attain any degree of accuracy for TDS, the user must determine the conversion
factor empirically. Even then, if the nature of the ionic species at the site changes during an unattended
study or between sampling studies, the TDS values will be in error. It is important to recognize that,
generally speaking, TDS cannot be calculated accurately from specific conductance unless the make-up of
the chemical species in the water remains constant.
NOTE: EcoWatch for Windows contains a conversion factor of 0.65 for conversion of specific
conductance in mS/cm to TDS in g/L. However, unlike the sonde software, this constant cannot be varied
in EcoWatch. Thus, to calculate TDS from data resident in an EcoWatch file, the user should export the
specific conductance readings to a spreadsheet and carry out the calculation there using the formula:
TDS in g/L = (Sp. Cond in mS/cm) x (User-Derived Constant)
YSI Incorporated
Drinking Water Monitoring Systems Operation Manual
5-2
Principles of Operation
Section 5
5.4 OXIDATION REDUCTION POTENTIAL (ORP)
The sondes determine the Oxidation Reduction Potential (ORP) of the media by measuring the difference
in potential between an electrode which is relatively chemically inert and a reference electrode. To
measure ORP with a sonde, a combination pH/ORP probe must be in place in the sonde bulkhead and ORP
must be accessed via the ISE2 channel of the sonde. The ORP sensor consists of a platinum button found
on the tip of the probe. The potential associated with this metal is read versus the Ag/AgCl reference
electrode of the combination sensor that utilizes gelled electrolyte. ORP values are presented in millivolts
and are not compensated for temperature.
CALIBRATION AND EFFECT OF TEMPERATURE
Calibration may not be required for the ORP sensor of the sonde when it is new. However, older probes
that have been deployed extensively may show some deviation from the theoretical ORP value. This
deviation is usually due to a change in the concentration of the KCl in the reference electrode gel. To
determine whether the sensor is functioning correctly, place the ORP probe in 3682 Zobell solution and
monitor the millivolt reading. If the probe is functioning within specifications, the ORP reading should be
within the range of 221-241 at normal ambient temperature. If the reading is outside of this range, the
probe can be calibrated to the correct value (231 mV at 25°C) using the calibration procedure outlined in
Section 2.6.1, Calibration.
ORP readings for the same solution can vary up to 100 mv depending on the temperature. However, no
standard compensation algorithms exist for this parameter. Be sure to take this factor into account when
reporting ORP values and checking sensor calibration. For Zobell solution, consult the following chart:
TEMPERATURE,
CELSIUS
ZOBELL SOLUTION VALUE,
MV
-5
0
5
10
15
20
25
30
35
40
45
50
270.0
263.5
257.0
250.5
244.0
237.5
231.0
224.5
218.0
211.5
205.0
198.5
MEASUREMENT AND CALIBRATION PRECAUTIONS
1 - Instructions for preparation of ORP calibrator solutions (including Zobell reagent) can be found in
Section 2580 A. of Standard Methods for the Examination of Water and Wastewater. Alternatively, the
Zobell solution is available from YSI.
YSI Incorporated
Drinking Water Monitoring Systems Operation Manual
5-3
Principles of Operation
Section 5
2 – Reagants to confirm ORP sensitivity are available. Contact YSI Customer Service for ordering
information.
3 - ORP readings usually stabilize much more rapidly in standards (e.g., Zobell solution) than in most
environmental water. Be certain to consider this factor when determining ORP in field studies.
4 - Clean and store the pH/ORP sensor by following the instructions in Section 2.10, Care, Maintenance
and Storage of this manual.
5.5 pH
The sondes employ a field replaceable pH electrode for the determination of hydrogen ion concentration.
The probe is a combination electrode consisting of a proton selective glass reservoir filled with buffer at
approximately pH 7 and a Ag/AgCl reference electrode that utilizes electrolyte that is gelled. A silver wire
coated with AgCl is immersed in the buffer reservoir. Protons (H+ ions) on both sides of the glass (media
and buffer reservoir) selectively interact with the glass, setting up a potential gradient across the glass
membrane. Since the hydrogen ion concentration in the internal buffer solution is invariant, this potential
difference, determined relative to the Ag/AgCl reference electrode, is proportional to the pH of the media.
The pH system of the 600R utilizes individual glass sensing and reference electrodes, but the operating
principle is the same.
Our testing of the 6561 pH, 6565 and 6566 pH/ORP sensors and 600R pH system indicates that they should
provide long life, good response time, and accurate readings in most environmental waters, including
freshwater of low ionic strength. Thus, no special sensor is required (nor offered) for water of low
conductivity.
CALIBRATION AND EFFECT OF TEMPERATURE
The software of the sondes calculates pH from the established linear relationship between pH and the
millivolt output as defined by a variation of the Nernst equation:
where E = millivolts output
E = Eo + 2.3RT * pH
nF
Eo = a constant associated with the reference electrode
T = temperature of measurement in degrees Kelvin
R, n, and F are invariant constants
Thus, in simplified y = mx + b form, it is (mv output) = (slope)x(pH) + (intercept). In order to quantify this
simple relationship, the instrument must be calibrated properly using commercially available buffers of
known pH values. In this procedure, the millivolt values for two standard buffer solutions are
experimentally established and used by the sonde software to calculate the slope and intercept of the plot of
millivolts vs. pH. Once this calibration procedure has been carried out, the millivolt output of the probe in
any media can readily be converted by the sonde software into a pH value, as long as the calibration and
the reading are carried out at the same temperature. This last qualifier is almost never met in actual
environmental measurements since temperatures can vary several degrees during a deployment simply
from a diurnal cycle. Thus, a mechanism must be in place to compensate for temperature or, in other
words, to accurately convert the slope and intercept of the plot of pH vs. millivolts established at Tc
(temperature of calibration) into a slope and intercept at Tm (temperature of measurement). Fortunately, the
Nernst equation provides a basis for this conversion.
According to the Nernst equation as shown above, the slope of the plot of pH vs. millivolts is directly
proportional to the absolute temperature in degrees Kelvin. Thus, if the slope of the plot is experimentally
determined to be 59 mv/pH unit at 298 K (25 C), then the slope of the plot at 313 K (40 C) must be
(313/298) * 59 = 62 mv/pH unit. At 283 K (10 C), the slope is calculated to be 56 mv/pH unit ((283/298) *
YSI Incorporated
Drinking Water Monitoring Systems Operation Manual
5-4
Principles of Operation
Section 5
59). Determination of the slope of pH vs. mv plots at temperatures different from Tc is thus relatively
simple. In order to establish the intercept of the new plot, the point where plots of pH vs. mv at different
temperatures intersect (the isopotential point) must be known. Using standard pH determination protocol,
the sonde software assigns the isopotential point as the mv reading at pH 7 and then calculates the intercept
using this assumption. Once the slope and intercept to the plot of pH vs. mv are assigned at the new
temperature, the calculation of pH under the new temperature conditions is straightforward, and is
automatically carried out by the sonde software.
MEASUREMENT AND CALIBRATION PRECAUTIONS
1- When filling the calibration cup prior to performing the calibration procedure, make certain that the level
of calibrant buffers is high enough in the calibration/storage cup to cover at least ½ inch of the pH probe
and the temperature sensor of the 6560 probe.
2 - Rinse the sensors with deionized water between changes of calibration buffer solutions.
3 - During pH calibration, allow the sensors time to stabilize with regard to temperature (approximately 60
seconds) before proceeding with the calibration protocol. The pH readings after calibration are only as
good as the calibration itself.
4 - Clean and store the probe according to the instructions found in Section 2.10, Care, Maintenance and
Storage of this manual.
5.6 TEMPERATURE
The sondes utilize a thermistor of sintered metallic oxide that changes predictably in resistance with
temperature variation. The algorithm for conversion of resistance to temperature is built into the sonde
software, and accurate temperature readings in degrees Celsius, Kelvin, or Fahrenheit are provided
automatically. No calibration or maintenance of the temperature sensor is required.
5.7 FREE CHLORINE
CHLORINE CHEMISTRY
When chlorine gas (Cl2) is added to water, a reaction (called disproportionation) occurs to form
hypochlorous acid (HOCl) and hydrochloric acid (HCl). The hypochlorous acid is a strong oxidant and the
active species in most drinking water disinfection processes rather than gaseous chlorine (Cl2). One
molecule of HOCl has the same oxidizing capacity as a molecule of Cl2. Thus, the formula for “free
chlorine” is really HOCl rather than Cl2. (A portion of the free chlorine will also be in the form of
hypochlorite ion OCl- , with the amount depending on the pH of the sample.) However, convention
dictates that free chorine be reported in units of “mg Cl2 per liter” even though the active compounds in
solution are HOCl and OCl-. Thus, YSI free chlorine readings are expressed in units of “Cl2 mg/L” rather
than “HOCl/OCl- mg/L” to be consistent with standard reporting convention.
There are two categories of “chlorine” in most treated drinking water – free chlorine (HOCl + OCl-) and
combined chlorine which is made up of species formed in the reaction of free chlorine with ammonia
which is present in the water. Combined Chlorine is thus made up of a general class of compounds called
chloramines with formulae such as NH2Cl, NHCl2, and NCl3. In water which is treated just with chlorine,
there will be a small amount of combined chlorine from the natural ammonia in the water and a large
amount of free chlorine; in water which is treated with both free chlorine and ammonia there will be a small
YSI Incorporated
Drinking Water Monitoring Systems Operation Manual
5-5
Principles of Operation
Section 5
amount of free chlorine and a large amount of combined chlorine. Total Chlorine is defined as the sum
of the free and combined chlorine concentrations. Combined chlorine is usually not measured directly.
Instead, the free chlorine is measured by a color-forming chemical test under one set of conditions and the
total chlorine is measured colorimetrically under a slightly different set of conditions. Since Total
Chlorine = Free Chlorine + Combined Chlorine, the Combined Chorine is calculated as the difference
between the Total and Free Chlorine values. It is important to be aware of the fact that the YSI 6572
free chlorine sensor and its electronics measure only free chlorine – the sensor is unresponsive to
combined chlorine (chloramines). This makes the sensor of questionable utility for measuring
“chlorine” in distribution systems which use ammonia as part of the treatment process and thus have
predominantly combined chlorine in their drinking water.
FREE CHLORINE SENSOR -- GENERAL
The sondes employ an amperometric sensor to measure free chlorine which is similar in design and theory
to the patented YSI Rapid Pulse system for the measurement of dissolved oxygen. It is important to note
that, while the Rapid Pulse dissolved oxygen sensor is effectively flow independent, the analogous free
chlorine sensor possesses significant flow dependence (20-30 % in stagnant water). This characteristic
means that you must use the free chlorine sensor in flowing water utilizing YSI flow cells in order to
realize the stated accuracy specification.
The Rapid Pulse free chlorine system utilizes a sensor that is similar to other membrane-covered, steadystate amperometric free chlorine sensors. The system still measures the current associated with the
reduction of free chlorine which diffuses through a hydrophilic membrane, and this current is proportional
to the free chlorine content in the flowing drinking water being evaluated. The user will note from
examination of the 6572 free chlorine probe that the sensor consists of three electrodes (a cathode, anode,
and reference electrode) while steady state amperometric free chlorine probes usually have only two
electrodes (a cathode and a combined anode-reference electrode). In addition, the geometry of the sensor is
novel, consisting of a thin linear platinum cathode placed between two silver rectangles which serve as
anode and reference electrodes. These sensor changes are necessary to implement the new Rapid Pulse
method for free chlorine measurement as described in the following section.
FREE CHLORINE SENSOR -- METHOD OF OPERATION
Standard amperometric free chlorine sensors are continuously polarized at a voltage sufficiently negative to
cause free chlorine (hypochlorous acid + hypochlorite ion) to be reduced at the platinum cathode and silver
metal to be oxidized to silver chloride at the anode. The voltage must also be sufficiently positive to
prevent the reduction of oxygen during the measurement sequence. The free chlorine diffuses through a
hydrophilic polyvinylidene membrane and is reduced at the cathode. The current associated with this
process is proportional to the free chlorine concentration outside the membrane. As this electrochemical
reaction proceeds, free chlorine is consumed (or depleted) in the medium, resulting in a decrease in
measured current (and apparent free chlorine content) if the external solution is not stirred rapidly. This
flow dependence is minimized (but not eliminated) by rapidly and reproducibly polarizing (on) and
depolarizing (off) the probe electrodes during a measurement sequence. The Rapid Pulse system thus
measures the charge or coulombs (current summed over a specific time period) associated with the
reduction of free chlorine during a carefully controlled time interval. The coulombs due to charging of the
cathode (capacitance), but not to reduction of free chlorine, are subtracted during integration after the
cathode has been turned off. The net charge, like the steady state current in a standard system, is
proportional to the free chlorine concentration in the medium. Note that, as described above, the flow
dependence of the sensor is not completely overcome by this method (as it is in Rapid Pulse dissolved
oxygen sensors) because of the different diffusion characteristics of free chlorine through the hydrophilic
polyvinylidene membrane versus oxygen through a Teflon membrane.
YSI Incorporated
Drinking Water Monitoring Systems Operation Manual
5-6
Principles of Operation
Section 5
CALIBRATION AND EFFECT OF TEMPERATURE
To calibrate the free chlorine sensor, you must make an independent measurement of the free chlorine in
the flow cell effluent at the time of calibration. This is usually done by collecting an effluent sample,
adding a chemical to it (DPD) which will form a red color which is proportional to the free chlorine in the
sample and then determining the intensity of the color using a commercial colorimeter. The analysis is
very simple and takes only about 2 minutes to perform. Once the true chlorine value has been determined
from the DPD colorimetric analysis, this value is input into the sonde software and the calibration is
confirmed.
The YSI 9000 and 9100 Photometers and the version of the Hach Pocket Colorimeter TM II which is
specific for free and total chlorine are examples of colorimeters which can be purchased for the analysis of
free chlorine in water samples. In addition, you usually will need to purchase the color-forming reagents
in either pill or powder form – YSI Item # YAP 001 for the YSI photometers; Hach Item # 21055-69 for
the Hach colorimeter. The cost of the reagents is nominal.
NOTE CAREFULLY: YSI does not recommend the calibration of the free chlorine using standards
prepared from commercial bleach. This procedure is likely to result in significant errors in your subsequent
readings for three reasons: (1) The concentration of hypochlorite on the bleach bottle is for new bleach
batches and may not be correct if the bleach has been on the shelf for varying periods of time; (2) Dilute
solutions of hypochlorite may be unstable and change during the calibration procedure; and (3) Because the
free chlorine sensor is flow dependent, it needs to be calibrated in water flowing at the same rate as will be
used in the continuous monitoring studies. This flow condition is almost impossible to meet by immersing
the sensors in stagnant or agitated solutions of bleach. It is important to understand that YSI may not be
able to provide customer support for users who do not perform their free chlorine sensor calibrations by the
recommended procedure.
The free chlorine system is calibrated using the same basic methods employed for other sonde sensors.
The important thing to remember is to calibrate your sensor versus a flow cell effluent in the mode which
you will be using to measure free chlorine. There are four basic modes of operation as described below
with their corresponding calibration instructions:
1.
Stand-alone applications where data is being logged only to the internal memory of the
sonde at a user selected interval. For this mode of operation, make certain that the Autosleep
RS232 feature is activated in the Advanced|Setup menu and that the Chlorine warm-up time is set
to 60 seconds in the Advanced|Sensor menu. With these software entries in place, the user will
input the free chlorine value from the DPD analysis of the flow cell effluent, and the unit will
automatically calibrate after the selected warm up time.
2.
Applications where the sonde is attached to a YSI 6500 Process Monitor utilizing the Sample
and Hold feature of the sonde software. For this mode of operation, first activate the Sample
and Hold feature from the Setup sonde menu of the 6500 (Press the Esc and Enter keys of the
6500 front panel simultaneously to access this menu). Then select the desired interval for data to
be sent to the 6500. Exit to the main display mode of the 6500 by pressing the Esc key
repetitively and then press the Cal key on the 6500 front panel. Highlight the free chlorine sensor
entry, enter the value from the DPD analysis of the effluent and press Enter. Then press Enter
again to confirm the calibration.
3.
Applications where the sonde is attached to a YSI 6500 Process Monitor and is outputting
data continuously to the 6500. For this mode of operation, access the Setup sonde menu of the
6500 as described above and make certain that the Sample and Hold feature is INACTIVE. Then
exit to the main display mode of the 6500 by pressing the Esc key repetitively and press the Cal
key on the 6500 front panel. Highlight the free chlorine sensor entry, enter the value from the
DPD analysis of the effluent and press Enter. Observe the free chlorine readings in real-time
and, when stable, press the Enter key to confirm the calibration. Note that this method of
YSI Incorporated
Drinking Water Monitoring Systems Operation Manual
5-7
Principles of Operation
Section 5
operation is NOT RECOMMENDED by YSI due to potential sensor maintenance issues as
described in detail in Appendix G of this manual.
4.
Applications where the sonde is attached to a PC and data is being displayed to the
computer monitor using the Real-Time mode of Ecowatch for Windows. For this mode of
operation, your must calibrate the free chlorine sensor before activating the Real-Time EcoWatch
mode of EcoWatch. Access the sonde menu after connection of the sonde to a PC or 650 Display
logger and make certain that the Autosleep RS232 feature is activated in the Advanced|Setup
menu and that the Chlorine warm-up time is set to 60 seconds in the Advanced|Sensor menu.
With these software entries in place, the user will input the free chlorine value from the DPD
analysis of the flow cell effluent, and the unit will automatically calibrate after the selected warm
up time. After calibration, select the Run|Discrete Sample entry from the sonde menu and set the
Discrete Sample interval to the value corresponding to the frequency at which you wish data to be
logged to the hard drive of your PC. Then click on the Real-Time entry in the top EcoWatch
toolbar (Do NOT click on the sonde icon in the lower toolbar). The Real-Time study will start
automatically with data displayed graphically on the PC monitor and logged to the hard drive of
the PC under the file name which you have selected. See Section 4.3.5 of this manual for detailed
instruction in using the EcoWatch Real-Time mode.
The free chlorine readings are affected by temperature (approximately 2.5 % per degree Celsius) due to the
effect of temperature on the diffusion of free chlorine through the membrane. Note, however, that the sonde
software automatically carries out this compensation using the Chlorine tempco factor found in the
Advanced|Sensor menu. The default value of this factor should NOT be changed except under unusual
conditions and only then after contacting YSI Technical Support for advice.
FLOW DEPENDENCE
As noted above, the Rapid Pulse free chlorine sensor exhibits significant flow dependence (20-30 %) in
stagnant water. This dependence is overcome by a water flow rate through the flow cell of approximately
500 mL/minute and therefore lower flow rates are not recommended. Note also that this characteristic
means that you must use the free chlorine sensor in flowing water utilizing YSI flow cells in order to
realize the stated accuracy specification.
EFFECT OF PH
The YSI free chlorine sensor appears to be less sensitive to OCl- than it is to HOCl and as the pH rises,
there is no question that the amount of HOCl relative to OCl- is reduced significantly. This means that the
sensitivity of the sensor to the mixture of HOCl and OCl- is reduced at high pH, but the sensor has been
shown empirically to still have enough overall sensitivity to be functional at pH values up to ca. 9.3 and
data to support this claim is available on request from YSI. (Note, however, that at pH values above 8.8,
there is a possibility that calibration errors might occur. If you see these errors, contact YSI Technical
Support for advice on whether to override them.)
The YSI philosophy relative to the use of the free chlorine sensor at high pH is to calibrate the sensor under
these conditions of reduced sensitivity in the high pH water and then assume that minor variations in pH
will have only a minimal effect on accuracy during the monitoring study. This philosophy has been
adopted rather than compensating for changes in pH using the on-board pH sensor in the sonde. It was
decided not to do pH compensation because chlorine is usually the most important parameter to the
drinking water industry and the accuracy of this parameter would be grossly compromised if a pH sensor
failed while providing compensation data during long term monitoring studies. In other words, we feel
that the risk of pH probe failure or significant drift is more likely to be a problem to users than the smaller
inaccuracies in the uncompensated pH data which might result from small changes in pH. Note that the
YSI Incorporated
Drinking Water Monitoring Systems Operation Manual
5-8
Principles of Operation
Section 5
quoted accuracy specification for water which has a pH of greater than 8.5 is only valid if the pH changes
less than 0.3 pH units from the pH at the time of calibration. In addition, users should note that it will not
be possible to make free chlorine measurements with the YSI free chlorine sensor under any conditions if
the pH exceeds ca. 9.3.
5.8 NITRATE
The sonde nitrate probe consists of a silver/silver chloride wire electrode in a custom filling solution. The
internal solution is separated from the sample medium by a polymer membrane, which selectively interacts
with nitrate ions. When the probe is immersed in water, a potential is established across the membrane that
depends on the relative amounts of nitrate in the sample and the internal filling solution. This potential is
read relative to the Ag/AgCl reference electrode of the sonde pH probe. As for all ISEs, the linear
relationship between the logarithm of the nitrate activity (or concentration in dilute solution) and the
observed voltage, as predicted by the Nernst equation, is the basis for the determination.
Under ideal conditions, the Nernst equation predicts a response of 59 mV for every 10-fold rise in nitrate
activity at 25°C. However, in practice, empirical calibration of the electrode is necessary to establish the
slope of the response. Typical slopes are 53-58 mV per decade for YSI sensors. This slope value is
determined by calibration with two solutions of known nitrate concentration (typically 1 mg/L and 100
mg/L NO3-N). The slope of the plot of log (nitrate) vs. voltage is also a function of temperature, changing
from its value at calibration by a factor of the ratio of the absolute temperatures at calibration to that at
measurement. The point where this new plot of log (nitrate) vs. voltage intersects the calibration plot is
called the isopotential point, that is, the nitrate concentration at which changes in temperature cause no
change in voltage. Our experience with ISEs indicates that for best accuracy, the isopotential point should
be determined empirically. To do so, the user employs a third calibration point where the voltage of the
lower concentration standard is determined at a temperature at least 10°C different from the first two
calibration points. The slope, offset, and isopotential point drift slowly, and you should recalibrate the
probe periodically.
All ion selective electrodes are subject to the interaction of species with the sensor membrane, which are
similar in nature to the analyte. For example, chloride ion binds in this way to the nitrate membrane and
produces positive nitrate readings even when no nitrate is present in the medium. Fortunately, most fresh
water does not usually contain significant quantities of ions that produce a large interference on the nitrate
reading, such as azide, perchlorate, and nitrite. It usually does contain some chloride and carbonate ions,
but the interference from these ions is relatively small. For example, if the all of the ionic content of water
with a conductivity of 1.2 mS/cm (Sal = 0.6) were due to the presence of sodium chloride, the nitrate
reading would be erroneously high by about 1.6 mg/L. If the conductivity in this sample were all due to
sodium bicarbonate, the sensor output would indicate the presence of only 0.2 mg/L of non-existent nitrate
from the interference.
Even though the interference from chloride is relatively small and thus tolerable at low salinity, the large
quantity of this species in salt or brackish water creates interference so great as to make the sensor
unsuitable for these media.
Despite the potential problems with interference when using ISEs, it is important to remember that almost
all-interfering species produce an artificially high nitrate reading. Thus, if the sonde indicates the presence
of only small quantities of nitrate, it is unlikely that the reading is erroneously low because of interference.
Unusually high nitrate readings (which could be due to interfering ions) should be confirmed by laboratory
analysis after collection of water samples.
Ion selective electrodes have the greatest tendency to exhibit calibration drift over time of all the sensors
available on the sonde. This drift should not be a major problem for sampling studies where the instrument
can be frequently calibrated. However, if a nitrate sensor is used in a longer-term deployment study with
YSI Incorporated
Drinking Water Monitoring Systems Operation Manual
5-9
Principles of Operation
Section 5
the sonde, the user should be aware that drift is almost certain to occur. The extent of the drift will vary
depending on the age of the probe, the flow rate at the site, and the quality of the water. For all monitoring
studies using ion selective electrodes, the user should acquire a few “grab samples” during the course of the
deployment for analysis in the laboratory by chemical means or with another nitrate sensor which has been
recently calibrated. Remember that the typical accuracy specification for the sensor (+/- 10 % of the
reading or 2 mg/L, whichever is larger) refers to sampling applications where only minimal time has
elapsed between calibration and field use.
CALIBRATION AND EFFECT OF TEMPERATURE
The nitrate sensor should be calibrated using solutions of known nitrate-nitrogen content according to the
procedures detailed in Sections 2.6.1 and 2.9.2. If a two point calibration protocol is used, the temperature
of the standards should be as close as possible to that of the environmental medium to be monitored. The
recommended calibration procedure is one involving three solutions. Two of the solutions should be at
ambient temperature while the third should be at least 10 degrees Celsius different from ambient
temperature. This protocol minimizes the effects of taking readings at temperatures that are significantly
different from ambient laboratory temperatures.
MEASUREMENT AND CALIBRATION PRECAUTIONS
(1) The temperature response of ion selective electrodes is not as predictable as that of pH sensors.
Therefore, be sure to carry out a 3-point calibration the first time you use the probe. This will provide a
default setting for the effect of temperature on your particular sensor. After this initial calibration, you can
use the less time-consuming 2 point and 1-point routines to update the 3-point calibration. However, we
strongly recommend a new 3-point calibration after each deployment of 30 days or longer.
(2) Ion selective electrodes may not stabilize as rapidly as pH sensors. Be sure to allow plenty of time for
the readings to come to their final values during all calibration routines.
(3) Ion selective electrodes generally drift more than pH sensors. To check for this drift, place the sonde in
one of your standards at the end of each deployment.
(4) Nitrate standards are good growth media for a variety of organisms. This growth can significantly
reduce the nitrogen content of your standards, an effect that is particularly important for the 1 mg/L
solution. It is best to use new standards for each deployment, but if you decide to save your solutions for
reuse, we recommend refrigerated storage to minimize the growth of these organisms.
(5) Remember that the nitrate sensor will take longer to stabilize after exposure to pH buffers. To
accelerate this process, soak the sensor in 100 mg/L standard for a few minutes after performing a pH
calibration. In addition, be particularly careful that readings are stable during nitrate calibration after
exposure to buffers.
CAUTION: The nitrate membrane module is for use only at depths less than 50 feet (15.2 meters). Use of
the probe at greater depths is likely to permanently damage the sensor.
5.09
AMMONIUM AND AMMONIA
The sonde ammonium probe employs a silver/silver chloride (Ag/AgCl) wire electrode in a custom filling
solution. Nonactin membrane separates the internal solution from the sample medium and this membrane
selectively interacts with ammonium ions. When the probe is immersed in water, a potential is established
across the membrane that depends on the relative amounts of ammonium in the sample and the internal
YSI Incorporated
Drinking Water Monitoring Systems Operation Manual
5-10
Principles of Operation
Section 5
filling solution. This potential is read relative to the reference electrode of the sonde pH probe. As for all
ISEs, there is a linear relationship between the logarithm of the ammonium activity (or concentration in
dilute solution) and the observed voltage. The Nernst equation describes this relationship.
Under ideal conditions, the Nernst equation predicts a response of 59 mV for every 10-fold rise in
ammonium activity at 25°C. In practice, however, empirical calibration of the electrode is necessary to
establish an accurate slope of the response. Typical empirical slopes are 53-58 mV per decade for YSI
sensors. This slope value is determined by calibration with two solutions of known ammonium
concentration (typically 1 mg/L and 100 mg/L NH4+-N).
The slope of the plot of log (ammonium) vs. voltage is also a function of temperature. The slope changes
by a factor that is the ratio of the absolute temperature of calibration to absolute temperature of
measurement. The point where this new plot of log (ammonium) vs. voltage intersects the calibration plot
is called the isopotential point, that is, the ammonium concentration at which changes in temperature cause
no change in voltage. Our experience with ISEs indicates that for best accuracy, the isopotential point
should be determined empirically. To do so, use a third calibration point where the voltage of the lower
concentration standard is determined at a temperature at least 10°C different from the first two calibration
points. The slope, offset, and isopotential point drift slowly, and the probe should be recalibrated
periodically.
All ion selective electrodes are subject to interference from ions, which are similar in nature to the analyte.
For example, sodium and potassium ions bind to the ammonium membrane and produce positive readings
even when no ammonium is present. Fortunately, fresh water does not usually contain enough interfering
ions to produce large errors. For example, a common conductivity for freshwater is about 1.2 mS/cm (Sal
= 0.6). Even if the ionic content were due to sodium chloride, the ammonium reading would be
erroneously high, about 0.4 mg/L.
However, brackish or seawater has enough sodium and potassium to cause interference so great as to
make the sensor unsuitable for these media.
The sensor used in the sonde detects only ammonium ions (NH4+), the predominant form of total
ammonium nitrogen in most environmental samples. However, using the concurrently determined values
of pH, temperature, and conductivity, the sonde software can also provide the user with the concentration
of free ammonia (NH3) in the sample under investigation.
Ammonium ions and free ammonia are in equilibrium in any solution according to the following equation:
NH4+
NH3 + H+
The value of the equilibrium constant associated with this reaction, K = [NH3][H+]/[NH4+], and its variation
with temperature and salinity, is well known. This information allows the free ammonia concentration
[NH3] to be automatically calculated by the sonde software and displayed if this parameter is activated.
Despite the potential problems with interference when using ISEs, it is important to remember that almost
all interfering species produce an artificially high ammonium reading. Thus, if the sonde indicates the
presence of only small quantities of ammonium, it is unlikely that the reading is erroneously low because of
interference. Unusually high ammonium readings (which could be due to interfering ions) should be
confirmed by laboratory analysis after collection of water samples.
Of all the sensors available on the sonde, ion selective electrodes have the greatest tendency to exhibit
calibration drift over time. This drift should not be a major problem for sampling studies where the
instrument can be frequently calibrated. However, if an ammonium sensor is used in a longer-term
deployment study with the sonde, the user should be aware that drift is almost certain to occur. The extent
of the drift will vary depending on the age of the probe, the flow rate at the site, and the quality of the
water. For all monitoring studies using ion selective electrodes, the user should acquire a few “grab
samples” during the course of the deployment for analysis in the laboratory by chemical means or with
YSI Incorporated
Drinking Water Monitoring Systems Operation Manual
5-11
Principles of Operation
Section 5
another ammonium sensor which has been recently calibrated. Remember that the typical accuracy
specification for the sensor (+/- 10 % of the reading or 2 mg/L, whichever is larger) refers to sampling
applications where only minimal time has elapsed between calibration and field use.
CALIBRATION AND EFFECT OF TEMPERATURE
The ammonium sensor should be calibrated using solutions of known total ammonium-nitrogen content
according to the procedures detailed in Sections 2.6.1 and 2.9.2. If a two point calibration protocol is used,
the temperature of the standards should be as close as possible to that of the environmental medium to be
monitored. The recommended calibration procedure is one involving three solutions. Two of the solutions
should be at ambient temperature while the third should be at least 10 degrees Celsius different from
ambient temperature. This protocol minimizes the effects of taking readings at temperatures that are
significantly different ambient laboratory temperatures.
MEASUREMENT AND CALIBRATION PRECAUTIONS
(1) The temperature response of ion selective electrodes is not as predictable as that of pH sensors.
Therefore, be sure to carry out a 3-point calibration the first time you use the probe. This will provide a
default setting for the effect of temperature on your particular sensor. After this initial calibration, you can
use the less time consuming 2 point and 1-point routines to update the 3-point calibration. However, we
strongly recommend a new 3-point calibration after each deployment of 30 days or longer.
(2) Ion selective electrodes may not stabilize as rapidly as pH sensors. Be sure to allow plenty of time for
the readings to come to their final values during all calibration routines.
(3) Ion selective electrodes generally drift more than pH sensors. To check for this drift, place the sonde in
one of your standards at the end of each deployment.
(4) Ammonium standards are good growth media for a variety of organisms. This growth can significantly
reduce the nitrogen content of your standards, an effect that is particularly important for the 1 mg/L
solution. It is best to use new standards for each deployment, but if you decide to save your solutions for
reuse, we recommend refrigerated storage to minimize the growth of these organisms.
(5) Remember that the ammonium sensor will take longer to stabilize after exposure to buffers in a sonde
pH calibration. To accelerate this process, soak the sensor in 100 mg/L standard for a few minutes after
performing a pH calibration. In addition, be particularly careful that readings are stable during ammonium
calibration after exposure to buffers.
CAUTION: The ammonium membrane module is for use only at depths less than 50 feet (15.2 meters).
Use of the probe at greater depths is likely to permanently damage the sensor.
5.10
CHLORIDE
The sonde chloride probe employs a solid state membrane attached to a conductive wire. When the probe
is immersed in water, a potential is established across the membrane that depends on the amount of
chloride in the medium. This potential is read relative to the reference electrode of the sonde pH probe. As
for all ISEs, there is a linear relationship between the logarithm of the chloride activity (or concentration in
dilute solution) and the observed voltage. The Nernst equation describes this relationship.
Under ideal conditions, the Nernst equation predicts a response of 59 mV for every 10-fold rise in chloride
activity at 25°C. However, in practice, empirical calibration of the electrode is necessary to establish the slope
of the response. Typical slopes are 45-55 mV per decade for YSI sensors. This slope value is determined by
calibration with two solutions of known chloride concentration (typically 10 mg/L and 1000 mg/L Cl-).
YSI Incorporated
Drinking Water Monitoring Systems Operation Manual
5-12
Principles of Operation
Section 5
The slope of the plot of log (chloride) vs. voltage is also a function of temperature, changing from its value at
calibration by a factor of the ratio of the absolute temperatures at calibration to that at measurement. The
point where this new plot of log (chloride) vs. voltage intersects the calibration plot is called the isopotential
point, that is, the chloride concentration at which changes in temperature cause no change in voltage. Our
experience with ISEs indicates that for best accuracy, the isopotential point should be determined empirically.
To do so, the user employs a third calibration point where the voltage of the lower concentration standard is
determined at a temperature at least 10°C different from the first two calibration points. The slope, offset and
isopotential point drift slowly, and the probe should be recalibrated periodically.
All ion selective electrodes are subject to the interaction of species with the sensor membrane, which are
similar in nature to the analyte. These interfering species thus include other halide ions (fluoride, bromide,
and iodide) as well as other anions.
Despite the potential problems with interference when using ISEs, it is important to remember that almost
all interfering species produce an artificially high chloride reading. Thus, if the sonde indicates the
presence of only small quantities of chloride, it is unlikely that the reading is erroneously low because of
interference. Unusually high chloride readings (which could be due to interfering ions) should be
confirmed by laboratory analysis after collection of water samples.
Of all the sensors available on the sonde, ion selective electrodes have the greatest tendency to exhibit
calibration drift over time. This drift should not be a major problem for sampling studies where the
instrument can be frequently calibrated. However, if a chloride sensor is used in a longer-term deployment
study with the sonde, the user should be aware that drift is almost certain to occur. The extent of the drift
will vary depending on the age of the probe, the flow rate at the site, and the quality of the water. For all
monitoring studies using ion selective electrodes, the user should acquire a few “grab samples” during the
course of the deployment for analysis in the laboratory by chemical means or with another chloride sensor
which has been recently calibrated. Remember that the typical accuracy specification for the sensor (+/- 15
% of the reading or 5 mg/L, whichever is larger) refers to sampling applications where only minimal time
has elapsed between calibration and field use.
CALIBRATION AND EFFECT OF TEMPERATURE
The chloride sensor should be calibrated using solutions of known chloride content according to the
procedures detailed in Sections 2.6.1 and 2.9.2. If a two point calibration protocol is used, the temperature
of the standards should be as close as possible to that of the environmental medium to be monitored. The
recommended calibration procedure is one involving three solutions. Two of the solutions should be at
ambient temperature while the third should be at least 10 degrees Celsius different from ambient
temperature. This protocol minimizes the effects of taking readings at temperatures that are significantly
different ambient laboratory temperatures.
MEASUREMENT AND CALIBRATION PRECAUTIONS
(1) The temperature response of ion selective electrodes is not as predictable as that of pH sensors.
Therefore, be sure to carry out a 3-point calibration the first time you use the probe. This will provide a
default setting for the effect of temperature on your particular sensor. After this initial calibration, you can
use the less time-consuming 2 point and 1-point routines to update the 3-point calibration. However, we
strongly recommend a new 3-point calibration after each deployment of 30 days or longer.
(2) Ion selective electrodes may not stabilize as rapidly as pH sensors. Be sure to allow plenty of time for
the readings to come to their final values during all calibration routines.
YSI Incorporated
Drinking Water Monitoring Systems Operation Manual
5-13
Principles of Operation
Section 5
(3) Ion selective electrodes generally drift more than pH sensors. Be sure to check for this drift by placing
the sonde in a standard at the end of each deployment.
(4) Remember that the chloride sensor will take longer to stabilize after exposure to pH buffers. To
accelerate this process, soak the sensor in 1000 mg/L standard for a few minutes after performing a pH
calibration. In addition, be particularly careful that readings are stable during chloride calibration after
exposure to buffers.
5.11
TURBIDITY
Turbidity is the measurement of the content of suspended solids (cloudiness) in water and is typically
determined by shining a light beam into the sample solution and then measuring the light that is scattered
off of the particles which are present. For turbidity systems capable of field deployment, the usual light
source is a light emitting diode (LED) which produces radiation in the near infrared region of the spectrum.
The detector is usually a photodiode of high sensitivity. The angle between the emitted and detected light
varies (usually between 90 and 180 degrees) depending on the probe used. The International Standards
Organization (ISO) recommends the use of a light source with a wavelength between 830 and 890 nm and
an angle of 90 degrees between the emitted and detected radiation (ISO 7027).
The turbidity system available as an option for use with the YSI sondes consists of a probe which conforms
to the above ISO recommendations. The output of the sonde turbidity sensor is processed via the sonde
software to provide readings in nephelometric turbidity units (NTUs).
The 6136 turbidity probe is available for use with YSI sondes. The probe is equipped with a mechanical
wiper to periodically clean the sensor either by manual or automatic activation. These wiper systems make
the probe ideal for long term monitoring,
While drinking water is very clean relative to surface water, it is important to remember that optical
measurements drinking water can still be susceptible to fouling, not only from long term build up of
impurities or those flushed from older distribution pipes, but also to shorter term formation of bubbles from
outgassing of the water. These bubbles can generally be removed in short term sampling application by
simply agitating the sonde manually. However, for studies longer than a few hours where the user is not
present at the site, the quality of the turbidity data obtained with a turbidity sensor that has no capability of
mechanical cleaning is likely to be poor. However, as noted above, both the 6136 probe is equipped with a
mechanical wiper that makes them ideal for unattended applications. The wiper can be activated in realtime during discrete sampling operations or will function automatically during long term unattended
sampling studies. The number of wiper movements and the frequency of the cleaning cycle for the
unattended mode can be set in the sonde software. Generally one movement is sufficient for most
environmental applications, but in media with particularly heavy fouling, additional cleaning cycles may be
necessary.
CALIBRATION AND EFFECT OF TEMPERATURE
The sonde software offers the option of 1-point, 2-point, or 3-point calibrations procedures. For most
applications, a 2-point calibration at 0 and approximately 100 NTU is sufficient for the 6136 sensor to meet
the quoted accuracy specification of +/- 2% of the reading or 0.3 NTU, whichever is greater. (Note that the
specification is relative to measurements in calibration standards.) However, a user might wish to carry
out a 3-point calibration at values of approximately 0, 100 and 1000 NTU to provide maximum accuracy
over the entire normally encountered environmental turbidity range (0-1000 NTU). If the range of
turbidity in the environmental sample is well known, standards of other turbidity values can be utilized (in
either 3 point or 2 point routines). However, in all calibration procedures, one of the standards must be 0
NTU and this should be the first calibration point.
YSI Incorporated
Drinking Water Monitoring Systems Operation Manual
5-14
Principles of Operation
Section 5
NOTE: Before calibrating your 6136 turbidity sensor, pay particular attention to the following caution:
•
For all calibration procedures, you MUST use standards that are based on either formazin or AMCOAEPA styrene divinylbenzene beads as described in Standard Methods for the Examination of Water
and Wastewater and have been prepared either by Hach (formazin based) or AMCO-AEPA based
standards prepared by YSI or an approved YSI vendor listed on the YSI website (www.ysi.com). THE
USE OF STANDARDS FROM OTHER VENDORS AND/OR THOSE PREPARDED FROM
MATERIALS OTHER THAN FORMAZIN OR AMCO-AEPA POLYMER BEADS WILL RESULT
IN BOTH CALIBRATION ERRORS AND INACCURATE FIELD READINGS.
YSI and its approved vendors offer easy-to use AMCO-AEPA turbidity standards which can also be
quantitatively diluted with turbidity-free water to provide calibrant suspensions of lower values. Hach also
offers relatively inexpensive formazin suspensions at various NTU values up to 1000 NTU under the
StablcalTM designation which will provide accurate calibration of either the 6026 or 6136 sensors as long as
the user is willing to exercise the proper safety precautions as outlined in the MSDS associated with formazin.
The primary advantage of the Hach formazin standards is their cost; their primary disadvantage is that the
suspended matter settles out fairly rapidly. Although the AMCO-AEPA standards are somewhat more
expensive, they do not settle out, making them significantly easier to use.
While the effect of temperature on the turbidity sensor is small, this factor is automatically taken into
account by the sonde software providing temperature compensated readings. Temperature coefficients of
0.3%/degree C and 0.6%/degree C are automatically activated for the 6026 and 6136, respectively, when
these sensors are activated in the Sensor menu.
MEASUREMENT AND CALIBRATION PRECAUTIONS
(1) For best results, use only freshly prepared or purchased turbidity standards. Degradation of standards
can occur on standing, particularly formazin prepared from dilution of concentrated suspensions such as
Hach 4000 NTU standard.
(2) If unusually high or jumpy readings are observed during the calibration protocol, it is likely that there
are bubbles on the optics. Manually activating the wiper of the 6026 or 6136 from a computer or 650
MDS keypad removes these bubbles.
(3) When calibrating the 6136 sensor, be aware of the fact that precautions must be taken to avoid
interference of the bottom of the calibration vessel. Instructions for two methods of calibrating the 6136
sensor are provided in Section 2.6.1 of this manual. The best solution to the interference problem,
however, is to purchase the 655488 Extended Calibration Cup Sleeve which completely eliminates the
issue.
The sonde turbidity system allows the user to either observe these real turbidity events (while obtaining
somewhat jumpy readings) or to apply a mathematical filter to the raw data so that the NTU output may be
more reflective of the overall cloudiness of the environmental sample. From the Advanced|Data Filter
menu of the sonde software, the user can activate the data filter that is specific to turbidity and “fine tune”
its performance. For typical sampling and monitoring applications, YSI recommends that the Data Filter
settings be selected as follows: Enabled -- On; Wait for Filter -- Off; Time Constant = 12; Threshold =
0.010.
For most unattended sampling applications, selection of the above filter settings should also be appropriate.
However, an additional capability is also available which enhances the elimination of spurious single point
spikes from the logged data and thus allows for a better presentation of the average turbidity during the
deployment. This “Turb Spike Filter” is activated/deactivated in the Advanced|Sensor menu. Its
capability is further described in Section 2.9.8, Advanced. YSI recommends the use of this feature for all
YSI Incorporated
Drinking Water Monitoring Systems Operation Manual
5-15
Principles of Operation
Section 5
unattended studies. The user should determine from experience whether its activation is also appropriate
for spot sampling studies at particular sites.
5.12
CHLOROPHYLL
INTRODUCTION
Chlorophyll, in various forms, is bound within the living cells of algae, phytoplankton, and other plant
matter found in environmental water. Chlorophyll is a key biochemical component in the molecular
apparatus that is responsible for photosynthesis, the critical process in which the energy from sunlight is
used to produce life-sustaining oxygen. In general, the amount of chlorophyll in a collected water sample
is used as a measure of the concentration of suspended phytoplankton, the magnitude of which can
significantly affect the overall quality of the water.
The use of the measurement of phytoplankton as an indicator of water quality is described in Section 10200
A. of Standard Methods for the Examination of Water and Wastewater. The classical method of
determining the quantity of chlorophyll at a particular site is to collect a fairly large water sample and
analyze it in the laboratory. The procedure involves filtration of the sample to concentrate the chlorophyll
containing organisms, mechanical rupturing of the collected cells, and extraction of the chlorophyll from
the disrupted cells into the organic solvent, acetone. The extract is then analyzed by either a
spectrophotometric method using the known optical properties of chlorophyll or by high performance
liquid chromatography (HPLC). This general method is detailed in Section 10200 H. of Standard Method
and has been shown to be accurate in multiple tests and applications as long as a competent laboratory
analyst carries out the protocol. The procedure is generally accepted for reporting in scientific literature.
The method is time-consuming, however, and usually requires an experienced, efficient analyst to generate
consistently accurate and reproducible results. It also does not lend itself readily to continuous monitoring
of chlorophyll, and thus phytoplankton, since the collection of samples at reasonable time intervals, e.g.,
every hour, would be extremely tedious.
YSI has developed the YSI 6025 chlorophyll sensor for the determination of chlorophyll in spot sampling
and continuous monitoring applications. It is based on an alternative method for the measurement of
chlorophyll which overcomes these disadvantages, albeit with the potential loss of accuracy. In this
procedure, chlorophyll is determined in vivo, i.e., without disrupting the cells as in the extractive analysis.
The YSI 6025 chlorophyll sensor is designed for these in vivo applications and its use allows the facile
collection of large quantities of chlorophyll data in either spot sampling or continuous monitoring
applications. It is important to remember, however, that the results of in vivo analysis will not be as
accurate as those from the certified extractive analysis procedure.
The limitations of the in vivo method are outlined below and should be carefully considered before making
chlorophyll determinations with your YSI sonde and sensor. Some of the sources of inaccuracy can be
minimized by combining the data from the YSI 6025 with data from extractive analysis of a few samples
acquired during a sampling or monitoring study. However, the in vivo studies will never replace the
standard procedure. Rather, the estimates of chlorophyll concentration from the easy-to-use YSI
chlorophyll system are designed to complement the more accurate (but more difficult to obtain) results
from more traditional methods of chlorophyll determination.
MEASUREMENT OF CHLOROPHYLL IN VIVO
One key characteristic of chlorophyll is that it fluoresces, that is, when irradiated with light of a particular
wavelength, it emits light of a higher wavelength (or lower energy). The ability of chlorophyll to fluoresce
YSI Incorporated
Drinking Water Monitoring Systems Operation Manual
5-16
Principles of Operation
Section 5
is the basis for all commercial fluorometers capable of measuring the analyte in vivo. Fluorometers of this
type have been in use for some time. These instruments induce chlorophyll to fluoresce by shining a beam
of light of the proper wavelength into the sample, and then measuring the higher wavelength light which is
emitted as a result of the fluorescence process. Most chlorophyll systems use a light emitting diode (LED)
as the source of the irradiating light that has a peak wavelength of approximately 470 nm. LEDs with this
specification produce radiation in the visible region of the spectrum with the light appearing blue to the
eye. On irradiation with this blue light, chlorophyll resident in whole cells emits light in the 650-700 nm
region of the spectrum. To quantify the fluorescence the system detector is usually a photodiode of high
sensitivity that is screened by an optical filter that restricts the detected light. The filter prevents the 470 nm
exciting light from being detected when it is backscattered off of particles in the water. Without the filter,
turbid (cloudy) water would appear to contain fluorescent phytoplankton, even though none were present.
The following diagram can be used to better understand the principles of the YSI system.
Light Source
470 nm
Photodetector
Optical Filter
Optical Fiber
Most commercial fluorometers fit into two categories. In the first category are benchtop instruments that
generally have superior optical flexibility and capability but are relatively expensive and are often difficult
to use in the field. In the second category are sonde-type fluorometers that have a fixed optical
configuration, but are less expensive, can be more easily used in the field, and are usually compatible with
data collection platforms. The use of a pump is recommended for some sonde fluorometers and this can
result in the need for large capacity batteries for field use.
The unique YSI chlorophyll system available as an option for use with YSI sondes consists of a probe
which is similar in concept to the sonde-type fluorometers, but is much smaller, making it compatible with
the probe ports of the YSI 6920DW sonde. The output of the sensor is automatically processed via the
sonde software to provide readings in either generic fluorescence units (percent full scale; % FS) or µg/L of
chlorophyll. No pump is required for the YSI system allowing the sensor to operate off of either the sonde
internal batteries or the batteries in the YSI 650 MDS display/logger. Like the YSI 6026 and 6136 turbidity
probes, the YSI 6025 chlorophyll probe is equipped with a mechanical wiper to periodically clean the
optical face either by manual or automatic activation. With these features, the YSI chlorophyll sensor
provides the same level of performance as the sonde fluorometers, but is much easier to use and can be
deployed in environmental water for several weeks without the need for service. In addition, the probe will
be a component in sondes that can acquire up to ten other parameters simultaneously with chlorophyll,
rather just providing the single parameter.
YSI Incorporated
Drinking Water Monitoring Systems Operation Manual
5-17
Principles of Operation
Section 5
CALIBRATION METHODS -- GENERAL
As described in Section 2 of this manual, the sonde software offers the option of either zeroing the generic
fluorescence parameter (% FS) or of performing 1-point, 2-point, or 3-point calibration procedures in µg/L
of chlorophyll. For most applications, a 2-point calibration at 0 and middle range (e.g., ca. 100 µg/L) is
sufficient. Slight non-linearities of the system can be overcome with a 3-point calibration across the
normally encountered environmental chlorophyll range (0-400 µg/L). If the range of chlorophyll content in
the environmental sample is well known, standards of any chlorophyll values can be utilized in either 3point or 2-point routines. However, one of the standards must be 0 µg/L and this standard must be first in
the calibration sequence.
For calibration of the YSI chlorophyll system, only one type of standard will assure accurate field
readings: a suspension of phytoplankton of known chlorophyll content. The chlorophyll content of this
suspension should be determined by the extractive analysis procedure described in Standard Methods. Most
users will not have this analyzed plankton suspension available prior to field studies for use in the 2-point
calibration protocol resident in the sonde software. Thus, the best “calibration” method usually comprises the
following steps:
1.
2.
3.
4.
5.
6.
Prior to use in the field, place the sensor in clean water and perform a 1-point calibration at 0 ug/L.
Immerse the sonde in a dye standard (see below) and record the reading. Note that you are not
“calibrating” to the dye reading, only checking its value relative to the default sensitivity of the sensor.
While making your field readings (sampling or unattended studies), collect a few grab samples and record
the date/time and location where they were acquired.
On return to the laboratory, perform extractive analyses for chlorophyll on the grab samples and record
the results for later use.
After the study is complete, place your YSI chlorophyll data in the column of a spreadsheet and place
your laboratory data in an adjacent column for comparison. Calculate ratios of field to laboratory results
for each grab sample point and then average the results to produce a ratio for adjustment (or
‘postcalibration”) of your field results into accurate chlorophyll readings (relative to extractive analysis).
Use the calculating power of the spreadsheet to multiply all of your field readings by the correction ratio
to obtain the best possible accuracy for your 6025 data.
0A variation of this method is to perform a 2-point calibration prior to deployment using a clear water and a
dye standard, setting apparent chlorophyll equivalent of the dye standard to the value shown in the tables
below. However, it must be emphasized that this technique does not increase the accuracy of the chlorophyll
sensor significantly over the simple 1-point calibration recommended above – the user still must collect grab
sample and perform laboratory analysis to be assured of meaningful chlorophyll values. The primary utility
of the dye is to check for sensor drift during deployment by reanalyzing the dye solution after sonde recovery.
The use of the 2-point dye calibration procedure may make it easier to quantify the predeployment dye value
and, if so, may be preferable. Remember, however, that no real enhancement of sensor accuracy is attained
by using the dye as a calibrant.
PREPARATION OF RHODAMINE WT SOLUTIONS FOR CHECKING
SENSOR DRIFT
RHODAMINE WT STANDARD SOLUTION
CAUTION: Be certain to read and follow all the safety instructions and MSDS documentation which is
supplied with the dye before proceeding. Remember that only trained personnel should handle
chemicals.
YSI Incorporated
Drinking Water Monitoring Systems Operation Manual
5-18
Principles of Operation
Section 5
Use the following procedure to prepare a Rhodamine WT solution for use as a sensor stability check reagent.
1.
Rhodamine WT dye is usually purchased in solution form and can vary somewhat in nominal
concentration. YSI uses Rhodamine WT from the supplier noted below and recommends that the user
purchase this exact item if possible. The solution is approximately 2 % in Rhodamine WT.
Fluorescent FWT Red Dye (Lot# 257201; 16 Fl. Oz.)
Kingscote Chemicals
9676 N. Looney Road
Piqua, OH 45356
1-800-394-0678
Fax: 937-773-7994
2.
Accurately transfer 5.0 mL of the Rhodamine WT solution into a 1000 mL volumetric flask. Fill the
flask to the volumetric mark with deionized or distilled water and mix well to produce a solution that is
approximately 100 mg/L of Rhodamine WT. Transfer this standard to a glass bottle and retain it for
future use.
3.
Accurately transfer 5.0 mL of the solution prepared in the above step to a 1000 mL volumetric flask and
then fill the flask to the volumetric mark with deionized or distilled water. Mix well to obtain a solution,
which is 0.5 mg/L in water (a 200:1dilution of the concentrated solution).
4.
Store the concentrated standard solution produced in (6) above in a glass bottle in a refrigerator to retard
decomposition. The dilute standard prepared in the previous step should be used within 24 hours of its
preparation.
When rhodamine standards are required in the future, perform another dilution of the concentrated rhodamine
solution after warming it to ambient temperature. Our experience has indicated that the concentrated solution
that has been kept at cold temperatures is much more stable than the dilute solution stored at room
temperature.
It is well known that the intensity of the fluorescence of many dyes shows an inverse relationship with
temperature. The effect must also be accounted for when “calibrating” the YSI chlorophyll sensor with
rhodamine WT. Enter the calibration value from the table below corresponding to the temperature of the
standard.
WARNING: The “Chl Tempco” factor in the Advanced|Sensor menu, MUST BE SET TO ZERO,
when calibrating with Rhodamine WT.
Table. Approximate algal chlorophyll equivalent of 0.5 mg/L Rhodamine WT as a function of temperature.
T, C
30
28
26
24
22
20
ug/L Chl to
Enter
100
103
106
110
113
118
YSI Incorporated
T, C
18
16
14
12
10
8
Ug/L Chl to
Enter
122
126
131
136
140
144
Drinking Water Monitoring Systems Operation Manual
5-19
Principles of Operation
Section 5
REMEMBER: The use of rhodamine WT for “calibration is only an approximation. To assure
accurate readings from the 6025 sensor, the user must relate the field fluorescence readings to data
from extractive analysis samples as described above. YSI does not provide an accuracy specification for
chlorophyll due to these limitations.
EFFECT OF TEMPERATURE ON READINGS
While the effect of temperature on the chlorophyll sensor itself is very small, YSI experiments have
indicated that the fluorescence of phytoplankton suspensions can show significant temperature dependence.
For example, the apparent chlorophyll content of our laboratory test samples of algae increased from 185 to
226 µg/L when the temperature was dropped from 21 °C to 1 °C even though no change in phytoplankton
content took place. In the absence of compensation, this effect would obviously result in errors in field
chlorophyll readings if the site temperature were significantly different from the calibration temperature.
This temperature error can be reduced by employing a chlorophyll temperature compensation routine (“Chl
tempco”) resident in the sonde software under the Advanced|Sensor menu.
From our studies, it appears that entry of a value of 1 to 2 % per degree C for “Chl tempco” is appropriate
to partially account for changes in the fluorescence of environmental phytoplankton with temperature. This
value can be estimated in the above example as follows:
Change in Temperature = 21–1 = 20 °C
Change in Fluorescence = 226-185 = 41 µg/L
% Change in Fluorescence = (41/185) x 100 = 22.1
Chl Tempco Factor = 22.1/20 = 1.11 % per degree °C
Note that the use of this empirically derived compensation does not guarantee accurate field readings since
each species of phytoplankton is likely to be unique with regard to the temperature dependence of its
fluorescence. Changes in fluorescence with temperature are a key limitation of the in vivo fluorometric
method (see below) which can only be reduced, not eliminated, by this compensation. In general, the best
way to minimize errors is to calibrate with phytoplankton standards of known chlorophyll content that are
as close as possible in temperature to that of the environmental water under investigation.
EFFECT OF FOULING ON OPTICAL MEASUREMENTS
Field optical measurements are particularly susceptible to fouling, not only from long term build up of
biological and chemical debris, but also to shorter term formation of bubbles from outgassing of the
environmental water. These bubbles can sometimes be removed in short term sampling applications by
simply agitating the sonde manually. For studies longer than a few hours where the user is not present at
the site, the quality of the chlorophyll data obtained with a fluorescence sensor that has no capability of
mechanical cleaning is likely to be compromised. The YSI 6025 probe is equipped with a mechanical
wiper that makes it ideal for unattended applications. The wiper can be activated in real-time during
discrete sampling operations or will function automatically just before each sample is taken during long
term unattended monitoring studies. The number of wiper movements and the frequency of the cleaning
cycle for the unattended mode can be set in the sonde software. Generally, one wiper movement is
sufficient for most environmental applications, but in media with particularly heavy fouling, additional
cleaning cycles may be necessary.
EFFECT OF TURBIDITY ON CHLOROPHYLL READINGS
As described above, the filters in front of the photodiode in the YSI 6025 chlorophyll probe prevent most of
the 470 nm light which is used to excite the chlorophyll molecules from reaching the detector after being
backscattered off of non-fluorescent particles (turbidity) in environmental water. However, the filter system
YSI Incorporated
Drinking Water Monitoring Systems Operation Manual
5-20
Principles of Operation
Section 5
is not perfect and a minor interference on chlorophyll readings from suspended solids may result.
Laboratory experiments indicate that a suspension of typical soil measured with a YSI 6026 sensor will
have a turbidity interference characterized by a factor of about 0.03 µg/L per NTU. For example, the
turbidity of the water must be above 100 NTU to produce an apparent chlorophyll reading equal to 3 µg/L.
In very cloudy water, the user may wish to use the independently-determined turbidity value and the above
compensation factor to correct measured chlorophyll values using, for example, a spreadsheet.
LIMITATIONS OF IN VIVO CHLOROPHYLL MEASUREMENTS
As noted above, the measurement of chlorophyll from in vivo fluorescence measurements will always be
less reliable than determinations made on molecular chlorophyll that has been extracted from the cells
using the procedures described in Standard Methods. This section describes some of the known problems
with in vivo chlorophyll measurement.
INTERFERENCES FROM OTHER FLUORESCENT SPECIES: The analytical methods described in
Standard Methods for chlorophyll involve disruption of the living organisms present in suspension,
followed by extraction of molecular chlorophyll into a homogeneous solution in an organic solvent.
Acidification of the extract helps to minimize the interferences caused by a number of other, nonchlorophyll species. In addition, readings can be taken at various wavelengths on a spectrophotometer to
differentiate between the various forms of chlorophyll (a, b, c) and pheophytin a.
In contrast to this fairly controlled situation, all in vivo sensors operate under whole-cell, heterogeneous
conditions where the sensor will measure, at least to some degree, everything which fluoresces in the
region of the spectrum above 630 nm when irradiated with 470 nm light. Therefore, the sensor is really
quantifying overall fluorescence under these optical conditions, rather than chlorophyll specifically. While
it is probable that most of the fluorescence is due to suspended plant and algal matter and that much of the
fluorescence from this biomass is due to chlorophyll, it is impossible to exclude interferences from other
fluorescent species using the approach described above.
Note that in vivo fluorometers usually cannot differentiate between the different forms of chlorophyll.
LACK OF CALIBRATION REAGENTS: The usual reagents which are used for the calibration of
fluorometric measurements for chlorophyll after extraction into organic solvents are purchased as “purified
chlorophyll a” from chemical supply vendors such as Sigma. These standards are not soluble in aqueous
media and, even if they were, their fluorescence is unlikely to be the same as when the chlorophyll is
present in the whole living cell. Therefore, for even a semiquantitative calibration, the user needs a
“substitute” standard such as Acridine Orange (see above) to provide a method for estimating the
sensitivity of the sensor. Field readings based on this type of calibration will provide only an estimate of
chlorophyll in environmental water where the measurement is taken on whole cell suspensions in vivo. The
calibration standard that provides the best measure of accuracy for in vivo chlorophyll sensors is a portion
of a phytoplankton suspension that has been analyzed for chlorophyll by the extractive procedure. We
recommend the use of this procedure and further recommend that the phytoplankton suspension be taken
from the site being monitored so that the species producing the fluorescence in the standard are as close as
possible to the field organisms. To truly assess data reliability in a long term monitoring study, grab
samples should be taken periodically, e.g. weekly, and analyzed in the laboratory as the study progresses.
These data can then be used to “postcalibrate” the readings logged to the instrument during the study,
perhaps using a spreadsheet for the simple mathematical treatment. In any case, getting quantitative
chlorophyll data from any in vivo fluorometric sensor is much more difficult than with most other
environmental sensors. For this reason, it is difficult to provide an accuracy specification for chlorophyll
measurement made with in vivo fluorometers and therefore no accuracy specification is quoted for the YSI
6025.
YSI Incorporated
Drinking Water Monitoring Systems Operation Manual
5-21
Principles of Operation
Section 5
EFFECT OF CELL STRUCTURE, PARTICLE SIZE, AND ORGANISM TYPE ON IN VIVO
READINGS: Even if the only fluorescent species present for in vivo measurements were chlorophyll, and
reliable calibration standards were available, its absolute quantification would probably still be difficult
because samples are not homogeneous. Differing species of algae with differing shape and size will likely
fluoresce differently even if the type and concentration of chlorophyll are identical and this significantly
limits the accuracy of in vivo measurements.
EFFECT OF TEMPERATURE ON PHYTOPLANKTON FLUORESCENCE: As noted above, YSI
experiments indicate that phytoplankton fluorescence increases as temperature decreases. Thus, readings
taken on a phytoplankton suspension at cold temperature would erroneously indicate the presence of more
phytoplankton than when the suspension is read at room temperature. Unless this effect is taken into
account, most field readings will be somewhat in error, since the field temperature will differ from the
temperature of calibration. The use of the “Chl Tempco” factor found in the Advanced|Sensor menu will
help to reduce this error, but must be used with caution since each species of phytoplankton is likely to
have a slightly different temperature dependence.
EFFECT OF LIGHT ON PHYTOPLANKTON FLUORESCENCE: It is well documented in the
literature that the fluorescence of chlorophyll resident in phytoplankton can be inhibited by light. This
“photoinhibition” is confirmed by empirical data that indicate that, at constant phytoplankton level, the
fluorescent signal can change significantly on a diurnal schedule, showing less fluorescence during the day
and more fluorescence at night. It is clear that this effect would produce errors in the absolute values of
chlorophyll unless it were accounted for by the user.
The chlorophyll section of Standard Methods substantiates these limitations along with application notes
that are offered by current fluorometer manufacturers. The limitations result in the realization that any in
vivo “chlorophyll” sensor will be much less quantitative than any of the other sensors offered for use with
our sondes.
MEASUREMENT AND CALIBRATION TIPS
1.
For best results, analyze field samples to be used for “calibration” of the sensor as soon as possible
after collection.
2.
If unusually high or jumpy readings are observed during calibration, it is likely that there are bubbles
on the optics. The surface should be cleaned by manually activating the wiper before confirming the
calibration.
3.
The output of the YSI fluorescence sensor is susceptible not only to the overall phytoplankton
concentration in the environmental medium, but also to the size and rate of movement of the
suspended particles that pass across the optics on the probe face. Thus, although the phytoplankton
content of an environmental sample may appear to the eye to be relatively stable, the displayed
chlorophyll reading can vary significantly depending on the nature of the particles in the optical path at
the instant of measurement. In a discrete sample study of environmental water, for example, the
variability of the output can be significant. This apparent jumpiness is not observed in dye standards,
since these are homogeneous solutions containing no suspended matter.
4.
The sonde chlorophyll system allows the user to apply a mathematical filter to the raw data so that the
sensor output may be more representative of the average phytoplankton content of the environmental
sample. From the 8-Advanced menu of the sonde software, the user can activate the data filter and
adjust its performance. For typical sampling and monitoring applications, YSI recommends that the
Data Filter settings for chlorophyll be selected as follows: Enabled -- On; Wait for Filter -- Off;
Chlorophyll Time Constant = 12; Chlorophyll Threshold = 1. The advantage of the filter is a more
stable display of chlorophyll readings.
YSI Incorporated
Drinking Water Monitoring Systems Operation Manual
5-22
Principles of Operation
5.14
Section 5
RHODAMINE WT
INTRODUCTION AND PRINCIPLE OF OPERATION
Rhodamine WT is a red dye that is commonly used in stream flow studies. The amount of the species at
various points (horizontal and vertical) in the water under examination is determined by utilizing the fact
that rhodamine WT fluoresces when irradiated with the proper wavelength of light and thus the YSI 6130
rhodamine WT sensor works on the same principles as described above for the 6025 chlorophyll sensor.
As for chlorophyll, rhodamine WT fluoresces, that is, when irradiated with light of a particular wavelength,
it emits light of a higher wavelength (or lower energy). The ability of rhodamine WT to fluoresce is the
basis for all commercial fluorometers capable of measuring the analyte in situ. Fluorometers of this type
have been in use for some time. These instruments induce rhodamine WT to fluoresce by shining a beam of
light of the proper wavelength into the sample, and then measuring the higher wavelength light which is
emitted as a result of the fluorescence process. Most rhodamine systems use a light emitting diode (LED)
as the source of the irradiating light that has a peak wavelength of approximately 540 nm. LEDs with this
specification produce radiation in the visible region of the spectrum with the light appearing green to the
eye. On irradiation with this green light, rhodamine WT in the water emits visible light with a higher
wavelength than that of the exciting beam, i.e. the rhodamine fluoresces. To quantify this fluorescence, the
system detector is usually a photodiode of high sensitivity that is screened by an optical filter that restricts
the detected light. The filter minimizes (a) the exciting light being detected when it is backscattered off of
particles in the water and (b) the interference from other fluorescent species such the chlorophyll in
phytoplankton. Without the filter, turbid (cloudy) water or water with high levels of phytoplankton would
appear to contain rhodamine WT, even though none were present. The following diagram can be used to
better understand the principles of the YSI rhodamine WT system.
Light Source
540 nm
Photodetector
Optical Filter
Optical Fiber
Field optical measurements are particularly susceptible to fouling, not only from long term build up of
biological and chemical debris, but also to shorter term formation of bubbles from outgassing of the
environmental water. These bubbles can generally be removed in short term sampling application by
simply agitating the sonde manually. However, for studies longer than a few hours where the user is not
YSI Incorporated
Drinking Water Monitoring Systems Operation Manual
5-23
Principles of Operation
Section 5
present at the site, the quality of the data obtained with a rhodamine WT sensor that has no capability of
mechanical cleaning may be compromised. Like the 6026 /6136 turbidity and 6025 chlorophyll probes
described above, the 6130 rhodamine WT probe is equipped with a mechanical wiper that makes it ideal for
unattended applications. The wiper can be activated in real-time during discrete sampling operations or
will function automatically during long term unattended sampling studies. The number of wiper
movements and the frequency of the cleaning cycle for the unattended mode can be set in the sonde
software. Generally one movement is sufficient for most environmental application, but in media with
particularly heavy fouling, additional cleaning cycles may be necessary.
CALIBRATION AND EFFECT OF TEMPERATURE
The sonde software offers the option of 1 point, 2 point, or 3 point calibrations procedures. For most
applications, a 2-point calibration at 0 and 100 ug/L is sufficient. However, for maximum accuracy over
the entire 0-200 ug/L range of the sensor, a 3-point calibration procedure can slightly enhance the accuracy
of the sensor. Note that YSI does not offer rhodamine WT standards, but does suggest a vendor for userproduction of standards and, later in this section, provides instructions for preparing a solution which is 100
ug/L in Rhodamine WT.
While the effect of temperature on the rhodamine sensor and electronics is small, the fluorescence of
rhodamine WT changes significantly with temperature. The combination of the two factors is
automatically taken into account by the sonde software providing temperature compensated readings.
RHODAMINE WT STANDARD SOLUTION – PREPARATION AND USE
CAUTION: Before using concentrated rhodamine WT solution to prepare standards, be certain to read
the safety instructions provided by the supplier with this chemical. Remember that only trained
personnel should handle chemicals.
PREPARATION
Use the following procedure to prepare a 100 ug/L solution that can be used to calibrate your rhodamine WT
sensor for field use:
1.
We recommend that rhodamine WT concentrate be purchased from Keystone Aniline Corporation, 2501
W. Fulton Street, Chicago, IL 60612 (Telephone: 312-666-2015) under the name KEYACID
RHODAMINE WT LIQUID (Part # 70301027). As purchased, the solution is approximately 20 %
rhodamine WT by weight, i.e., 200 g/L.
2.
Accurately weigh 0.500 g of the 20 % rhodamine concentrate, quantitatively transfer the viscous liquid to
a 1000-mL volumetric flask and fill the flask to the top graduation. This solution contains 100 mg of
rhodamine WT per 1000 mL of water.
3.
Accurately transfer 1.0 mL of the solution prepared in the above step to a 1000 mL volumetric and then
fill the flask to the top graduation with purified water. Mix well to obtain a solution that is 100 ug/L
(0.10 mg/L) in water (a 1000:1 dilution of the concentrated solution).
YSI Incorporated
Drinking Water Monitoring Systems Operation Manual
5-24
Principles of Operation
4.
Section 5
Store the concentrated standard solution in a darkened glass bottle in a refrigerator to retard
decomposition. The dilute standard prepared in the previous step should be used within 5 days of its
preparation.
When rhodamine WT standards are required in the future, perform another dilution of the concentrated dye
solution after warming it to ambient temperature. Our experience has indicated that the concentrated solution
that has been kept at cold temperatures is much more stable than the dilute solution stored at room
temperature.
EFFECT OF TURBIDITY ON RHODAMINE WT READINGS
As described above, the filters in front of the photodiode in the YSI 6130 rhodamine probe prevent most of
the green light which is used to excite the rhodamine molecules from reaching the detector after being
backscattered off of non-fluorescent particles (turbidity) in environmental water. However, the filter system
is not perfect and a minor interference on rhodamine WT readings from suspended solids may result.
Laboratory experiments indicate that a suspension of typical soil measured with a YSI 6026 sensor will
have turbidity interference characterized by a factor of about 0.03 µg/L per NTU. For example, the
turbidity of the water must be above 100 NTU to produce an apparent rhodamine WT reading equal to 3
µg/L. In very cloudy water, the user may wish to use the independently-determined turbidity value and the
above compensation factor to correct measured chlorophyll values using, for example, a spreadsheet.
EFFECT OF CHLOROPHYLL ON RHODAMINE WT READINGS
While the green LED used in the rhodamine WT sensor is not ideal for excitation of the chlorophyll in
phytoplankton, some fluorescence of environmental chlorophyll will always be induced by the rhodamine
sensor. Because the filter system for the rhodamine photodiode is not perfect in excluding chlorophyll
fluorescence, a minor interference on rhodamine WT readings from phytoplankton may result. Laboratory
experiments indicate that a suspension of phytoplankton measured with a YSI 6025 sensor will have
chlorophyll interference characterized by a factor of about 0.10 µg/L Rhodamine WT per ug/L of
chlorophyll. For example, the chlorophyll content of the water must be above 30 ug/L chlorophyll to
produce an apparent rhodamine WT reading equal to 3 µg/L. In water with a high algal content, the user
may wish to use the independently-determined chlorophyll value and the above compensation factor to
correct measured rhodamine values using, for example, a spreadsheet.
YSI Incorporated
Drinking Water Monitoring Systems Operation Manual
5-25
Principles of Operation
YSI Incorporated
Section 5
Drinking Water Monitoring Systems Operation Manual
5-26
Troubleshooting
Section 6
SECTION 6 TROUBLESHOOTING
This section contains troubleshooting tables that will be helpful to identify the causes of the most common
difficulties that may occur while operating the YSI 6-Series Sondes. The Symptom column describes the
type of difficulty that you might experience. The Possible cause column describes the conditions that
might cause the stated symptom. The Action column provides simple steps that can be followed to correct
for the "possible cause" and cure the "symptom" being experienced. The column entitled Ref is the number
of the reference section and subsection in the manual where you may find additional information.
Troubleshooting problems have been categorized into four general areas.
•
•
•
Calibration Error Messages
Sonde Communication
Sensor Performance
If you need assistance that this Troubleshooting section can not provide, please contact YSI or your
authorized dealer. See Appendix C, Accessories and Calibration Standards, for specific contact
information.
6.1 CALIBRATION ERRORS
There are only three Calibration Error messages that are possible and are listed below, instead of in the
troubleshooting table. Only two of the error messages are related to sensor performance.
High Free Chlorine Charge: This message indicates a malfunction in the free chlorine sensor that is
generally due to the roughness of the electrodes on the surface of the probe face. The charge associated
with the chlorine sensor must be in the range 0 to 75 or the error message will appear when calibration is
attempted. If this error message is encountered, remove the free chlorine probe from the sonde and
resurface it according to the instructions in Section 2.3.1 of this manual. Then install a new membrane and
activate the sensor as described in the same section. After resurfacing, allow the sensor to pulse in the
Run mode for at least 1 hour, during which time the DO charge may be expected to drop in value if the
sensor is still functional. If resurfacing does not result in a lowering of the charge, contact YSI Customer
Service for additional help.
Out of Range: This message indicates that the output of the sensor being calibrated does not conform to
the normal range for this parameter. This problem could be due to either a malfunctioning sensor or to a
calibration solution that is out of specification. If this error message is encountered, first insure that your
standards for pH, ORP, ammonium, nitrate, chloride, conductivity, and turbidity have not been
contaminated and that your free chlorine sensor is in flowing tap water in a YSI flow cell. If an Out of
Range error is experienced for free chlorine, also be certain that you have correctly determined the chlorine
content of your flow cell effluent with a DPD colorimetric analysis and that your colorimeter is working
properly. Perform replicate analyses of the effluent to assure correct chlorine content. Also be certain
that you have entered the correct value for the calibration solution. If the calibration error message
continues to occur, change the membrane, reactivate the sensor, and retry the calibration. If still
unsuccessful, contact YSI Customer Service to determine whether the sensor in question needs to be
factory-serviced or replaced.
Illegal Entry: This message simply indicates that your keyboard input does not conform to the accepted
format for this parameter. For example, you may have entered the “letter O” instead of “zero” for a
calibration value. Return to the desired parameter in the Calibrate menu and repeat the calibration entry,
being certain to enter only numbers.
YSI Incorporated
Drinking Water Monitoring Systems Operations Manual
6-1
Troubleshooting
Section 6
The following troubleshooting tables can help you if you encounter problems with software,
communication protocol, or sensor malfunctions other than calibration errors.
6.2 SONDE COMMUNICATION PROBLEMS
SYMPTOM
Cannot communicate
with sonde
POSSIBLE CAUSE
Sonde not powered
Cable connection is loose
Damaged connectors
Com port not selected
Scrambled data
Unmatched baud rate between
host and sonde
Host is too slow
Interface cable failure
Internal failure
YSI Incorporated
ACTION
Check 12 vdc source
Check both ends of cable; secure
connectors
Check pins at both ends, insure
they are straight, dry and clean.
Change to other com port, other
peripheral on the same port
(Internal mouse). Try other PC,
650 display/logger or dumb
terminal
Match the baud rate
Use faster computer
Check cable for damage. If
necessary, return for service
Return sonde for service
Drinking Water Monitoring Systems Operations Manual
REF
7.2
2.4.3
2.4.3
7
7
6-2
Troubleshooting
Section 6
6.3 SENSOR PERFORMANCE PROBLEMS
SYMPTOMS
Free Chlorine reading
unstable or inaccurate
pH, ORP, chloride,
ammonium, or nitrate
readings are unstable or
inaccurate. Error
messages appear during
calibration.
POSSIBLE CAUSE
Probe not properly calibrated
Membrane not properly installed or
may be punctured
DO probe electrodes require
cleaning
Water in probe connector
Chlorine Charge too high >30
1. Anode tarnished
ACTION
Follow chlorine cal procedures
Follow 6572 setup procedure
REF
2.6.1
2.3.1
Follow cleaning procedure. Use
6035 maint. kit
Dry connector; reinstall probe
Follow cleaning procedure. Use
6035 maintenance kit
2.10.2
DO probe has been damaged
Internal failure
Probe requires cleaning
Probe requires calibration
Replace 6572 probe
Return sonde for service
Follow probe cleaning procedure
Follow cal procedures
pH probe reference junction has
dried out from improper storage.
Water in probe connector
Probe has been damaged
Calibration solutions out of spec or
contaminated with other solution
ORP fails Zobell check
Soak probe in tap water or buffer
until readings become stable
Dry connector; reinstall probe
Replace probe
Use new calibration solutions
8/C
8
2.10.2
2.6.1
3.7.4
2.10.2
Internal failure
YSI Incorporated
Take into account temperature
dependence of Zobell solution
readings
Return sonde for service
Drinking Water Monitoring Systems Operations Manual
2.3.2
2.7
2.10.2
2.3.2
8/C
C
5.3
8
6-3
Troubleshooting
Section 6
Depth unstable or
inaccurate
Conductivity unstable
or inaccurate. Error
messages appear during
calibration.
Installed probe has no
reading
Temperature, unstable
or inaccurate
Turbidity probe
unstable or inaccurate.
Error messages appear
during calibration
YSI Incorporated
Depth sensor has not been zeroed
Depth sensor access hole is
obstructed
Depth sensor has been damaged
Internal failure
Conductivity improperly
calibrated.
Conductivity probe requires
cleaning
Conductivity probe damaged
Calibration solution out of spec or
contaminated
Internal failure
Calibration solution or sample
does not cover entire sensor.
The sensor has been disabled
Water in probe connector
Probe has been damaged
Report output improperly set up
Internal failure
Water in connector
Probe has been damaged
Probe requires cleaning.
Probe requires calibration
Probe has been damaged
Water in probe connector
Calibration solutions out of spec
Wiper is not turning or is not
synchronized.
Wiper is fouled or damaged.
Internal failure.
Follow depth zero procedure
Follow depth cleaning procedure
2.6.1
2.10.2
Return sonde for service
Return sonde for service
Follow cal procedure
8
8
2.6.1
Follow cleaning procedure
2.10.2
Replace probe
Use new calibration solution
8/C
C
Return sonde for service
Immerse sensor fully.
8
2.6.1
Enable sensor
Dry connector; reinstall probe
Replace the 6560 probe
Set up report output
Return sonde for service.
Dry connector; reinstall probe
Replace the 6560 probe
Follow probe cleaning procedure
Follow cal procedures
Replace probe
Dry connector; reinstall probe
Use new calibration solutions
Activate wiper. Assure rotation.
Make sure setscrew is tight.
Clean or replace wiper.
Return probe for service.
2.9.5
2.10.1
8/C
2.9.4
8
2.10.2
8/C
2.10.2
8.4
8
2.3.2
C
2.10.2
Drinking Water Monitoring Systems Operations Manual
2.10.2
8
6-4
Communications
Section 7
SECTION 7 COMMUNICATION
This section describes the communication protocols that the Sondes use to communicate with the host
system. Section 7.1 gives a brief overview of the communication ability of the Sondes. The remaining
sections describe available hardware and software features.
7.1 OVERVIEW
The sondes communicate via a serial port that can be configured as either a SDI-12, or a 3-wire
RS-232 interface. The normal mode of operation for the sonde is RS-232, with the following
configurations:
Baud rate:
Data Bit:
Parity:
Handshake:
300, 600, 1200, 2400, 4800, 9600
8
None
None
For further detail into the sondes RS-232 and SDI-12 implementations, see Sections 7.3 and 7.4
respectively.
With these configurations, the Sonde is capable of interfacing to a variety of devices from a
“dumb” terminal to numerous data collection platforms.
7.2 HARDWARE INTERFACE
Connection from the Sonde to the host computer is provided using the YSI 6095B MS-8 to DB-9 female
adapter. This 6095B then connects to the standard DB-9 male connector on the host computer. The Sonde
PC interface cable is wired for direct connection to a DTE device. The following table defines the interface
circuits. The signals and their directions are defined with respect to use of the Sonde with the 6095B
adapter.
Wire
Color
Pin
Description
DB-9 MS-4 MS-8
Yellow
Orange
Green
Grey
Blue
Red
Black
Purple
Bare
RS232 TX
RS232 RX
Alarm
RTS
CTS
+ 12V DC
GND
SDI-12
Shield
2
3
---------9
5
-------
YSI Incorporated
---------------A
C
B
----
C
D
E
G
H
A
B
F
B
Drinking Water Monitoring Systems Operations Manual
7-1
Communications
Section 7
7.3 RS-232 INTERFACE
The sonde has an auto-baud feature that allows the instrument to automatically adjust to the terminal baud
rate. If the sonde is set to a baud rate of 4800 and a 9600 baud terminal is attached to it, after a few
carriage returns are entered, the sonde will recognize the communication mismatch and attempt to change
its own internal baud rate to match the terminals.
7.4 SDI-12 INTERFACE
SDI-12 is an industry-standard serial digital interface bus. The bus was designed to allow compatibility
between data collection devices and sensors of various manufacturers. The description below applies
specifically to the Sonde implementation of SDI-12 interface. For complete SDI-12 technical
specifications please contact:
Campbell Scientific, Inc.
P.O. Box 551
Logan, Utah 84321 USA
(801) 753-2342
SDI-12 is a single master multi-drop bus and command protocol. As many as 10 sensors can be connected
to the bus at a time. Each sensor is pre-assigned a unique address from 0 to 9. Each Sonde is factory-set to
address 0. The address can be changed in the System menu, see Section 2.9.5, System menu for details.
Running the sonde in SDI-12 mode requires it to be connected to a SDI-12 master device. An example of
such a device is the YSI 6200 or units from Campbell Scientific or Handar Instruments. These instruments
provide the commands necessary to communicate with the sonde in SDI-12 mode. In addition, the sonde
also supports the following commands which are entered from the command line at the # prompt:
SDI12
This command activates SDI-12 mode. This is the only mode in which the Sonde will respond to any
SDI-12 command. To exit to command line, press any key from the terminal connected to the RS-232 port.
The Sonde implements the basic SDI-12 command set. Below are the descriptions of each command and
their responses.
The following notations are used:
a
Sonde SDI-12 address (ASCII '0' to '9')
[CR]
Carriage return (ASCII 13)
[LF]
Line feed (ASCII 10)
Master
Any SDI-12 compatible data collection device
Master:
aM!
Sonde:
Initiate a measurement.
atttn[CR][LF]
YSI Incorporated
Drinking Water Monitoring Systems Operations Manual
7-2
Communications
Section 7
ttt - Maximum time in seconds the Sonde will take to complete the measurement.
n - Number of data that will be available when the measurement is completed. This number is the same as
the number of output parameters set in the Report menu, as described in Section 2.9.6, Report. For ten or
more parameters, the sonde returns ":", ";", "<", "=", ">", "?", "@", "A", "B",…etc.
After finishing the measurement, the Sonde will usually send a service request "a[CR][LF]" to the bus
master. The bus master can then retrieve the measurement result by "D0" to "D9" commands (see below).
If the Sonde does not send a service request within the specified maximum time, the measurement is
canceled. The bus master can then restart with another "M" command.
Master:
Sonde:
aI!
Send identification.
allccccccccmmmmmmvvvxxx...xxx[CR][LF]
l - 2 character SDI-12 level number.
c - 8 character manufacturer identification. This field always contains "YSIIWQSG" (YSI Inc.,
Water Quality Systems Group).
m - 6 character model number. This field always contains "EM600_" or "EM 6920"
(Environmental Monitoring System Sonde) depending on the sonde.
v - 3 character version number. This field holds the sonde’s software version number ("100" for
version 1.00).
Master:
aD0! to aD9!
Retrieve measurement/verifying data
Sonde:
a<values>[CR][LF]
<values>- 33 characters or less. This field holds one or more values resulting from a measurement or
verifying sequence. A value contains between 1 to 7 digits with an optional radix mark (period '.' or
comma ','). Each value must be preceded by its sign (either '+' or '-' ) since the sign is also used to delimit
multiple values.
If the number of values returned by the "D0" command is less than the number specified in the previous
response to "M" commands, the rest of the data can be retrieved by using "D1" to "D9" commands. The
"D" commands are non-destructive. Thus if the same "D" command is issued multiple times before the
next "M" command, it will return the same data. If the response to the "D0" command is "a[CR][LF]" then
either no "M" command was received before the first "D" command or the "M" command was canceled.
Example: Here is an example SDI-12 transaction. Here SDI-12 master will issue an Identify command
followed by a Measure command. The sonde is configured with a report output of Temperature, Specific
conductance, DO %, DO mg/L, pH (ISE1), ORP (ISE2), and Depth, a DO warm up time of 60 seconds, and
an SDI-12 address of 1.
Master: 1I!
Sonde: 110YSIIWQSGEM600_107[CR][LF]
The bus master asked for identification and the Sonde returned data showing the following.
SDI-12 level:
Manufacturer:
YSI Incorporated
1.0
YSIIWQSG
Drinking Water Monitoring Systems Operations Manual
7-3
Communications
Section 7
Model: EMS600_
Version:
1.07
Master: 1M!
Sonde: 10617[CR][LF]
The bus master sent a measurement command. The Sonde will take a maximum of 61 seconds to finish the
measurement. Upon completion, it will have 7 sensor data available.
Sonde: 1[CR][LF]
Master: 1D0!
Sonde: 1+17.5+12.05+98.7+8.25+6.45[CR][LF]
Master: 1D1!
Sonde: 1-325+10[CR][LF]
After finishing the measurement, the Sonde sent a service request to indicate completion. The bus master
then sent the "D0" command to retrieve the data. There were 5 data returned. Since 7 readings should be
available, the master continued with "D1" command and received the remaining data. The responses from
"D0" and "D1" commands are:
Temperature:
Specific conductance:
DO %:
98.7
DO mg/L:
pH (ISE1):
ORP (ISE2):
Depth:
10
YSI Incorporated
17.5
12.05
8.25
6.45
-325
Drinking Water Monitoring Systems Operations Manual
7-4
Warranty and Service Information
Section 8
SECTION 8 WARRANTY AND SERVICE
INFORMATION
The sondes are warranted for two years and the 650 MDS for three years against defects in workmanship
and materials when used for their intended purposes and maintained according to instructions. All cables
are warranted for one year. The free chlorine, temperature/conductivity, turbidity, chlorophyll, rhodamine
WT, pH, pH/ORP, and chloride probes are warranted for 1 year. Ammonium and nitrate probes are
warranted for six months. Damage due to accidents, misuse, tampering, or failure to perform prescribed
maintenance is not covered. The warranty period for chemicals and reagents is determined by the
expiration date printed on their labels. Within the warranty period, YSI will repair or replace, at its sole
discretion, free of charge, any product that YSI determines to be covered by this warranty.
To exercise this warranty, write or call your local YSI representative, or contact YSI Customer Service in
Yellow Springs, Ohio. Send the product and proof of purchase, transportation prepaid, to the Authorized
Service Center selected by YSI. Repair or replacement will be made and the product returned transportation
prepaid. Repaired or replaced products are warranted for the balance of the original warranty period, or at
least 90 days from date of repair or replacement.
8.1 LIMITATION OF WARRANTY
This Warranty does not apply to any YSI product damage or failure caused by (i) failure to install, operate
or use the product in accordance with YSI’s written instructions, (ii) abuse or misuse of the product, (iii)
failure to maintain the product in accordance with YSI’s written instructions or standard industry
procedure, (iv) any improper repairs to the product, (v) use by you of defective or improper components or
parts in servicing or repairing the product, or (vi) modification of the product in any way not expressly
authorized by YSI.
THIS WARRANTY IS IN LIEU OF ALL OTHER WARRANTIES, EXPRESSED OR IMPLIED,
INCLUDING ANY WARRANTY OF MERCHANTABILITY OR FITNESS FOR A PARTICULAR
PURPOSE. YSI’s LIABILITY UNDER THIS WARRANTY IS LIMITED TO REPAIR OR
REPLACEMENT OF THE PRODUCT, AND THIS SHALL BE YOUR SOLE AND EXCLUSIVE
REMEDY FOR ANY DEFECTIVE PRODUCT COVERED BY THIS WARRANTY. IN NO EVENT
SHALL YSI BE LIABLE FOR ANY SPECIAL, INDIRECT, INCIDENTAL OR CONSEQUENTIAL
DAMAGES RESULTING FROM ANY DEFECTIVE PRODUCT COVERED BY THIS WARRANTY.
YSI Incorporated
Drinking Water Monitoring Systems Operations Manual
8-1
Warranty and Service Information
Section 8
8.2 AUTHORIZED SERVICE CENTERS
YSI has authorized service centers throughout the United States and Internationally. For information about the
YSI Service Center nearest to you, please visit www.ysi.com/envrironmental and click “Tech Support”.
Alternatively, you can contact YSI Technical Support directly at 800-897-4151.
8.3 CLEANING INSTRUCTIONS
NOTE: Before they can be serviced, equipment exposed to biological, radioactive, or toxic materials must
be cleaned and disinfected. Biological contamination is presumed for any instrument, probe, or other device
that has been used with body fluids or tissues, or with wastewater. Radioactive contamination is presumed
for any instrument, probe or other device that has been used near any radioactive source.
If an instrument, probe, or other part is returned or presented for service without a Cleaning Certificate, and
if in our opinion it represents a potential biological or radioactive hazard, our service personnel reserve the
right to withhold service until appropriate cleaning, decontamination, and certification has been completed.
We will contact the sender for instructions as to the disposition of the equipment. Disposition costs will be
the responsibility of the sender.
When service is required, either at the user's facility or at YSI, the following steps must be taken to insure
the safety of our service personnel.
) In a manner appropriate to each device, decontaminate all exposed surfaces, including any containers.
70% isopropyl alcohol or a solution of 1/4 cup bleach to 1-gallon tap water are suitable for most
disinfecting. Instruments used with wastewater may be disinfected with .5% Lysol if this is more
convenient to the user.
) The user shall take normal precautions to prevent radioactive contamination and must use appropriate
decontamination procedures should exposure occur.
) If exposure has occurred, the customer must certify that decontamination has been accomplished and
that no radioactivity is detectable by survey equipment.
) Any product being returned to the YSI Repair Center, should be packed securely to prevent damage.
) Cleaning must be completed and certified on any product before returning it to YSI.
YSI Incorporated
Drinking Water Monitoring Systems Operations Manual
8-2
Warranty and Service Information
Section 8
PACKING INSTRUCTIONS
)
)
)
)
)
Clean and decontaminate items to insure the safety of the handler.
Complete and include the Cleaning Certificate.
Place the product in a plastic bag to keep out dirt and packing material.
Use a large carton, preferably the original, and surround the product completely with packing material.
Insure for the replacement value of the product.
Cleaning Certificate
Organization
Department
Address
City
State
Country
Model No. of Device
Zip
Phone
Lot Number
Contaminant (if known)
Cleaning Agent(s) used
Radioactive Decontamination Certified?
(Answer only if there has been radioactive exposure) Yes
No
Cleaning Certified By
Name
YSI Incorporated
Date
Drinking Water Monitoring Systems Operations Manual
8-3
Warranty and Service Information
YSI Incorporated
Drinking Water Monitoring Systems Operations Manual
Section 8
8-4
Health and Safety
Appendix A
APPENDIX A HEALTH AND SAFETY
NOTE: For additional health, safety, and disposal information about YSI reagents, download the MSDS
documents for the chemical in question from the YSI webpage (ysi.com).
YSI Conductivity solutions: 3161, 3163, 3165, 3167, 3168, 3169
INGREDIENTS:
T Iodine
T Potassium Chloride
T Water
Inhalation:
Inhalation of mist or splashes of iodine solution can cause severe irritation, with potential
destruction of
respiratory tissues, spasms, and edema (choking) in throat and lungs,
depending on frequency and degree of
exposure. Other reported potential effects are
coughing, burning sensation, laryngitis, headache, and nausea.
Use a NIOSH approved respirator for liquid mists and/or splashes. Get supplier
recommendations. Provide adequate ventilation. Avoid conditions that cause misting or
splashing.
Remove to fresh air. Give artificial respiration and get medical attention as needed.
Skin:
May cause irritation with repeated exposure.
Wear water-resistant gloves as needed.
Wash exposed areas with soap and water for 15 minutes. Remove contaminated clothing, and
wash before re-using.
Eyes:
Can cause irritation and potential eye damage with repeated exposure.
Wear splash-proof water-resistant goggles. Have convenient eyewash stations.
Flush with water for 15 minutes.
Ingestion
Can cause irritation of mouth, throat, and an upset stomach.
Wear a mouth cover or face shield when there is splashing.
Do not swallow. Rinse mouth. If swallowed, do not induce vomiting. Get prompt medical
attention.
(No chronic effects reported)
IN ALL CASES: GET MEDICAL ATTENTION IF EFFECTS PERSIST.
Most likely routes of entry: skin, eyes, ingestion.
YSI Incorporated
Drinking Water Monitoring Systems Operations Manual
A-1
Health and Safety
Appendix A
FIRST AID:
INHALATION: Remove victim from exposure area. Keep victim warm and at rest. In severe cases
seek medical attention.
SKIN CONTACT: Remove contaminated clothing immediately. Wash affected area thoroughly
with large amounts of water. In severe cases seek medical attention.
EYE CONTACT: Wash eyes immediately with large amounts of water, (approx. 10 minutes). Seek
medical attention immediately.
INGESTION: Wash out mouth thoroughly with large quantities of water. Do not induce vomiting.
Seek medical attention immediately.
YSI pH 4.00, 7.00, and 10.00 Buffer Solutions: 3821, 3822, 3823
pH 4 INGREDIENTS:
T Potassium Hydrogen Phthalate
T Formaldehyde
T Water
pH 7 INGREDIENTS:
T Sodium Phosphate, Dibasic
T Potassium Phosphate, Monobasic
T Water
pH 10 INGREDIENTS:
T Potassium Borate, Tetra
T Potassium Carbonate
T Potassium Hydroxide
T Sodium (di) Ethylenediamine Tetraacetate
T Water
CAUTION - AVOID INHALATION, SKIN CONTACT, EYE CONTACT OR INGESTION.
MAY AFFECT MUCOUS MEMBRANES.
Inhalation may cause severe irritation and be harmful. Skin contact may cause irritation; prolonged
or repeated exposure may cause Dermatitis. Eye contact may cause irritation or conjunctivitis.
Ingestion may cause nausea, vomiting and diarrhea.
YSI Incorporated
Drinking Water Monitoring Systems Operations Manual
A-2
Health and Safety
Appendix A
FIRST AID:
INHALATION - Remove victim from exposure area to fresh air immediately. If breathing has
stopped, give artificial respiration. Keep victim warm and at rest. Seek medical attention
immediately.
SKIN CONTACT - Remove contaminated clothing immediately. Wash affected area with soap or
mild detergent and large amounts of water (approx. 15-20 minutes). Seek medical attention
immediately.
EYE CONTACT - Wash eyes immediately with large amounts of water (approx. 15-20 minutes),
occasionally lifting upper and lower lids. Seek medical attention immediately.
INGESTION - If victim is conscious, immediately give 2 to 4 glasses of water and induce vomiting
by touching finger to back of throat. Seek medical attention immediately.
YSI Zobell Solution: 3682
INGREDIENTS:
T Potassium Chloride
T Potassium Ferrocyanide Trihydrate
T Potassium Ferricyanide
CAUTION - AVOID INHALATION, SKIN CONTACT, EYE CONTACT OR INGESTION.
MAY AFFECT MUCOUS MEMBRANES.
May be harmful by inhalation, ingestion, or skin absorption. Causes eye and skin irritation. Material
is irritating to mucous membranes and upper respiratory tract. The chemical, physical, and
toxicological properties have not been thoroughly investigated.
Ingestion of large quantities can cause weakness, gastrointestinal irritation and circulatory
disturbances.
YSI Incorporated
Drinking Water Monitoring Systems Operations Manual
A-3
Health and Safety
Appendix A
FIRST AID:
INHALATION - Remove victim from exposure area to fresh air immediately. If breathing has
stopped, give artificial respiration. Keep victim warm and at rest. Seek medical attention
immediately.
SKIN CONTACT - Remove contaminated clothing immediately. Wash affected area with soap or
mild detergent and large amounts of water (approx. 15-20 minutes). Seek medical attention
immediately.
EYE CONTACT - Wash eyes immediately with large amounts of water (approx. 15-20 minutes),
occasionally lifting upper and lower lids. Seek medical attention immediately.
INGESTION - If victim is conscious, immediately give 2 to 4 glasses of water and induce vomiting
by touching finger to back of throat. Seek medical attention immediately.
YSI Ammonium Standard Solutions: 3841, 3842, and 3843
INGREDIENTS:
T Ammonium Chloride
T Lithium Acetate Dihydrate
T Sodium Azide (trace)
T Hydrochloric acid
CAUTION - AVOID INHALATION, SKIN CONTACT, EYE CONTACT OR INGESTION.
MAY AFFECT MUCOUS MEMBRANES.
May be harmful by ingestion or skin absorption. May cause eye and skin irritation. The chemical,
physical, and toxicological properties have not been thoroughly investigated.
Ingestion of large quantities of lithium salts can affect the central nervous system producing
symptoms ranging from dizziness to collapse. It may also cause kidney damage, nausea, and
anorexia. Note that the ingestion of harmful quantities form the solutions is considered unlikely
given the low concentration of lithium and the volumes likely to be handled.
YSI Incorporated
Drinking Water Monitoring Systems Operations Manual
A-4
Health and Safety
Appendix A
FIRST AID:
INHALATION - Remove to fresh air. If not breathing, give artificial respiration. If breathing is
difficult, give oxygen. Call a physician.
SKIN CONTACT - Remove contaminated clothing immediately. Wash affected area with soap or
mild detergent and large amounts of water (approx. 15-20 minutes).
EYE CONTACT - Wash eyes immediately with large amounts of water (approx. 15-20 minutes),
occasionally lifting upper and lower lids. Seek medical attention immediately.
INGESTION - Immediately rinse out mouth with large quantities of water. If reagent was
swallowed, give 2 glasses of water and seek medical attention immediately.
YSI Nitrate Standard Solutions: 3885, 3886, and 3887
INGREDIENTS
T Potassium Nitrate
T Magnesium Sulfate
T Gentamycin Sulfate (Trace)
CAUTION - AVOID INHALATION, SKIN CONTACT, EYE CONTACT OR INGESTION.
May be harmful by ingestion or skin absorption. May cause eye and skin irritation. The chemical,
physical, and toxicological properties have not been thoroughly investigated.
FIRST AID:
INHALATION - Remove to fresh air. If not breathing, give artificial respiration. If breathing is
difficult, give oxygen. Call a physician.
SKIN CONTACT - Remove contaminated clothing immediately. Wash affected area with soap or
mild detergent and large amounts of water (approx. 15-20 minutes).
EYE CONTACT - Wash eyes immediately with large amounts of water (approx. 15-20 minutes),
occasionally lifting upper and lower lids. Seek medical attention immediately.
INGESTION - Immediately rinse out mouth with large quantities of water. If irritation occurs or
reagent was swallowed, seek medical attention immediately.
YSI Incorporated
Drinking Water Monitoring Systems Operations Manual
A-5
Health and Safety
Appendix A
YSI Turbidity Standard: 6073
INGREDIENTS
T Styrene divinylbenzene copolymer spheres
The material is not volatile and has no known ill effects on skin, eyes, or on ingestion. Therefore, no
special precautions are required when using the standards. General precautions should be adopted as
required with all materials to minimize unnecessary contact. Note, however, that the chemical,
physical, and toxicological properties have not been thoroughly investigated.
FIRST AID:
SKIN CONTACT - Remove contaminated clothing. Wash affected area with soap or mild detergent
and water.
EYE CONTACT - Wash eyes immediately with large amounts of water (approx. 15-20 minutes),
occasionally lifting upper and lower lids. If irritation occurs, seek medical attention immediately.
INGESTION - Rinse out mouth with large quantities of water. If irritation occurs or reagent was
swallowed, seek medical attention as a precaution.
YSI Replacement Desiccant 065802
INGREDIENTS
T Calcium Sulfate and Calcium Chloride
CAUTION - AVOID INHALATION, SKIN CONTACT, EYE CONTACT OR INGESTION.
MAY AFFECT MUCOUS MEMBRANES.
FIRST AID:
SKIN CONTACT - Flush with water.
EYE CONTACT -. Flush with water. If irritation continues, obtain medical attention.
INGESTION - If patient is conscious, induce vomiting. Obtain medical attention.
YSI Incorporated
Drinking Water Monitoring Systems Operations Manual
A-6
Required Notice
APPENDIX B
Appendix B
REQUIRED NOTICE
The Federal Communications Commission defines this product as a computing device and requires
the following notice.
This equipment generates and uses radio frequency energy and if not installed and used properly,
may cause interference to radio and television reception. It has been type tested and found to comply
with the limits for a Class A or Class B computing device in accordance with the specification in
Subpart J of Part 15 of FCC Rules, which are designed to provide reasonable protection against such
interference in a residential installation. However, there is no guarantee that interference will not
occur in a particular installation. If this equipment does cause interference to radio or television
reception, which can be determined by turning the equipment off and on, the user is encouraged to
try to correct the interference by one or more of the following measures:
T Reorient the receiving antenna
T Relocate the computer with respect to the receiver
T Move the computer away from the receiver
T Plug the computer into a different outlet so that the computer and receiver are on different branch
circuits.
If necessary, the user should consult the dealer or an experienced radio/television technician for
additional suggestions. The user may find the following booklet, prepared by the Federal
Communications Commission, helpful: "How to Identify and Resolve Radio-TV Interference
Problems". This booklet is available from the U.S. Government Printing Office, Washington, D.C.
20402, Stock No.0004-000-00345-4.
YSI Incorporated
Drinking Water Monitoring Systems Operations Manual
B-1
Required Notice
YSI Incorporated
Appendix B
Drinking Water Monitoring Systems Operations Manual
B-2
Accessories and Calibration Standards
Appendix C
APPENDIX C ACCESSORIES AND CALIBRATION
STANDARDS
STANDARD EQUIPMENT WITH YSI SONDES
T
T
T
T
T
T
600DW-B or 6920DW Sonde With Calibration Cup and Probe Guard
EcoWatch for Windows Software
Operations Manual
6570 Maintenance Kit
6560 Conductivity/Temperature Probe
6574 Membrane Installation Kit
PROBES FOR THE SONDES
T
T
T
T
T
T
T
T
T
T
T
T
T
6572 Free Chlorine Probe with 6573 Membrane Kit and 6035 Reconditioning Kit
6560 Conductivity/Temperature Probe
6561 pH Probe
6565 Combination pH/ORP Probe
6566 Combination pH/ORP Probe, Fouling Resistant
6561FG pH Probe with Flat Glass
6565FG Combination pH/ORP Probe with Flat Glass
6136 Turbidity Probe, wiped
6025 Chlorophyll Probe, wiped
6130 Rhodamine WT Probe, wiped
6882 Chloride Probe
6883 Ammonium Probe
6884 Nitrate Probe
OPTIONAL ACCESSORIES FOR THE SONDES
T
T
T
T
T
T
T
T
T
T
T
T
655488 Extended Calibration Cup Sleeve for 6920DW
655423 Spare Probe Installation Tool
6627 Turbidity Wiper Kit for 6136
6024 Chlorophyll Wiper Kit for 6025
6624 Chlorophyll Wiper Kit for 6025, #2-56 set screw
6144 Optical Wiper Pad Kit for 6627, 6024, and 6624 Wiper Assemblies
6035 Probe Reconditioning Kit for 6572 Free Chlorine and 6562 Dissolved Oxygen Probes
6038 12 VDC Power Supply with 110 VAC input
6651 12 VDC Power Supply with Universal input
6081 Carrying Case
6570 Maintenance Kit
6573 Free Chlorine Membrane Kit
FLOW CELLS FOR THE SONDES
YSI Incorporated
Drinking Water Monitoring Systems Operations Manual
C-1
Accessories and Calibration Standards
Appendix C
T 5083 Flow Cell for 600DW-B
T 6160 Flow Cell for 6920DW
CABLES FOR THE SONDES
T
T
T
T
T
T
T
T
T
T
T
6093 Field Cable, 100 ft (30 m)
6092 Field Cable, 50 ft (15 m)
6091 Field Cable, 25 ft (7.5 m)
6090 Field Cable, 8 ft (2.4 m)
6067B Low Cost Calibration Cable, Dry use only; 10 ft (3m)
6077B CE Calibration Cable, 10 ft. (3m)
SP6093-L Special field cables available in 25 ft(7.6 m) increments; Maximum 1000 ft (305m)
6096 Field Cable to Flying Lead (wire) adapter, 15 ft (5m)
6095B Field Cable to Female DB-9 (PC Serial with Power Connector)
6100 External Power Connector, attaches to 6095B Field Cable (6ft)
6103 MS-8 Dust Cover (caps connector when not in use)
CONDUCTIVITY REAGENTS
T
T
T
T
T
T
3161 Calibrator Solution, 1,000 uS/cm (quart)
3163 Calibrator Solution, 10,000 uS/cm (quart)
3165 Calibrator Solution, 100,000 uS/cm (quart)
3167 Calibrator Solution, 1,000 uS/cm (box of 8 pints)
3168 Calibrator Solution, 10,000 uS/cm (box of 8 pints)
3169 Calibrator Solution, 50,000 uS/cm (box of 8 pints)
pH REAGENTS
T
T
T
T
3821 pH 4 Buffer (box of 6 pints)
3822 pH 7 Buffer (box of 6 pints)
3823 pH 10 Buffer (box of 6 pints)
3824 Assorted pH Buffer Kit (2 bottles of pH 4, pH 7 and pH 10 buffers)
ORP REAGENTS
T 3682 Zobell Solution (125 ml)
AMMONIUM REAGENTS
T 3841 1 mg/L ammonium-nitrogen standard solution
T 3842 10 mg/L ammonium-nitrogen standard solution
T 3843 100 mg/L ammonium-nitrogen standard solution
NITRATE REAGENTS
T 3885 1 mg/L nitrate-nitrogen standard solution
T 3886 10 mg/L nitrate-nitrogen standard solution
T 3887 100 mg/L nitrate-nitrogen standard solution
YSI Incorporated
Drinking Water Monitoring Systems Operations Manual
C-2
Accessories and Calibration Standards
Appendix C
TURBIDITY REAGENTS
T
T
T
T
T
6080 0 NTU standard suspension, 1 gal
6072 10 NTU standard suspension, 1 gal
6073 100 NTU standard suspension, 500 mL
6073G 100 NTU standard suspension, 1 gal
6074 1000 NTU standard suspension, 1 gal
DISPLAYS, LOGGERS, AND ACCESSORIES
T
T
T
T
T
T
T
T
T
T
T
T
T
T
T
T
650-01 – Low memory with no barometer
650-02 – High memory with no barometer
650-03 – Low memory with barometer
650-04 – High memory with barometer
6112 PC Interface Cable. PC to 650 MDS.
6113 Rechargeable Battery Pack Kit with 6116 charger adapter cable, 6114 110 volt wall
charger, and 6117 battery pack included
6126 Rechargeable Battery Pack Kit with 6116 charger adapter cable, 6123 universal charger,
European power cable, British power cable, and 6117 battery pack included
6127 Rechargeable Battery Pack Kit with 6116 charger adapter cable, 6123 universal charger,
China/Australia power cord, and 6117 battery pack included
4654 Tripod
614 Ultra Clamp
5085 Hands Free Harness
5065 Form-fitting Case
5081 Hard-sided Case
6117 Extra Rechargeable Battery Pack
6115 GPS Cable for interface with user-supplied GPS unit
616 Cigarette Lighter Charger
LOGGER/TELEMETRY
T 6200 Data Acquisition System (6200 DAS) and Accessories. Contact Endeco/YSI (1-800363-3269) for options and ordering information.
SOFTWARE
T 6075 EcoWatch for Windows for use with 6-series applications; also available at no cost
from the ysi.com website.
T 062781 PC6000 Software (Available at no cost), DOS-Based
T Software upgrades for sondes and 650 – See ysi.com website
YSI Incorporated
Drinking Water Monitoring Systems Operations Manual
C-3
EMC Performance
Appendix D
APPENDIX D EMC PERFORMANCE
When using the YSI drinking water sondes in a European Community (CE) country, please be aware that
electromagnetic compatibility (EMC) performance issues may occur under certain conditions, such as when
the sonde is exposed to certain radio frequency fields.
If you are concerned with these issues, consult the Declaration of Conformity that was enclosed with your
instrument. Specific conditions where temporary sensor problems may occur are listed in this document.
If you are unable to locate the Declaration of Conformity that was shipped with your instrument, contact
your local YSI representative, or YSI Customer Service in Yellow Springs, Ohio for a copy of the
document. See Section 8, Warranty and Service Information for contact information.
YSI Incorporated
Drinking Water Monitoring Systems Operations Manual
D-1
EMC Performance
YSI Incorporated
Appendix D
Drinking Water Monitoring Systems Operations Manual
D-2
Specifications
Appendix E
APPENDIX E SPECIFICATIONS
SONDE SPECIFICATIONS
600DW-B SONDE
Available Sensors
Temperature, Conductivity, Free Chlorine, pH, and ORP
Operating Environment
Medium:
fresh, sea, or polluted water
Temperature:
-5 to +45 °C
Storage Temperature:
-40 to +60 °C for sonde and all sensors except pH and pH/ORP
-20 to +60 °C for pH and pH/ORP sensors
Material:
PVC, Stainless Steel
Diameter:
Length:
Weight:
1.65 inches (4.2 cm)
21.3 inches (54.1 cm) with no depth
1.48 pounds (0.67 kg) (with batteries)
Computer Interface:
RS-232C, SDI-12
Internal logging
memory size:
384 kilobytes (150,000 individual parameter readings)
Power:
4 C-size Alkaline Batteries or External 12 VDC
Battery Life:
25 to 30 days at 20 C with a 15 minute logging interval and a 40 second dissolved
oxygen warm up
6920DW SONDE
Available Sensors
Temperature, Conductivity, Free Chlorine, pH, ORP, Ammonium, Nitrate,
Chloride, Turbidity or Chlorophyll, or Rhodamine WT
Operating Environment
Medium:
fresh, sea, or polluted water
Temperature:
-5 to +45 °C
Storage Temperature:
-40 to +60 °C for sonde and all sensors except pH and pH/ORP
-20 to +60 °C for pH and pH/ORP sensors
Material:
Polyurethane, PVC, Stainless Steel
Diameter:
Length:
2.9 inches (7.4 cm)
18.25 inches (46.4 cm)
Weight:
3.74 pounds (1.7 kg) with sensors
Computer Interface:
RS-232C, SDI-12
YSI Incorporated
Drinking Water Monitoring Systems Operations Manual
E-1
Specifications
Appendix E
Internal logging
memory size:
384 kilobytes (150,000 individual parameter readings)
Power:
8 AA-size Alkaline Batteries or External 12 VDC
Battery Life:
Approximately 30 days at 20 °C at 15 minute logging intervals, a 40 second DO
warm up time and turbidity, chlorophyll, or rhodamine-WT active
SENSOR SPECIFICATIONS
The following are typical performance specifications for each sensor. Specifications do not include drift.
Temperature
Sensor Type...........Thermistor
Range.....................-5 to 45 °C
Accuracy................+/- 0.15 °C
Resolution..............0.01 °C
Conductivity*
Sensor Type...........4 electrode cell with autoranging
Range.....................0 to 100 mS/cm
Accuracy................+/- 0.5% of reading + 0.001 mS/cm
Resolution..............0.001 mS/cm to 0.1 mS/cm (range dependent)
Free Chlorine, mg/L
Sensor Type.......... Rapid Pulse - Clark type, polarographic
Range.....................0 to 3 mg/L
Accuracy............... +/- 15 % of the reading or 0.05 mg/L, whichever is greater; to maintain accuracy
specification, flow must be at least 500 mL/min and pH should not change by more than
+/- 0.3 units if the mean pH is between 8.5 and 9.3. The sensor will not function properly
at pH values above 9.3
Resolution..............0.01 mg/L
Salinity
Sensor Type............Calculated from conductivity and temperature
Range......................0 to 70 ppt
Accuracy.................+/- 1.0% of reading or 0.1 ppt, whichever is greater
Resolution...............0.01 ppt
pH
Sensor Type...........Glass combination electrode
Range.....................0 to 14 units
Accuracy................+/- 0.2 units
Resolution..............0.01 units
Depth……………200 meters
ORP
Sensor type............ Platinum button
Range.....................-999 to +999 mV
* Report outputs of specific conductance (conductivity corrected to 25 C), resistivity, and total dissolved solids are also
provided. These values are automatically calculated from conductivity according to algorithms found in Standard
Methods for the Examination of Water and Wastewater (Ed 1989).
YSI Incorporated
Drinking Water Monitoring Systems Operations Manual
E-2
Specifications
Appendix E
Accuracy................+/-20 mV
Resolution...............0.1 mV
Turbidity
Sensor type............ Optical, 90 ° scatter, with mechanical cleaning
Range..................... 0 to 1000 NTU
Accuracy................ +/- 2 % reading or 0.3 NTU, whichever is greater. Relative to calibration standards
Resolution...............0.1 NTU
Chlorophyll
Sensor type............ Optical, fluorescence, with mechanical cleaning
Range..................... 0 to 400 µg/L Chl; 0-100 Percent Full Scale (% FS) Fluorescence Units
Accuracy................ No specification provided
Resolution...............0.1 µg/L Chl; 0.1 % FS
Rhodamine WT
Sensor type............ Optical, fluorescence, with mechanical cleaning
Range..................... 0 to 200 µg/L Rhodamine WT
Accuracy................ +/- 5 % of the reading or 1 ug/L, whichever is greater
Resolution...............0.1 µg/L Rhodamine WT
Nitrate-Nitrogen
Sensor Type...........Ion-selective electrode
Range.....................0-200 mg/L-N
Accuracy................+/- 10% of reading or 2 mg/L (whichever is greater)
Resolution..............0.001 mg/L-N to 1 mg/L-N (range dependent)
Ammonium-Nitrogen
Sensor Type...........Ion-selective electrode
Range.....................0-200 mg/L-N
Accuracy................+/- 10% of reading or 2 mg/L (whichever is greater)
Resolution..............0.001 mg/L-N to 1 mg/L-N (range dependent)
Ammonia-Nitrogen
Sensor Type...........Calculated from ammonium, pH and temperature
Range.....................0-200 mg/L-N
Accuracy................+/- 10% of reading or 2 mg/L (whichever is greater)
Resolution..............0.001 mg/L-N to 1 mg/L-N (range dependent)
Chloride
Sensor Type...........Solid state ion-selective electrode
Range.....................0-1000 mg/L
Accuracy................+/- 15% of reading or 5 mg/L (whichever is greater)
Resolution..............0.001 mg/L to 1 mg/L (range dependent)
SOFTWARE SPECIFICATIONS
EcoWatch for Windows (included)
IBM PC compatible computer with CD ROM drive and with a 386 processor (or better) running
Windows software. Compatible with Windows 3.1, Windows 95, Windows 98, Windows ME,
Windows NT and Windows 2000. Minimum RAM requirement: 4 megabytes
YSI Incorporated
Drinking Water Monitoring Systems Operations Manual
E-3
Specifications
YSI Incorporated
Appendix E
Drinking Water Monitoring Systems Operations Manual
E-4
Quick Start Guide to Drinking Water Studies
Appendix F
APPENDIX F
QUICK START GUIDE TO DRINKING WATER
MONITORING
Introduction: This Quick Start guide is designed to allow users who are already familiar with the basic use
of YSI 6-series sondes for surface or groundwater applications to get up and running quickly in drinking
water applications. Users who have not previously used 6-series sondes should carefully read the 6-series
sonde manual supplied with the drinking water sondes prior to beginning any studies and only use this
Quick Start guide after a thorough understanding of the use of the YSI multiparameter instruments has been
gained.
Description of YSI Drinking Water (DW) Sondes: The 6920DW and 600DW-B drinking water sondes
have many identical features to other YSI 6-series instruments as detailed below:
•
They interface to computers, the YSI 650 display/logger, the YSI 6500 process monitor, and data
collection platforms.
•
They utilize the same cables.
•
The calibration of all sensors other than free chlorine is carried out in the same way.
•
Discrete Sampling and Unattended Sampling studies are set up in the same way.
However, there are some key differences from the standard YSI 6-series sondes:
•
The sonde contains a new circuit board which will allow the measurement of free chlorine instead
of dissolved oxygen. At the present time, dissolved oxygen cannot be measured with DW sondes.
•
The new free chlorine probe is very similar in appearance to the Rapid Pulse dissolved oxygen
probe and is designed to fit in the “DO” port of the sonde. The free chlorine sensor will probably
be ordered as an accessory with each DW sonde.
•
The DW systems are designed for use in flow cell applications and the appropriate flow cell
should have been ordered with your DW sonde. The sonde can be used in drinking water tanks
without the flow cell, but the flow dependence of the free chlorine sensor may result in a
significant compromise in accuracy under these conditions.
•
The free chlorine probe must be calibrated in situ versus a known chlorine value – usually
determined from a DPD analysis.
•
The membrane of the free chlorine sensor is a different material (polyvinylidene fluoride) from
that used with YSI dissolved oxygen sensors (Teflon or polyethylene) and must be installed using
special tools.
•
The electrolyte used with the free chlorine sensor is different from that used with YSI dissolved
oxygen sensors. Dissolved oxygen electrolyte should not be used with the free chlorine sensor.
YSI Incorporated
Drinking Water Monitoring Systems Operations Manual
F-1
Quick Start Guide to Drinking Water Studies
Appendix F
Setting up DW Sondes For Drinking Water Studies:
•
After unpacking the instrument and the flow cell, install all sensors EXCEPT free chlorine as
described in Section 2.3 of the 6-series drinking water manual. Leave the port plug installed in
the “DO” port of the sonde. The chlorine probe will be installed in this port at a later time.
•
Access the Advanced|Setup menu of the sonde and make certain that the “Sample and Hold”
feature is INACTIVE.
•
Calibrate all sensors EXCEPT free chlorine according to standard procedures described in Section
2.5 of the 6-series drinking water sonde manual. Use the calibration vessel supplied with the
sonde to hold the calibration reagents.
CAUTION: Make certain that the free chlorine sensor is not present in the sonde
bulkhead when calibrating other sensors.
•
Install the membrane for the free chlorine probe as described in Attachment 1 of this document
and in Section 2.3 of the DW sonde manual. Proceed IMMEDIATELY to the next step to avoid
the drying out of the free chlorine membrane and electrodes or store the probe in a beaker of tap
water (not distilled or deionized) until proceeding to the next step.
•
Now you MUST activate the sensor according to the following instructions:
•
Prepare a solution of free chlorine by diluting commercial bleach by a factor of 200. For
example, add 1 mL of commercial bleach to 200 mL of water (purified or tap).
•
Place the sensor end of the probe in the bleach solution and leave for approximately 60
seconds.
•
After 60 seconds in the bleach solution, remove the sensor and rinse with purified water.
CAUTION: Use of more concentrated bleach solutions and/or exposure times
longer than 60 seconds will cause a significant increase in the sensor break-in
period and, in extreme cases, may cause damage to the sensor.
•
Remove the port plug from the “DO” port in the sonde bulkhead and install the free chlorine probe
according to the instructions in Section 2.3 of the manual. Be careful not to touch or damage the
membrane.
CAUTION: The sensor should either be installed in the sonde bulkhead and immersed
in water in the flow cell (see below) within 5 minutes after the activation process or the
probe itself should be placed in a beaker of tap water. It is important that the probe
does not dry out after activation
•
Following the instructions in the flow cell kit supplied with your DW sonde, install the flow cell
on to the sonde. Be sure the proper O-ring is in place on the sonde above the threads of the probe
compartment.
•
Attach a piece of tubing between your drinking water source and the bottom connector of the flow
cell and another piece of tubing between the top connector of the flow cell and your drain. Open
the water valve to allow a flow of 500-1000 mL per minute(minimum 500 mL/min). See picture
below for a typical laboratory setup.
YSI Incorporated
Drinking Water Monitoring Systems Operations Manual
F-2
Quick Start Guide to Drinking Water Studies
Appendix F
CAUTION: Make certain that both inlet and outlet holes are held securely in place at
the flow cell fittings and at the inlet tap and drain. Failure to take these precautions
can result in flooding and subsequent damage to your facility.
DW Sonde
Flowcell
Flowcell Inlet
Flowcell Outlet
Drain
•
•
Water Tap
Break in the free chlorine sensor by following the instructions below.
•
Interface to the sonde with a PC, YSI 650 Display/Logger, or 6500 Process Monitor as
described in the manual.
•
For PC interface, select Run|Discrete Sample from the main menu and begin a study at a 4
second sample interval with data displayed on the PC monitor.
•
For 650 interface, select Sonde Run from the main menu and readings will automatically
appear on the 650 display. Be sure that the “Shut off time” in the 650 System Setup menu is
set to a value of zero so that the 650 maintains interface for the break-in period.
•
For a 6500 interface, plug in the 6500 and readings will automatically appear of the 6500
display.
•
Observe the displayed readings for at least 2 hours and make sure that they are relatively
stable for a period of 1 hour. If possible, it is prudent to simply leave the sensor running
continuously overnight to assure stability prior to calibration.
Calibrate the sensor according to the instructions below depending on your sonde interface device.
•
Collect an effluent sample from the drain line of the flow cell.
•
Immediately determine the free chlorine content of the sample in mg/L using a DPDbased test kit such as the YSI 9100 or the Hach Pocket ColorimeterTM II.
YSI Incorporated
Drinking Water Monitoring Systems Operations Manual
F-3
Quick Start Guide to Drinking Water Studies
•
•
Appendix F
Immediately calibrate the free chlorine sensor in the sonde to the value just determined
via DPD analysis. Interface to the sonde for calibration can be via PC, YSI 650
Display/Logger, or YSI 6500 Process Monitor.
Start a Continuous Monitoring Study
•
For stand-alone applications, make sure that you have new batteries in your sonde and use a
PC or 650 interface to set up an Unattended Sampling Study from the Run|Unattended menu
at your desired sample interval and start the study. Under these conditions, data will be
logged to the internal memory of the sonde for later upload using a computer or a 650
display/logger. The Sample and Hold feature found in the Advanced|Setup menu of the
sonde should be INACTIVE for this type of application.
•
For applications involving the YSI 6500 Process Monitor applications, follow the procedure
below. Consult Appendix G, Using Your DW Sonde with the 6500 Process Monitor or
the manual supplied with the 6500 for more details:
1.
2.
3.
4.
5.
6.
7.
8.
Make sure that the sonde is attached to the 6500 via a suitable YSI field cable.
Make sure that the 6500 is attached to line power.
Make sure that readings of all appropriate parameters are displayed on the screen.
Connect the 4-20 mA current loop or modbus outputs of the 6500 to your SCADA
system and assure proper data capture by the SCADA system.
Determine whether you would like the readings output to your SCADA system to be
continuous (NOT RECOMMENDED because higher frequency of free chlorine probe
maintenance and potential compromise of pH/ORP sensor life) or frozen between longer
sample intervals (RECOMMENDED because of lower frequency of free chlorine probe
maintenance and longer pH/ORP probe life).
If you choose continuous output to the SCADA, no further action is required.
If you choose to use the recommended longer sample intervals, then enter the secondary
menu of the 6500 by pressing the Esc and Enter keys simultaneously. Select Setup
sonde from the menu and (a) activate the Data Freeze and Release function by pressing
Enter to show a check mark in the box and (b) choose the sample interval between
readings, pressing Enter after selecting the interval.
Data should now be acquired by your SCADA system for processing according to user
software.
Maintenance of the Chlorine Sensor During a Continuous Monitoring Study
•
Inspect the flow cell, inlet and drain fittings and hose attachment points as often as possible and
make certain no leaks are present. If leaks are observed, turn off the water at the inlet valve and
make the necessary repairs to the fittings and/or tubing.
•
Check the accuracy of the free chlorine sensor after approximately 2 days of deployment in
flowing tap water and recalibrate the sensor to remove any drift due to long-term break-in. The
accuracy check should be done by carrying out a colorimetric DPD analysis of a sample of the
flow cell effluent and comparing it with the latest logged reading or the reading displayed in a
real-time or 6500 study. Note that the sonde should not be taken off-line to calibrate the sensor.
Calibration of any parameters during a study will not interrupt the continuity of the Unattended
logging file.
•
Check the accuracy of the free chlorine sensor every two weeks if possible and recalibrate if
necessary.
YSI Incorporated
Drinking Water Monitoring Systems Operations Manual
F-4
Quick Start Guide to Drinking Water Studies
Appendix F
ATTACHMENT 1. FREE CHLORINE MEMBRANE
INSTALLATION INSTRUCTIONS
FREE CHLORINE SENSOR ELECTROLYTE PREPARATION
Open the 6573 membrane kit which was shipped with your 6572 chlorine probe and prepare the electrolyte
solution. Dissolve the KCl in the dropper bottle by filling it to the neck with deionized or distilled water
and shaking until the solids are fully dissolved. After the KCl is dissolved, wait a few minutes until the
solution is free of bubbles.
1.
ADD DI OR DISTILLED
WATER
2.
PROTECTIVE CAP
FREE CHLORINE SENSOR MEMBRANE INSTALLATION
Remove the protective Teflon membrane and O-ring from the sensor end of the YSI 6572 Free Chlorine
probe. CAUTION: The Teflon membrane MUST be removed for proper sensor function.
Remove the protective cap is installed on the connector end of the probe.
Locate the 6035 Reconditioning Kit which was supplied with your 6572 Free Chlorine Probe. Use one of
circular sanding disks the 6035 Reconditioning Kit to sand the face of the 6572 Probe according to the
following instructions.
•
Hold the probe in a vertical position, place a sanding disk under your thumb, and stroke the probe
face in a direction parallel to the platinum electrode (located between
the two silver electrodes). The motion is similar to that used in
striking a match. Usually 10-15 strokes of the sanding disk are
sufficient to remove black deposits on the silver electrodes.
However, in extreme cases, more sanding may be required to
regenerate the original silver surface.
•
Rinse the probe tip well with purified water to remove any dust from
sanding.
CAUTION: You must sand your free chlorine sensor as described
above prior to installing a membrane to insure the surface tension
for probe surface/membrane interface.
YSI Incorporated
Drinking Water Monitoring Systems Operations Manual
F-5
Quick Start Guide to Drinking Water Studies
Appendix F
Locate the YSI 6574 O-ring Installation Kit which was shipped with your sonde. Note that the kit contains
two items – a circular plate with a threaded hole and a cylindrical tool with a screwdriver-style handle as
shown in the picture below.
Thread the nut on the end of the 6572 probe into the base plate as shown in the picture below.
Place an o-ring from the 6573 membrane kit in the groove at the bottom of the tool as shown in the picture
below left.
Apply a few drops of KCl solution to the tip of the probe as shown in the picture below right. The fluid
should completely fill the small moat around the electrodes and form a meniscus on the tip of the sensor.
Meniscus
O-Ring in Groove
YSI Incorporated
Drinking Water Monitoring Systems Operations Manual
F-6
Quick Start Guide to Drinking Water Studies
Appendix F
Remove a white membrane sheet from the package in the 6573 membrane kit as shown in the picture
below.
CAUTION: The blue sheets are simply protective spacers and CANNOT be used as
membranes for the free chlorine sensor.
White Membrane
As shown in the pictures below, lay the membrane on the probe tip that contains the electrolyte so that the
probe tip is approximately in the middle of the membrane.
As shown in the picture below, place the bottom of the o-ring installation tool over membrane/probe face
and press down securely.
YSI Incorporated
Drinking Water Monitoring Systems Operations Manual
F-7
Quick Start Guide to Drinking Water Studies
Appendix F
As shown in the picture below left, roll the o-ring off of the end of the installation tool so that it resides in
the o-ring groove of the probe. Be sure to hold onto the O-ring prior to removing the installation tool so
that it does not pop out of the groove. Then, as shown below right, remove the installation tool and make
certain that the o-ring is centered in the groove on probe end.
As shown in the picture below, use a razor blade or knife to trim away the excess membrane material.
The pictures below show a properly installed free chlorine membrane. Note that, because the membrane
will not stretch, there may be some points where the membrane is slightly “bunched up” in the o-ring
groove. This effect is normal and will not affect sensor function. Also note that the presence of bubbles
under the membrane is also normal and should not affect probe function
YSI Incorporated
Drinking Water Monitoring Systems Operations Manual
F-8
Quick Start Guide to Drinking Water Studies
Appendix F
Note the presence of a bubble
after installation. This is
acceptable for a free chlorine
membrane.
`
After installing the membrane, either proceed immediately to the sensor activation protocol described
above in the Quick Start Guide or store the probe in a beaker of tap water (NOT deioinized or distilled
water) as shown in the picture below to prevent drying out. Be sure to place the probe GENTLY into the
beaker to avoid damaging the membrane integrity.
YSI Incorporated
Drinking Water Monitoring Systems Operations Manual
F-9
Quick Start Guide to Drinking Water Studies
Appendix F
NOTE CAREFULLY: Users who are accustomed to installing a Teflon membrane on a YSI dissolved
oxygen sensor should note that the methods recommended for the Teflon installation are not likely to work
well for the free chlorine membrane because this membrane cannot be stretched. Therefore, dissolved
oxygen membrane installation techniques which are outline in the manuals for various YSI instruments,
including standard 6-series sondes utilizing the 6562 Rapid Pulse DO sensor, are NOT RECOMMENDED
for the free chlorine membrane installation.
YSI Incorporated
Drinking Water Monitoring Systems Operations Manual
F-10
Using Your DW Sonde with a 6500 Process Monitor
Appendix G
APPENDIX G
USING YOUR DRINKING WATER SONDE WITH A YSI
6500 PROCESS MONITOR
Introduction: If you want to output data from your drinking water sonde to a SCADA system in either 420 mA or RS-485 Modbus format, then you will be required to interface the sonde to a YSI 6500 Process
Monitor which must be purchased separately. The 6500 is shown in the picture below and generally, you
will set up the 6500/Sonde/SCADA combination as shown in the diagram located below the picture.
6500
ENVIRONMEN TAL
MONITORING
SYSTE M
SCADA
21.2 Temp
7.35 DO
6.53 pH
Esc
Cal
Enter
4-20 mA out
Relay output
AC power in
Sonde cable
w/ MS-8
Sonde
Flow Cell Stream
Alarms
YSI Incorporated
Drinking Water Monitoring Systems Operations Manual
G-1
Using Your DW Sonde with a 6500 Process Monitor
Appendix G
Detailed instructions for the following operations are provided in the noted sections of the manual which
you received with your 6500 Process Monitor:
•
Supplying power to the 6500 (Section 2.5.2)
•
Connecting the sonde to the 6500 (Section 2.5.1)
•
Configuring the 4-20 mA current loops to the existing sensors (Section 3.3.4)
•
Interfacing the current loop or modbus output of the sonde to your SCADA system (Section 2.5.3)
•
Using the 6500 software to set up your sonde, calibrate sensors, and customize the display
(Section 3.2)
This appendix to the Drinking Water Sondes Manual is designed as a “Quick Start” guide to common
operations involved in using your DW sonde with a 6500 and is also designed to be used as a “check list”
for this application. In addition, this appendix explains in detail the “Sample and Hold” feature of the DW
sonde software which has been designed specifically for applications in which the DW sonde is interfaced
to a 6500. Please refer to the following schematic diagram for many of the operations described below:
Single 12-pin connector
for relay outputs
RS485 for
Modbus
AC Power
connector
L1
G
B- A- N
L2
Grounding
Screws (10-32)
RS232 for Modbus and
software upgrades
Relays (4)...
soldered to PCB
8-pin connectors (2)
for 4-20 mA outputs
Select a Location for the Drinking Water Sonde and the 6500 Process Monitor. The sonde should be
located as close as possible to a water tap and a drain to minimize the tubing required. The 6500 should
also be located as close as possible to the sonde to minimize cable cost and must be within 250 feet (75 m)
in order to assure proper communication between the sonde and the 6500.
YSI Incorporated
Drinking Water Monitoring Systems Operations Manual
G-2
Using Your DW Sonde with a 6500 Process Monitor
Appendix G
Mount the 6500 to a Wall. Attach the two mounting brackets supplied with the 6500 to the back of the
monitor as shown in the picture below left. Then attach the monitor to the wall with screws as shown in
the picture below left. Use anchors if necessary.
Mount the DW Sonde at the Monitoring Site. There is no right or wrong way to mount the sonde at the
deployment sites. One typical method is to simply set the sonde on a bench or other flat surface near the
water inlet and drain. If a relatively large sink is present at the monitoring site, then the sonde can simply
be placed upright directly in the basin with the effluent hose discharging directly into the sink drain. To
prevent the sonde being inadvertently knocked over the sonde can be strapped with “bungee” cords or other
retainers. For other locations it may be best to hang the sonde by its bail from a hook on a wall or frame.
See the picture below a typical sonde installation.
YSI Incorporated
Drinking Water Monitoring Systems Operations Manual
G-3
Using Your DW Sonde with a 6500 Process Monitor
Appendix G
Set Up the Wiring for 4-20 mA Current or Modbus Output to Your SCADA System. As described in
Section 2.5.3 of the 6500 manual, the 6500 has the ability to output up to eight current output signals, each
corresponding to a water quality parameter. These connections for these outputs are made on TB-3 which
can be found at the bottom of the 6500 once the cover has been removed.
Supply Power to your 6500. After removing the front cover, you will need to have a qualified electrician
supply 110-230 volt AC power to your 6500 through TB-1 according to the instructions found in Section
2.5.2 of the 6500 manual. Note that it is best to have a switch which is external from the 6500 in the
power circuit so that power can be shut off to the 6500 when removing the front panel. This switch is
NOT supplied with the 6500 and should be purchased by your electrician. CAUTION: The sensitivity
and stability of the monitor will be impaired if the input wiring is not grounded. Do NOT apply
power to the 6500 until all electrical connections are verified and secure.
Configure the Current Loop Outputs. As described in Section 3.3.4, you will be required to select which
parameters you want to output to your SCADA via the 4-20 mA function and to enter the parameter values
which correspond to the 4 mA and 20 mA values for each parameter. To activate the menu section of the
6500 software, press the Esc and Enter keys simultaneously to display the Main menu as shown below.
Then highlight the 4-20 mA entry, press Enter, and follow the instructions in Section 3.3.4 of the 6500
manual until all 4-20 mA outputs have been activated and properly configured. Press Esc to return to the
Main menu.
Set Up Your Sonde Configuration and Calibrate Your Sensors. Prior to attaching your DW sonde to
the 6500 Monitor, you will need to activate the proper sensors and report parameters, and calibrate all of
the sensors EXCEPT free chlorine. The free chlorine sensor will be calibrated at a later time after
installation in the flow cell at the site.
CAUTION: Be certain that the free chlorine sensor is NOT present in the sonde bulkhead
while calibrating the other sensors (pH, ORP, Conductivity, Turbidity, etc.). Some of the
calibration reagents may temporarily bias or damage the free chlorine electrodes which will
then require reconditioning.
The setup and calibration processes can be accomplished by two different methods as described below:
•
Interface of the 6-Series Sonde with the 6500 Monitor via the matching MS-8 connectors on the
sonde cable and the 6500 enclosure. To carry out this procedure, the 6500 Environmental Process
Monitor must be installed in its permanent location with AC line power properly installed as
described by local electrical codes. See Sections 3 and 4 of the 6500 manual for detailed
instructions.
•
Interface of the 6-Series Sonde with a laboratory computer or 650 display/logger. If a computer is
selected for setup, you must employ a YSI 6095B DB-9 to MS-8 adapter and you will have to
power the sonde either through internal batteries or a YSI 6038 or 6651 power supply. After using
this method to calibrate the sonde, proceed to section 3.3, 6500 Monitor Setup, in this manual.
YSI Incorporated
Drinking Water Monitoring Systems Operations Manual
G-4
Using Your DW Sonde with a 6500 Process Monitor
Appendix G
Because it is usually more convenient to calibrate the pH, ORP, conductivity, and turbidity sensors near a
sink in a laboratory environment, YSI recommends that the second method be used if at all possible.
However, if the 6500 is your only interface device, the setup and calibration routines can be carried out
using the 6500 software as described in Sections 3.2 and 4.2 of the 6500 Process Monitor manual.
If you choose to use the computer or 650 interface for the calibration protocol and then later interface the
calibrated sonde to the 6500, follow the instructions in Sections 2.5 and 2.6 of the manual supplied with
your 6920DW or 600DW-B Drinking Water Sonde.
Activate Your Free Chlorine Sensor. After calibration of all other sensors is complete, install a
membrane on the free chlorine sensor and activate it according to the detailed instructions found in
Sections 2.3 and 2.6.1 of the DW sonde manual. Then store the activated probe in tap water (NOT
deionized or distilled water) until it can be installed in the sonde bulkhead. After installation of the free
chlorine probe in the sonde, proceed to the next step.
Attach the DW Sonde to the 6500. Interface of the DW sonde to the 6500 Process Monitor will require a
YSI field cable with a model number 609X, where the X defines the cable length. This cable must be
purchased separately. Attach the silver threaded end of the cable to the sonde by engaging the keys in the
mating connectors and then turning the nut clockwise until fully engaged. Then attach the other end of the
cable (MS-8 connector) to the corresponding connector on the bottom of the 6500. To make the
connection, place the cable MS-8 connector over that of the 6500 and rotate the field cable connector until
engagement occurs. Then rotate the field cable connector approximately 1-quarter turn until it is fully
engaged as evidenced by a “click”.
Observe Sonde Readings in Real-Time on the 6500 Display. After attaching the sonde to the 6500, you
will hear a beep indicating proper interface and then sensor readings will appear on the display of the
monitor. To configure the display with regard to contrast, number of parameter lines, etc., press the Esc
and Enter keys simultaneously to display the menu associated with the 6500 software as shown below.
Choose the Display selection and press Enter. Then follow the instructions in Section 3.3.2 of the 6500
manual to configure the 6500 display. When finished, press Esc until the sensor readings are again
displayed on the screen.
Calibrate Your Free Chlorine Sensor. After the probe has been installed, immediately attach the flow
cell to the sonde, attach appropriate hoses to the inlet and outlet of the flow cell and start a flow of water at
a rate of 500-1000 mL/minute (minimum 500 mL/min). Observe the free chlorine readings on the 6500
display and, when stable, collect an effluent sample from the flow cell and perform a DPD colorimetric
analysis using a test kit to determine the actual free chlorine concentration. Then immediately use the
Calibration function of the 6500 to calibrate the sensor to the DPD value as described in Section 4.2 of the
6500 manual. Note that the stabilization of the free chlorine sensor after activation may require 1-2 hours
in flowing tap water after connection of the sonde to the 6500.
YSI Incorporated
Drinking Water Monitoring Systems Operations Manual
G-5
Using Your DW Sonde with a 6500 Process Monitor
Appendix G
Activate the “Sample and Hold Function” and Select Your Sample Interval. The new DW sonde
software which is supplied in your instrument includes a new feature designated “Sample and Hold”.
Basically, when “Sample and Hold” is active, the 6500 display and the SCADA output of the 6500
becomes equivalent to the internal memory of the sonde while an Unattended study is running. In the
Unattended mode, the sonde “sleeps” between periodic samples with the interval between samples defined
by the user. This method of operation results the extension of both the sonde battery life (not important in
6500 applications) and the time between required sensor maintenance procedures (which is important to
6500 drinking water applications).
While data can be output continuously to the 6500 (and to the SCADA), YSI strongly recommends the use
of the “Sample and Hold” feature of the system which outputs data to the 6500 (and the SCADA) at a user
selected interval with the sensors “turned off” between readings. There are two reasons for this strong
recommendation:
1.
Because of the hydrophilic nature of the chlorine sensor membrane, cross-talk between the
chlorine sensor electrodes and the pH sensor can occur. If cross-talk is present, it is likely to
reduce the life of the pH sensor if it is run in the continuous mode.
2.
The oxidation of the anode of the free chlorine sensor is the factor which normally dictates
maintenance on the sensor and the extent of the oxidation is proportional to the time the sensor is
polarized. Thus, if the sensor is only polarized for 20 % of the time, the time between sensor
reconditioning will be extended by approximately a factor of five.
The only disadvantage of the “Sample and Hold” feature is that the data output to the 6500/SCADA from
all sensors is “frozen” for the sample interval. Thus, if a study were begun at 10:00 at a 5 minute interval,
the sensor readings shown by the 6500 (and output to the SCADA) which were taken at 10:00 would
remain the same (even though they might be changing slightly) until 10:05, when new sensor readings
would be output. These readings, in turn, would be frozen until 10:10, when the next readings would be
sent to the 6500.
The “Sample and Hold” feature can be activated in the Advanced|Setup menu of the sonde software while
attached to a PC or a 650 Display/Logger or can be activated directly from the Setup sonde menu of the
6500.
NOTE CAREFULLY: If the Sample and Hold feature is activated from a PC or 650 and
then the sonde is attached to a 6500, no interface will occur until the first point is taken using
the Sample and Hold mode. At the time the first point is taken, correct interface with the
6500 will take place and readings will be visible on the 6500 display. For example, if a sonde
is put into Sample and Hold mode with a 15 minute interval at 15:05 and then immediately
attached to a 6500, readings will not be visible on the 6500 display until 15:15, i.e. the time of
the next reading in the Sample and Hold mode.
If activating the feature directly from the 6500, press the Esc and Enter keys simultaneously to activate the
Main menu of the 6500 and highlight the Setup sonde selection and press Enter. Then highlight the
Sample and Hold entry and press Enter to activate the feature as evidenced by a checkmark in the box.
After activating the Sample and Hold feature, you will also be required to enter a time interval between
samples during which time the 6500 display and 4-20 mA and Modbus outputs will be frozen. Use the
right/left arrow keys on the 6500 to move to the proper digits and then the up/down arrow keys to input the
proper value. Then press the Enter key to confirm your interval selection. Our empirical experience is
that most parameter change events in drinking water systems are observed with a 15 minute sample interval
(the default value), but, to be sure, you may want to select a 5 minute sample interval in the 6500 System
Status menu. Sample intervals of less than 5 minutes are not recommended when using your DW sonde
with a 6500 in long term monitoring studies.
YSI Incorporated
Drinking Water Monitoring Systems Operations Manual
G-6
Using Your DW Sonde with a 6500 Process Monitor
Appendix G
Under most conditions, it is best to calibrate all sensors except free chlorine with the Sample and Hold
feature INACTIVE and then activate the feature just prior to logging to the start of a study which is sending
data to a SCADA system and the internal memory of the sonde at the predefined Sample and Hold
interval. However, it is acceptable to calibrate any parameters with an ACTIVE Sample and Hold
feature as long as a certain precaution is followed. This precaution involves making certain that the sonde
has been in the flow cell and connected to a 6500 for at least one Sample and Hold interval prior to
implementing a calibration from the 6500 keypad. Thus, if the Sample and Hold interval is 15 minutes
and the sonde was attached to the 6500 at 15:00, you should wait until the 15:15 reading appears on the
6500 display prior to calibrating any sensor with the Sample and Hold feature active. As noted above, in
any case, you should wait for 1-2 hours, i.e. several Sample and Hold intervals, before calibrating the free
chlorine sensor whether or not the Sample and Hold feature is active.
NOTE CAREFULLY: FAILURE TO WAIT AT LEAST ONE SAMPLE AND HOLD
INTERVAL PRIOR TO CALIBRATING WITH THE SAMPLE AND HOLD FEATURE
ACTIVE IS LIKELY TO RESULT IN ERRONEOUS CALIBRATIONS. AS NOTED
ABOVE, IT IS BEST TO CALIBRATE ALL SENSORS EXCEPT FREE CHLORINE
WITH THE SAMPLE AND HOLD FEATURE INACTIVE AND THEN CALIBRATE
FREE CHLORINE AT A LATER TIME.
Carry Out Spot Checks of Accuracy and Recalibrate as Necessary. You should confirm the accuracy
of your free chlorine readings relative to a DPD colorimetric analysis within one week of your deployment
and as often as possible thereafter. Although YSI’s extensive empirical testing program has indicated that
the sensor is capable of remaining within the accuracy specification for 60-90 days, we cannot guarantee
that the sensor will not be susceptible to some drift depending on the content of your drinking water.
Therefore, you should go to your deployment site as often as possible, perform a DPD colorimetric test of
the flow cell effluent and recalibrate the sensor from the 6500 display if significant drift is evident. If drift
in the same direction continues to be observed and/or if the free chlorine readings become jumpy, then you
should remove the free chlorine probe from the sonde, recondition it, install a new membrane, and activate
the sensor as described in Section 2.6.1 of the Drinking Water Sonde Manual. It is important to remember
that the accuracy specification provided for the free chlorine sensor (+/- 15 % of the reading or 0.05 mg/L,
whichever is greater) does not include long term drift even though our empirical studies in several water
samples show that the specification can be met for up to 60 day deployments. The extent of the drift of
your free chlorine sensor will depend on several factors including the species in your particular drinking
water and whether the membrane was properly installed.
YSI Incorporated
Drinking Water Monitoring Systems Operations Manual
G-7
Using Your DW Sonde with a 6500 Process Monitor
YSI Incorporated
Drinking Water Monitoring Systems Operations Manual
Appendix G
G-8
Frequently Asked Questions About YSI Drinking Water Systems
Appendix H
APPENDIX H
FREQUENTLY ASKED QUESTION ABOUT YSI
DRINKING WATER SYSTEMS
GENERAL
What are YSI Drinking Water (DW) Sondes designed to do?
YSI DW sondes are specially designed for the monitoring of long term trends in drinking water distribution
systems in flow cell (slipstream or side stream) applications. Typically, “long term” would mean
deployments of at least 60 days with no maintenance of the sensors except for the possible need for in situ
calibrations without removing the sonde from the site.
What types of DW sondes are available?
Two types of sondes (shown in the picture below) can be purchased for drinking water applications -- the
6920DW which operates from 8 internal AA batteries and the 600DW-B which operates 4 internal AA
batteries.
` 600DW-B
6920 DW
What drinking water parameters can be monitored with DW sondes?
For the 6920DW, typical parameters to be monitored are temperature, conductivity or specific conductance,
pH, ORP, turbidity, and free chlorine. The 600DW-B measures all of these parameters except for
turbidity. The 6920DW is also capable of measuring ammonium, nitrate, and chloride with ion selective
YSI Incorporated
Drinking Water Monitoring Systems Operations Manual
H-1
Frequently Asked Questions About YSI Drinking Water Systems
Appendix H
electrode (ISE) sensors, but their use is not recommended for long term monitoring in flow cell applications
due to the potential for large drift. In addition, the 6920DW can measure either Rhodamine WT or
chlorophyll INSTEAD OF turbidity, but these analytes are not expected to be important for most drinking
water applications. Potential users should note carefully that the DW sondes will NOT MEASURE
DISSOLVED OXYGEN as explained in the next section.
What are the differences between YSI DW instruments and YSI 6-series sondes which have been sold
for surface- and ground-water applications over the last 13 years?
Other than the sonde overlay which indicates the sonde is a “DW” (600DW-B or 6920DW) version, the
appearance and mechanical design of the two drinking water instruments is identical to their surface-and
ground-water equivalents (600XLM and 6920). However, the most critical unique feature of the DW
sondes is the fact that they contain a different internal PC board which supports the free chlorine sensor, but
not a dissolved oxygen sensor. Because of this new hardware which reflects the different polarizing
potentials necessary for oxygen and chlorine, DW sondes are not capable of measuring oxygen even though
a YSI 6562 oxygen probe would be physically compatible with installation in the DW sondes.
Can I measure dissolved oxygen with a DW sonde if I have a YSI 6562 Rapid Pulse DO Probe?
No. Even though the probe will fit in the sonde bulkhead, the polarizing potential from the free chlorine
PC board will not reduce oxygen.
How can I tell the difference between dissolved oxygen and free chlorine sensors?
Along with a different model number stamped on the probe body, the oxygen sensor is built with a gray
body while the free chlorine sensor has a white body.
What are the key competitive features of the YSI Drinking Water Sondes?
•
Use hardware, software and sensors (with the exception of free chlorine) which have been proven
in 13 years of surface- and ground-water usage.
•
New free chlorine sensor which is easy to calibrate and which has been proven in extensive flow
cell field testing prior to release.
•
Relatively small size allows use at virtually any site with a water tap and a drain.
•
Easy setup of sonde configuration and calibration of sensors using standard reagents and
techniques.
•
Data is compatible with YSI’s widely-used EcoWatch for Windows software for use in custom
data reports and plots.
•
Relatively inexpensive compared to wall-mounted systems utilizing separate sensors.
•
Can be deployed at remote locations where no AC power is present.
•
Good battery life (30 days at a 15 minute sample interval for both 6920DW (with turbidity active)
and for the 600DW-B) under stand-alone conditions.
•
Can be used in four distinct modes, all of which have potential use in the drinking water industry.
YSI Incorporated
Drinking Water Monitoring Systems Operations Manual
H-2
Frequently Asked Questions About YSI Drinking Water Systems
•
•
•
•
Appendix H
Stand-alone with internal logging and battery or external power
Attached to a PC with real-time graphic display of data using YSI EcoWatch for Windows
software.
Attached to a SCADA system utilizing the YSI 6500 Process Monitor as a link between the
sonde and the SCADA.
Attached to a data collection platform, such as the YSI EcoNet system, which provides webbased access to real-time data.
DRINKING WATER SONDE DEPLOYMENTS
What are the site requirements for using YSI Drinking Water Sondes?
To carry out side-stream (flow cell) studies, you will need the following:
•
A water tap with a valve or regulator to control flow and a fitting to allow the attachment of an
inlet hose from the tap to the YSI flow cell.
•
A drain to collect and dispose of the flow cell effluent
•
Hardware to securely mount the sonde. This can be as simple as a hook on the wall to attach to
the sonde bail or a horizontal binding strap to attach a floor or table mounted sonde to a wall or a
frame.
•
A site at which the water inlet and outlet will not freeze under winter conditions.
Do I need to have AC power at the deployment site?
No – the DW sondes can both operate from internal battery power for stand-alone studies in which data is
logged to the sonde memory and then uploaded periodically for analysis of previous events. However, if
you wish to see your data in real-time through the use of a SCADA system after processing the data via
YSI 6500 Process Monitor between the sonde and the SCADA, then AC power will be required at the site.
In addition, if you wish to attach the sonde to a DCP (such as the YSI 6200 or YSI EcoNet system), then
the use of AC power greatly facilitates the setup. Finally, even for stand-alone deployments, the use of the
YSI 6038 or 6651 power supplies saves the internal batteries and therefore is recommended if there is AC
power at the site.
I would like to install a drinking water monitoring device directly into a pipe and avoid the need for a
drain line? Can I do this with the YSI Drinking Water Sondes?
At the present time, there is no mechanism to insert standard YSI Drinking Water Sondes into a pressurized
water distribution system. Depending on market requirements, this type of application might be supported
in the future, but, for now, the answer is “No”.
I would like to install a drinking water sonde in my water storage tank by simply suspending it from
a support into the tank? Can I do this with the YSI Drinking Water Sondes?
The sondes and sensors were not designed for this application, but might still provide valuable information
under these conditions as long as a limitation with regard to the free chlorine sensor is recognized by the
user. This limitation is that the free chlorine sensor is NOT flow independent (see below for more
information). The flow dependence is not an issue in side-stream (flow cell) applications where the flow is
YSI Incorporated
Drinking Water Monitoring Systems Operations Manual
H-3
Frequently Asked Questions About YSI Drinking Water Systems
Appendix H
greater than 500 mL per minute and is relatively constant. However, the varying flow conditions which
exist directly in water storage tanks (from completely stagnant to significant flow during filling and
emptying operations) will result in significant inaccuracies in the free chlorine data. These errors could be
up to 30 % of the reading depending on the time of calibration, in addition to the +/- 0.15 mg/L accuracy
specification associated with the sensor when used in flowing water. In addition, if the chlorine content of
the tank is stratified, obtaining a representative sample for calibration my also be difficult and would result
in an additional error component. Users with tank applications should be prepared for levels of error
significantly higher than those specified for flow cell applications if they suspend their drinking water
sondes directly in storage tanks.
INTERFACING TO YSI DRINKING WATER SONDES
What modes of operation can be used with the YSI Drinking Water Sondes?
As described below, the YSI DW sondes are designed to operate in a variety of modes while acquiring long
term continuous data.
•
Stand-alone – In this mode the sonde is set up and calibrated off line (except for free chlorine, see
below) and then installed at the site in the appropriate flow cell with the sonde powered by internal
batteries. An Unattended study is then begun at a suitable interval (usually 5-15 minutes) and
data is logged to internal memory for the length of the study. The data can be uploaded
periodically for after-the-fact viewing using either a PC or a YSI 650 Display/Logger.
•
Attached to a PC for Real-Time Graphic Data Display – In this mode, after calibration the
sonde is attached to a PC which is powered externally and has had the YSI software EcoWatch for
Windows installed. Using EcoWatch, a real-time study is begun with data logged automatically
to the hard drive of the PC at the desired interval as well as displayed graphically on the monitor
of the computer in real-time.
•
Attached to a YSI Process Monitor for Use with SCADA Systems – In this mode, the sonde is
placed in the flow cell and then attached to the 6500 which is AC powered at the site. The data
from the sonde sensors are automatically displayed on the screen of the 6500 for real-time viewing
in non-graphical form. The sensor signals can also be converted by the 6500 hardware/software
into either 4-20 mA or Modbus protocols for interface to a SCADA system. While data can be
output continuously to the 6500 (and to the SCADA), YSI strongly recommends the use of
the “Sample and Hold” feature of the system which outputs data to the 6500 (and the SCADA)
at a user selected interval with the sensors “turned off” between readings. There are two reasons
for this strong recommendation:
1.
Because of the hydrophilic nature of the chlorine sensor membrane, cross-talk between
the chlorine sensor electrodes and the pH sensor can occur. If cross-talk is present, it is
likely to reduce the life of the pH sensor if it is run in the continuous mode.
2.
The oxidation of the anode of the free chlorine sensor is the factor which normally
dictates maintenance on the sensor and the extent of the oxidation is proportional to the
time the sensor is polarized. Thus, if the sensor is only polarized for 20 % of the time,
the time between sensor reconditioning will be extended by approximately a factor of
five.
The only disadvantage of the “Sample and Hold” feature is that the data output to the
6500/SCADA from all sensors is “frozen” for the sample interval. Thus, if a study were begun at
10:00 at a 5 minute interval, the sensor readings shown by the 6500 (and output to the SCADA)
which were taken at 10:00 would remain the same (even though they might be changing slightly)
until 10:05, when new sensor readings would be output. These readings in turn would be frozen
YSI Incorporated
Drinking Water Monitoring Systems Operations Manual
H-4
Frequently Asked Questions About YSI Drinking Water Systems
Appendix H
until 10:10, when the next readings would be sent to the 6500. The “Sample and Hold” feature is
explained in more detail in Appendix G. Using Your Drinking Water Sonde with a YSI 6500
Process Monitor.
•
Attached to a Data Collection Platform (DCP) – In the absence of a SCADA system, the sondes
can be attached to DCPs such as the YSI EcoNet system and the YSI 6200 to allow access to the
data via modem communication. For the 6200, the YSI software package EcoWatch DCP is used
and data can be transferred directly to your computer via a land-line or cellular modem or, for
short distances, via spread spectrum radio. For the EcoNet system, data is transferred via modem
to third party server where it can be accessed by the user via a simple Internet link.
What type of cable will I need for setting up and deploying the drinking water sondes?
Depending on your applications, two types of YSI cables can be used with your DW sondes:
•
6067B -- If your applications involve the stand-alone scenario described above where the instrument is
powered on internal batteries and then recovered for data upload, then the relatively-inexpensive
6067B is probably the ideal interface cable to your DW sonde. The cable can be used in the
laboratory to set up the instrument for deployments to upload data in the laboratory or in the field to a
PC when no provision for a water tight connection is required. Note, however, that you cannot
interface between the 650 Display/Logger and a sonde with this cable, so if you will be using the 650
for periodic uploads, you will require a YSI field cable as described below.
•
Standard YSI Field Cables – If your applications involve the further interface of the DW sonde to a
device other than a PC, you will need a YSI field cable in the appropriate length for your conditions.
These cables have a YSI Model Number “609X” where the value of “X” determines their length.
These cables have a connector on one end which attaches to the sonde and a military-style (MS-8)
connector on the other end which will directly interface to a 650 Display/Logger, a 6500 Process
Monitor, and 6200 and EcoNet data collection platforms. If you wish to use your field cable for
laboratory calibration while interfacing the sonde to a PC, you will require a YSI 6095B adapter which
has a mating MS-8 connector at one end and standard serial connector (DB-9) at the other.
What will I need to supply power to my drinking water sondes?
For stand-alone deployments and real-time applications using EcoWatch for Windows, the sondes can be
powered using internal batteries where the 6920DW and 600DW-B will have a battery life of about 30 days
at a 15 minute sample interval. If AC power is present at the site of the stand-alone deployment, then it is
probably prudent to use the YSI 6038 (US and Canada) or the YSI 6651 (all countries) power supplies to
provide power. To use these power supplies, you must have a field cable with a 6095B adapter attached to
the sonde; the power input from the supplies goes through an MS-4 connector on the 6095B. The power
supply will also connect to a 6067B calibration cable.
For applications involving the YSI 6500 or any data collection platforms, the sonde will automatically be
powered from the 6500 (attached to AC power) or DCP (attached to either AC or DC power). However, if
you are logging back-up data to the sonde memory while also collecting it via the DCP or a SCADA
system, you probably will want to have batteries in the sonde so that data will continue to be collected and
stored in internal memory if the power to the 6500 or DCP is interrupted.
YSI Incorporated
Drinking Water Monitoring Systems Operations Manual
H-5
Frequently Asked Questions About YSI Drinking Water Systems
Appendix H
FREE CHLORINE MEASUREMENT
What is the chemical formula of “free chlorine”?
When chlorine gas (Cl2) is added to water, a reaction (called disproportionation) occurs to form
hypochlorous acid (HOCl) and hydrochloric acid (HCl). The hypochlorous acid is a strong oxidant and the
active species in most drinking water disinfection processes rather than gaseous chlorine (Cl2). One
molecule of HOCl has the same oxidizing capacity as a molecule of Cl2. Thus, the formula for “free
chlorine” is really HOCl rather than Cl2. (A portion of the free chlorine will also be in the form of
hypochlorite ion OCl- , with the amount depending on the pH of the sample.) However, convention
dictates that free chorine be reported in units of “mg Cl2 per liter” even though the active compounds in
solution are HOCl and OCl-. Thus, YSI free chlorine readings are expressed in units of “Cl2 mg/L” rather
than “HOCl/OCl- mg/L” to be consistent with standard reporting convention.
How does the YSI sensor measure free chlorine?
The free chlorine sensor operates on the same amperometric principles as the YSI Rapid Pulse dissolved
oxygen sensor which is used in all YSI 6-series sondes designed for surface- and ground-water studies.
Basically, the hypochlorous acid (HOCl) and hypochlorite ion (OCl-) formed when gaseous chlorine is
dissolved in water diffuses through a permeable membrane which covers the electrodes of the sensor. The
HOCl/OCl- is then reduced at the cathode of the sensor producing a current which is proportional to the
amount of free chlorine present in the solution outside the membrane. As the free chlorine is reduced at
the cathode, the silver anode is oxidized to silver chloride (AgCl). The electrochemistry of the chlorine
sensor is carried out in a “pulsed mode”, with the cathode polarized for only 1/100 of the time (40 mS) and
depolarized for 99/100 of the time (3960 mS) in order to (a) use the existing Rapid Pulse DO circuitry and
software, (b) reduce the flow dependence of the free chlorine sensor, and (c) minimize the deposition of
AgCl on the anode, the removal of which requires a maintenance protocol. One major difference between
the Rapid Pulse oxygen and chlorine sensors is that the reducing and “hold” potentials are set to much more
positive values where chlorine is reduced, but oxygen is not. The second major difference is that a
hydrophobic Teflon membrane is used to cover the electrodes of the dissolved oxygen sensor while a
hydrophilic polyvinylidene fluoride membrane is used with the free chlorine sensor.
Is the extent of the flow dependence reduction from the Rapid Pulse system the same for dissolved
oxygen and chlorine?
No. Under continuous pulsing conditions, the Rapid Pulse DO system exhibits a flow dependence of about
3 % while the Free Chlorine system shows a flow dependence of up to 25 %. The greater flow dependence
of the chlorine system under the same pulse conditions (40 mS “on”/3960 mS “off”) is likely due to the
different diffusion properties exhibited by HOCl with a hydrophilic membrane versus oxygen gas through a
hydrophobic membrane. In any case, the flow dependence of the free chlorine sensor is of great enough
magnitude that a flow of about 500 mL per minute is required to overcome it under continuous pulsing
conditions and hence the requirement for a flow cell for most studies involving Drinking Water sondes with
Free Chlorine sensors.
What do the terms “Total Chlorine” and “Combined Chlorine” refer to?
There are two categories of “chlorine” in most treated drinking water – free chlorine (HOCl + OCl-) and
combined chlorine which is made up of species formed in the reaction of free chlorine with ammonia
which is present in the water. Combined Chlorine is thus made up of a general class of compounds called
chloramines with formulae such as NH2Cl, NHCl2, and NCl3. In water which is treated just with chlorine,
there will be a small amount of combined chlorine from the natural ammonia in the water and a large
amount of free chlorine; in water which is treated with both free chlorine and ammonia there will be a small
YSI Incorporated
Drinking Water Monitoring Systems Operations Manual
H-6
Frequently Asked Questions About YSI Drinking Water Systems
Appendix H
amount of free chlorine and a large amount of combined chlorine. Total Chlorine is defined as the sum
of the free and combined chlorine concentrations.
How are combined and total chlorine measured?
Combined chlorine is usually not measured directly. Instead, the free chlorine is measured by a colorforming chemical test under one set of conditions and the total chlorine is measured colorimetrically under
a slightly different set of conditions. Since Total Chlorine = Free Chlorine + Combined Chlorine, the
Combined Chorine is calculated as the difference between the Total and Free Chlorine values.
Can the YSI Free Chlorine Sensor measure Total Chlorine?
No. It is very important to be aware of the fact that the YSI 6572 free chlorine sensor and its electronics
measure only free chlorine – the sensor is unresponsive to combined chlorine (chloramines). This makes
the sensor of questionable utility for measuring “chlorine” in distribution systems which use ammonia as
part of the treatment process and thus have predominantly combined chlorine in their drinking water.
Can the YSI Free Chlorine Sensor function in water with high pH?
Yes, unless the pH is much higher than normal for most drinking water sites. From empirical testing, it
appears that the YSI free chlorine sensor is less sensitive to OCl- than it is to HOCL and as the pH rises,
there is no question that the amount of HOCl relative to OCl- is reduced significantly. This means that the
sensitivity of the sensor to the mixture of HOCl and OCl- is reduced at high pH, but the sensor has been
shown empirically to have enough overall sensitivity to be functional at pH values up to ca. 9.3 and data to
support this claim is available on request from YSI. Note, however, that at pH values above 8.8, there is a
possibility that calibration errors can occur. If you see these errors, contact YSI Technical Support for
advice on whether to override them.)
The YSI philosophy relative to the use of the free chlorine sensor at high pH is to calibrate the sensor under
the these conditions of reduced sensitivity in the high pH water and then assume that minor variations in
pH during the monitoring study will have only a minimal effect on accuracy. This philosophy has been
adopted rather than compensating for changes in pH using the on-board pH sensor in the sonde. It was
decided not to do pH compensation because chlorine is usually the most important parameter to the
drinking water industry and the accuracy of this parameter would be grossly compromised if a pH sensor
failed while providing compensation data during long term monitoring studies. In other words, we feel
that the risk of pH probe failure or significant drift is more likely to be a problem to users than the smaller
inaccuracies in the uncompensated pH data which might result from small changes in pH. Note that the
quoted accuracy specification for water which has a pH of greater than 8.5 is only valid if the pH changes
less than 0.3 pH units from the pH at the time of calibration. In addition, users should note that it will not
be possible to make free chlorine measurements with the YSI free chlorine sensor under any conditions if
the pH exceeds ca. 9.3.
The plot below shows that the chlorine sensor can function well in water of high pH (average of 8.7) as
long as it is calibrated versus a DPD analysis in the high pH water. Note that the final QC point which was
taken in water at a pH of 7.5 and shows a positive error relative to the DPD analysis since the sensitivity of
the sensor to free chlorine had increased significantly as predicted once the sensor was transferred to the
lower pH water.
YSI Incorporated
Drinking Water Monitoring Systems Operations Manual
H-7
Frequently Asked Questions About YSI Drinking Water Systems
Appendix H
TESTING OF PROTOTYPE YS DW SYSTEM RUNNING CONTINUOUSLY ON A 6500 IN WATER
WITH AN AVERAGE pH OF 8.7; RECALIBRATION OF SENSOR AFTER 20 DAYS
1.3
1.2
1.1
FREE CL2, MG/L
1
0.9
QC
YSI
0.8
0.7
0.6
0.5
0.4
0
10
20
30
40
50
60
70
TIME, DAYS
SENSOR CALIBRATION
Is there any difference in the calibration of Drinking Water sonde sensors from standard YSI sondes
for surface- or ground-water?
Only for the free chlorine sensor. Sensors other than free chlorine (typically conductivity, pH, ORP, and
turbidity) are calibrated in the same way in drinking water sondes as for standard YSI 6-series surface- and
ground-water sondes, using the same calibration vessels. As described in the next section, however, the
calibration of the free chlorine sensor is somewhat different.
How is the Free Chlorine Sensor Calibrated?
To calibrate the free chlorine sensor, you must make an independent measurement of the free chlorine in
the flow cell effluent at the time of calibration. This is usually done by collecting a effluent sample,
adding a chemical to it (DPD) which will form a red color which is proportional to the free chlorine in the
sample and then determining the intensity of the color using a commercial colorimeter. The analysis is
very simple and takes only about 2 minutes to perform. Once the true chlorine value has been determined
from the DPD colorimetric analysis, this value is input into the sonde software and the calibration is
confirmed.
Where can I obtain the chemicals and colorimeters which are necessary to calibrate the YSI free
chlorine sensor?
The YSI 9000 and 9100 Photometers and the version of the Hach Pocket Colorimeter TM II which is
specific for free and total chlorine are examples of colorimeters which can be purchased for the analysis of
free chlorine in water samples. In addition, you usually will need to purchase the color-forming reagents
in either pill or powder form – YSI Item # YAP 001 for the YSI photometers; Hach Item # 21055-69 for
the Hach colorimeter. The cost of the reagents is nominal.
YSI Incorporated
Drinking Water Monitoring Systems Operations Manual
H-8
Frequently Asked Questions About YSI Drinking Water Systems
Appendix H
Can I just make up a free chlorine standard from commercial bleach and use that to calibrate my
free chlorine sensor?
This procedure is not recommended and is likely to result in significant errors in your subsequent readings
for three reasons: (1) The concentration of hypochlorite on the bleach bottle is for new bleach batches and
may not be correct if the bleach has been on the shelf for varying periods of time; (2) Dilute solutions of
hypochlorite may be unstable and change during the calibration procedure; and (3) Because the free
chlorine sensor is flow dependent, it needs to be calibrated in water flowing at the same rate as will be used
in the continuous monitoring studies. This flow condition is almost impossible to meet by immersing the
sensors in stagnant or agitated solutions of bleach. It is important to understand that YSI may not be able
to provide customer support for users who do not perform their free chlorine sensor calibrations by the
recommended procedure.
Could I measure total chlorine with my colorimeter kit and then calibrate the YSI Free Chlorine
sensor to that value?
Subject to additional field trials as described above, you might be able to do this if you know that there is a
high percentage of combined chlorine in your water and you are willing to accept qualitative versus
quantitative results in terms of accuracy. Remember, however, that, even if the sensor does respond in
some way to combined chlorine, you would not really be measuring total or combined chlorine – only a
qualitative value for the oxidation capability of the water. In addition, it is likely that you would see
calibration errors when using the total chlorine value. Overall, it should be remembered that the YSI
sensor is designed to measure free chlorine, and, until additional research is performed, any attempts to
correlate the sensor output with other parameters is risky.
What accuracy does free chlorine sensor provide?
Immediately after calibration at any value, the sensor should show an accuracy of +/- 15 % of the reading
or 0.05 mg/L, whichever is greater, over the specified range of the sensor (0-3 mg/L). Subsequent
inaccuracy will be determined by the drift of the sensor, the extent of which can vary with the water being
monitored. It is important to remember that the accuracy specification provided for the free chlorine sensor
does not include long term drift even though our empirical studies in several water monitoring sites show
that the specification can be met in extended deployments as shown in the figures below. Inaccuracy of
the sensor from drift (determined from periodic colorimetric analysis) can easily be removed by
recalibration of the sensor at the time of quality checks.
YSI Incorporated
Drinking Water Monitoring Systems Operations Manual
H-9
Frequently Asked Questions About YSI Drinking Water Systems
Appendix H
Study 1
Study 2
MONITORING OF FREE CHLORINE IN AT OHIO
SITE; 82 DAY STUDY; ONE RECALIBRATION
AFTER 7 DAYS OF DEPLOYMENT
2
FREE CHLORINE, MG/L
1.8
1.6
QC
YSI
1.4
1.2
1
0.8
0
10
20
30
40
50
60
70
80
TIME, DAYS
YSI Incorporated
Drinking Water Monitoring Systems Operations Manual
H-10
Frequently Asked Questions About YSI Drinking Water Systems
Appendix H
Study 3 – All Data
Study 3 Expansion
How often should I check the accuracy of and/or recalibrate the free chlorine sensor?
You should confirm the accuracy of your free chlorine readings relative to a DPD colorimetric analysis
within one week of your deployment and as often as possible thereafter. Calibration checks involve
making a visit to the deployment site, performing a DPD colorimetric test of the flow cell effluent with a
handheld, battery-powered colorimeter and recalibrating the sensor if significant drift is evident. It is
important to note that because the free chlorine sensor is calibrated in situ, i.e., in flowing water in the flow
cell, the sonde setup at the site need not be disturbed, making the recalibration procedure very quick and
easy. If drift in the same direction continues to be observed, if calibration errors are evident during the
calibration process, and/or if the free chlorine readings become jumpy, then you should remove the free
chlorine probe from the sonde, recondition it, install a new membrane, and activate the sensor as described
in Section 2.6.1 of the Drinking Water Sonde Manual.
YSI Incorporated
Drinking Water Monitoring Systems Operations Manual
H-11
Frequently Asked Questions About YSI Drinking Water Systems
Appendix H
How accurate is the colorimetric DPD check of accuracy?
Commercial colorimeters for DPD analysis are very accurate when used properly. However, there can be
errors in the determination which result either from user technique or water chemistry. For example, there
can be errors in the DPD determination which are caused by dirty cells during the analysis processes of
zeroing the instrument or taking a reading. In addition, reagents which are out of date and thus have lost
their potency could cause errors. To avoid problems of this nature, always make sure that the colorimeter
cell has been wiped clean with lens cleaning paper both prior to taking the zero reading and after addition
of reagent prior to taking an actual reading. Also make certain that the reagent pills or packets are within
their shelf-life limitation. Since the analysis is so easy to perform, you should always perform repetitive
analyses of the flow cell effluent until subsequent readings agree within the specification of the colorimeter
– typically 0.05 mg/L.
The DPD analytical procedure for free chlorine is also susceptible to interferences from any oxidizing
species other than free chlorine in the water which might oxidize the DPD reagent. If these non-chlorine
oxidizing species are present, then they will produce color in addition to that from the free chlorine and this
will result in a DPD chlorine value which is erroneously high. Fortunately, the rate of color formation is
usually relatively slow compared to that from free chlorine which is effectively instantaneous. Therefore,
you can usually determine if extraneous oxidizing species are present in the water sample by reading the
color immediately after reagent addition and then again after about 2 minutes. If the value does not change
significantly, then the color is likely to be due to free chlorine only; if the reading after 2 minutes is
significantly different, then it is likely that other color-forming oxidants are present and the free chlorine
reading could be in error.
YSI Incorporated
Drinking Water Monitoring Systems Operations Manual
H-12
1700/1725 Brannum Lane
Yellow Springs, Ohio 45387 USA
(800) 765-4974 (937) 767-7241
FAX: (937) 767-9320
Website: http://www.ysi.com
E-mail: [email protected]
Item # 660019
Drawing # A660019
Revision B
June 2006