1
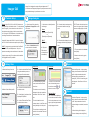
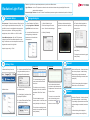
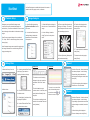
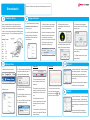
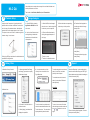
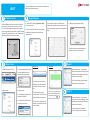
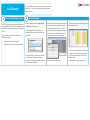
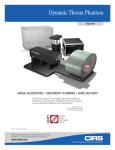
WWW.
.COM
Version 5.2
Quick Start Guide
STANDARD IMAGING, INC.
3120 Deming Way
Middleton, WI 53562-1461
Mar / 2015 ©2015 Standard Imaging, Inc.
DOC # 80714-01
TEL 800.261.4446
TEL 608.831.0025
FAX 608.831.2202
General Precautions
Warnings and Cautions alert users to dangerous conditions that can occur if instructions in the
manual are not obeyed. Warnings are conditions that can cause injury to the operator, while
Cautions can cause damage to the equipment.
CAUTION:
Federal law in the U.S.A., and Canadian law, restricts the sale distribution, or
use of this product to, by, or on the order of a licensed medical practitioner. This
product should be used under the guidance of a medical physicist.
CAUTION:
The “Save” and “Save As” functions of the PIPSpro System are intended solely
to save solutions of interest or potential reuse.  Specific patient information or
identifiers should not be saved using these functions.
CAUTION:
To minimize the potential for computer issues, do not run PIPSpro concurrently
with other software programs.
CAUTION:
For professional use only. As desired by IAEA, English is the default language
for labeling and manuals. If translated versions are available, resolve any
difference in favor of the English versions.
Introduction
This Quick Start Guide provides basic instruction for how to use the PIPSpro software. This includes
a one-page guide for each module, in the following order:
1.
Imager QA
CAUTION:
Proper use of this product depends on careful reading of all instructions and
labels.
2.
Radiation Light Field
3.
StarShot
CAUTION:
For accurate results in the MLC QA Module the MLC QA Phantom must be
positioned carefully to ensure that the corner spherical marker is aligned to
isocenter and that the supporting arm is perpendicular to the gantry rotation.
4.
Stereotactic
5.
MLCQA
6.
IGRT
7.
Leaf Speed
CAUTION
The MLC module expects all tests to be performed with the collimator at either
0, 90, 180 or 270 degrees. Collimator angle accuracy should be verified before
acquiring images for analysis in the MLC module. Variance in the expected
angle could result in incorrect positions being reported for individual MLC leaves.
WARNING:
Issues identified through the use of this product must be investigated and
appropriately resolved and/or noted.
WARNING:
Proper application of the QC-3 Phantom, QCkV-1 Phantom and/or FC-2 Phantom
requires the use of the PIPSpro Software.
WARNING:
Where applicable, Standard Imaging products are designed to be used with the
versions of common radiation delivery devices, treatment planning systems and
other common computer software products or systems used in the delivery of
ionizing radiation, available at the time the Standard Imaging product is released.
Standard Imaging does not assume responsibility, liability and/or warrant against,
problems with the use, reliability, safety or effectiveness that arise due to the
evolution, updates or changes to these products or systems in the future. It is the
responsibility of the customer or user to determine if the Standard Imaging product
can be properly used with these products or systems.
Please note that this guide only includes the basic instructions for each module, and does not include
every possible detail or function. For more in-depth information (including installation/setup) refer to
the main PIPSpro User Manual.
Imager QA
1
Imager QA is designed to analyze flat panel planar and CT
(Cone-beam and Diagnostic) images for quality assurance and to
track possible changes in performance over time.
2
Phantom Setup
Planar: Align QC-3, QCkV, or QCkV-R phantom at a
45 degree angle, so that the number ‘1’ on the phantom
faces the gantry. Lines and marks on the surface of
the phantom assist aligning it with the central beam
line. If using the TOR-18 phantom, it should be set up
according to manufacturer recommendations.
Image Analysis
1. Open Imager QA by selecting
Application> Imager QA from the
main menu.
Acquire MV images with 3-5 MU. Acquire kV images
with 70-100 kV and the lowest exposure (mAs) settings.
CBCT: Images can be acquired with the CatPhan®
model 503, 504, and 600 phantoms. Set up the
phantom according to the manufacturer’s instructions.
Planar:
[Phantom] and [Flood Field]
- or [Phantom] and [Phantom]
2. Select a Quick Select profile,
or enter machine information.
5. If needed, adjust markups using
the controls located on the right
panel.
4. Edge and
ROI markups
will be placed in
automatically.
7. To save results to the database,
select [Save].
To discard results and try again,
select [Reset].
4
History View
1. Select the History View tab.
2. Select a Quick Select profile.
Table View
Report
Chart View
Select the Report tab. In the resulting
dialog, select the desired Quick Select
profile. Adjust calendar and active/
archived settings as needed, then
select [OK]. A Print Preview dialog will
be displayed. Select Save or Print as
desired.
3. Select the desired Date Range
using the available pre-sets, or
select specific calendar dates.
4. Choose to view either Active or
Archived records.
5. Select [Apply], and data will be
displayed as specified.
6. Use the Table and Chart Tabs
to switch between views.
To view details about a specific
record, select the Show Detail
check box.
To exclude a record from being
displayed in the chart, select the
associated “Don’t Chart” check
box.
To archive data that are not
relevant, select it in the Table, and
select [Archive] in the left panel.
To re-activate an archived record,
select it in the archived Table and
select [Activate].
CBCT Results: Use the drop down
menu in the upper right to navigate
between multiple pages of results.
6. Results will be displayed in a new
tab page within the Image Analysis
view.
CBCT:
[CT Series]
Acquire images using 2.5 mm slices and the smallest
field (highest resolution) available.
3
3. Use buttons in the left panel to
load images:
To zoom in on an area of the
chart, click and drag across
the section use the
or
buttons to zoom out again.
Table and Chart
CBCT trends will be displayed
on more than one table or chart.
Use the drop down menu in the
upper right to navigate between
multiple pages of results.
5
Export
Select the Export tab. In the resulting
dialog, select the desired Quick Select
profile. Adjust calendar and active/
archived settings as needed, then select
[OK].
A Save As dialog will be displayed.
Choose a directory and select [Save].
Radiation Light Field uses specialized phantoms to perform two different tests:
Radiation Light Field
1
Light Field test: Use the FC-2 phantom to determine the coincidence between the projected light field and the
actual radiation delivered.
Advanced Light Field test: Use the FC-2 and Center Marker phantoms together to determine the position of the jaws.
2
Phantom Setup
FC-2 phantom: Position the phantom 100 cm from the
source using the optical distance indicator (ODI). The
light field is turned on and alighted to the appropriate
square on the phantom. With the gantry pointing
straight down, deliver 10x10 cm or 15x15 cm field.
Center Marker phantom: After the FC-2 phantom
is aligned, place the Center Marker phantom on top.
Align it so that the cross hair and spherical marker are
aligned to the center of the light field.
Image Analysis
1. Open Radiation Light Field by
selecting Application> Radiation
Light Field from the main menu.
3. Select Radiation Light
Field>Load Images in the main
menu. Select the desired image.
2. Use the Linac Select tab and
resulting dialog to indicate the
department and linac the data
corresponds to.
4. Select [Calculate].
5. Markups will automatically be
placed around the outer spherical
markers.
6. Results will be displayed in a
new tab page within the Image
Analysis view.
7. To save results to the database,
select [Save].
Acquire images using 3 - 5 MU.
To discard the results and try again,
select [Reset].
3
History View
1. Select the History View tab.
Table View
Report
Select the Report tab. Select the desired
linac when prompted. In the following
Reports dialog, adjust calendar and
active/archived settings as needed, then
select [OK].
3. Select the desired Date Range
using the available pre-sets, or
select specific calendar dates.
To view details about a specific
record, select the Show Detail
check box.
2. Select a linac.
Chart View
4
4. Choose to view either Active or
Archived records.
5. Select [Apply], and data will be
displayed as specified.
6. Use the Table and Chart Tabs
to switch between views.
To exclude a record from being
displayed in the chart, select the
associated “Don’t Chart” check
box.
To archive data that are not
relevant, select it in the Table, and
select [Archive] in the left panel.
To re-activate an archived record,
select it in the archived Table and
select [Activate].
Use the tabs at the bottom of
the chart to switch between the
Displacement Chart and the Jaw
Position Chart.
To zoom in on an area of the
chart, click and drag across
the section use the
or
buttons to zoom out again.
A Print Preview dialog will be displayed.
Select Save or Print as desired.
5
Export
Select the Export tab. Select the desired
linac when prompted. In the following
Export dialog, adjust calendar and active/
archived settings as needed, then select
[OK].
A Save As dialog will be displayed.
Choose a directory and select [Save].
Use StarShot images to establish the diameter of the center of
rotation for the linac gantry, couch, or collimator.
StarShot
1
2
Phantom Setup
Both gantry and couch StarShot images need
to be acquired on film (standard radiographic or
radiochromic). Close lower collimators to form a narrow
slit and through which radiation is delivered at multiple
angles.
Scan film as a grayscale image with a resolution of
72 - 96 dpi. Save in a lossless image format, such as
bitmap (.bmp).
Image Analysis
1. Open StarShot by selecting
Application> StarShot from the
main menu.
3. Select StarShot>Load Image in
the main menu. Select the desired
image.
2. Use the Linac Select tab as
resulting dialog to indicate the
department and linac the data
corresponds to.
4. Under ‘Settings’, select the
Angle Type from the drop down
menu.
4. Place a single fiducial marker by
clicking on the image. The marker
should be placed near the center of
the intersecting projections.
Note: If separate images were acquired for each angle,
the images will need to be combined using PIPSpro
image processing tools.
7. To save results to the database,
select [Save].
5. Select [Calculate]. (Markups will
be placed automatically.)
3
4
History View
Table View
1. Select the History View tab.
Chart View
Select the Report tab. Select the desired
linac when prompted. In the following
Reports dialog, adjust calendar and
active/archived settings as needed, then
select [OK].
3. Select the desired Date Range
and Image Type controls to
specify which data to display.
4. Choose to view either Active or
Archived records.
5. Select [Apply], and data will be
displayed as specified.
6. Use the Table and Chart Tabs
to switch between views.
To archive data that are not
relevant, select it in the Table, and
select [Archive Selected] in the
left panel.
To re-activate an archived record,
select it in the archived Table and
select [Activate].
To discard results and try again,
select [Reset].
Report
To exclude a record from being
displayed in the chart, select the
associated “Don’t Chart” check
box.
2. Select a linac.
6. Results will be displayed in a
new tab page within the Image
Analysis view.
To zoom in on an area of the
chart, click and drag across
the section use the
or
buttons to zoom out again.
A Print Preview dialog will be displayed.
Select Save or Print as desired.
5
Export
Select the Export tab. Select the desired
linac when prompted. In the following
Export dialog, adjust calendar and active/
archived settings as needed, then select
[OK].
A Save As dialog will be displayed.
Choose a directory and select [Save].
Stereotactic
1
2
Phantom Setup
Align a spherical Winston-Lutz style phantom at
isocenter as defined by the light field crosshairs.
Collimate the treatment beam with a stereotactic cone
or MLC. Acquire 8 separate images at differing gantry
and couch angles. The recommended angles are as
follows:
GantryCouch
600
1300
2300
3000
60270
130270
23090
30090
3
Perform a Winston-Lutz style test and track changes over time.
Image Analysis
1. Open Stereotactic by selecting
Application> Stereotactic from
the main menu.
3. Select a folder to load images
from via Stereotactic>Set Load
Folder in the main menu.
2. Use the Linac Select tab and
resulting dialog to indicate the
department and linac the data
corresponds to.
4. Auto-Load images by selecting
Stereotactic>Auto-Load Images,
or load images manually by
selecting an image box and image
file from the browse list, then
Stereotactic>Load Image.
5. Markups will be placed
automatically. Enter values as
needed.
6. Verify the Gantry and Couch
angles, then select [Calculate].
8. To save results to the database,
select [Save].
To discard results and try again,
select [Reset].
History View
Table View
1. Select the History View tab.
Chart View
4
Report
Select the Report tab. Select the desired
linac when prompted. In the following
Reports dialog, adjust calendar and
active/archived settings as needed, then
select [OK].
3. Select the desired Date Range
using the available pre-sets, or
select specific calendar dates.
To view details about a specific
record, select the Show Detail
check box.
2. Select a linac.
7. Results will be displayed in
the lower left corner of the Image
Analysis view.
4. Choose to view either Active or
Archived records.
5. Select [Apply], and data will be
displayed as specified.
6. Use the Table and Chart Tabs
to switch between views.
To exclude a record from being
displayed in the chart, select the
associated “Don’t Chart” check
box.
A Print Preview dialog will be displayed.
Select Save or Print as desired.
To zoom in on an area of the
chart, click and drag across
the section use the
or
buttons to zoom out again.
5
Export
To archive data that are not
relevant, select them in the Table,
and select [Archive] in the left
panel.
Select the Export tab. Select the desired
linac when prompted. In the following
Export dialog, adjust calendar and active/
archived settings as needed, then select
[OK].
To re-activate an archived record,
select it in the archived Table and
select [Activate].
A Save As dialog will be displayed.
Choose a directory and select [Save].
Use multiple tests to analyze the accuracy of the multi-leaf collimator and
track its performance over time.
MLC QA
Tests include: Leaf Position, Multi-Port, Leaf Transmission.
1
2
Phantom Setup
Using the In-Air Comparison Jig, position the MLC
phantom with the isocenter so that the Couch will not
be in the way of the treatment beam. Note that the
phantom has 5 radio opaque spheres in an ‘L’ shape.
The sphere in the corner of the ‘L’ should be aligned to
isocenter using in-room lasers.
Image Analysis
1. Open MLCQA by selecting
Application> MLCQA from the
main menu.
3. Select MLCQA>Load Image in
the main menu. Load the image file
for the test you wish to perform.
2. Use the Linac Select tab and
resulting dialog to indicate the
department and linac the data
corresponds to.
4. Place two fiducial markers by
clicking the appropriate spots on
the image.
5. Select the button corresponding
to the test you wish to perform.
6. Results will be displayed in a
new tab page within the Image
Analysis view.
7. To save results to the database,
select [Save].
Refer to the PIPSpro User Manual for details about testspecific MLC configurations.
3
History View
1. Select the History View tab.
To discard results and try again,
select [Reset].
1st marker = center
2nd marker = furthest from center.
4
3. Select the desired Date Range
and Image Type controls to specify
which data to display.
6. Use the tabs at the top of the
History View to view either Left or
Right Bank data.
To archive data that are not relevant,
select it in the Table, and select
[Archive] in the left panel.
To re-activate an archived record,
select it in the archived Table and
select [Activate].
Table View
Chart View
To see the chart for a particular leaf,
select the associated checkbox in the
Trend Leaf column. The chart will be
displayed directly below the table.
To zoom in on an area of the chart,
click and drag across the section use
the
or
buttons to zoom out
again.
Export
Select the Export tab. In the resulting dialog,
select the desired Date Range and Test Type.
Adjust calendar and active/archived settings as
needed, then select [OK].
2. Select a linac.
4. Choose to view either Active or
Archived records.
5. Select [Apply], and data will be
displayed as specified.
A Save As dialog will be displayed. Choose a
directory and select [Save].
Using the MIMI phantom, track deviations in coincidence of
imaging and radiation isocenters.
IGRT
1
2
Phantom Setup
Place the MIMI phantom on the couch and align with
the isocenter using the lasers. Acquire a set of 2D
or 3D projections images, and analyze them with the
linac’s image analysis system 2D/2D or 3D/3D matching
algorithm. This will provide the X, Y, and Z offsets of the
phantom compared to the reference image.
Image Analysis
1. Open IGRT by selecting Application> IGRT
from the main menu.
2. Use the Linac Select tab and resulting dialog
to indicate the department and linac the data
corresponds to.
3. No images are used in the IGRT module.
Instead, enter deviation values determined by the
linac’s image analysis system into the appropriate
fields.
4. When ready, select [Save Results].
The data will be saved to the database and
available for review in the History View.
3
4
History View
Table View
1. Select the History View tab.
2. Select a linac.
Report
Chart View
Select the Report tab. In the resulting
dialog, select the desired settings. Adjust
calendar and active/archived settings as
needed, then select [OK].
3. Select the desired Date Range
using the available pre-sets, or
select specific calendar dates.
4. Choose to view either Active or
Archived records.
5. Select [Apply], and data will be
displayed as specified.
6. Use the Table and Chart Tabs
to switch between views.
A Print Preview dialog will be displayed.
Select Save or Print as desired.
To exclude a record from being
displayed in the chart, select the
associated “Don’t Show” check
box.
To archive data that are not
relevant, select it in the Table, and
select [Archive] in the left panel.
To re-activate an archived record,
select it in the archived Table and
select [Activate].
To zoom in on an area of the
chart, click and drag across
the section use the
or
buttons to zoom out again.
5
Export
Select the Export tab. In the resulting
dialog, select the desired settings. Adjust
calendar and active/archived settings as
needed, then select [OK].
A Save As dialog will be displayed.
Choose a directory and select [Save].
Leaf Speed
1
Concerning DynaLog Files
MLC QA using DynaLog files requires new methods of
data acquisition as well as a basic understanding of the
information in DynaLog files and how it is interpreted by
PIPSpro.
For further information, refer to the following in the
PIPSpro user manual:
•
•
Use the Leaf Speed module to calculate “Loss of Leaf Speed” as
specified in TG-142, Table V for linear accelerators with Varian
Millennium MLC’s.
2
Logfile Analysis
1. Open Leaf Speed by selecting Application>
Leaf Speed from the main menu.
2. Use the Machine drop-down menu in the
left panel to specify the machine your files were
created with.
Once loaded, PIPSpro will attempt to find a Quick
Select that matches the selected files. If there
is no matching Quick Select, you can create a
new Quick Select after calculating and saving the
results. Edit values in the Manual select box to
match preferred nominal values as needed.
Results will be displayed in a new tab page within
the Image Analysis view.
Appendix C: Acquiring DynaLog Files
Appendix D: DynaLog Files and Logfile Analysis
3. Select [Load File]. A browser will open which
pre-interprets your logfile pairs and presents
valid pairs as a single entry in a table. Select the
desired file, then select [Open].
5. To save results to the database, select [Save].
To approve the saved results, select [Approve].
Only Physicists and Physicians may approve
database results.
4. When ready, select [Calculate].
To discard unsaved results, select [Reset].