1
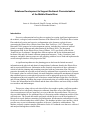
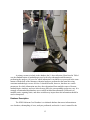
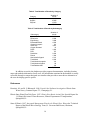
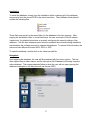
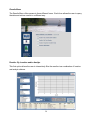
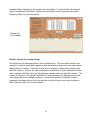
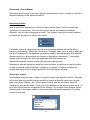
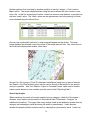
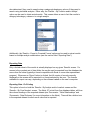
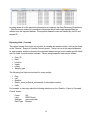
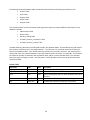
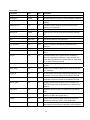
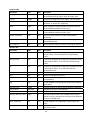
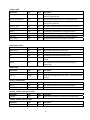
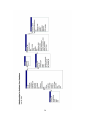
Contract Report 2008-11 Database Development to Support Sediment Characterization of the Middle Illinois River James A. Slowikowski, Brad D. Larson, and Amy M. Russell Center for Watershed Science Prepared for the Illinois Conservation Foundation September 2008 Illinois State Water Survey Institute of Natural Resource Sustainability University of Illinois at Urbana-Champaign Champaign, Illinois Database Development to Support Sediment Characterization of the Middle Illinois River by James A. Slowikowski, Brad D. Larson, and Amy M. Russell Center for Watershed Science Illinois State Water Survey Champaign, IL Prepared for the Illinois Conservation Foundation September 2008 September 2008 Any opinions, findings, and conclusions or recommendations expressed in this publication are those of the authors and do not necessarily reflect the views of the Illinois Conservation Foundation. Abstract Over the past 20 years, a significant effort has been made to further the goal of restoring or naturalizing the Illinois River. Central to this effort has been the development of strategies designed to address the excessive sedimentation that continues to occur today in the Illinois River and associated backwater lakes. When addressing accumulated sediments, dredging has been the most common recommendation as a means of achieving depth diversity necessary to provide adequate habitats for desired aquatic species and maintain connectivity between backwater lakes and the main stem of the Illinois River. A significant impediment to the planning process has been the limited amount of information on the physical and chemical composition of sediments found in the Illinois River and its associated backwaters. In addition, data collected to date have not been readily available to researchers and land managers. This report describes the methodologies used in initial efforts to collect and analyze sediment cores to characterize the sediments of the middle Illinois River and describes a database and user interface developed to facilitate the dissemination of these data. This database contains information on the chemical and physical properties of sediments collected from 102 deep sediment cores. In addition to more than 37,000 analytical and descriptive results, information describing the time, location, and physical attributes of each sediment core is available in the database, along with more than 700 photographs of split sediment cores. iii Table of Contents Introduction ..................................................................................................................................... 1 Acknowledgements ......................................................................................................................... 2 Study Area ...................................................................................................................................... 3 Sediment Core Methods ................................................................................................................ 11 Database Description .................................................................................................................... 13 Database Design............................................................................................................................ 14 Database Navigation ..................................................................................................................... 15 Summary ....................................................................................................................................... 15 References ..................................................................................................................................... 16 Appendix A: Standard Operating Procedures for the Collection of Sediment Cores Using the Rossfelder P-3c Vibrocore ................................................. 17 Appendix B: ISWS Sediment Core Database User’s Manual ...................................................... 25 Appendix C: ISWS Sediment Core Database Data Dictionary .................................................... 43 Appendix D: ISWS Sediment Core Database Relationship Diagram .......................................... 49 iv List of Figures Figure 1. Map index of sediment core locations.. ........................................................................... 4 Figure 2. Location of eight sediment cores collected near Beardstown, IL (Map 1).. ................... 5 Figure 3. Location of nine sediment cores collected from Rice Lake State Fish and Wildlife Area (Map 2)................................................................................................................................ 6 Figure 4. Location of 28 sediment cores collected near Lower Peoria Lake (Map 3). ................... 7 Figure 5. Location of 15 sediment cores collected from Upper Peoria Lake between Peoria and Chillicothe, IL (Map 4). ...................................................................................................... 8 Figure 6. Location of 24 sediment cores collected between Chillicothe and Lacon, IL (Map 5)………………………………………………………..…………………….......... 9 Figure 7. Location of 18 sediment cores collected between Lacon and Hennepin, IL (Map 6).............................................................................................................................. 10 Figure 8. Sediment core after splitting. ......................................................................................... 13 v List of Tables Table 1. Data Collection Efforts Included in the ISWS Sediment Core Database. ...................... 11 Table 2. Total Number of Results by Category. ........................................................................... 16 Table 3. Total Number of Results by Subcategory. ...................................................................... 16 vi Database Development to Support Sediment Characterization of the Middle Illinois River by James A. Slowikowski, Brad D. Larson, and Amy M. Russell Center for Watershed Science Introduction Excessive sedimentation has long been recognized as causing significant impairments to the aesthetic, ecological, and economic functions of the Illinois River. The Illinois River Action Plan ranked soil erosion and excessive sedimentation as the foremost ecological issues concerning the Illinois River (Illinois State Water Plan Task Force, 1987). Demissie and Bhowmik (1986) proposed several management options, including the creation of artificial islands, to manage sediments and sedimentation in the Illinois River. The Integrated Management Plan for the Illinois River (State of Illinois, 1997) specifically called for the “beneficial use of sediments” through three different options and for the implementation of backwater lake and side channel sediment management measures. Today, researchers, land managers, and public interest groups are still grappling with how best to fund and implement the various strategies that have been proposed to date. A significant impediment to the planning process has been the limited amount of information on the physical and chemical composition of sediments found in the Illinois River and its associated backwaters. Information on the chemical composition of these sediments is critical to both the planning and permitting associated with any restoration effort. Physical properties determine the uses that are best suited for sediments from a particular area of interest. For example, plans for artificial islands, elevated floodplains, and topsoil amendments all require that sediments possess certain physical properties such as appropriate grain size. In addition, information on physical properties such as moisture content and unit weight allow for effective and efficient planning, including the proper selection and sizing of available dredge technologies. To date, this information has been limited and the data collected have not been readily available to researchers and land managers. This project, along with several related efforts, has sought to gather a sufficient number of sediment cores to adequately characterize sediments from those areas of the Illinois River where restoration activities are most likely to occur within the foreseeable future. This project also provided funding for five additional days of vibrocoring and the subsequent analyses of the collected cores. The second deliverable associated with this project was the development of a Microsoft Access® database containing field information, documentation, and analytical results for all cores collected under these related efforts. This database includes a user interface, which provides easy access to information regardless of the user’s familiarity with databases. The database currently contains complete information for the 102 sediment cores that were collected and analyzed through these related efforts. 1 Acknowledgements Funding for this project was provided by the Illinois Conservation Foundation, under the direction of Mr. John Bandy, and was made possible through an agreement between the State of Illinois and Dynegy Midwest Generation, Inc. This project, as well as earlier projects that were responsible for many of the vibrocore samples previously collected, has truly been a collaborative effort involving researchers and staff from the Illinois State Water Survey (ISWS), Illinois State Geological Survey (ISGS), Illinois Sustainable Technology Center (ISTC, formerly WMRC), and the Department of Natural Resources and Environmental Sciences at the University of Illinois at Urbana-Champaign (UIUC). Dr John Marlin, ISTC, serves as project manager of an integrated sediment reuse project, of which this project was a part. In addition, Dr. Marlin was project manager for several of the earlier efforts for which the sediment cores were originally collected. Dr. Marlin assisted with the post-processing of many of the sediment cores and provided assistance with quality control efforts. Dr. Robert Darmody, UIUC Department of Natural Resources and Environmental Sciences, generously made available those data pertaining to the physical and agronomic properties of collected sediment samples and graciously supported the reformatting effort involving these data. Dr Darmody has long been a proponent of the beneficial reuse of sediments and an asset to the success achieved to date. Vibrocoring efforts at the ISWS have benefited from his experience and advice. Richard Cahill, ISGS, made available all inorganic chemistry and radiological data derived from his research on sediments resulting from those cores included in the database, and generously supported the reformatting efforts necessary for inclusion into the database. In addition, Mr. Cahill has been an active participant in the ISWS vibrocoring efforts, including the collection of sediment cores in the field. ISWS vibrocoring efforts have benefited from both his professional experience as well as his time on the river. All individuals previously mentioned also graciously invested their time in developing the design of the user interface and the beta testing of the final product. The U.S. Army Corps of Engineers (USACE) provided funding for the collection and analyses for 16 of the cores that have been included in the database. Project manager for that effort was Marshall Plumley, USACE Rock Island District. Other organizations that provided funding for the collection and analyses of sediment cores contained in the database included the City of East Peoria, Fon du Lac Park District, Office of Lt. Governor Pat Quinn, and the ISTC. Kip Stevenson and Mike Smith of the ISWS provided essential contributions to the vibrocoring efforts. Without their willingness to invest the extra effort often associated with fieldwork, much of the information contained in the database would not exist. In addition to his field efforts, Mike Smith along with Josh Stevens and Joy Miller, also with the ISWS, assisted in processing collected sediment cores, as well as with reformatting and developing data included in the database. 2 Study Area All sediment cores collected for this project, as well as all cores currently contained in the Illinois State Water Survey (ISWS) sediment core database, were collected from the middle Illinois River or associated backwater lakes. This area can generally be described as that reach of the river between LaGrange Lock and Dam (River Mile 80.2) and Hennepin, IL (River Mile 207.5). The greatest concentration of cores collected to date occurred in Peoria Lakes. An index map showing the location of all cores included in this project can be found in Figure 1, and higher resolution maps for selected areas are shown in Figures 2–7. Table 1 lists the 11 data-collection efforts that contributed to the database. The first six projects listed in Table 1 were separate research efforts that shared many of the same objectives as this project. The collection, processing, and analyses of the sediment cores for the last five listings in Table 1 (10/25/06–8/9/07) were funded through this project. 3 HENNEPIN BUREAU HENRY PUTNAM MERCER Map 6 STARK GALESBURG MARSHALL Map 5 KNOX CHILLICOTHE ON R Map 4 SP O WARREN WOODFORD PEORIA PEORIA Map 3 R IS R PEKIN MA C Map 2 ILLINO KI NA W CANTON EAST PEORIA FULTON TAZEWELL HAVANA MASON LOGAN Map 1 SCHUYLER SA MO NGA SA LT NR CR MENARD N SA BEARDSTOWN GA MO CASS N R 0 6 12 18 24 Miles Legend ISWS Cores Rivers Lakes Municipalities Counties Figure 1. Map index of sediment core locations 4 345 344 343 342 341 340 338 339 0 1 2 3 Miles Map 1 ISWS Cores Figure 2. Location of eight sediment cores collected near Beardstown, IL (Map 1) 5 298 296 291 292 297 290 295 0 294 293 1 2 Miles Map 2 ISWS Cores Figure 3. Location of nine sediment cores collected from Rice Lake State Fish and Wildlife Area (Map 2) 6 192 383 191 190 189 193 329 330 186 188 187 201 332 200 195 199 196 197 198 333 334 384 185 336 194 335 385 337 0 0.5 1 Miles Map 3 ISWS Cores Figure 4. Location of 28 sediment cores collected near Lower Peoria Lake (Map 3) 7 354 362 353 361 359 360 358 356 357 355 378 381 379 380 382 0 1 2 Miles Map 4 ISWS Cores Figure 5. Location of 15 sediment cores collected from Upper Peoria Lake between Peoria and Chillicothe, IL (Map 4) 8 267 268 254 273 253 252 274 269 275 255 276 277 278 250 251 279 266 256 257 258 265 259 280 352 0 0.5 1 Miles Map 5 ISWS Cores Figure 6. Location of 24 sediment cores collected between Chillicothe and Lacon, IL (Map 5) 9 281 282 283 284 348 346 347 285 289 288 286 287 350 349 270 351 271 272 0 1 2 Miles Map 6 ISWS Cores Figure 7. Location of 18 sediment cores collected between Lacon and Hennepin, IL (Map 6) 10 Table 1. Data Collection Efforts Included in the ISWS Sediment Core Database Start date End date Water body Number of cores Number of samples Number of results 10/7/2004 11/17/2004 3/23/2006 10/7/2004 11/17/2004 3/23/2006 Illinois River Illinois River Illinois River 9 8 10 89 139 331 952 2127 4235 5/8/2006 5/9/2006 Illinois River 16 425 5650 5/17/2006 5/17/2006 Illinois River 9 285 4096 5/25/2006 5/25/2006 Illinois River Backwater 9 366 4409 10/25/2006 10/25/2006 Illinois River 9* 259 3340 3/29/2007 3/29/2007 Illinois River 8 279 3362 4/11/2007 4/11/2007 Illinois River 9 255 3399 5/23/2007 8/9/2007 5/23/2007 8/9/2007 Illinois River Illinois River 8 8 273 249 2963 2862 Location(s) Lower Peoria Lake Lower Peoria Lake Babb's Slough, Meadow Lake, Sawyer Slough, Wightman Lake Babb's Slough, Goose Lake Marshall Co., Meadow Lake, Sawyer Slough, Wightman Lake Billsbach Lake, Meridian Lake, Senachwine Lake Beebe Lake, Big Lake, Goose Lake - Fulton Co., Miserable Lake, Rice Lake Illinois River Main Channel, Lower Peoria Lake Chain Lake, Grape Island side channel, Meyer Pond, Muscooten Bay, Stewart Lake, Wood Slough Fisher Slough, Goose Lake - Marshall Co., Goose Lake Woodford Co., Mud Lake, Pothole Lake, Sawmill Lake, Weis Lake Upper Peoria Lake Upper Peoria Lake, Lower Peoria Lake, Wesley Slough *Note: One of the cores was not subsampled and submitted for analyses. Sediment Core Methods All sediment cores included in the database were collected using the Illinois State Water Survey’s vibrocore. The vibrocoring system employed by the ISWS is a model P-3c, manufactured by Rossfelder Corporation of Poway, California. The vibrocoring unit is submersible, weighs approximately 150 pounds, and is powered by a three-phase, 240-volt 6011 Hz generator. The P-3c has a working depth of 4000 feet. Sediment penetration is achieved through a method known as vibro-percussive in which the unit delivers 16-24 Kilonewtons (1 kN = 225 lbs) of force and a vibration frequency of 3450 vibrations per minute to the core tube. Coring is made possible by both the percussive force of the corer as well as the fact that the sediment particles surrounding the drive tube are “liquefied” by the vibrational forces along the tube. The corer is lowered into the sediment until the point of refusal. The unit is then engaged and coring proceeds until penetration ceases or the entire length of the drive tube is reached. The vibrocore is then extracted from the sediments with an electric winch. Once the vibrocore has been brought back to the deck, the High Density Polyethylene (HDPE) liner containing the sample is removed from the steel drive tube, capped, and placed within a Polyvinyl Chloride (PVC) transport tube to eliminate the chance of the liner being flexed and the sediments being disturbed. Penetration depths and recovery rates depend on many factors such as water content of the sediment, particle size and shape, compaction/density, and calcification. Regardless, the best results will always be obtained in unconsolidated, water-saturated sediments that are poorly sorted. A detailed description of the procedures used for collecting long sediment cores using the vibrocore can be found in Standard Operating Procedures for the Collection of Sediment Cores Using the Rossfelder P-3c Vibrocore (Appendix A). In general, cores were processed the day after they were collected. During processing, a core is placed in a jig made from schedule 80 PVC. The PVC pipe has been split in half lengthwise and is hinged on one side. Once laid in the jig, the core is seated, and the end caps are cut using a stainless steel razor knife across the short axis of the tube and even with the edges of the jig. A polymer line is then inserted into the split core liner at the bottom end on the core. The jig is then closed and the long axis of the core is split with the razor knife. A razor knife has been found superior to other methods of splitting the tube since there is no kerf, eliminating the chance for materials to be introduced to the core sample. Once the core is split, the polymer line is pulled through the length of the core. The jig is then rolled onto the hinged side and allowed to fall open, resulting in one-half of the core tube being cradled in either half of the jig with the core contents exposed (Figure 8). At this time the core is measured, photographed, videoed, and described. Once these tasks are accomplished, the selected core intervals are marked, generally into 2-centimeter (cm) segments using a stainless steel sample knife and a tee square. After all subsample intervals have been delineated, the core is sliced across the short axis using stainless steel trowels that have been modified such that the blade shape is equivalent to the cross section of one-half of a core liner. Segments are then lifted from the liner and placed into appropriate sample containers. 12 Figure 8. Sediment core after splitting A primary reason to include in the database the 11 data collection efforts listed in Table 1 was the standardization of methodologies used to develop subsamples and laboratories performing the analyses. All cores for which information is included were processed in the same manner with the bulk of the laboratory/chemical analyses performed at the same labs using consistent methodologies across all cores. It should be noted, however, that there are certain parameters for which information may have been determined from multiple sources. Because methodologies, timelines, and core intervals may differ, the corresponding results may vary. It is strongly recommended that database users read all included documentation. Differences in methods, units, reporting limits, and other variables may impact how this information should be used or interpreted. Database Description The ISWS Sediment Core Database is a relational database that stores information on core locations, subsampling of cores, analyses performed, and results. A user’s manual for the 13 database interface is provided (Appendix B), as well as a data dictionary (Appendix C), and a relationship diagram (Appendix D). All information in the database describing the collection and processing of cores was contributed by ISWS staff. The database contains analytical and descriptive results from the following six laboratories: Activation Laboratories of Ontario, Canada; Brookside Laboratories; ISGS Geochemistry Section; ISWS Sediment Lab, Peoria; TestAmerica Laboratories, Inc.; and UIUC Pedological Lab. Participating laboratories provided results as well as information describing the analytical methods used. Database Design The relational database structure consists of five tables that fully describe the sediment cores. The database uses additional tables to generate reports and present more information in the customized interface. A detailed explanation of each field in these tables is provided in Appendix C. The following paragraphs describe the general purpose of the five main tables. Projects. The projects table is used to store basic information regarding each data collection effort. Information stored includes the name assigned to the project by the ISWS principal investigator and dates of data collection. Cores. The cores table stores information describing the time, location, and physical conditions of each sediment core collected. Each core is a unique record in this table. Samples. This table contains information on how a sediment core was subsampled or composited and delivered to the various laboratories. Samples and/or subsamples extracted from a core are described by the depth, in centimeters, that defines the upper and lower boundaries of the segment submitted for analysis, as measured from the sediment surface (in situ watersediment interface). Most samples are taken using the material from one-half or “side” of a sediment core. An important exception is samples for unit weight/percent moisture analysis. Samples taken for these analyses use the material from both sides of a split core so that total volume of the sample is defined. Each sample in the samples table was categorized as either discrete, whole core composite, or segment composite. A discrete sample is one in which all material for a given interval (generally 2 cm) is used in actual testing. A whole core composite is a sample that is developed by thoroughly mixing material from evenly spaced intervals for the entire length of the core. Composites generally were developed using 2 cm of material taken every 20 cm. A segment composite is a sample developed using the same compositing strategy, 2 cm of material every 20 cm, but only from some defined segment of the sediment core. Segment composites generally are used for one of two reasons. The first is a quality assurance procedure in which the core may be divided arbitrarily into some fraction of the total core length, and composites are developed for each fraction or segment. At the same time, a whole core composite is developed using material from the other side of the core. Results then can be compared among segments and against the whole core composite. The second scenario where segment composites are used 14 are those situations in which there is a well-defined contact face and sediment characteristics are visibly different in different segments of the core. Regardless of how the samples were developed, every sample delivered to a laboratory for analyses is a unique record in this table. Results. Results contained in this database have been classified as either numeric or nonnumeric. The results table contains this information as well as reporting units, detection limits when applicable, and the name of the lab providing results, along with any qualifiers or flags that should be noted by the user. Analyses. The analyses table describes the analyses to which the sample was subjected, as well as the name of the laboratory or agency performing the analysis and the methods followed. Additionally, all analyses are divided into one of three categories (inorganic, organic, and physical) to allow for easier searching of the results. The analyses are further broken down into one of 16 subcategories to allow users to further refine their search. Database Navigation The ISWS Sediment Core Database is a Microsoft Access® product. It consists of customized forms that allow the user to search and retrieve results in three different ways, browse maps of the core locations, and view photos of the split cores. The database was developed so that a user does not need a working knowledge of Access®. The interface allows users to retrieve results without having to write their own queries. A detailed user’s manual is provided in Appendix B. Summary This project allowed for the collection and analysis of samples taken from 42 sediment cores, as well as the compilation of results for another 61 sediment cores collected previously. These cores were collected over a relatively large reach of the Illinois River extending from the Beardstown area in the south to Senachwine Lake below Hennepin, IL. All cores were analyzed for a broad range of chemical, physical, and agronomic properties. The second deliverable associated with this project was the development of an Access® database containing data for 103 deep sediment cores collected for 11 data collection efforts. The ISWS Sediment Core Database contains information describing these cores, including nearly 700 photos of split cores. One-hundred and two sediment cores were subsampled or composited into a total of 2,950 samples. These samples were analyzed and generated more than 37,000 individual results, with a total of more than 30,000 numeric values and nearly 7,000 descriptive results. The categories and subcategories of these results are presented in Tables 2 and 3, respectively. 15 Table 2. Total Number of Results by Category Number of results 13,421 10,295 13,679 37,395 Category Inorganic Organic Physical Table 3. Total Number of Results by Subcategory Subcategory Agronomic Descriptive Engineering Extractable Metal General Inorganic Grain Size Oxygen Demand PAHs PCB Pesticides Phenol Semivolatile Organic Total Metal Total Nutrient-Inorganic Total Nutrient-Organic Total Radionuclide Number of results 2,418 6,368 3,388 4,359 101 3,907 16 1,824 707 2,206 1,386 4,113 6,329 114 59 100 37,395 In addition to results, the database provides support documentation, including location maps and methods information for all cores. All information contained in the database is readily accessible through a custom-designed user interface that provides a menu-driven alternative to the user developing specific queries. References Demissie, M., and N. G. Bhowmik. 1986. Peoria Lake Sediment Investigation. Illinois State Water Survey Contract Report 371, Champaign, IL. Illinois State Water Plan Task Force. 1987. Illinois River Basin Action Plan. Special Report No. 11, Illinois Division of Water Resources, Illinois Department of Transportation, Springfield, IL. State of Illinois. 1997. Integrated Management Plan for the Illinois River Watershed. Technical Report of the Illinois River Strategy Team, Lt. Governor Bob Kustra, Chairman, Springfield, IL. 16 Appendix A - Standard Operating Procedures for the Collection of Sediment Cores Using the Rossfelder P-3c Vibrocore 17 Illinois State Water Survey – Center for Watershed Science VC SOP No. 1 Origination Date: 2/02 Version: 1.4, 9/1/2008, Page 1 of 6 STANDARD OPERATING PROCEDURE FOR THE COLLECTION OF SEDIMENT CORES USING THE ROSSFELDER P-3C VIBROCORE 1.0 Scope and Application 1.1 These procedures are used in the collection of sediment cores to ensure that all samples are representative of in-situ conditions for that location and to maintain the stratigraphic integrity of collected samples. 2.0 Method Summary 2.1 The vibrocoring system employed by the Illinois State Water Survey (ISWS) is a model P-3c manufactured by Rossfelder Corporation of Poway, California. The vibrocoring unit is submersible, weighs approximately 150 pounds, and is powered by a three-phase, 240-volt 60-Hz generator. The P-3c has a working depth of 4000 feet. Sediment penetration is achieved through a method known as vibro-percussive, in which the unit delivers 16-24 Kilonewtons (kN) (1 kN = 225 lbs.) of force and a vibration frequency of 3450 vibrations per minute to the core tube. Coring is made possible by both the percussive force of the corer as well as the fact that the sediment particles surrounding the drive tube are “liquefied” by the vibrational forces along the tube. The corer is lowered into the sediment until the point of refusal. The unit is then engaged and coring proceeds until penetration ceases or the entire length of the drive tube is reached. Penetration depths and recovery rates depend on many factors such as water content of the sediment, particle size and shape, compaction/density, and calcification. Therefore, the best results will always be obtained in unconsolidated, water-saturated, heterogeneous sediments. There are no core sites that are exactly the same, thus predicting correct penetration depths cannot be done. Typical lake sediments, loams, or sand and gravel generally allow for complete penetration. Deposits of large cobble, non-hydrated clay lenses greater than 1 foot in thickness, or the occurrence of large woody debris may inhibit coring. Currently, the ISWS vibrocore is configured so that cores are approximately nine feet long when recovery is 100 percent. 3.0 Equipment 3.1 Pontoon Boat 3.2 Rossfelder P-3c Vibrocore 3.3 Drive Tube Assembly 18 Illinois State Water Survey – Center for Watershed Science VC SOP No. 1 Origination Date: 2/02 Version: 1.4, 9/1/2008, Page 2 of 6 STANDARD OPERATING PROCEDURE FOR THE COLLECTION OF SEDIMENT CORES USING THE ROSSFELDER P-3C VIBROCORE 4.0 Preparation of Sampling Equipment 4.1 Vibrocore The vibrocore is a self-contained watertight unit that requires very little preparation before sampling. All electrical wires and connections should be checked for wear or damage. Hardware used in the rigging and clamps should also be inspected. During the first coring operation, and then periodically throughout the day, each leg of the three-phase power supply should be checked to ensure equal voltage and amperage draw across all three legs to ensure that the vibrocore is operating properly. 4.2 Drive Tube Assembly The drive tube assembly consists of three parts: the drive or core tube, the core tube liner, which is extruded High Density Polyethylene (HDPE), and the core or cutter nose. Integral to the core nose is a “core catcher” made from 0.010 foot stainless steel. This piece extends into the core tube and is cut into a series of radial biased fins. If the collected sediment core is drawn out of the core tube during extraction, these fingers will fold inward and inhibit loss of sample material. Preparation for the drive tube assembly varies according to whether the intended use of the collected sediment core is to supply subsamples for geotechnical information or for chemical analysis. 4.2.1 Core Tube The core tube or drive tube requires little or no preparation before sampling since it never contacts the sample. The core tube only supplies the structural integrity necessary for coring operations. The pre-drilled holes for attaching the core nose should be periodically inspected for wear or damage to ensure a proper fit with little or no play to avoid the rivets being cut by the core tube during operation. 4.2.2 HDPE Liner 4.2.2.1 Subsampling for Geotechnical Data When sampling is being conducted for geotechnical samples, the only preparation for the liner is to check its overall dimension to ensure a proper fit in the core tube. If any fugitive tube materials are observed where the tube was cut during production, these can be removed easily with a pocketknife or razor knife. 4.2.2.2 Subsampling for Chemical Analysis When a sample is to be collected for chemical analysis, a more thorough preparation of the liner is required. The liner should be checked to be sure that the length allows for proper assembly of the core tube to the 19 Illinois State Water Survey – Center for Watershed Science VC SOP No. 1 Origination Date: 2/02 Version: 1.4, 9/1/2008, Page 3 of 6 STANDARD OPERATING PROCEDURE FOR THE COLLECTION OF SEDIMENT CORES USING THE ROSSFELDER P-3C VIBROCORE vibrocore head. Any frayed liner material left from the factory cut should be removed. The liner is then washed with Ecolab Microtox or an equivalent, and then rinsed with deionized water. Next, the tube is rinsed with a 10 percent solution of nitric acid and then thoroughly rinsed once again with deionized water. After drying, the tube is capped at both ends and the caps are taped in place. Tubes will remain capped throughout transportation and shall be uncapped only prior to being loaded into the core tube for coring operations. 4.2.3 Core Nose 4.2.3.1 Subsampling for Geotechnical Data The core nose is machined from a solid piece of 303-grade stainless steel. There is very little preparation required for the core nose when sampling for geotechnical purposes. The core nose should be inspected for wear or damage, especially to the cutting edge. Any dirt or sediments left on the core nose from previous sampling should be removed using a stiff brush with nylon or other inert material bristles. The core catcher should also be inspected, and any residue remaining from previous sampling should be removed with a stiff brush and the core catcher rinsed in native water. 4.2.3.2 Subsampling for Chemical Analysis When samples are being collected for chemical analysis, the preparation of the core nose requires additional cleaning beyond what is necessary when sampling for geotechnical analysis. The core nose should be inspected for wear or damage, especially to the cutting edge. Any dirt or sediments left on the core nose from previous sampling should be removed using a stiff brush manufactured with inert materials. The core catcher should also be inspected and any residue remaining from previous sampling should be removed with a stiff brush and the catcher rinsed in native water. The core nose should then be washed in a similar manner as previously described for the liners. The core nose and catcher are first washed with Ecolab Microtox laboratory soap and subsequently rinsed with native water. The cutter nose and core catcher should then be rinsed with 10 percent nitric acid and then thoroughly rinsed with native water. 5.0 Deployment 5.1 Pontoon Boat Vibrocoring operations are conducted from an 18 foot, 6 inch pontoon boat. Coring operations occur through an opening in the deck or “moon pool” located approximately midship. To facilitate the deployment of the vibrocore, an electric 20 Illinois State Water Survey – Center for Watershed Science VC SOP No. 1 Origination Date: 2/02 Version: 1.4, 9/1/2008, Page 4 of 6 STANDARD OPERATING PROCEDURE FOR THE COLLECTION OF SEDIMENT CORES USING THE ROSSFELDER P-3C VIBROCORE winch and 16-foot deck-mounted tetrapod (tower) are used. The tetrapod, as well as all cabling and electrical hookups, is assembled prior to launching. Generally, sampling occurs at predetermined locations. Station is maintained through the use of a three-point anchoring system. Position is determined using a Differentially Corrected Global Positioning System (DGPS). 6.0 5.2 Rossfelder P-3c Vibrocore The vibrocore is powered by a three-phase, 240-volt 60-Hz generator located on deck. All connections between the generator and the vibrocore are screw-type Impulse watertight connectors. Deployment of the corer uses an electric hoist set-up with a double line, rated for a maximum hoist of 6000 pounds. All shackles, pulleys, or other points of attachment are secured with clevis pins or seizing wire. 5.3 Drive Tube Assembly The core tube is a 10-foot section of 3.5-inch industrial pipe size (IPS) schedule 5 black iron pipe, having an outside diameter of 4.0 inches, a wall thickness of 0.083 inches, and an inside diameter of 3.834 inches. The core tube is equipped with a cutter nose fabricated from 303-stainless steel and includes a 303stainless steel core catcher to help ensure retention of the sample. The core tube and core nose incorporate a custom extruded HDPE liner with a wall thickness of 0.07 inches. This facilitates the removal and transportation of collected cores and allows collected cores to be used for chemical analysis. The core tube is attached to the vibrocore head using an offset block clamp incorporated into the vibrocore head. The core nose is fixed to the drive tube using four rivets located at the quarter points of the drive tube. Sampling 6.1 Vibrocoring 6.1.1 Coring Cores should be collected with a vibrocore using the following procedures to attain maximum percent recovery and maintain stratigraphic integrity of the sample. Once the boat has been successfully anchored with the proper scope to all anchors, the DGPS should be initialized. The sampler is then hoisted and all shackles and cabling should be visually checked to ensure the proper attitude of the sample. Water depth is then determined using a graduated range pole equipped with a 6-inch foot to help define the water sediment interface. If water depths are too great to use a range pole, a calibrated sounding line or fathometer is used depending on water depth and velocities. Water depth is then entered onto the coring log sheet. The vibrocore is then lowered using the hoist and is allowed to penetrate the sediment under its own weight until the drive tube has sufficiently penetrated the sediments to minimize disturbance to 21 Illinois State Water Survey – Center for Watershed Science VC SOP No. 1 Origination Date: 2/02 Version: 1.4, 9/1/2008, Page 5 of 6 STANDARD OPERATING PROCEDURE FOR THE COLLECTION OF SEDIMENT CORES USING THE ROSSFELDER P-3C VIBROCORE the surficial sediments during start-up or the point of refusal is reached. If the water is sufficiently shallow, the deck crew can manually orient the vibrocore to ensure the correct vertical orientation. The corer is then switched on and is allowed to penetrate the sediments until it becomes apparent that penetration has ceased or the corer has penetrated the length of the drive tube. If the vibrocore has not penetrated the entire length of the drive tube when progress ceases, the cored depth is determined by sounding the top of the vibrohead, adding 1.2 feet to the sounded depth to allow for the vibrocore itself, and subtracting this value from the water depth. The resultant cored depth is then entered onto the coring log sheet. 6.1.2 Core Retrieval When retrieving the core, the hoist is re-engaged and the core is hoisted to the deck. The core should be hoisted high enough to allow the moonpool to be covered, and the core tube is then lowered nose down onto the deck. The core tube is then removed from the clamp on the vibrocore head and the head is lowered to the deck. The four rivets that fasten the core nose to the core tube are removed with the core remaining upright. The core tube is then hoisted off the liner, again with the core remaining upright, and the drive tube is lowered to the deck. Any supernatant water remaining in the core tube is then siphoned off, and the liner is removed at the top of the sediment and capped. A sample identification number, date, orientation (top), and sampling time are written on the cap. The core can now be laid down on the deck, the core nose removed, and the bottom end capped. The position of the core can now be taken from the DGPS unit and entered onto the core log sheet. 6.1.3 Core Transport and Storage Requirements for transportation and storage of collected cores will vary, depending on the intended uses or analyses. The cores as collected are capped, labeled, and sealed. There is limited chance to reorder the core stratigraphy when the core tube has been properly cut and capped, so there is no requirement that the core remain upright. In addition, while being transported on the boat, the core tubes are placed within storage tubes constructed of schedule 40 PVC equipped with end caps. Since the tubes are completely enclosed, there is no chance for distortion of the core due to flexing of the sample. When core retrieval is at or near 100 percent, core sample weights can approach 100 pounds. Care should be taken when handling samples to avoid injury and to avoid flexing of the core sample to minimize any disturbance to the sample. Since cores commonly approach 10 feet in length, a vehicle capable of transporting this size material must be available. 22 Illinois State Water Survey – Center for Watershed Science VC SOP No. 1 Origination Date: 2/02 Version: 1.4, 9/1/2008, Page 6 of 6 STANDARD OPERATING PROCEDURE FOR THE COLLECTION OF SEDIMENT CORES USING THE ROSSFELDER P-3C VIBROCORE Core samples, by the nature of the collection technique, have limited exposure to atmospheric oxygen and possible oxidation of selected chemical constituents. If temperature is an important consideration, it may become necessary for samples to be immediately transported to a cold storage facility or subsampling may be required on site with appropriate storage of subsamples. It is important that the plan of study for chemical analysis be clearly defined as constituents have specific requirements for holding times, temperature, and material in which the sample is stored. Requirements for the storage and manipulation of sediment samples can be found in such reference materials as United States Environmental Protection Agency document EPA823-B-01-002 and the 2000 ASTM Standards on Environmental Sampling, Vol. 11.05. 23 Appendix B – ISWS Sediment Core Database User’s Manual 25 ISWS Sediment Core Database User’s Manual September 1, 2008 26 Installation To install the database, simply copy the installation folder containing all of the database components from the source DVD to the user’s hard drive. The installation folder should contain the following files: These files must remain in the same folder for the database to function properly. After copying the installation folder to a local hard drive, the user must refer to the file named ‘readme.doc’ for detailed instructions on properly configuring the security settings of the database. This file also addresses some common problems encountered during installation and describes the software required to operate the database. To ensure full functionality, the user must have Microsoft Access 2002, 2003, or 2007. To open the database, double-click on the vibracore.mdb file. Navigation Upon opening the database, the user will be presented with four menu options. The first three options lead to other menus, and the last option (Exit Database) will simply close the entire database. The screen presented below is what the user will see upon opening the database (examples in this document all use Access 2007). 27 Results Menu The Results Menu offers access to three different forms. Each form allows the user to query the data and retrieve results in a different way. Results - By Location and/or Analyte This first option allows the user to interactively filter the results via a combination of location and analyte choices. 28 Results in the database are either numeric or nonnumeric and are listed somewhat differently. One of the Numeric/Nonnumeric radio buttons on the form will always be selected. Toggling back and forth between the two alters the ‘Categories’, ‘Sub-Categories’, and ‘Analytes’ options available, as well as the actual results. The ‘Location’ list box is not affected by the Numeric/Nonnumeric selection. Not selecting an option in any of the list boxes means that no filter of that type is applied, and by default, all of the numeric results in the database are listed at the bottom of the screen. Selecting any combination of the four list boxes (‘Location’, ‘Categories’, ‘Sub-Categories’, and ‘Analytes’) will filter the results accordingly. Numeric results also can be filtered by the use of the ‘>=’ and ‘<=’ boxes. Either one or both of the boxes can be filled in to filter the results. A subset of available fields is displayed in the results list on the screen. To view all fields, the data will need to be exported (most likely to Excel) using the ‘Export’ button (see the section titled, “Exporting Data” for more information). Geographic location can be filtered by selecting one of the predefined locations listed on the form. Each core in the database has been assigned a location value. Where a core was collected can be viewed on a map by clicking the ‘Core ID’ hyperlink from the listing at the bottom of the screen. Alternatively, the section of this User’s Manual titled “GIS Integration” describes in detail how to view the core locations using GIS software. Selecting a specific analyte (with numeric result values) will cause the results to be graphed as well. It should be noted that results for a single analyte may be composed of values that have been recorded in more than one unit of measure. All result values stored in this database have been stored exactly as they were received from the testing laboratory. As such, the user must exercise caution when interpreting the values displayed on any graph generated by the database. A detailed listing of all of the units used in a particular graph can be determined by examining the data listing near the bottom of the screen. Also, some analytes use abbreviations to describe the results. The ‘Abbreviations’ button located immediately under the graph on the right-hand side of the screen explains these abbreviations. There is also a report available at ‘Documents – Abbreviations’ that lists all of the abbreviations used in the database. Results - By Core Number This second option on the Results Menu allows the user to select one or more cores from a list and view all of the corresponding results. Results are either numeric or nonnumeric, and they are listed separately. One of the Numeric/Nonnumeric radio button options will always be selected. Once specific cores have been selected (a single core, multiple cores using the ‘Ctrl’ key, or a range of cores using the ‘Shift’ key), the ‘Submit’ button must then be clicked to retrieve the results. A subset of 29 available fields is displayed in the results list on the screen. To view all fields, the data will need to be exported (most likely to Excel) using the ‘Export’ button (see the section titled “Exporting Data” for more information). Results - By Core Number Results - Export in Crosstab Format The third option for retrieving results is the Crosstab Export. This form allows results to be exported in a matrix format with samples in rows and analytes (along with a few other resultsspecific fields) in columns. Microsoft Access cannot generate a dataset that contains more than 255 columns. As such, the user must select a combination of query parameters (Cores, Labs, Analytes, and Data Type) that will generate a dataset with less than 255 columns. The number of columns for any given combination of query parameters is displayed for the user and updated with every change in selection. Once an acceptable combination of query parameters has been selected, the user can then click the ‘Export’ button (see the section titled “Exporting Data” for more information). 30 The actual results can be viewed only after they have been exported (the formats available for export can vary depending on the software present on the user’s computer). Images Menu This menu allows access to the two types of images associated with the database: core photos and location maps. 31 Images - Core Photos The Core Photos option allows the user to access individual photos taken of core segments. Photo images are contained in a folder that was copied when the database was initially installed. Simply selecting a core will display all of the relevant photos for that core on the screen. Either clicking on the individual photo or selecting a photo from the list box will trigger a larger version of that photo to be displayed. Images - Location Maps The Core Location Maps option allows users to view detailed maps that display the location of each core. Simply selecting a core will display the relevant map on the screen, with the selected core highlighted in the center of the map. 32 Although the maps should give the user a basic understanding of where a given core was obtained, instructions for more in-depth GIS interaction are provided later in this document in the “GIS Integration” section. Documents Menu The documents menu gives access to a selection of documentation items. 33 Documents - Abbreviations This database-generated report lists all of the abbreviations used in the database results. The abbreviations are summarized by testing lab, the field in the results table containing the abbreviation, and the specific analyte being described (if applicable). For users interested in those analytes with descriptive results, it may be useful to first print out this report for use as a reference. Documents - Analytes This database-generated report lists all of the analytes in the database grouped by category and subcategory, allowing a user to quickly locate the analytical results available for categories or subcategories of interest. The testing lab is noted in parentheses. Also, each analyte is identified as being either numeric or descriptive (nonnumeric). Documents - Data Dictionary This option opens a copy of the Data Dictionary, which is stored as an internal database report. This technical document lists all of the fields in the database and describes the type of information stored in each field. This information would be particularly useful when reviewing data exported from the database, as every data field is included in many of the export functions. Documents - Table Relationships This option opens a copy of the Table Relationships diagram, which is stored as an internal database report. This technical document diagrams what tables make up the database and how they are related to each other. This information is provided as background information and is generally not required to utilize the database. 34 Documents - User’s Manual This option opens a copy of the User’s Manual (this document), which is stored as a pdf file in the same directory as the vibracore.mdb file. Searching for Data Keep in mind when searching for results that there are two types of results: numeric and nonnumeric (or descriptive). Since the two types of results are displayed somewhat differently, only one type is displayed at a time. The ‘Numeric’ data type is usually selected by default, as the majority of results are numeric. If a specific analyte is being sought and the user is uncertain whether the results will be numeric or nonnumeric, click on the ‘Documents – Analytes’ menu option to view a report that lists all of the analytes in the database, grouped by category and subcategory, and identifies whether results for a given analyte are numeric or descriptive (nonnumeric). If no specific analyte is being sought, the user must toggle back and forth between the ‘Numeric/Nonnumeric’ options to view and export all possible results. Searches for data will typically be driven by either the desire for data from a specific location or data concerning a specific analyte (or category of analytes). Guidance on effectively locating data using either strategy is provided in the following two sections. Search by Location This database offers a couple of options to help find results from specific locations. One way to find core data for a specific location would be to select the Results option from the main menu, then select ‘Results – By Location and/or Analyte’ and filter the results using the ‘Location’ list box (shown below). Every core in the database is assigned a location value. A list of all of these locations is displayed on the ‘Results – By Location and/or Analyte’ screen. Selecting one of the location values on this screen limits the results displayed to only those cores from that area. 35 Another option to find core data by location would be to use the ‘Images – Core Location Maps’ option. The screen displayed when using this option allows the user to select a core from a list. In this list, an assigned ‘location’, based on common map features, is provided, as well as a ‘reach’ value. The ‘reach’ values are an approximate river mile grouping for those cores obtained along the Illinois River. Once a core is selected from the list, a map image will appear on the screen. This map image displays the selected core in the center of the image as a red star. Any other cores in the vicinity are displayed as smaller, black stars. Once a Core ID or group of Core ID’s has been identified as being from an area of interest, the ‘Results – By Core Number’ option can be used to find all of the results for the specific core(s) in question. Also, the ‘Results – Export in Crosstab Format’ option can be used to extract results based on core numbers (see the section titled “Exporting Data”). Search by Analyte When searching for results of a certain analyte type (or category), check the ‘Documents – Analytes’ menu option (see the section in this manual titled “Documents – Analytes” for additional information). This report lists every analyte found in the database, broken down by category and subcategory (with the testing lab noted in parentheses). It also denotes whether the analyte yields a numeric result or a descriptive (nonnumeric) result. Users can 36 also determine if they need to search using a category/subcategory value or if they need to search using individual analytes. Either way, the ‘Results – By Location and/or Analyte’ option can be used to obtain actual results. This screen allows a user to limit the results to category/subcategory values or to a single analyte. Additionally, the ‘Results – Export in Crosstab Format’ option can be used to extract results based on multiple-analyte combinations (see the section titled “Exporting Data”). Exporting Data Only a limited subset of the results is actually displayed on any given ‘Results’ screen. For access to the complete set of data fields, the results must be exported from the database into some other file format (typically a format compatible with Excel or some other spreadsheet program). Whenever an ‘Export’ button is clicked, the full version of records currently displayed on the screen will be exported to a format selected by the user. The formats available for export can vary, depending on the software loaded on the user’s computer. Exporting Data - Full Listing This option is found on both the ‘Results – By Analyte and/or Location’ screen and the ‘Results – By Core Number’ screen. The fields, 57 in total from five database tables, will form the column headings of the exported dataset (see ‘Documents - Table Relationships’ and ‘Documents - Data Dictionary’ for more information on the fields). There will be a distinct row in the exported dataset for each result value that is exported. 37 In cases where all of the exported columns are not required, the Data Dictionary (Documents – Data Dictionary) should be consulted to determine which fields might appropriately be deleted from the exported dataset. The exported dataset’s rows are ordered by core ID and sample ID. Exporting Data - Crosstab This option formats the results into a matrix of samples and analyte results, and can be found on the ‘Results – Export in Crosstab Format’ screen. There is a row in the exported dataset for each sample, and the columns of the exported dataset consist of six sample-specific fields and five fields for each analyte included. The six sample-specific fields are as follows: • • • • • • Core_ID Date Location Upper Lower Sample_type The following five fields are included for every analyte: • • • • • Flag Lab Qualifier Result_value (or Result_nonnumeric for descriptive results) Units For example, a user may make the following selections on the ‘Results – Export in Crosstab Format’ screen: Cores: Labs: Analytes: Data Type: 185 ISWS-Peoria (none selected) Numeric 38 In this case, the database will report that the exported file contains 26 columns. Those 26 columns would include: • • • • • • • • • • • • • • • • • • • • • • • • • • core_ID date location upper lower sample_type Percent Moisture, dry basis - flag Percent Moisture, dry basis - lab Percent Moisture, dry basis - qualifier Percent Moisture, dry basis - result_value Percent Moisture, dry basis - units Percent Moisture, wet basis - flag Percent Moisture, wet basis - lab Percent Moisture, wet basis - qualifier Percent Moisture, wet basis - result_value Percent Moisture, wet basis - units Unit Weight, Dry - flag Unit Weight, Dry - lab Unit Weight, Dry - qualifier Unit Weight, Dry - result_value Unit Weight, Dry - units Unit Weight, Total - flag Unit Weight, Total - lab Unit Weight, Total - qualifier Unit Weight, Total - result_value Unit Weight, Total - units The number of rows in the exported file will depend on how many subsamples of Core 185 were analyzed at the ISWS-Peoria laboratory. The database is limited to the export of 255 columns of data at a time. The form requires a user to specify some combination of cores, labs, and analytes that result in an export file with 255 columns or less. Multiple exports may be required to retrieve all of the data desired. The exported dataset rows are ordered by core ID and sample ID. 39 GIS Integration The latitude and longitude coordinates for each core are stored in the ‘Cores’ table. This data can be loaded into Geographic Information Systems (GIS) software to plot the core locations. The instructions that follow use ArcMap 9.2 to demonstrate this process. After starting ArcMap and opening a new map document, add data by selecting the menu option of ‘File’ and then ‘Add Data…’. In the dialog box that appears, navigate to the location of the vibracore.mdb file and double click the filename to show the contents. Select ‘cores’ from the tables listed, as shown below, and click ‘Add’. Once the ‘cores’ table has loaded into ArcMap, right-click on it and select ‘Display XY Data…’. 40 In the dialog box that appears, identify which fields in the database represent X and Y values. For the cores table, the ‘wdecdegree’ field contains longitude (X) data; the ‘ndecdegree’ field contains latitude (Y) data. These latitude and longitude values are in the North America Datum 1983 (NAD83). This should allow the coordinates to be plotted on the screen as an events layer. This dynamic display of XY data (saved only in the ArcMap document itself) can be permanently saved as a shapefile (a common GIS data format) by right-clicking the ‘cores Events’ layer and selecting ‘Data’ then ‘Export Data…’. 41 With either format (events layer or shapefile), core locations can be identified, labeled, or combined with additional GIS data layers (e.g., rivers, counties, roads) that have been obtained elsewhere. Contact Information For questions regarding the collection of sediment cores or the data contained in this database, please contact: Jim Slowikowski (217) 244-3820 [email protected] For questions regarding the operation of the database, please contact: Brad Larson (217) 333-0785 [email protected] or Amy Russell (217) 333-3889 [email protected] 42 Appendix C – ISWS Sediment Core Database Data Dictionary 43 The following relational database tables contain data and information describing the sediment cores. • Projects Table • Cores Table • Samples Table • Results Table • Analyses Table The remaining tables contain information used to generate reports or present additional information in the database interface. • Abbreviations Table • Photos Table • Version_tracking Table • Crosstab_columns_nonnumeric Table • Crosstab_columns_numeric Table The data dictionary documents all of the fields found in the database tables. The data dictionary itself contains four columns: field name, type, size, and description. The ‘field name’ is the actual name of the field as it is found in the database table. ‘Type’ defines what type of data can be stored in the field. The meaning of the value found in the ‘size’ column depends on the type of data stored in that field. For text fields, ‘size’ indicates the maximum number of characters that the field can hold, and for numeric and date fields, ‘size’ indicates how many bytes of storage are used. The ‘description’ column provides a brief overview of the information stored in the field. Projects Table Field name project_ID projectname client Type AutoNumber Text Text Size 4 100 100 Description Primary key - Automatically generated number. Name of the project under which cores were collected. Agency funding the project for which sediment cores were collected. start end Date/Time Date/Time 8 8 The date that collection of sediment cores began. The date that collection of sediment cores ended. 44 Cores Table Field name core_ID ndecdegree wdecdegree Type Integer Double Double Size 2 8 8 Description Primary key - Unique ID number generated by ISWS. Latitude of the core location in decimal degrees. (NAD83) Longitude of the core location in decimal degrees. (NAD83) Coordinate system originally used at the time of the sediment core collection. coordinate_sys Text 50 depthwater depthcored Double Double 8 8 corecapped time clientsnum log_comments Double Date/Time Text Text 8 8 20 254 date crew Date/Time Text 8 20 analysis Text 10 project_ID Long Integer 4 water_body Text 100 original_N Text 50 For coordinate systems other than decimal degrees, the ycoordinate of the core location as recorded in the field. original_W Text 50 For coordinate systems other than decimal degrees, the xcoordinate of the core location as recorded in the field. nearest_gage Text 25 The gage closest to the location of core collection; the gages used most often are operated by the USGS or the USACOE. gage_value Text 10 notes Text 50 The water surface elevation as reported by the nearest gage. Any piece of significant information concerning the core added in the office during data entry. location Text 255 Specific name of body of water where each core was collected, according to USGS 7.5 min quadrangles. reach Text 255 A river name and an approximate river mile grouping (5mile intervals) for those cores collected in main channels. Depth of the water at the sampling location. (ft) Depth to which the core tube penetrated the sediment. (ft) Length of the core. (ft) Time of the sediment core collection. Core ID number used by the funding agency. Comments noted in the field during sediment core collection. Date of the sediment core collection. Initials of the individuals involved in the collection of cores. Indicates whether core is planned to be sampled for chemical or geotechnical analyses. There are different preparation procedures for the core tube liner depending on the type of analyses planned. Foreign key (linking to the Projects Table) - Project ID number. General name of body of water where all cores that day were collected. 45 Samples Table Field name sample_ID Type Text Size 15 Description Primary key - Unique sample ID constructed from concatenating core_ID, upper, lower, & sample_type. core_ID sample_type Integer Text 2 25 Foreign key (linking to the Cores Table) - Core ID number. Classification of the sample type (discrete, segment composite, or whole core composite). upper Single 4 lower Single 4 sample_comments Text 255 alt_sample_ID Text 50 Upper boundary of sample position in sediment core, as measured below sediment surface. (cm) Lower boundary of sample position in sediment core, as measured below sediment surface. (cm) Comments about how the core was subsampled or composited. ISWS assigned ID number used when subsampling or compositing the core. lab_sample_ID Text 255 Lab-supplied ID number used when analyzing the sample. Field name sample_ID Type Text Size 15 Description Primary key component & Foreign key (linking to the Samples Table) - The ID number of the sample being tested. analysis_name Text 255 Primary key component & Foreign key component (linking to the Analyses Table) - The name of the analyte being tested. lab Text 255 Primary key component & Foreign key component (linking to the Analyses Table) - The name of the lab that conducted the test. result_value units qualifier Double Text Text 8 25 10 Numerical test result. The units of the given test result. Any lab-supplied qualifying notes (see abbreviations table for explanation). flag Text 10 Any lab-supplied warning flags (see abbreviations table for explanation). reporting_limit analysis_date result_nonnumeric method_detection_limit Double Date/Time Text Single 8 8 255 4 The level at which an analyte can be definitively detected. The date the analysis was completed. Nonnumerical test result. The level at which there is 99% confidence that a given analyte is present; sometimes the analyte can be detected but at an estimated value. result_comments Text 255 result_type Text 10 Any lab-supplied notes regarding the processing of the result. Specifies whether the record contains a numeric or nonnumeric result. Results Table 46 Analyses Table Field name analysis_name Type Text Size 255 Description Primary key component - Name of the chemical or property being analyzed. analyte_abbreviation lab Text Text 50 50 Analyte abbreviation used by the testing laboratory. Primary key component - The laboratory where the analysis was conducted. method_code category generic description reference CAS_number Text Text Text Text Text Text 50 50 50 255 255 50 Laboratory supplied code for the testing method used. A broad category classification for the given analyte. A subcategory classification for the given analyte. Explanation or brief description of the testing method. Source of procedural guidelines used in the analysis. Chemical Abstracts Service number, if available. Field name abbreviation description lab field Type Text Text Text Text Size 255 255 50 255 analyte Text 255 Description Abbreviation used in the results table. Full text or explanation of the abbreviation. The lab which generated the abbreviation. Name of field in the results table where the abbreviation is used. When applicable, the specific analyte utilizing the abbreviation. Type Text Integer Size 255 2 Description Primary key - The name of the image. Foreign key (linking to the Cores Table) - The ID number of the core. Type Text Text Size 50 255 Description Date used to identify the version of the database. Change made to content or structure of the database. Size 255 Description Fields used to construct a nonnumeric crosstab query. Size 255 Description Fields used to construct a numeric crosstab query. Abbreviations Table Photos Table Field name filename core_ID Version_tracking Table Field name Version Change Crosstab_columns_nonnumeric Table Field name FldName Type Text Crosstab_columns_numeric Table Field name FldName Type Text 47 Appendix D – ISWS Sediment Core Database Relationship Diagram 49 50 50