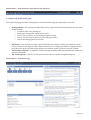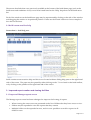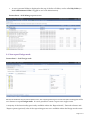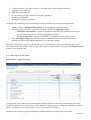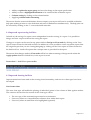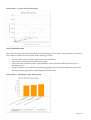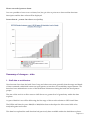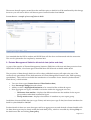
1
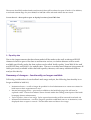
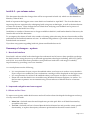
heidi 4.0 – pre release notes
This document describes the changes that will be incorporated in heidi 4.0, which is to be released on
Monday 7 March 2011.
heidi 4.0 represents the biggest review since heidi was launched in April 2007. The focus has been on
improving the user experience by redesigning heidi using new technologies, as well as the introduction
of some new features. These changes have resulted from analysing user feedback and a process of
prioritisation by the heidi User Group.
In addition, a number of features are no longer available in heidi 4.0, and further details of these may be
found at the end of this document.
To accompany the release of heidi 4.0 a number of training videos showing the new functionality will be
published on the heidi information web site. In addition full guidance is provided within on-screen help
and the heidi user manual.
If you have any queries regarding heidi 4.0, please email [email protected].
Summary of changes – system
1. New look interface
Since heidi’s release in 2007 web technologies have advanced and it has now been possible to redesign
the heidi interface using the most up to date and appropriate technologies including ASP.NET, jQuery
and AJAX. As a result it has been possible to incorporate into heidi 4.0 a wide range of usability
improvements by providing a new user interface.
As a result please note the following;
•
•
•
It is a requirement for java script to be enabled within your browser in order to access heidi 4.0.
If java script is not enabled on your workstation a message will be displayed on the login screen.
It is a requirement for cookies to be enabled within your browser in order to access heidi 4.0.
Please also note that heidi is not accessible using Windows® Internet Explorer 6 or earlier. For
the best user experience we recommend using current releases of Mozilla Firefox or Internet
Explorer.
2. Improved navigation and user support
2.1 Menu and tool bars
To improve navigation within heidi a menu and tool bar have been developed which appear at the top
of every screen in heidi.
•
•
Menu bar - the heidi menu bar and dropdowns provide quick links to all heidi functionality
accessible to the user.
Tool bar - the heidi tool bar is located beneath the heidi menu bar and provides screen specific
functionality, to replace the majority of buttons positioned on the main screen in heidi 3.
Page 1 of 11
Screen shot 1 – heidi menu bar (top) and tool bar (bottom)
2.2 Improved heidi home page
The heidi home page has been redesigned to include the following key information for users;
•
Getting started – this section provides links to key system activities and assistance for new users,
which include;
o A virtual video tour of heidi 4.0.
o heidi quick start guide, aimed at new users.
o Link to View reports (via the Manage reports screen).
o Link to Create a report (now known as ‘Design mode’).
o Link to the change password screen.
•
heidi news – this section provides a list of all heidi news raised by HESA since heidi 4.0 went
live, in reverse chronological order. Please note that it is no longer possible for organisations to
post their own news on heidi as this feature was seldom used in previous versions of heidi
heidi release schedule – a calendar of data and system releases that are planned each month for
the next 12 months
My recent reports – a list of your 10 most recently viewed, created or updated reports.
•
•
Screen shot 2 – heidi home page
Page 2 of 11
Please note that links that were previously available at the bottom of the heidi home page (such as the
heidi terms and conditions of use) can now be found listed on the ‘Help’ dropdown on the heidi menu
bar.
Each of the windows on the heidi home page may be repositioned by clicking on the title of the window
and dragging the window to its preferred position. Please see the Virtual video tour for an example of
how this can be done.
2.3 heidi screen sensitive help
Screen shot 3 – heidi help pane
heidi contains screen sensitive help and this is now located within a sliding help pane on the right-hand
side of the screen. The pane may be opened by either clicking on the ‘?’ icon found on the heidi toolbar,
or by clicking on the paddle on the right-hand side of the screen.
3. Improved report creation and viewing facilities
3.1 Improved Manage reports screen
The Manage reports screen has been redesigned to improve the locating of reports:
•
•
•
When viewing the screen users are presented with a list of folders that they have access to view.
Folders may be expanded to view the reports that they contain.
Multiple folders can be expanded at once, and it is now possible to search for reports in all
folders at once.
Page 3 of 11
•
A user’s personal folder is displayed at the top of the list of folders, and is called My folder (or
local administrator folder if logged in as a local administrator).
Screen shot 4 – heidi Manage reports screen
3.2 New report Design mode
Screen shot 5 – heidi Design mode
Based on feedback received from heidi users, the create/update report screen has been redesigned and is
now known as report Design mode. It is now possible to create a report on a single screen.
A majority of the functionality previously available within the ‘Report details’, ‘Derived columns’ and
‘Report options (optional)’ tabs of the report designer are now available within the Design mode screen.
Page 4 of 11
•
•
•
•
•
•
Column selection – the data explorer is available and is unchanged from heidi 3.
Aggregate row selection.
Derived column creation.
Re-sequencing of report columns using drag and drop
Report group selection.
Hiding and un-hiding columns
In addition the following new functionality has been introduced to the report Design mode;
•
•
•
Ability to select a highlighted institution to be highlighted within the report.
New aggregate row types, available for selection within the Aggregate row box;
o Difference from median – displays the difference between the median for the report
group and the result for a selected highlighted institution.
o Group results count – displays the number of members in your report group.
New percentage change derived column type available within the derived columns tab –
displays the percentage difference between two selected columns
Please note that when a report is initially designed, a default report name is provided for the report.
This name can be overwritten when saving a new report or at any time by clicking on the Rename report
button on the heidi tool bar.
3.3 New report View mode
Screen shot 6 – heidi View mode
An improved view mode has been introduced in heidi 4.0 that has taken the functionality previously
available within the view report screen with additional enhancements to make the formatting of reports
easier. In addition it is now possible to view a report without saving it.
In addition the following new functionality has been introduced to the report View mode;
Page 5 of 11
•
•
•
•
Ability to update the report group and save the change to the report specification
Ability to select a highlighted institution to be viewed in blue within the report
Column sorting by clicking on the column header
Applying column header formatting
Please note that the notes and definitions that accompany your report will now be available within the
help pane making it easier to view both data and notes or definitions simultaneously. The help pane can
be accessed by clicking on the ‘?’ icon on the heidi menu bar.
3.4 Improved report saving facilities
In heidi 4.0, the saving of a report is now independent from the viewing of a report. It is possible to
design and view a report without first saving the report.
Changes to a report can be saved at any point whilst in Design or View mode by clicking on the ‘Save
report’ button located on the heidi tool bar. In addition it is now possible to create a separate report from
the original report that you are viewing/designing by clicking on the ‘Save report as’ button located on
the heidi tool bar. heidi will request that a unique name is provided for the report.
Please note that changes made in View mode will be lost when returning to Design mode unless the
Apply updates button is clicked first, or the report is saved.
Screen shot 7 – heidi View report toolbar
3.5 Improved charting facilities
Improvements have been made to the existing chart functionality, and two new chart types have been
developed.
New Scatter chart
This new chart type will enable the plotting of individual points of one column of data against another.
The criteria to be used for the creation of this chart type will be:
•
•
•
The row type of the associated report must be an institution.
Users may select two compatible data columns from within their report.
Users may select an institution to be highlighted (optional).
Page 6 of 11
Screen shot 8 – scatter chart functionality
New Distribution chart
This new chart type will offer the flexibility to plot multiple years of data for an institution in one chart.
The criteria to be used for the creation of this chart type will be:
•
•
•
•
The row type of the associated report must be an institution.
Users select an institution from the report group.
Users select the columns from the report that they wish to include within the chart (up to a
maximum of six)
If upper quartile, lower quartile and median aggregate rows have been added to the report for
the chosen report group, they will be displayed on the chart.
Screen shot 9 – distribution chart functionality
Page 7 of 11
Hover over tool tip text on charts
It is now possible to hover over a column, bar, line, pie slice or point on a chart and the data item
description and the data value will be displayed.
Screen shot 10 – pattern chart hover over facility
Summary of changes – data
1. Staff data re-architecture
It has become clear from the heidi User Group and other users more generally that the range and depth
of data contained within heidi carries an equal priority to interface or functionality improvements. We
therefore have undertaken a review of the heidi data architecture during the heidi 4.0 development
project.
The aim of this work is to allow users to drill down to a greater level of granularity within the data
explorer.
As part of heidi 4.0 we will be delivering the first stage of this work in relation to HESA staff data.
The HESA staff data for years 2004/05 to 2009/10 has been redeveloped to allow more fields to be
analysed against each other.
This data has replaced the staff data that had previously been available within the heidi data explorer.
Page 8 of 11
Please note that all reports created from the staff data prior to heidi 4.0 will be unaffected by this change,
however you will not be able to roll these reports forward further than 2008/09.
Screen shot 11 – example of new staff data in heidi
It is intended that the HESA student and DLHE data will also be re-architectured with the same aim.
This work is planned to be complete by Autumn 2011.
2. Estates Management Statistics historical data (ratios and data)
As part of the transfer of Estates Management Statistics (EMS) data collection and data provision from
IPD Global to HESA, it has been agreed that EMS data will be made available within heidi.
The provision of data through heidi (as well as other published output) will replace the use of the
current Excel spreadsheet for the dissemination of Estates Management Statistics (the ‘EMS reporting
spreadsheet’). This work has included the introduction of a number of new features (further details
listed above), which include:
•
•
•
•
Two new chart types (Scatter chart and Distribution chart).
New Percentage change derived column.
Ability to select a highlighted institution to be viewed in blue within the report.
New aggregate row types, available for selection within the Aggregate row box;
o Difference from median – displays the difference between the median for the report
group and an individual institutions figure.
o Group results count – displays the number of members in your report group.
In addition, historical EMS data (new type F data) and ratios (new type E data) have been introduced to
heidi for years 2004/05 to 2008/09.
Further details of these two new data types and how aggregate rows and derived columns handle nulls
for these data types may be found within the heidi data policy, which is accessible by clicking Help on
the heidi menu bar and clicking Data policy.
Page 9 of 11
Please note that EMS student headcount historical data will be released as part of heidi 4.1. In addition,
actual and estimate flags for years 2004/05 to 2007/08 will be released within the next week.
Screen shot 12 – data explorer open to display location of new EMS data
3. Equality data
Due to the improvements that have been made/will be made to the staff, student and DLHE
datasets in heidi as part of the date re-architecture review, no further datasets will be made
available specifically under the data explorer node called ‘heidi equality’ from 2009/10 for staff
and DLHE data, and 2010/11 for student data. The new re-architectured datasets incorporate all
fields previously available within the heidi equality datasets, with many additional fields to
analyse this data by.
Summary of changes – functionality no longer available
Following consideration of user feedback and usage analysis, the following functionality is no
longer available in heidi 4.0;
•
•
•
•
Institutional news – it will no longer be possible for local administrators to create news items for
heidi users at their organisation to view.
Internal messaging service – previously available on the heidi help page, this will now be
replaced with a ‘Contact local admin’ button located within the Getting started pane of the heidi
homepage (future enhancement).
Taylor squares – due to low usage, Taylor square functionality will be removed from heidi 4.0.
Institutional information – it will no longer be possible to add label notes to an institution, to be
displayed when a report is viewed. This has been removed due to low usage.
Page 10 of 11
Future enhancements
The following functionality is currently being developed and will be released in the coming months:
•
•
•
•
•
•
Downloading charts to PowerPoint.
Resuming from a previous session (however the user timeout period has now been considerably
increased).
A ‘Contact local administrator’ button, to be located within the Getting started window on the
heidi home page.
A set of standard reports for 2008/09 Estates Management Statistics data.
HESA student and DLHE re-architectured data. This work is planned to be complete by Autumn
2011.
Ability to retain focus within the heidi data explorer.
We hope that the improvements to heidi enhance your experience of using the system. We are always
keen to hear feedback, especially ideas and suggestions for future releases of heidi. Please feedback any
comments by email to [email protected].
The heidi team
March 2011
Page 11 of 11