1
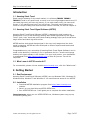
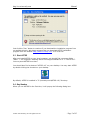
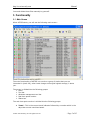
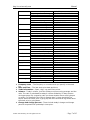
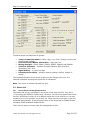
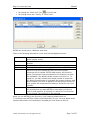
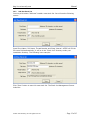
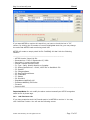
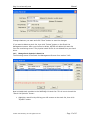
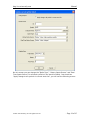
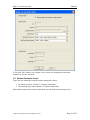
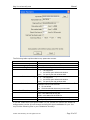
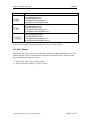
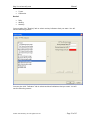
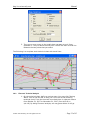
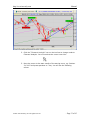
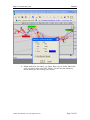
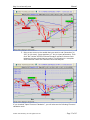
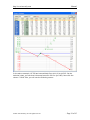
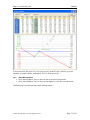
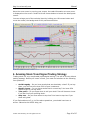
Amazing Stock Trend Signal Software User’s Manual V4.6 March 13, 2014 Copyright © 2001 - 2014, Invest4y.com http://www.invest4y.com Manual Introduction ......................................................................................................................... 2 1.1 Amazing Stock Trend ......................................................................................... 2 1.2 Amazing Stock Trend Signal Software (ASTSS) ............................................... 2 1.3 What’s new in ASTSS version 4.6? .................................................................... 2 2. Getting Started ............................................................................................................ 2 2.1 Run Environment ................................................................................................ 2 2.2 Installation........................................................................................................... 2 2.3 Start ASTSS ........................................................................................................ 3 2.4 Key Number ........................................................................................................ 3 2.5 Uninstallation ...................................................................................................... 4 3. Functionality ............................................................................................................... 5 3.1 Main Screen ........................................................................................................ 5 3.2 Tool Bar .............................................................................................................. 8 3.3 Detail Quote ........................................................................................................ 9 3.4 Stocks List ......................................................................................................... 10 3.4.1 Launch Stock List Management Screen ....................................................... 10 3.4.2 Add New Stock List ...................................................................................... 12 3.4.3 Add Exist Stock List ..................................................................................... 13 3.4.4 Update/Delete Stock List .............................................................................. 14 3.4.5 Manage Stock Symbols in Stock List ........................................................... 15 3.5 System Parameter Screen .................................................................................. 19 3.6 Color Theme ..................................................................................................... 21 3.7 System Output Files .......................................................................................... 25 3.7.1 Status ............................................................................................................. 25 3.7.2 SecurityWithBuySignal ................................................................................ 25 3.7.3 SecurityWithSellSignal ................................................................................. 25 3.7.4 SecurityWithTrendChangedUp..................................................................... 25 3.7.5 SecurityWithTrendChangedDown ................................................................ 25 3.7.6 History Quote File......................................................................................... 26 3.8 Technical Chart ................................................................................................. 26 3.8.1 Draw Trend Line ........................................................................................... 31 3.8.2 Fibonacci Technical Analysis ....................................................................... 32 3.8.3 Show Moving Waves .................................................................................... 37 3.8.4 Browse technical chart in a stock list ............................................................ 38 3.8.5 Close all open technical chart ....................................................................... 38 3.8.6 Zoom chart .................................................................................................... 38 3.9 Trend Change and Buy/Sell Signals ................................................................. 38 4. Amazing Stock Trend Signal Trading Strategy ........................................................ 40 4.1 Avoid Tragedy .................................................................................................. 41 4.2 Master Chance .................................................................................................. 42 4.3 Take Profit ........................................................................................................ 43 4.4 Stop Loss ........................................................................................................... 43 4.5 4T Stock Trading Strategy ................................................................................ 44 ©2001-2014 Invest4y, Inc. All rights reserved - Page 1 of 45 http://www.invest4y.com Manual Introduction 1.1 Amazing Stock Trend Stock trend is amazing! In the stock market, it is all about TREND! TREND!! TREND!!! Trend is our good friend, so never be a hero to fight against stock trend. If you catch big trend, your earn big money; if you catch small trend, you earn small money; if you catch wrong trend, you lose money. The stock trend change can't finish in a couple of days, but once the stock trend is reversed, we have to respect it. 1.2 Amazing Stock Trend Signal Software (ASTSS) Amazing Stock Trend Signal Software (ASTSS) is designed to help investors to decide when to buy or sell stocks by alerting stock trend signal and buy sell signal. The 4T (wait, hunt, shoot and profit) stock trading strategy helps you to avoid those tragic stocks and catch big stock moves. ASTSS catches stock trend change signal in the very early stage when the stock trend is changing. ASTSS has been developed on famous experienced traders and technical analysts. Congratulations on your ownership of Amazing Stock Trend Signal Software! You’ve made a wise decision in choosing it, for it represents the No. 1 stock trend change and buy sell signal software in the market. It is your loyal partner, your satisfaction is guaranteed! Visit http://www.invest4y.com as often as you can. You will be surprised! 1.3 What’s new in ASTSS version 4.6? For more details, please visit our website www.invest4y.com, click link “What’s new”. 2. Getting Started 2.1 Run Environment Amazing Stock Trend Signal Software (ASTSS) runs on Windows 2000, Windows XP, Windows Vista, Windows 7 and Windows 8. You need Internet access to run ASTSS. 2.2 Installation Download ASTSS installation program from http://www.invest4y.com website. Save it on your hard drive as ASTSS-SETUP.exe. Run ASTSS-SETUP.exe. It will guide you to complete the whole installation. Important note: when you run ASTSS-SETUP.exe, Windows system may pop up the following dialog box: ©2001-2014 Invest4y, Inc. All rights reserved - Page 2 of 45 http://www.invest4y.com Manual Just click the “Run” button to continue if you download the installation program from our website directly. We always suggest that you download ASTSS installation program from our website http://www.invest4y.com. It is virus free. 2.3 Start ASTSS After you install ASTSS on your local computer, you should find a program folder “Start” ”All Programs” Amazing Stock Trend Signal Software 4.6” “ASTSS 4.6”. You may start ASTSS from there. You should also find a shortcut “ASTSS 4.6” on your desktop. You may start ASTSS by double clicking the shortcut on your desktop. By default, ASTSS is installed in “C:\Invest4y.com\ASTSS 4.6\” directory. 2.4 Key Number When you run ASTSS for the first time, it will pop up the following dialog box: ©2001-2014 Invest4y, Inc. All rights reserved - Page 3 of 45 http://www.invest4y.com Manual If you have registered key number from www.invest4y.com website, input your key number here and press “Save” button. The key number is a 29 characters string, e.g. 00000-00000-00000-00000-00000, it is divided into 5 groups, each group is connected by character ‘-‘. You may copy and paste your key number from your registration confirmation email. Do not include the quote symbols that are not part of the key number. Once you input the correct key number, it will be saved in the local configuration file “Config.ini”. If you haven’t registered key from www.invest4y.com website, click “Input Later” button. ASTSS will run in trial mode. Press “Clear” button to reset key number to empty. Another way to input key number is to open “System Parameters” screen by clicking menu item: “Config” “System Parameters”. Note: If you already have ASTSS previous versions installed on your computer, ASTSS will use previous configuration. The key number will be detected automatically. You may not be asked to input key number. Important tip: You may access functions in “Tools” sub-menu to Register a key. Renew your key service period. Send questions to [email protected]. ASTSS is designed to help investors to decide when to buy or sell stocks. If you want to test whether ASTSS is helpful to you, you may run ASTSS in trial mode without a key to verify your history trades. All stock trend signal and buy sell signal are on the technical chart beyond recent 60 trading days. We strongly recommend that you run ASTSS in trial mode first. If you think ASTSS is helpful to you, then subscribe our service. 2.5 Uninstallation Running “Start” “All Programs” “Amazing Stock Trend Signal Software 4.6” “ASTSS 4.6 Uninstall” will uninstall ASTSS from your computer. Note: If you have run ASTSS, it will create some files in the installation directory: C:\Invest4y.com\ASTSS 4.6 ©2001-2014 Invest4y, Inc. All rights reserved - Page 4 of 45 http://www.invest4y.com Manual You need delete these files manually by yourself. 3. Functionality 3.1 Main Screen When ASTSS starts, you will see the following main screen: The main functionality of ASTSS is to monitor a group of stocks that you are interested in (stock list), when trend change and buy/sell signals emerge, it alerts you. The screen is divided into the following groups: Menu Tool bar Windows management tool bar Real time quote monitor Status bar The real time quote monitor is divided into the following groups: Trend – This is the current trend indicator followed by a number which is the days that current trend has lasted. ©2001-2014 Invest4y, Inc. All rights reserved - Page 5 of 45 http://www.invest4y.com Mark Manual Explain The trend The trend The trend The trend is changing from down to up. has changed from down to up. is changing from up to down. has changed from up to down. BS – Buy/Sell signal indicators followed by a number that is the days that buy sell signals have been issued. Mark Explain The buy signal is alerted today. The buy signal has been alerted before today. The sell signal is alerted today. The sell signal has been alerted before today. Type – The quote type for this symbol. Symbol D W M Explain Daily Weekly Monthly Symbol – ASTSS accepts any stock symbol which is recognized by Yahoo Finance. The following table is some examples. For more details, please visit website http://finance.yahoo.com/exchanges. Country Forex currency United States Canada Argentina Australia Austria Brazil China Stock Exchange MetaTrader 4 Indexes NASDAQ Stock Exchange New York Stock Exchange American Stock Exchange Mutual Fund OTC Bulletin Board Market Pink Sheets Indexes Toronto Stock Exchange TSX Venture Exchange Indexes Buenos Aires Stock Exchange Indexes Australian Stock Exchange Indexes Vienna Stock Exchange Indexes Sao Paolo Stock Exchange Indexes Shanghai Stock Exchange Shenzhen Stock Exchange Hong Kong Stock Exchange Taiwan Stock Exchange Taiwan OTC Exchange ©2001-2014 Invest4y, Inc. All rights reserved Examples USDCAD, XAUUSD, XAGUSD ^DJI, ^GSPC, ^RUT, ^IXIC, ^NDX MSFT, DELL, INTC IBM, BMO QID, AMJ, BQI AMRMX, RMFCX, WSHBX ITEX.OB ACCP.PK ^GSPTSE RIM.TO, BBD-B.TO, RY.TO AAG.V, STG.V, CLN.V ^MERV PAMP.BA, ERAR.BA ^AORD AAC.AX, ALZ.AX ^ATX ANDR.VI, RIBH.VI ^BVSP PETR4.SA, VALE5.SA ^SSEC, ^HIS, ^TWII 600000.SS, 600988.SS 000929.SZ, 000629.SZ 0001.HK, 2388.HK 1606.TW, 2463.TW, 6282.TW 3260.TWO, 6179.TWO, 3126.TWO - Page 6 of 45 http://www.invest4y.com Denmark France Germany India Indonesia Israel Italy Japan Malaysia Mexico Netherlands New Zealand Norway Saudi Arabia Singapore South Korea Spain Sweden Switzerland United Kingdom Manual Indexes Copenhagen Stock Exchange Indexes Paris Indexes Berlin Stock Exchange XETRA Stock Exchange Indexes National Stock Exchange Bombay Stock Exchange Index Jakarta Stock Exchange Indexes Tel Aviv Stock Exchange Indexes Milan Stock Exchange Nikkei Indexes KLSE Indexes Mexico Stock Exchange Indexes Amsterdam Stock Exchange Indexes New Zealand Stock Exchange Indexes Oslo Stock Exchange Saudi Arabia Indexes Singapore Stock Exchange Indexes Korea Stock Exchange Indexes Madrid Stock Exchange Indexes Indexes Swiss Exchange Indexes London Stock Exchange ^OMXSPI DSV.CO, NDA.CO, VWS.CO ^FCHI CS.PA, AF.PA, BNP.PA ^GDAXI ERDN.BE, BMW.BE HVM.DE, SAP.DE ^BSESN IDBI.NS, IGL.NS SAIL.BO ^JKSE ALMI.JK, AALI.JK, ANTA.JK ^TA100 ALHE.TA, AVNR.TA FTSEMIB.MI AE.MI, AIC.MI ^N225 ^KLSE 1015.KL, 1023.KL ^MXX ALFAA.MX, GEOB.MX ^AEX AH.AS, TOM2.AS ^NZ50 AIA.NZ, CEN.NZ ^OSEAX CECO.OL, ACY.OL 1010, 1020, 1030, 1040 ^STI C09.SI, C31.SI ^KS11 000040.KS, 000070.KS ^SMSI CAF.MC, BTO.MC, POP.MC ^OMXSPI ^SSMI CLN.VX ^FTSE BAY.L, ABU.L, AV.L Company name – The Company or comment that you specify in the stock list. Date and Time – The last stock price date and time. Trade information – Open, High, Low and Close prices. Volume – Today’s volume, previous 50 days volume moving average and the ratio. The ratio is calculated as today’s volume divided by 50 days volume moving average. By comparing ratio you know whether there are big buyers or sellers. For example if the ratio is greater than 2, there should be big buyers when the stock price is going up and there should be big sellers when the stock price is going down. Change and change percent – These include today’s change and change percent compared with yesterday’s close price. ©2001-2014 Invest4y, Inc. All rights reserved - Page 7 of 45 http://www.invest4y.com Manual Portfolio data – These include “Trade Date”, “Shares”, “Price Paid”, “Holding Value”, “Gain” and “Gain(%)”. . To10D% – This is calculated as (Current Price – EMA10 ) / EMA10 * 100. Green means current price is above EMA10. Red means current price is below EMA10. If this value is extremely high, for example 15, the stock price should be retrace or bounce. Moving average – 5 days, 10 days, 20 days, 50 days, 100 days and 200 days exponential moving average. Green means current price is above moving average. Red means current price is below moving average. Technica indicators – SAR, ROC, CMF, ADX, RSI and Stochastics technical parameters. Signal history – Display signals history (trend change and buy/sell signals) in recent 10 days. S0 is for today’s signal, S1 is for 1 day before; S9 is for 9 days before. Advice – Indicate whether today’s price movement is bullish, bearish or neutral. If your screen is not wide enough to display all of the groups, you may move the horizontal scroll bar to show the columns that you want. You may also hide some columns that you are not interested in by shrinking the column width to zero. Current stock (cursor) to be operated is highlighted with white background. On this screen, you can: Action Click left mouse button Click ▲ of vertical scroll bar Click▼ of vertical scroll bar Click left mouse button above vertical scroll bar float tag Click left mouse button below vertical scroll bar float tag Drag the vertical scroll bar float tag up Drag the vertical scroll bar float tag down Double click left mouse button Press right mouse button Press “F” key Press “C” key Press space bar Press “PgUp” key Press “PgDn” key Press “↑” key Press “↓” key Result Highlight current stock Scroll up one stock Scroll down one stock Move up one page. Move down one page. Move rows down rapidly. Move rows up rapidly. Launch detail quote information screen. Launch the float menu with “Chart”. Launch “Find Symbol” screen. Launch technical stock chart screen. Draw stock technical chart directly without launching technical stock chart screen. Move up one page. Move down one page. Scroll up one row. Scroll down one row. 3.2 Tool Bar There is a tool bar on main screen: ©2001-2014 Invest4y, Inc. All rights reserved - Page 8 of 45 http://www.invest4y.com Symbol Manual Explain Save real time quote monitor screen or technical chart as bitmap file. Setup system configuration. Select your own color of real time quote monitor and technical chart. Setup stock list. Draw technical chart. Go to Yahoo quote. Show moving wave. Compress technical chart. This is especial useful for intra day technical chart. You may compress 1 minute technical chart to get 2 minute, 3 minute chart. Draw trend lines or support/resistance lines. Erase previous trend line. Erase all trend lines. Do Fibonacci technical analysis. Find symbol in the stock list Open embedded Internet Browser – visit www.invest4y.com only. Open manual. Send questions to [email protected]. There is also a Window management tool bar on the main screen: You may click the window title to switch active window easily. 3.3 Detail Quote You may launch this detail quote screen by: Double clicking current highlighted stock on the main screen Double clicking one candle on the technical chart ©2001-2014 Invest4y, Inc. All rights reserved - Page 9 of 45 http://www.invest4y.com Manual The detail quote is divided into six groups: Today’s Trade Information – Open, High, Low, Close, Change, Volume and current trend indicator. Previous 2 Days/Weeks Information – High and Low. Moving Average – EMA5, EMA10, EMA20, EMA50, EMA100 and EMA200. Technical Indicators – Relative Strength Indicator (RSI) and Slow Stochastics (%K, %D). Signal History – In recent 10 days Invest4y.com’s Advice – Whether today’s trading is bullish, bearish or neutral. The important function of this screen is that you can change close price, the technical indicators and buy/sell signals are re-calculated. Note: This screen is accessed by paid key only. 3.4 Stocks List 3.4.1 Launch Stock List Management Screen The stocks that you are interested in are stored in the stock list files. They are in “C:\Invest4y.com\ASTSS 4.6\Stock List\” directory. You have to prepare these stock list files. ASTSS can monitor up to 4 different stock lists in the same time. You may include up to 10,240 symbols in one stock list. Stock symbols more than 10,240 are discarded automatically. All stock symbols have to be recognized by YAHOO finance excluding FOREX and Saudi Arabia stocks. There are two ways to launch stock list management screen: ©2001-2014 Invest4y, Inc. All rights reserved - Page 10 of 45 http://www.invest4y.com Manual By clicking the “Stock List” icon on the tool bar By clicking menu item “Config” “Stock Lists” ASTSS can handle up to 4 different stock lists. There is the following information on the stock list management screen: ID Short Name Full Name File Name Thread Interval This is the order that ASTSS will load stock list in real time quote monitor screen. Every stock list must have unique short name. No space is allowed. The description of the stock list up to 32 characters. The physical file that store the stock list. It is an ASCII file. How many thread you want ASTSS to create to monitor this stock list. The more thread you want, the more system resources will be needed. ASTSS loads history and real time quote from famous financial website for the symbols in a stock list repeatedly. The default thread number to do this is 1. To speed up, you may increase this thread number to maximum 16. When thread number is increased, the system resource used also increases. You have to adjust to find an optimal number for your system. We recommend increasing 1 thread for every 512 symbols. ASTSS downloads real time quote from online resource. This is the seconds that you want ASTSS to sleep when it finishes a cycle to load quote for all symbols in a stock list. The minimum is one second. The maximum is 900 seconds. When you run ASTSS for the first time, it will create a default stock list “C:\Invest4y.com\ASTSS 4.6\Stock List\Default.dat” for you. You may delete those symbols that you are not interested in and add your own stocks to the list. ©2001-2014 Invest4y, Inc. All rights reserved - Page 11 of 45 http://www.invest4y.com 3.4.2 Manual Add New Stock List You may click button “Add new” to add a new stock list. You will see the following screen: Input Short Name, Full Name, Thread Number and Sleep Interval. ASTSS will fill the file name field automatically; it will be in the “Stock List” directory under your installation directory. The following is an example: Click “Save” button to save this new stock list. The Stock List Management Screen looks like: ©2001-2014 Invest4y, Inc. All rights reserved - Page 12 of 45 http://www.invest4y.com Manual If you want ASTSS to monitor this stock list, you have to check the box in “ID” column. By clicking the ID number of current highlighted stock list, you may change the order that ASTSS loads monitoring stock lists. ASTSS will create an empty stock list file “NASDAQ-100.dat” with the following content: ----------------------------------------------------------------------------- ASTSS Version 3 stock list file. -- Generated on 17:05:12 September 05, 2009. -- Copyright (c) www.invest4y.com -- Format: Comma delimiter fields. -- F1: Type - Daily, Weekly Monthly or Intraday -- F2: HistoryQuoteSource - Online, ASCII file or MetaStock File -- F3: Symbol -- F4: CompanyName -- F5: RealTimeQuoteSource -- F6: TradeDate -- F7: Shares -- F8: PricePaid -- ShortName=NASDAQ-100 -- FullName=NASDAQ 100 Index -- Thread=1 -- Interval=300 ---------------------------------------------------------------------------Important Note: Do not modify the above content manually as ASTSS recognizes stock list file by these tags. 3.4.3 Add Exist Stock List If you have created a stock list file and want to let ASTSS to monitor it. You may click “Add Exist” button. You will see the following screen: ©2001-2014 Invest4y, Inc. All rights reserved - Page 13 of 45 http://www.invest4y.com Manual Select a stock list file, e.g. “NASDAQ.dat” and click “Open” button. The Stock List Management Screen looks like: 3.4.4 Update/Delete Stock List If you want to change information of a stock list, e.g. Short Name, Full Name, File Name, Thread or Interval, you may click “Update” button. You will see the following screen: ©2001-2014 Invest4y, Inc. All rights reserved - Page 14 of 45 http://www.invest4y.com Manual Change whatever you want and click “Save” button to save the changes. If you want to delete a stock list, then click “Delete” button on the Stock List Management screen. After you confirm to delete, ASTSS will delete this stock list from the monitoring screen. The physical stock list file is not deleted from your hard drive. 3.4.5 Manage Stock Symbols in Stock List The following screen is the Stock List Management Screen from section 3.4.2: Now let’s add stock symbols to the NASDAQ-100 stock list. This is how to launch the “Stock List Symbols” screen: Highlight a stock list by clicking your left mouse on the stock list, then click “Symbol” button. ©2001-2014 Invest4y, Inc. All rights reserved - Page 15 of 45 http://www.invest4y.com Manual You may click “<=” button to add a stock index components to current stock list. The following is an example after adding “NASDA 100 Index” components: You may input batch stock symbols one time by clicking the button “Import”. If you click “Import” button, ASTSS will ask you to select an import file. The imported file should include stock symbols line by line, for example: IBM MSFT INTC DELL HF.TO 601318.SS On this screen, you can also click “Delete” – Delete current highlighted stock symbol “Delete All” – Delete all stock symbols in current stock list. Or click the following buttons to insert/append/update stock symbols: “Insert Above” – Insert a symbol above current highlighted stock symbol “Insert Below” – Insert a symbol below current highlighted stock symbol “Append” – Append a symbol at the end of stock list “Update” – Update current highlighted stock symbol The following is stock symbol screen to insert a new stock symbol: ©2001-2014 Invest4y, Inc. All rights reserved - Page 16 of 45 http://www.invest4y.com Manual If you click “Auto Fill” button, ASTSS will fill the “Company Name” field automatically. You may also input portfolio data so that you are able to track your trading performance. If you want to change parameter for a stock symbol in the stock list, you may click “Update” button. You will see the following screen: ©2001-2014 Invest4y, Inc. All rights reserved - Page 17 of 45 http://www.invest4y.com Manual On this screen you can change the “Quite Type”, “History Quote Source” and “Real Time Quote Source” for all stock symbols in the stock list easily. Just check box “Apply change to all symbols in current stock list”, you will see the following screen: ©2001-2014 Invest4y, Inc. All rights reserved - Page 18 of 45 http://www.invest4y.com Manual If you click “OK” button, any change in this screen will be applied to all stock symbols un current stock list. 3.5 System Parameter Screen There are two methods to launch system parameter screen. By selecting menu “Config” “System Parameter” By pressing right mouse button “System Parameter” After system parameter screen is launched, you can find the following screen: ©2001-2014 Invest4y, Inc. All rights reserved - Page 19 of 45 http://www.invest4y.com Manual The following table explains what every parameter means. IDs Key Number Key Expiration Date Registered Email Main window Width Main window Height Refresh Chart Interval Start Real Time Quote Loader Save Status As Save Cancel Explain Key number from invest4y.com registration notice email Your key service expiration date. The email address registered to this key number. Specify the main window width -1 The full screen 0 Let ASTSS open default main window nnnn You specify the main window width Specify the main window height -1 The full screen 0 Let ASTSS open default main window nnnn You specify the main window width Specify the interval that ASTSS refresh technical chart. The maximum interval is 300 seconds. 0 Do not refresh nnn Refresh technical chart every nnn seconds. Whether to monitor stocks list. ASCII – save status file as ASCII format. CSV – save status file as CSV file. HTML – save status file as HTML file. Save your system parameter change permanently Ignore your system parameter change If you set “Start Real Time Quote Loader” to yes, ASTSS will monitor the stocks list and generate a series of trend change and buy/sell signal candidates for you. You may find the following files in your installation directory: ©2001-2014 Invest4y, Inc. All rights reserved - Page 20 of 45 http://www.invest4y.com File Type Manual File Name Status.txt SecurityWithBuySignal.txt SecurityWithSellSignal.txt SecurityWithTrendChangedUp.txt SecurityWithTrendChangedDown.txt Status.csv SecurityWithBuySignal.csv SecurityWithSellSignal.csv SecurityWithTrendChangedUp.csv SecurityWithTrendChangedDown.csv Status.html SecurityWithBuySignal.html SecurityWithSellSignal.html SecurityWithTrendChangedUp.html SecurityWithTrendChangedDown.html You may open these files by selecting menu “File” and sub-menus. 3.6 Color Theme Everybody has her/his own color preference. ASTSS provides functionality to let you select you own color of real time quote monitor and technical chart. There are two ways to launch color theme screen. Click “Color Them” icon on the tool bar Click menu item “Config” “Color Theme” ©2001-2014 Invest4y, Inc. All rights reserved - Page 21 of 45 http://www.invest4y.com Manual The following chart displays the definition of “Odd Column”, “Even Column” and “Cursor”: ©2001-2014 Invest4y, Inc. All rights reserved - Page 22 of 45 http://www.invest4y.com Manual You may also select “Overlay” or “Indicator” to select your own colors on technical chart. If you select “Overlays” tab, you will see the following screen: ©2001-2014 Invest4y, Inc. All rights reserved - Page 23 of 45 http://www.invest4y.com Manual If you select “Indicator” tab, you will see the following screen: ©2001-2014 Invest4y, Inc. All rights reserved - Page 24 of 45 http://www.invest4y.com Manual You may click related buttons to change colors and lines width. If you want to restore to previous color, just press “Discard” button. 3.7 System Output Files These files are normally generated for paid key only. If you are using trial key, some files may be empty. 3.7.1 Status This is the status output file of your stocks list: 3.7.2 SecurityWithBuySignal This file includes all stocks of which a buy signal, i.e. green circle emerges in your stocks list in recent 5 days. These stocks are buy candidates. 3.7.3 SecurityWithSellSignal This file includes all stocks of which a sell signal i.e. red circle emerges in your stocks list in recent 5 days. If you bought these stocks, you have to think about stopping loss. 3.7.4 SecurityWithTrendChangedUp This file includes all stocks of which the trend is changed from down to up in recent 5 days. These stocks are buy candidates. 3.7.5 SecurityWithTrendChangedDown This file includes all stocks of which the trend is changed from up to down in recent 5 days. These stocks are sell candidates. The customer may use the above files to decide what stocks to buy and whether sell your long position. All trend change and buy/sell signals are displayed in the technical charts. ©2001-2014 Invest4y, Inc. All rights reserved - Page 25 of 45 http://www.invest4y.com 3.7.6 Manual History Quote File These are history quotes files as CSV format. The content format is “Date,Open,High,Low,Close,Volume”. You may use them as input of other stock technical analysis software if you like. 3.8 Technical Chart There are 3 methods to launch the stock chart screen: By clicking “Chart” icon on the tool bar By pressing key “C” By pressing right mouse button “Chart” You will see the following screen layout: You may change to other symbols by: Select Index from the drop down list Input stock symbol directly ©2001-2014 Invest4y, Inc. All rights reserved - Page 26 of 45 http://www.invest4y.com Manual You may change “History Quote Source” and “Real Time Quote Source”. Currently ASTSS supports the following quote source. History Quote Source: “Online - Yahoo - daily, weekly or monthly” – ASTSS will download history quote from Yahoo Finance. “Online - Google – daily or weekly” – ASTSS will download history quote from Google Finance. “Online - MetaTrader currency – intraday, daily, weekly or monthly” – ASTSS will download history quote from MetaTrader servers. This history quote source is for FOREX only. The FOREX example symbols are AUDUSD, EURAUD, EURCHF, EURGBP, EURJPY, EURUSD, GBPCHF, GBPJPY, GBPUSD, USDCAD, USDCHF and USDJPY etc. If you are running ASTSS behind a firewall, please open port 45888 and 45889. “Online – NSE India– daily” – ASTSS will download history quote from India National Stock Exchange website. This history quote source is for stock symbols of India National Stock Exchange only, i.e. the stock symbols are ended with “.NS”. “Online – ASX– daily” – ASTSS will download history quote from Australian Stock Exchange website. This history quote source is for stock symbols of Australian Stock Exchange only, i.e. the stock symbols are ended with “.AX”. “Online - Saudi Arabia – daily” – ASTSS will download history quote from SaudiMeta. This history quote source is for stocks of Saudi Stock Exchange only. The stock symbol examples are 1020, 1030 and 1040 etc. "ASCII - 6 fields file (Date,O,H,L,C,V) - daily, weekly or monthly" – ASTSS will get history quote from your indicated ASCII file. The file format is as the following: Date,Open,High,Low,Close,Volume 17-Nov-06,54.12,54.12,53.16,53.46,1516500 16-Nov-06,53.90,54.47,53.61,53.72,2082900 15-Nov-06,52.92,53.65,52.80,53.65,3203800 14-Nov-06,52.62,53.22,52.62,52.75,1947100 "ASCII - 6 fields file (Time,O,H,L,C,V) - intraday" – ASTSS will get history quote from your indicated ASCII file. The file format is as the following: Time,Open,High,Low,Close,Volume 15:30:00,3682.85,3682.85,3682.85,3682.85,20753000 15:29:58,3674.60,3682.50,3669.50,3682.50,1912900 15:14:57,3681.00,3685.80,3672.10,3675.00,2052600 14:59:57,3675.55,3681.80,3675.05,3680.80,960200 14:44:56,3675.00,3677.70,3673.75,3676.00,391600 14:29:59,3677.00,3678.85,3673.10,3676.00,681600 "MetaStock - 7 fields (Date,O,H,L,C,V,OI) – daily, weekly or monthly" – ASTSS will get history quote from your indicated MetaStock Master and Data files. "MetaStock - 7 fields (Date,Time,O,H,L,C,V) - intraday" – ASTSS will get history quote from your indicated MetaStock Master and Data files. "MetaStock - 8 fields (Date,Time,O,H,L,C,V,OI) - intraday" – ASTSS will get history quote from your indicated MetaStock Master and Data files. Real Time Quote Source: ©2001-2014 Invest4y, Inc. All rights reserved - Page 27 of 45 http://www.invest4y.com Manual "Online - Yahoo - delayed" – ASTSS will get intraday quote for current trading day from Yahoo Finance. The quote is at least 15 minutes delayed. For US stocks, ASTSS also downloads ECN quote from Yahoo Finance, which is almost real time. "Online - NSE India - real time" – ASTSS will get intraday quote from NSE India. The quote is real time. This quote source is for stocks of India National Stock Exchange only, i.e. the stock symbols are ended with “.NS”. "Online - Jakarta - real time" – The quote is real time. This quote source is for stocks of Jakarta Stock Exchange only, i.e. the stock symbols are ended with “.JK”. "Online - MetaTrader currency - real time" – ASTSS will get intraday quote from MetaTrader servers. The quote is in real time. This quote source is for FOREX symbols only. For example USDCAD, AUDUSD etc. "ASCII - 8 fields file (Ticker,Date,Time,O,H,L,C,V)" – ASTSS will get intraday quote from your indicated ASCII file. "MetaStock - 7 fields (Date,Time,O,H,L,C,V)" – ASTSS will get intraday quote from your indicated MetaStock Master/Data file. "MetaStock - 8 fields (Date,Time,O,H,L,C,V,OI)" – ASTSS will get intraday quote from your indicated MetaStock Master/Data file. You may also change the following parameters. Style Candle – if you select “Candle” style, ASTSS will draw technical chart using candles. There are 4 types of candle on ASTSS technical chart. Type Black/White Example Sentiment Absolute bullish Black/Black Neutral bullish Red/Red Absolute bearish Red/White Neutral bearish Description Today’s close is higher than yesterday’s close and today’s close is higher than today’s open. Today’s close is higher than yesterday’s close but today’s close is lower than today’s open. Today’s close is lower than yesterday’s close and today’s close is lower than today’s open. Today’s close is lower than yesterday’s close but today’s close is higher than today’s open. Duration 1 3 6 1 2 3 4 month months months year year year year ©2001-2014 Invest4y, Inc. All rights reserved - Page 28 of 45 http://www.invest4y.com Manual 5 year Customize Period Daily Weekly Monthly You may also click “Overlay” tab to select overlay indicators that you want. You will see the following screen: You can also click “Indicator” tab to select technical indicators that you want. You will see the following screen: ©2001-2014 Invest4y, Inc. All rights reserved - Page 29 of 45 http://www.invest4y.com Manual If you press “Cancel”, Amazing Trend Signal Software returns to the main screen. If you press “OK”, the system launches a typical stock technical chart with trend change and buy/sell signals. ASTSS will save your technical chart setting until you change them next time. The following is an example of ASTSS technical chart: ©2001-2014 Invest4y, Inc. All rights reserved - Page 30 of 45 http://www.invest4y.com Manual On the technical chart, you will find stock trend signals and buy sell signals alerted by ASTSS. See section 3.1 for more details. ASTSS provides some tools for you to do your own stock technical analysis. On the technical chart, press the right mouse button, you will see the following float menu: 3.8.1 Draw Trend Line 1. Click “Draw Trend Lines” icon on the tool bar to change mode. You will see that the cursor turns into: 2. On the technical chart, move the cross cursor to the candle that you want to start, then press spacebar or T key, you will see the following dialog box. Select the parameters that you want and press OK button, the start point of current trend line is decided. ©2001-2014 Invest4y, Inc. All rights reserved - Page 31 of 45 http://www.invest4y.com Manual 3. Then move cross cursor to the candle that you want to end. Press spacebar or T key to define the end point. ASTSS will draw a trend line between the two points that you select. The following is a complete stock technical chart with trend lines: 3.8.2 Fibonacci Technical Analysis 1. On the technical chart, define a moving wave. You may click “Moving Wave” icon on the tool bar to help you. Let’s look at the following technical chart. From the chart we know that there is a decent retrace from October 31, 2007 to November 21, 2007 (from $15.19 to $11.18). By doing Fibonacci analysis, we may guess where it will go. ©2001-2014 Invest4y, Inc. All rights reserved - Page 32 of 45 http://www.invest4y.com Manual 2. Click the “Fibonacci Analysis” icon on the tool bar to change mode to Fibonacci Analysis. You will see that the cursor turns into: 3. Move the cursor to the start candle of the waving move, e.g. October 31, 2007 and press spacebar or F key. You will see the following screen: ©2001-2014 Invest4y, Inc. All rights reserved - Page 33 of 45 http://www.invest4y.com Manual 4. Select what price you want, e.g. Open, High, Low or Close. Select the color you want, then press “OK” button. You will see the following screen when you are moving your mouse. ©2001-2014 Invest4y, Inc. All rights reserved - Page 34 of 45 http://www.invest4y.com Manual 5. Move cross cursor to the candle that you want to end (November 21, 2007 in this case). Press spacebar or F key to input parameters. Then click “OK” button ASTSS will draw Fibonacci retreat or bounce lines between the two points that you select. The following is a complete stock technical chart with Fibonacci technical analysis: If you checked “Open Fibonacci Calculator”, you will also see the following Fibonacci calculator tools: ©2001-2014 Invest4y, Inc. All rights reserved - Page 35 of 45 http://www.invest4y.com Manual In the above example, HF.TO has bounced back from $11.18 to $15.02. On the technical chart, you see that it bounced cross 61.8% line ($13.66). Now click the column “0.618” title, you will see the following screen: ©2001-2014 Invest4y, Inc. All rights reserved - Page 36 of 45 http://www.invest4y.com Manual In this case RT1.382 ($16.72), RT1.618 ($17.67) and RT2.000 ($19.20) may be possible, so watch closely around $16.72, $17.67 and $19.20. 3.8.3 Show Moving Waves Click “Moving Wave” icon on the tool bar to show moving waves. Click “Moving Wave” icon on the tool bar again to clear the moving waves. The following is a technical chart with moving waves: ©2001-2014 Invest4y, Inc. All rights reserved - Page 37 of 45 http://www.invest4y.com Manual Important Note: ASTSS issues only one buy or sell signal in one up or down wave. 3.8.4 Browse technical chart in a stock list You may browse technical chart one by one for all symbols in a stock list. Here is how: 1. Click space bar to draw technical chart for the cursor symbol in the stock list 2. Click left arrow key to draw technical chart of previous symbol in the stock list. 3. Click right arrow key to draw technical chart of next symbol in the stock list. 3.8.5 Close all open technical chart If you opened too many technical charts and want to close all of them. You may simply click “Window” -> “Close All Charts” to do that. 3.8.6 Zoom chart In the bottom of the technical chart, there are the following buttons: You may click them to enlarge or shrink the chart quickly. 3.9 Trend Change and Buy/Sell Signals The following is a typical Amazing Trend Signal Software stock technical chart: ©2001-2014 Invest4y, Inc. All rights reserved - Page 38 of 45 http://www.invest4y.com Manual The following table explains what these signals mean. Symbol Yellow Line Black Line Blue Line Red Line Purple Line Green Line Explain The trend is changing from down to up. The trend has changed from down to up. Buy signal – The buyers are overwhelming. The signal is alerted today. It may disappear as the stock price is still changing before market close. Buy signal – The buyers are overwhelming. The signal is alerted before today. It should be a buy. The trend is changing from up to down. You may use this signal as the first profit or stop loss signal. The trend has changed from up to down. You may use this signal as the second profit or stop loss signal. Sell signal – The sellers are overwhelming. The signal is alerted today. It may disappear as the stock price is still changing before market close. You may use this signal as the third profit or stop loss signal. Sell signal – The sellers are overwhelming. The signal is alerted before today. It should take profit or stop loss. EMA5 – 5 days exponential moving average EMA10 – 10 days exponential moving average EMA20 – 20 days exponential moving average EMA50 – 50 days exponential moving average EMA100 – 100 days exponential moving average EMA200 – 200 days exponential moving average ©2001-2014 Invest4y, Inc. All rights reserved - Page 39 of 45 http://www.invest4y.com Manual Move the cross cursor by moving your mouse, the trade information at cross cursor is displayed on the screen. Double click left mouse button to launch the detail quote screen. You can enlarge part of the technical chart by holding your left mouse button and move the mouse, the background of this part becomes blue: 4. Amazing Stock Trend Signal Trading Strategy Trading stock is a very complicated psychological activity. You will be a loser without trading strategy. Before you invest in stock, you must find solutions to the following four questions: Avoid tragedy – Do you know stocks that are absolutely a loser? If you buy them, you will lose more than 50% of your investment. Master chance – Do you know stocks that is a must buy? You have 80% chance to win if you buy them. Take profit – Do you know when to sell your stock? You will become a loser if you don’t sell your profiting stock. Stop loss – Do you know when to stop loss? You have to stop loss if you shoot a big bear. If you find solutions to 3 or 4 of the above questions, you should have been a winner. Otherwise let ASTSS help you! ©2001-2014 Invest4y, Inc. All rights reserved - Page 40 of 45 http://www.invest4y.com Manual 4.1 Avoid Tragedy Let’s look at some examples on how ASTSS avoids these tragedy stocks. Example 1: On July 30, 2004, Primus Telecom dropped 50.75%. If you have ASTSS (Amazing Stock Trend Signal Software), you have avoided this tragedy. ASTSS had alerted sell signal one month before the tragedy!!! Example 2: On May 27, 2004, Bombardier dropped 13.53% and it was not the end. Look at how Amazing Stock Trend Signal Software avoided this tragedy – it alerted trend down signal 4 days before the tragedy drop!!! You may find more examples like this! ©2001-2014 Invest4y, Inc. All rights reserved - Page 41 of 45 http://www.invest4y.com Manual 4.2 Master Chance Another functionality of ASTSS is to give buy signal as early as possible when a stock trend is changing from down to up. Let’s see some examples how you can profit from it. Example 1: GCE.TO – Grande Cache Coal Company On July 13 2009, a green circle buy signal emerged on GCE.TO’s daily chart. If you bought it at close price $1.85 and sold it on August 13, 2009 at close price $4.12, your profit was 122.7% in only one month! Example 2: TCK-B.TO – TECK COMINCO LIMITED CL B SV On the week of March 23, 2009, a green circle buy signal emerged on TCK-B.TO’s weekly chart. If you bought it at close price $7.73 and sold it on the week of September 14, 2009 at close price $29.25, your profit was 278.4% in only half a year! ©2001-2014 Invest4y, Inc. All rights reserved - Page 42 of 45 http://www.invest4y.com Manual Now you know the Amazing Stock Trend! Trend is our good friend! 4.3 Take Profit It is time to take profit in the following cases: Breaks important moving average, e.g. EMA50, EMA100 or EMA200 A red triangle emerges A red circle emerges You think you have enough profit It is absolutely right to take profit whenever you want! 4.4 Stop Loss It is the most difficult thing to stop loss when you buy a stock. If you buy a big bear, you have to stop loss. There are 3 chances to stop loss in ASTSS: A red triangle with yellow background ( ) emerges – The trend was changing from up to down. A red triangle with red background ( ) emerges – The trend has changed from up to down. A red circle ( ) emerges – The sellers are overwhelming. Let’s look at NASDAQ composite when it collapsed in September 2008! On August 19, 2008 ASTSS alerted a trend changing down ( ) signal. You should have taken profit. On August 21, 2008 ASTSS alerted a trend changed down ( ) signal. The market down trend was confirmed. You should have considered exiting all longs! On August 26, 2008 ASTSS alerted a sell signal ( This is the last chance for you to stop loss. ©2001-2014 Invest4y, Inc. All rights reserved ), the sellers were overwhelming. - Page 43 of 45 http://www.invest4y.com Manual If you have followed ASTSS’s signals, would you have escaped from the market collapse? 4.5 4T Stock Trading Strategy We are strongly recommending you Invest4y.com’s 4T Stock Trading Strategy. What’s 4T Stock Trading Strategy? It is the whole process of investing in stock, i.e. WAIT, HUNT, SHOOT and PROFIT. WAIT HUNT SHOOT PROFIT Between red triangle and green triangle – the stock is in down trend Between green triangle and green circle – the price is going up, it may be a prey. Buy in 5 days when you see green circle There are two possibilities when a green circle emerges: The price continues to go up The price is pulled back temporarily, then go up The pull back is very good buy opportunity. Take profit whenever you want. ©2001-2014 Invest4y, Inc. All rights reserved - Page 44 of 45