1
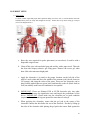
PHYSIO FLOW PF-05 Lab1
Operating Instructions
_______________________________________________________
July 2009
Commercial Offices:
North America:
VasoCom Inc.
2014 Ford Road, Unit G
Bristol, PA USA 19007
e-mail: [email protected]
tel: (215) 826 9998
fax: (215) 826 8102
All other Countries:
Manatec Biomedical
44, rue de Laborde
75008 PARIS-FRANCE
e-mail: [email protected]
tel: (33 1) 43 87 88 13
fax: (33 1) 43 87 70 83
Manatec and PhysioFlow are registered trademarks
1
TABLE OF CONTENTS
PREAMBLE
3
INTRODUCTION
3
WORKING PRINCIPLE
WARNINGS AND PRECAUTIONS
INDICATIONS
COUNTERINDICATIONS
FUNCTIONS
4
5
6
6
7
I. SOFTWARE INSTALLATION / REMOVAL
II. SUBJECT SETUP
III. CONNECTIONS
IV. CALIBRATION
V. MONITORING
VI. REVIEWING ACQUISTION
VII. EXPORT FUNCTION
VIII. EDITION OF PRINTOUTS
IX. EXIT
X. ADVANCED FEATURES
XI. MAINTENANCE AND STORAGE
8
10
13
15
20
23
28
29
31
32
35
APPENDIX A: SUMMARY TABLE OF MENUS
APPENDIX B: TOOLS BAR
APPENDIX C: PARAMETER DERIVATION
36
39
36
2
USER MANUAL
PhysioFlow PF-05 Lab1
For MS-Windows® XP Operating Systems
Software version PF-106
PREAMBLE:
PhysioFlow is a noninvasive cardiac output measurement system that can be used on patients at
rest or under exercise conditions. If it is used on a treadmill, please respect a moderated level of
effort (walking patients).
Remark: Before using PhysioFlow, please read the instructions of this manual thoroughly and
carefully. If you have any questions or require additional information about their significance or
for any further information, please contact Manatec Biomedical at the address indicated in the
manual or your local distributor.
INTRODUCTION
PhysioFlow PF-05 is an original system for noninvasive cardiac monitoring which provides
hemodynamic parameters using analysis of thoracic electrical bioimpedance signals (TEB).
More precisely, PhysioFlow PF-05 PhysioFlow allows the assessment of the hemodynamic state
and the ventricular function of patients by determining 15 hemodynamic parameters. Besides
this, PhysioFlow PF-05 allows the operator to:
•
•
•
•
•
Monitor patient’s trends,
Display, store and analyze data,
Print reports of hemodynamic parameters,
Export data to text files
Interface the system with other monitors
3
Working Principle
Thoracic electrical bioimpedance, thoracic electrical impedance, electric bioimpedance,
impedance cardiography and TEB have the same meaning in the literature. In this manual, the
term thoracic electrical bioimpedance is used.
TEB is a technique which quantifies the heart’s mechanical activity (the circulation) instead of its
electrical activity (ECG). The fundamental theoretical principle of the TEB uses the direct
measurement of the baseline impedance of the velocity index, the acceleration index, the
ventricular ejection time and the heart rate of the early diastolic function ratio. These measured
parameters are used to compute other hemodynamic parameters.
The PF-05’s application for the hemodynamic parameters determination is based on the
following principles: the biological tissues, as the muscles, bones, fat, and blood each have
different electrical properties. Among them all, the blood is the most conductive body tissue in
the thorax. As the circulation is pulsatile and the arterial vessels are supple, the differences of
pulsatile blood volume are made at the level of thoracic arterial system, mainly in the aorta, in
connection with the ventricular function. This blood volume change makes an electrical
conductivity change and consequently a change in the impedance of the thorax against the
electrical current. The differences in thoracic electrical impedance are essentially created by
changes of velocity and of blood volume in the aorta.
Unlike other TEB systems, PhysioFlow does not rely on impedance baseline measurements to
compute parameters. This tends to reduce the limitations of standard TEB.
PhysioFlow PF-05 uses a noninvasive technique to determine the TEB. By performing the
analysis of TEB recordings, in association with the ECG signal, PhysioFlow provides
information related to the cardiac function.
PhysioFlow measures the change in impedance by injecting a high frequency alternating
electrical current (75 kHz) of low magnitude (3.8 mA rms.) towards the thorax between a pair of
electrodes positioned on the neck and another pair positioned on xiphoïd process. The use of a
high frequency current eliminates the risk of interference with heart and brain bioelectrical
activity. In addition, as the impedance of skin-electrodes is very low at high frequency, tissues
will not endure any thermal effects and the patient feels nothing.
By detecting and measuring the difference of thoracic impedance over time, PhysioFlow PF-05
measures in a noninvasive way the systolic volume, the cardiac output and several other
hemodynamic parameters. By comparison, thermodilution measures the differences in
temperature, function of the time for measuring the systolic volume, and the cardiac output in an
invasive way.
4
WARNINGS AND PRECAUTIONS
WARNINGS
FOR ACCURATE MEASUREMENTS, IT IS VERY IMPORTANT THAT THE OPERATOR
UNDERSTANDS THE DIFFERENCE BETWEEN ACCEPTABLE SIGNAL AND POOR SIGNAL
QUALITY, SEE CHAPTER IV.
•
•
•
•
•
•
In accordance with US federal regulations, this device can be used only by a physician or
under the order of a physician.
Explosion hazard: do not use in the presence of flammable anesthetics.
The conductive gel of sensors must not be in contact with other conductive products of
objects when patients are monitored.
Sensors must be positioned on the skin; they must not be directly positioned on the heart.
Specific patient cables supplied with PhysioFlow have been designed for optimal protection
against effect of defibrillators and electrosurgical devices. Do not use any other type of cable
with the device. However, patient cable should be unplugged from the device before any
defibrillator shock is performed.
Disposal of this product and/or its accessories shall be made in accordance with all locally
enforced laws.
PRECAUTIONS
Some clinical circumstances may impair accuracy of measurements. Such as:
•
•
•
•
•
•
•
•
•
•
•
Tachycardia with heart rate above 250 bpm
Untimely movement of neck
Patients running on treadmill
Patients under 120cm (48 in.)
Patients under 25 Kg (67 lbs)
Presence of aortic balloon pumps
Presence of ultrafiltration systems
Presence of pacemakers with external leads
Open chest surgery
Use of electrical cutlery and electrosurgical devices
Morbidly obese patients, such as those weighting over 600 pounds.
PhysioFlow PF-05 software should be re-calibrated after 24 hours of continuous measurement on
a patient. Re-calibration can take place at the same time that the electrodes are replaced as a
function of normal nursing protocol.
5
As per US FDA’s requirements, please take note of the following graph comparing PhysioFlow
cardiac output readings to Thermodilution cardiac output readings. It shows that 82% of readings
are within bounds (20% = margin of error of thermodilution).
K060387 PF CO vs. TD CO, (PF 4 of 4)
Manufacturer data
15/84 = 18% of data are outside bounds
12
PF CO (L/min)
10
8
6
4
2
0
0
2
4
6
8
10
12
TD CO (L/min)
Each PF reading was an average (avg.) of 4 consecutive readings, and each TD reading was an avg. of the best 3
of 4 readings, except that if the 2 extremes of the 4 TD readings were equidistant from the avg., the avg. of all 4
was used.
PF CO
Identity line
Upper bound
Lower bound
INDICATIONS
•
•
•
•
PhysioFlow can be used on adults or teenagers, at rest, during cycloergometric exercise, or
during walking exercise on a treadmill. PhysioFlow and accessories are made to be used in
strict compliance with instructions specified in this manual
PhysioFlow is to be operated with single use sensors, which should be changed daily.
PhysioFlow is a class I type BF device (European standards)
The patient cable circuit provides high level of insulation in case of grounding failure
COUNTER INDICATIONS
PhysioFlow must not be used on patients with pacemaker of “minute ventilation” type.
6
FUNCTIONS
PhysioFlow measures the following parameters:
•
•
•
•
•
Thoracic Fluid Index: Inverse of baseline impedance
Contractility Index: maximal rate of change of impedance waveform during systole
Heart Rate
Ventricular Ejection Time
Early Diastolic Function Ratio
PhysioFlow computes the following parameters:
•
•
•
•
•
•
Stroke Volume/Index
Cardiac Output/Index
Systemic Vascular Resistance, Systemic Vascular Resistance Index (Systemic Vascular
Resistance multiplied by the body surface area).
Left Cardiac Work Index
Ejection Fraction
End Diastolic Volume
7
I. SOFTWARE INSTALLATION / REMOVAL
Software Installation:
Switch on your PC, wait until MS-Windows® has booted.
Insert the PhysioFlow software installation CD-ROM
Double-click on “My computer” then on the icon representing the CD-ROM player.
Display the content of this drive and double-click on the installation program icon named
“setup_US.exe”.
Installation starts. Follow every step of the installation procedure, clicking on the “next” and
“install” button when appropriate. It is recommended that you use the default installation
settings. Software is loaded in the C:\PhysioFlow newly created folder; by clicking on browse, it
is possible to select another destination folder to install the software.
When the software is loaded and you wish to start PhysioFlow, please select “launch PhysioFlow
(English release)”, otherwise disable it. Whatever the case, press “Finish” in order to complete
the procedure.
8
Software Removal:
To remove the PhysioFlow software click on “Start” (tool bar on the bottom of the screen).
Select “Control Panel”, and then “Add/Remove software”, select PhysioFlow 1.06uk, click on
the “Uninstall” button and follow instructions.
9
II. SUBJECT SETUP
1.) Subject Setup:
To ensure a stable signal and proper data acquisition during an exercise test, it’s critical that the electrodes
and Physioflow probes be setup and configured correctly. Follow these steps when setting up a subject
(refer to the diagram below):
a. Shave the areas required for probe placement (as seen above) if need be with a
disposable surgical razor.
b. Clean off the sites with an alcohol prep pad and dry with a paper towel. Then rub
the skin with Neuprep abrasive gel using gauze. Remove the excess gel when
done. Skin color must turn bright pink.
c. Apply the electrodes (6 in total) to the proper locations on the left side of the
subject’s neck (white and blue), the middle of the sternum (red), the rib closest to
V6 (orange), and along the center of the spine. These two last electrodes can be
placed on the xiphoïd process (green lead), and laterally on the rib (black lead) as
well, but stability under exercise conditions is less optimal.
d. IMPORTANT: Please use Skintact FS50 or FS-TB electrodes only. Any other
electrode will decrease the signal/noise ratio and impair the performance of the
device. IMPORTANT: Please make sure the electrodes are in good condition
(expiration date, electrode bag not opened for more than a few days).
e. When applying the electrodes, ensure that the gel pad in the center of the
electrodes contacts the skin before the rest of the electrode. Do this by lifting up
the sides of the electrode while placing the gel pad in the center flush against the
10
skin. Then firmly push down on the sides of the electrode making sure no air
pockets exist between the skin and the electrode.
f. Depending on the size and structure of the patient, electrode positioning may need
to be adjusted as follows: When measuring a tall, skinny subject or patient, the V1
sternal manubrium (sternum) electrode (red with Lab 1- 1 of 2 electrodes
responsible for the ECG signal) needs to be placed on the same level as the heart,
which tends to be on the upper half of the sternum. When measusing a shorter,
heavier subject or patient, the sternum electrode may need to be moved down to
the bottom half of the sternum. The goal is to have the sternum electrode on the
same level as the heart segment with the largest diameter. In general, taller
individuals tend to have more vertically aligned hearts, while the hearts of shorter
subjects tend to rest on a more horizontally tilted axis. CAUTION: in case of a
wide QRS (LBBB or pacemaker), please place the mid sternum electrode (V1) on
the rib opposite side of the V6 electrode (to create a horizontal line between the
two)
The neck electrodes (white and blue) must be positioned so that they do not
overlap and so that they both fit on the neck rather than one on the collar bone.
Best placement is achieved on the lateral triangle of the neck. These electrodes
have the greatest tendency to fall off due to their location near a high density of
sweat glands and the higher probability of subject movement in that area.
The V6 electrode (orange) must be placed on the rib bone closest to the left
ventricle for a proper ECG signal.
The spinal electrodes (green and black) must be placed on the midpoint of the
spine. To ensure proper placement have the subject stand or sit up straight and
visualize the point on the spine corresponding to the same vertical position as the
xiphoïd process on the front (middle to end of the sternum).
g. After all electrodes have been properly placed on the subject, apply a small
amount of conducting gel to the metal tops of the electrodes, especially in case an
exercise test is performed. KY jelly can be used for this purpose. This additional
gel enhances signal conductance and stability throughout the duration of the test.
h. Connect the appropriately colored Physioflow probes on the patient cable to the
electrodes on the subject. A clicking noise indicates that the two have been
connected correctly.
i. In case of an exercise test, have the subject put on a Spandage shirt over their torso
to ensure that the Physioflow probes and cable do not interfere with the subject’s
movement and ability to exercise. The greatest amount of stability is achieved by
placing the large rectangular center piece of the cable on the subject’s right
11
shoulder. Have the subject also place a smaller cut out piece of Spandage or 3M
Coban wrap around their neck to secure the stability of the neck electrodes and
probes. Alternatively, 3M Transpore tape can be use to solidify the probe cables
on the skin (like when an ECG holter is used), but this does not ensure maximal
stability during exercise, especially on a treadmill.
j. Make sure that none of the probe cables run over any of the electrodes. Overlap
can interfere with the Physioflow signal. Ensure that the subject’s mobility is
maintained by having them rotate their torso left and right. Adjust the probe
cables as necessary if extra slack is needed or if the cables need to be repositioned.
k. If need be, gauze pads can be inserted in between the Physioflow probes and the
Spandage shirt to further increase probe stability.
12
II. CONNECTIONS
Connect PhysioFlow to the mains (CAUTION: A grounded plug is mandatory).
Connect PhysioFlow to the serial port of your computer, using the specific serial RS232 cable or
USB to serial port converter whichever is available.
Connect patient cable on PhysioFlow front panel.
Connect patient, using pre-gelled PhysioFlow electrodes
When ready, start the PhysioFlow program, either using the "Start" function of MS Windows®, or
double clicking on the corresponding icon (if you have created it).
During first use of the program, you will be prompted to type the name of hospital and doctor
who use the system
Acquisition screen appears. Click on the “start a new recording”.
The system asks you whether the patient has been recorded before or if it is a new patient. If the
patient has been measured before, please select from the list.
Introduce patient identification: first name, last name, age or date of birth, height, weight and sex.
13
You can also click on “Find” to select a patient you have already measured (modifications of
parameters, for instance weight, are allowed).
Please select the appropriate measurement condition (Manual input of BP value or interface with
BP monitor (If activated in the “Options” menu, see below), natural ventilation or mechanical
ventilation, exercise test or patient at rest.
You can fill optional fields in the “Optional Parameters” section. You can go from a field to
another field using the TAB key.
Click on “OK” when ready.
14
III. CALIBRATION
Please carefully read the calibration instructions on the Calibration Wizard screen. Calibration is
particularly important-reliability and reproducibility of the system depends on it. It is
performed on 30 heart beats, with best possible signal stability.
At this stage, the system informs you if the connection with the PhysioFlow is OK. If not, please
check if the device is switched on, if the serial cable is connected, and if the PhysioFlow is
connected to the suitable port (see the “Options” section below).
Please “proceed to signal preview” by clicking on the appropriate button when ready.
It is necessary to proceed to simultaneous blood pressure measurement, using manual or
automatic blood pressure monitor, in order to obtain blood pressure reference values (they are
used as a reference cardiac output computation and for blood pressure profile calculation during
exercise).
ECG and impedance signals are displayed on the screen at the start of this phase. Before
proceeding to calibration, make sure that signals are reproducible, stable, and without artifacts or
interference.
15
A signal stability sensor is present at the bottom of the screen. The more squares that are
displayed the better it is (8 squares ideally). When stability is borderline, squares turn to yellow,
and when signal stability is unacceptable, squares are displayed in red color. IMPORTANT: If
during the monitoring phase signal stability is not acceptable, corresponding trends will be
grayed.
IMPORTANT: the operator should check that heart rate results appear beat by beat on the
dE/dt signal (light blue digits, dark blue signal). Similarly, please verify that fiducial points
of the dZ/dt (green) signal are correctly detected (the presence of red and yellow squares on
the signal are necessary). The yellow square must not appear at the end of the heart cycle.
If the signal analysis and quality are questionable, the operator should try another
derivation for the ECG (red electrode on the right shoulder and orange electrode on the left
hip, for example), and for the impedance (horizontally move the pair of electrodes situated
at the base of the thorax (green and black)).
IMPORTANT:
It is essential that the operator understands the difference between acceptable and
unacceptable signals!
ACCEPTABLE SIGNAL
QRS should be properly detected (light blue lines), and heart rate displayed with every heart beat.
Colored squares on the dZ/dt signal (red to yellow) should draw a curve oriented downwards (during systolic phase)
EXAMPLE I
EXAMPLE II
EXAMPLE III
16
POOR SIGNAL
EXAMPLE I:
EXAMPLE II:
No systolic curve during dZ/dt
squares are not regularly plotted
Artifact on dZ/dt curve,
occurring simultaneously to the QRS
SOLUTION I:
SOLUTION II:
Shave and clean the skin,
replace impedance electrodes,
Reposition impedance electrodes
(on the same horizontal level).
Shave and clean the skin,
replace impedance electrodes,
Reposition impedance electrodes
(on the same horizontal level).
EXAMPLE III:
EXAMPLE IV:
Electrical interference
A majority of QRS are no properly
detected and heart rate is wrong;
Often occurs in case of bundle branch
block or pacemaker patients
(QRS large and of reduced dynamic).
Static electricity on ECG and/or impedance
:
SOLUTION III: If it permitted by law, turn off the
source of static electricity.
(Blood ultra filtration systems using
rotating pumps generate static electricity trough
the plastic tubes connected to the patient. These currents
cross the patient thorax and return to the PhysioFlow
through the patient leads).
SOLUTION IV: Increase ECG sensitivity
(see Signal Setup on the tools bar)
Drop the red (ECG1) electrode at the level of the
orange (ECG2), on the other side of the thorax.
17
Clicking on the question mark button leads to a section where similar information is given
SIGNAL SETUP
This icon allows adjustment of signal settings.
Threshold is to be increased using the cursor when T wave is high and a double counting of heart
rate is seen on display.
Threshold is to be decreased using the cursor when QRS amplitude is variable.
Sample averaging and dECG/dt averaging should be decreased in case of low ECG dynamic (low
QRS, for instance in case of left bundle branch block); clicking on “ECG sensitivity increase”
does it automatically.
“Default parameters” allows returning to normal settings after a change.
All changes can be seen in real time on the signals beneath the pop-up screen.
When signal is acceptable, then click on “Calibration” to proceed.
18
Blood pressure measurement should be taken just prior to or in synchrony with the calibration
phase. Wait until calibration is finished (30 heartbeats) and then type in systolic and diastolic
blood pressure when prompted by the software.
IT IS ESSENTIAL THAT BLOOD PRESSURE READINGS ARE TAKEN AS
ACCURATELY AS POSSIBLE CONSIDERING THE MEASUREMENT CODITIONS.
THESE READINGS MUST BE TAKEN AT A TIME THAT IS SYNCHRONIZED WITH
THE CALIBRATION PHASE AS MUCH AS POSSIBLE.
These readings are automatically retrieved form the blood pressure monitor if one is interfaced.
Modify default CVP and WP parameters if available (for a more accurate computation of SVRi,
and LCWi).
When finished, click on “Validate”.
You may verify Calibration results, and click on “start monitoring” if they are correct.
Monitoring starts.
Please note: The basis of the upper/lower limits of the calibration parameters are derived from a
normal healthy supine patient at rest. Parameters that exceed the normals will be shown in red;
those within the limits will be shown in green. If the calibration looks questionable or numbers
fail to appear in the boxes (poor signal quality, aberrant values) you can start the calibration cycle
again by clicking on “Retry”.
19
IV. MONITORING
Monitoring screen appears: (HR=Heart Rate, SV= Stroke Volume, CO CI= Cardiac Output/Index
(cardiac index is cardiac output divided by the body surface area).
By using the “Parameters” menu on the Tool Bar, you can select or deselect parameters you want
to display on screen.
By clicking on the magnifying lens you can display the corresponding parameter on the full
screen.
20
Clicking on the hemodynamic cross button on the tools activates the corresponding screen.
Left Cardiac Work Index is plotted against Systemic Vascular Resistance Index. Normal values
at rest are displayed in the central area (green square). Yellow and red squares display two and
three standard deviations from normal. Every small green cross represents one measurement
(they are displayed in red if the corresponding measurement has been marked, see below). By
pointing on a cross the operator can display the corresponding values, elapsed time, and time.
By Clicking on the “Ellipse” button, measurements are displayed as an ellipse centered in the
middle of the group of all measurements, with one standard deviation distance from that center
point. This allows a better visual focusing of measurements-if a number of them are displayed.
21
During the monitoring phase, you have the ability to mark events. When you wish to indicate an
event, press the SPACEBAR. A window appears and asks you for the text; type comments if
desired, then Click OK or press “enter” to validate. Then this event will appear as a vertical line
on the screen.
On this same window, a “Blood Pressure” button appears if you have selected the manual input
of blood pressure option. This button allows the operator to enter blood pressure parameters
manually during measurements (same interface as during the calibration phase).
On this same window, a “Break/Resume” button allows the operator to suspend computation of
parameters without stopping the measurement in progress, and with no need of re-calibration. To
begin monitoring again, simply hit the “Resume” button.
Click on “End of Acquisition” if you want to stop acquisition, and confirm with “OK” when
prompted.
22
V. REVIEWING ACQUISITION
Acquisition review can be performed at two stages: immediately after the monitoring is
completed (in that case screen freezes and displays trends), or at any other time by clicking on the
following button:
Patients are displayed in alphabetical order by the last name or a patient ID number, and every
measurement for each individual patient is displayed in chronological order.
The operator can open a recording by double clicking on the corresponding line, or selecting a
line and clicking on the “open button” below. The “compare” button may be used when a
recording is already displayed, and when another recording has to be displayed simultaneously.
Several functions can be activated.
-
Selecting another directory where patients are recorded :
At this stage, a new folder can be created by clicking on the corresponding button.
- Patients can be displayed in alphabetical or chronological order:
A second click on the same button displays the list in reversed order.
23
- Searching for a patient in the database:
Patients can be found using keywords corresponding to the name, ID code, comment, or by date.
- Copy and delete functions allow managing patient files accordingly:
Please select patient or recording you want to copy or delete in the list. Then click on the
corresponding button and confirm. To copy, you have to define a target directory and/or driver
when asked by the system
Copy function: the system asks if you wish to copy the raw signal too. The raw signal is the
largest file, and may take some space in your target memory.
- Please click on exit if you wish to cancel patient database management:
24
Recordings can be displayed in several ways. Trends constitute the default screen when a patient
measurement is opened. The hemodynamic cross (as described above), calibration results, and a
table of measurements can also be displayed.
Trends: During the acquisition phase, default parameters are displayed on the screens. It is
possible to call additional parameters using the parameters menu (see section). It is also possible
to display one parameter full screen using the magnifying lens (see section). Clicking on one
point of any parameters waveform displays the corresponding numerical values of each
parameter displayed and the elapsed time
Double clicking on the time scale below each parameter converts the elapsed time into the
real time.
The magnifying lens nearby the chronometer allows zooming on the trends displayed; then
arrows appear to help navigation between the trends sections.
By clicking on the magnifying lens with a “-” full size trends are displayed again.
25
Scrolling on a section of the trend allows computing the average value of that section of the
trend and the slope of the curve.
It is possible to display two trends for two recordings on the same screen by using the
“compare” option in the patient explorer (see corresponding section)
-
Hemodynamic cross
It looks very similar to the one displayed during monitoring, however, there are two additional
features:
The “face” button allows displaying all ellipses corresponding to several recordings made on a
same patient; this helps in tracking changes for the patient.
The “clock” button displays the small crosses corresponding to every individual measurement in
dynamic and chronological order; this helps to track changes within the same recording session.
It is possible to display two hemodynamic crosses for two recordings on the same screen,
using the “compare” option in the patient explorer (see above). The individual measurements
are displayed in blue crosses for the most ancient recording, and green for the most recent
recording.
-
Calibration Measurements: The “Calibration Measurements” item in the “Analysis” menu
opens a window displaying calibration results. Results are listed together with the range of
measurements considered normal for an adult at rest in supine position; abnormal readings are
highlighted with a star.
26
By using the “compare” option in the patient explorer, it is possible to display two calibration
measurements for two recordings on the same screen (see above).
-
Table of Measurements: The “Table of Measurements” item in the “Analysis” menu opens a
window displaying table of measurements corresponding to elapsed time and time, together
with the description of event markers and a “Q” column containing information about signal
quality (artifacts, etc.). Please note that the table is divided in two parts that can be displayed
using the thumbnail “Main Measurements” and “Other Measurements”.
By using the “compare” option in the patient explorer, it is possible to display two tables of
measurements for two recordings on the same screen (see above).
27
VI. EXPORT FUNCTION
Table of measurements can be exported into MS-Excel spreadsheets or text (*.txt) files for those
users who do not wish to use MS-Excel, or if MS-Excel is not installed on your computer.
Direct export to MS-Excel
Conversion into text files
Please note that if export into MS-Excel files is direct (if Excel is installed on your computer, a
new file is automatically created by opened the Excel program). If you wish, conversion into text
files is a procedure comprising three steps:
1) Giving a name to the file
2) Selecting a target folder
3) Confirmation
28
VII. EDITION OF PRINTOUTS
You can print a report using the “print” button.
A pop-up window appears, giving the possibility to type or modify a comment if needed.
Print Previews are displayed, three pages can be seen: Calibration Results, Hemodynamic Cross,
Trends, and Tables of Measurements (if selected using the
button).
29
A window appears and asks how many copies you want to print, as well as the number of the
pages that you want to print.
It is possible to edit screen copies during monitoring simply by clicking on the print-screen key
on your keyboard (provided that a printer is connected and switched on).
30
VII. EXIT
You can exit PhysioFlow software by clicking on the exit icon (upper right side, on the
Tool Bar).
Then confirmation is requested:
Thank you for using PhysioFlow!
31
IX. ADVANCED FEATURES
PROFILES
Every user of the PhysioFlow can define some functions according to his work preferences;
PhysioFlow is flexible and can be used by numerous people.
For selecting a profile, you must click on the corresponding icon:
.
Only one default profile is available at first installation of the software.
For creating or modifying a profile, you must click on the “options” button on the Tool Bar.
Then go to the bottom of the page. The following menu is available:
Editing a profile means displaying a previously recorded profile. The following items can be
modified: default profile or not, duration of calibration (number of heart beats) and averaging
over several heart beats or several seconds.
Clicking on “Add” a profile displays a very similar page, but the name of the new profile has to
be introduced.
32
OVERALL SETUP
By clicking on the “options”, you can modify some settings:
Management of Interfaces: You can select another COM port as an incoming serial link if COM1
is already used by another system (for instance, if you plan to use a USB/Serial converter to
connect PhysioFlow, please refer to the user manual of the manufacturer).
PhysioFlow can be interfaced with automatic BP monitors, allowing automatic importation of
blood pressure measurement. The compatible monitors are the Colin Pressmate BP8800C (or
BP8800) (oscillometric measurement using cuff), Colin CBM 7000 (continuous measurement
using arterial tonometry), and Suntech Tango (specifically designed for exercise testing).
PhysioFlow can be interfaced with the Central Monitoring Systems from HP/Agilent/Philips
through a specific module called Viewlink. Please contact us for more details.
It is necessary to configure the software to establish the communication between two units. First
tick in the box “Interfaced devices”, then select the desired COM port (which can not be identical
to the PhysioFlow), then click on “Parameters”. A list of possible interfaced systems is provided,
please select yours and confirm.
33
Parameters of Display: You can modify display properties (for instance colors associated with
parameters or their range for displaying purposes in resting and exercising mode). It allows user
to select default parameters to be displayed on calibration, acquisition, and review screens.
Directories:
You may change the directories used for the PhysioFlow software and recorded patients. We
recommend modifying only the latter if at all. Please make a right click on the line, then a left
click on “Modify”, and select a new target directory, or create a new one.
Please do not try to modify other settings without first contacting our after sale service
department.
34
X. MAINTENANCE AND STORAGE
MAINTENANCE
There are no parts in PhysioFlow which are serviceable by the customer or user of the device,
and no parts have to be changed under normal wear and tear conditions.
If the system does not work properly, please refer to the troubleshooting section. If the problem
remains, please contact your authorized dealer, the customer support (215-826-9998
within
the USA or +33 1 43 87 88 13 outside the USA) or [email protected].
STORAGE
When not in use, the PhysioFlow must be stored at an ambient temperature (between 0°F and
+100°F, humidity below 70 %).
35
APPENDIX A: SUMMARY TABLE OF MENUS
‘File’ menu:
Start a new measurement: to begin a new acquisition.
Open Recording: to load an old acquisition.
Close: close displayed trends.
Send to Excel: save values as .xls format.
Export: save values as .txt format.
Page Setup: to modify margins, header,
footer of pages.
Print Preview: displays printouts as they will be printed.
Printer Setup: displays the configuration printer board.
Print: prints the report.
Exit: exit of the PhysioFlow software.
Parameters’ menu:
Visible signals:
ECG
: ECG signal.
Z
: impedance signal.
dECG/dt
: ECG signal first mathematical derivative.
dZ/dt
: impedance signal first mathematical derivative.
d²ECG/d²t
: ECG signal second mathematical derivative.
d²Z/d²t
: impedance signal second mathematical derivative.
Visible data:
HR
: heart rate (bpm)
SV
: stroke volume (ml)
CO
: cardiac output (l/min.)
CI
: cardiac index (l/min./m²)
CTI : contractility index (no unit)
VET : estimate of ventricular ejection time (ms)
EF
: estimate of ejection fraction (%)
EDV : estimate of end diastolic volume (in ml)
SAP : systolic arterial pressure (mmHg)
DAP : diastolic arterial pressure (mmHg)
MAP : mean arterial pressure (mmHg)
SVRi : systemic vascular resistance index (d.s.cm-5.m²)
SVR : systemic vascular resistance
LCWi : left cardiac work index (kg.m/m²)
TFI : thoracic fluid index (no unit)
EDFR : early diastolic function ratio (%)
36
‘Analysis’ menu:
Patient ID and measurement conditions: Displays patient information as they were typed by the
operator
Calibration measurements:
Displays data measured during calibration phase.
Hemodynamic Cross:
Displays the hemodynamic cross diagram.
Table of Measurements:
Displays the table of measurements
Patient Explorer:
Opens the patient explorer
‘Configuration’ menu:
Signal Setup:
Allows the user to adjust the parameters of the detection of the QRS on the
dE/dt signal. This is useful in cases of large T waves (risk of a double
counting and/or of a variable amplitude of signal).
ECG’s averaging, the number of points used for the calculation of
dE/dt and the detection’s threshold (most important parameters).
The detection threshold should be increased in the case of a big T wave observed on dE/dt (if the
wave T is taller than the QRS, the operator should completely change the derivation of ECG
derivation).
On the contrary, if QRS has an irregular amplitude, you must decrease the threshold to assure
none of the QRS complexes escape detection. These regulations could be made in real time and
their effects are immediately visible on the signal.
The button (‘ECG sensitivity increase’) increases the dE/dt’s dynamic and decreases the
threshold. The button ‘Default parameters’ allows the user to return to the parameters by default.
37
Enable/Disable Signal Quality Alarms: Allows activation or disabling of the alarms (pop-up
windows when signal stability if poor).
Options: To modify configuration of the software
About: Information about software version
‘Window’ menu:
Tools Bar
: view/mask the tools bar.
Messages Bar : view/mask the message bar.
38
APPENDIX B: Tools bar
Start a new recording.
Patients explorer
Closes a displayed recording
Direct export to MS-Excel
Conversion into text files
Hemodynamic cross.
Allow selecting a profile.
Options
Enable / disable signal quality alarms.
Signal setup.
Exit the application
Signal Stability gauge.
Allows assessing signal stability (green = good signals, yellow = average, red = poor)
39
40
41