1
A USER'S MANUAL FdR
(Version 4.0 for MS-Windows)
A Decision Support Model for Prefeasibility Analysis of
WATER AND WASTEWATER TREATMENT
TECHNOLOGIES APPROPRIATE FOR REUSE
JZibraiy
IRC International Water
and Sanitation Centre
Tel.: +31 70 30 669 80
Fax: ) 31 70 35 899 64
Developed and Programmed by
Brad A. Finney, Ph.D. and Robert A. Gearheart, Ph.D.
Professors of Engineering
Assisted by
James Howell, M.S.
Sophie Lagace, M.S.
Mercy Lawson-Doe, M.S.
Tap ley Jordan, M.S.
Gregory Cross, M.S.
\
Environmental Resources Engineering
Humboldt State University
Arcata, CA 95521
For the
Environmental Health Project
Which is operated by
Camp Dresser & McKee International Inc. and
Associates
and sponsored by
The U.S. Agency for International Development
July 1998
11
TABLE OF CONTENTS
Table of Contents
ii
List of Figures
List of Tables
1.0
.
«.«....
iv
.„
«
iv
Introduction
1
1.1 PURPOSE OF THE WAWTTAR PROGRAM
1.1.1 Critical Factors
1.1.2 WAWTTAR Objectives
1.2
1.3
2.0
.
1
/
1
RANGE OF APPLICATION
THE ON-SITE PERI-URBAN CHALLENGE....
2
3
Introduction to the Program
2.1
2.2
HARDWARE/SOFTWARE
INSTALLATION..
OVERVIEW OF WAWTTAR OPERATION
LIMITATIONS OF THE PROGRAM
2.3
2.4
3.0
6
Getting Started
3.1
3.2
3.3
6
6
7
8
.
...
9
OPEN THE PROGRAM
EDIT FILES
COMMUNITY DATA
9
9
11
5.S.I Introduction
3.3.2 General Tab Questions (1-7)
3.3.3 Demographic Tab Questions (8-16)
3.3.4Resource Tab Questions (17-26)
3.3.5 Hydro/Met Tab Questions (27-33)
3.3.6 Financial Tab Questions (34-42)
3.3.7On-Site Tab Questions (43-53)
3.4
U
14
15
16
20
23
25
TRAIN DESCRIPTIONS
27
3.4.1 Introduction
3.4.2 Operation
3.5
3.6
4.0
STANDARDS
COLLECTION SYSTEM DATA
Getting Results
4.1
4.2
4.3
4.4
4.5
5.0
27
28
CALCULATIONS
"TRACK PARAMETERS" OPTION
"INCLUDE/EXCLUDE PROCESSES" OPTION
"INCLUDE TRAINS" OPTION
"Go" COMMANDS
Displaying Results
31
33
............
35
35
35
36
36
37
40
Ill
5.1
5.2
5.3
6.0
INFEASIBLE SOLUTION FILE
FEASIBLE SOLUTION FILE
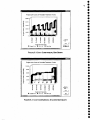
FEASIBLE SOLUTION GRAPHS
40
40
40
Interpretation and Editing of Results
6.1
6.2
7.0
42
TRAIN DATA
OTHER FACTORS TO CONSIDER
42
42
6.2.1 Land Requirement Significance
6.2.2 Specialized Operation and Maintenance Requirement
6.2.3 Solids Production
6.2.4 High Electrical Requirements
42
43
43
43
Treatment Process Data................
45
7.1
7.2
7.3
.
OVERVIEW OF PROCESS DATA
CREATING NEW PROCESSES
PROCESS PROFILE
7.3.1 General Tab Questions (1-7)
7.3.2 Construction Tab Questions (8-16)
7.3.3 Operation and Maintenance Tab Questions (17-37)
7.3.4Siting Tab Questions (38-45)
7.3.5 Impact Tab Questions (46-55)
7.3.6 On-Site/Miscellaneous Tab Questions (56-67)
Appendix A Water Reuse
A.I
A.2
A.3
A.4
A.5
OVERVIEW OF WATER REUSE
>
SPECIFIC CONSIDERATIONS GOVERNING REUSE
INDIRECT REUSE
DIRECT REUSE
ECONOMICS OF REUSE
Appendix B Delphi Process
45
46
47
47
48
52
57
55
59
61
61
62
62
63
63
64
B. 1 SYSTEM COMPARISON SPREADSHEET
64
B.2 DESCRIPTION OF WORKSHEETS
64
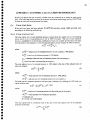
Appendix C Economic Calculation Methodology
66
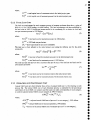
C.I TOTAL COST BASIS
C.I.I
TOTAL CAPITAL COST
C.1.2
TOTAL LAND COST
C.1.3
OPERATIONS AND MAINTENANCE COST
C.1.4
TOTAL PROJECT COST
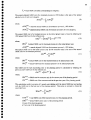
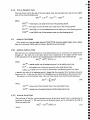
C.2 ANNUAL COST BASIS
66
66
67
67
69
69
C.2.1
C.2.2
C.2.3
C.2.4
69
69
70
70
ANNUAL CAPITAL COST
ANNUAL LAND COST
ANNUAL OPERATIONS AND MAINTENANCE COST
TOTAL PROJECT COST
IV
LIST OF FIGURES
FIGURE l .1 THE TREATMENT - REUSE CYCLE
FIGURE 2.1 WAWTTAR INPUTS AND OUTPUTS
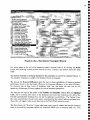
FIGURE 3.1 OPENING WINDOW WITH PULLDOWN MENU
FIGURE 3.2 GRAPHIC OVERVIEW OF PROGRAM CALCULATIONS
FIGURE 3.3 COMMUNITY DATA OPENING WINDOW
FIGURE 3.4 TYPICAL COMMUNITY TAB WINDOW - COMMUNITY RESOURCES
FIGURE 3.5 TRAIN DESCRIPTION INITIAL WINDOW
FIGURE 3.6 TRAIN DESCRIPTION SECOND WINDOW
FIGURE 3.7 EDITING STANDARDS
FIGURE 3.8 EDITING THE COLLECTION SYSTEM DATA
FIGURE 4.1 TRACK PARAMETERS WINDOW
FIGURE 4.2 INCLUDE/EXCLUDE PROCESSES
FIGURE 4.3 INCLUDE TRAIN
FIGURE 4.4 Go-WASTEWATER TREATMENT WINDOW
FIGURE 5.1 COST COMPARISON, BAR GRAPH
FIGURE 5.2 COST COMPARISON, STACKED BAR GRAPH
FIGURE 7.1 PROCESS SELECTION SCREEN
FIGURE 7.2 PROCESS PROFILE: GENERAL QUESTIONS SCREEN
FIGURE 7.3 PROCESS PROFILE: CONSTRUCTION MATERIALS SCREEN
5
7
9
10
12
13
28
31
32
34
35
36
37
38
41
41
46
47
49
LIST OF TABLES
TABLE 3.1 PROCESS TYPES (WATER, WASTEWATER, AND ON-SITE)
TABLE 3.2 WATER QUALITY PARAMETERS
30
33
1.0
1.1
INTRODUCTION
PURPOSE OF THE WAWTTAR PROGRAM
1.1.1 Critical Factors
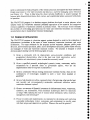
The WAWTTAR program was designed to assist financiers, engineers, planners, and decisionmakers in improving their strategies for sustainable water and sanitation coverage while
minimizing impacts on water resources (Figure 1.1). The history to date in these areas is laden
with failures of infrastructure investments. Fatal flaws in past activities by non-government
organizations (NGO), bi-lateral, multilateral, and local governments fall into several categories.
The most common failure mode is system failure due to lack of ability/capability to ensure
ongoing operation and maintenance. Many factors lead to these conditions. The most critical
factor is the inappropriateness of the technology. This most often is seen in examples where
donors are exploiting their national business interests by tying aid to a particular technology.
Willingness to pay for capital and Operation and Maintenance (O&M) cost is another essential
factor in these fatal flaws. The inappropriateness and lack of willingness to pay are not
necessarily mutually exclusive factors. Although dispersed populations are among the group
which is in great need, actions to alleviate the situation could be made more effective if they were
concentrated on groups such as nucleated units or small to medium size communities.
There is a need to differentiate between that which is nucleated and that which is not, as concepts
of community differ, particularly among professions (such as engineers, ecologists, sociologists,
health workers, or economists). It is proposed here that a nucleated settlement begins at or
above that population concentration level where there exists a physical water system and an
associated managerial system. In general, the management system in a nucleated settlement will
no longer be a volunteer operation, and this breakpoint occurs at a population of about 300 or
more. At a higher population level of about 3,000 persons, piped water becomes cheaper than
unpiped water. Piped water requires a distribution system and a higher level of technology than
does a system of unpiped water. Population density is a significant factor in determining the
cost of a piped water system and a wastewater collection system
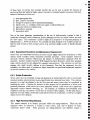
1.1.2 WAWTTAR Objectives
This program focuses on the concept that when equipment or technology is supplied, it should be
only after a means of supply for repair parts and operational and maintenance resources are
known to be available. This includes having trained and equipped operators to insure that the
environmental and monetary investments are protected. Many existing facilities are in bad
conditions due to poor selection of technology, inappropriate design, insufficient maintenance
(including preventive maintenance), lack of spare parts, and a lack of trained personnel. Locally
obtainable materials should be utilized whenever possible and maintenance of equipment should
be manageable by local people.
Involvement of the target population from the beginning of a water supply and wastewater
treatment project is important. Sometimes much persuasion and education are necessary to get
people to use safe water and to realize the value of treated wastewater. Local decision-makers
need to understand the basic principles of the various processes and support the ideas introduced.
People must leam to view water treatment and reuse as a cycle for managing scarce resources
(see Figure 1.1). Ways to help bring this about includes handbooks in simple language for
laymen, pilot demonstration plants, short courses, and experimental plants connected with plants
in operation.
The WAWTTAR program is a decision support platform developed to assist planners select
suitable water and wastewater treatment processes appropriate to the material and manpower
resource capabilities of particular countries at particular times. The technique should eliminate
the problem of overlooking good processes for water and wastewater treatment and minimize
system failures due to inappropriate treatment technologies.
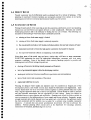
1.2 RANGE OF APPLICATION
The WAWTTAR program is a decision support system designed to assist in the evaluation of
infrastructure investments in the areas of water treatment, wastewater treatment, and water
reclamation. The target audiences for the program include engineers, planners, public works
directors, environmental specialists, public sector development specialists, public health officials,
and managers of water and wastewater treatment systems. The program is designed to assist
decision-makers dealing with the following types of issues.
1) Given a community with its characteristic socio-economic conditions, and
geographical characteristics, what is the least cost (total construction and/or
operation and maintenance) system to meet the community needs?
2) Given a specified potential technological system/s (water, wastewater, and/or
reclamation) by a potential donor or government agency, what are the
implementation risks to long-term sustainability?
3) Given a community with an existing wastewater treatment facility, what are the
combinations of technologies available to meet a water reuse standard or
guideline?
4) Given a high-density peri-urban community that is fast growing, what are the least
cost (socially and environmentally) sustainable wastewater collection and/or
wastewater treatment options?
5) Given a set amount of financial investment in infrastructure (water, wastewater,
sanitation, and reclamation), which treatment technologies allow for maximum
coverage while reducing the risk of system failure (resources, labor, materials,
management, and technology)?
6) Private investors and manufacturers are interested in developing and marketing
sustainable technologies (water, wastewater, and reclamation) in specific areas
with their unique and characteristic profiles. Where is the need the greatest?
7) A regulatory and/or water reclamation agency is interested in identifying the
potential BMPs (Best Management Practice). Which technologies currently
available can meet new or different water quality standards and water reclamation
standards? This would include estimating the cost, for example, of meeting new
standards.
8) A research and development group (either private or governmental) is interested
in investing in the research and development for a needed technology in water
treatment, wastewater treatment, and/or water reuse. Where are the treatment
gaps with existing processes?
9) An organization, agency, or profession is interested in sensitizing their human
resources to the issues of sustainable solutions in the water, sanitation,
wastewater, and/or reuse sector.
1.3
THE ON-SITE PERI-URBAN CHALLENGE
Removing and safely disposing of excreta and wastewater is a critical environmental health need
for most cities in much of the world. Improper disposal and inadequate drainage of sewage and
wastewater leads to pools of polluted water which convey diseases including diarrhea, dysentery,
intestinal parasites, and provide breeding grounds for mosquitoes which spread filariasis,
malaria, and other diseases. The reuse of untreated wastewater in areas of water shortage is a
common irrigation practice fraught with health dangers for both farmers and consumers of farm
products. Cholera remains a constant threat.
In consideration of the critical shortage of clean water supplies, protection from pollution must
be given to surface and groundwater sources. Water reuse must be practiced where possible to
extend these supplies. Efficient treatment is needed to return the wastewater to a condition that
is acceptable for useful purposes, thus expanding the water resource base.
In the cities of many developing nations, access to adequate sanitation is available for most
residents in large urban centers although this varies considerably between countries. Large cities
typically have several sanitation systems in use with many residents in the affluent and
commercial sections connected to sewers and others to individual septic tanks. Many others,
especially in peri-urban zones, are without acceptable sanitation facilities. Wastewater treatment
facilities and approaches generally follow conventional designs although the extent of treatment
may vary considerably.
Outside of the large cities, there are hundreds of urban centers in developing nations with less
than 10,000 people. Each community will have its own particular set of environmental problems
which are influenced by such factors as the size and density of the population, the scale and
nature of the production base, climate, topography, water resources, and the type and distribution
of flora and fauna in and around the town. What appears as a particularly pressing problem in
one town may represent minor problems in other towns in that same country, while other nations
may have an entirely different set of problems.
For the smaller towns, there is more of an ad hoc approach to sanitation, resulting in inadequate
coverage and the use of inappropriate methods. Conventional treatment approaches are costly
and are difficult to sustain in small towns. USAID recognized this problem in the mid 70's and
produced a manual, "Appropriate Methods of Treating Water and Wastewater in Developing
Countries." The manual considered not only technical considerations but also economic and
institutional issues in choosing appropriate methods. However, the state of the art has advanced
in recent years and different economic and social conditions apply in many countries suggesting
the need for reevaluating the current situation. There are also advances in non-technical
approaches emphasizing pollution prevention through economic and policy means that need to be
considered.
There is a range of potential methods for treating wastewater. Each method has a unique set of
technical, economic, and institutional conditions which must be evaluated. The analysis and
decision process would be aided by an iterative approach of comparing the various possibilities.
There is currently no computer software designed for this purpose. The development of this
software and the input of current technical and economic data improves the selection process and
potentially expands sanitation coverage, water reuse, and sustainable water and wastewater
treatment systems to many areas in developed and developing countries. WAWTTAR and its
attendant database is an attempt to provide this capability.
FIGURE 1.1 THE TREATMENT - REUSE CYCLE
Water Source
•
Surface
•
Groundwater
Discharge
Sewage
Treatment
Train
On-Site
Sanitation
Reuse:
• Land application
• Forage crops
•
Aquaculrure
•
Compost Solids
Consumer
On-Site Water
Supply
Water
Treatment
Train
6
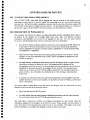
2.0 INTRODUCTION TO THE PROGRAM
This manual is intended to supply basic information about the operation of WAWTTAR. It
provides an overview of the information display and editing conventions that have been adopted
as well as the functions performed by each of the program's commands and dialogs. It is
assumed that the users of WAWTTAR will have some background in water and wastewater
treatment and planning. It is also assumed that users will be familiar with the MS-Windows
operating system, and have basic keyboard and mouse skills. This manual is not intended to be a
tutorial in either water or wastewater treatment or the MS-Windows system.
WAWTTAR's main use is as a tool for persons with some technical background to screen and
research possible water and wastewater treatment options. The program has been designed to
incorporate wastewater reuse as an equal criterion in the selection of feasible solutions. It also
assists in addressing a community's public health, water resource, and ecological condition.
WAWTTAR does not exclude conventional options and is of equal usefulness in the screening
and research of such options as well. WAWTTAR is a decision support tool intended to assist
planners in selecting suitable water and wastewater treatment options appropriate to the material
and manpower resources available to particular countries at particular times. It is hoped that
WAWTTAR will assist planners in improving sanitation coverage in rural and developing areas.
The performance and cost of a large number of possible systems can be estimated with
WAWTTAR for any location and condition for which basic information on the problem to be
solved is available. WAWTTAR should therefore alleviate the problem of overlooking good
processes for water and wastewater treatment, and help screen out treatment technologies which
are inappropriate for given locales and situations. The selection of inappropriate technologies
often results in facilities that perform poorly and fall into disrepair due to a lack of basic
resources such as spare parts, operations and maintenance personnel, and technical expertise.
Hopefully, design errors of this kind can be significantly reduced or eliminated via the use of
WAWTTAR by persons with some background in water and wastewater treatment issues.
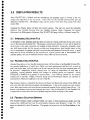
2.1 HARDWARE/SOFTWARE
WAWTTAR 4.0 requires an IBM-PC compatible computer running Microsoft Windows 95 or
later. 32 MB of RAM and a minimum graphics resolution of 800x600 with 256 colors are
required to run the program. Depending on your current computer configuration, between 30
and 40 megabytes of disk space is required to install WAWTTAR.
2.2 INSTALLATION
In addition to the install program, the WAWTTAR CD-ROM includes this users manual in the
file WAWTTAR Users Manual.pdf. This file can be viewed using the free Adobe Acrobat
reader. The latest version this program is available from the Adobe WWW site at
www.adobe.com. For your convenience, the Windows 95 and Windows NT version of this
program is located on the WAWTTAR CD-ROM, and can be installed by double clicking on the
file acroread.exe.
2.3
OVERVIEW OF WAWTTAR OPERATION
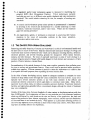
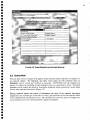
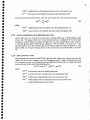
In the basic operation of WAWTTAR, basic problem parameters such as performance standards,
material costs, raw water or wastewater quality, community needs and capabilities, and planning
horizon are entered by the user into easily editable data fields (see Figure 2.1). The user can then
construct several possible treatment trains from a supplied, comprehensive list of available
treatment processes. WAWTTAR first screens these options by the needs, capabilities and
resources of the community in question, and discards those options that are infeasible (see Figure
3.1). WAWTTAR then calculates the performance, construction costs and operations and
maintenance costs of the remaining possible treatment systems based on simple mathematical
models of each of the treatment processes. The results of the initial screening and of the
calculations are sent to either a Feasible Solutions File or an Infeasible Solutions File based on
whether or not community needs, resource limitations and performance requirements are met.
Infeasible treatment systems can be analyzed for deficiencies caused by data entry errors or
improper assumptions concerning the community resources that are available to commit to this
project. These deficiencies can then be corrected and the cost and performance of the corrected
system can be calculated again. Feasible options can be compared based on performance and
annualized costs. In this way, WAWTTAR can assist in analyzing far more options more
accurately and completely than can be done with more conventional "rule of thumb" techniques.
An interactive prog
water ireatmeflt
pre-feasibility phase for i>eiep
ivastewater treatment and reuse systems
Piogram Attributes
M
!
• £ditnb c process data base contain ng coal, performance, and s o u r c e k&
/•equiremeir.s for awlste rang© of treatment processes.
^
• Editauie standardsidatajbase containz-g drinking water, W-VS-.QVJ^.^,
cischa'fje. ar.o reuse..standards and guidelines.
Edilaole ireaiiTrdiitii^pata Dase containing standard cjoiiiguralions of wa:er UPC w.:i?!©watefXtr'eatmcri: processes. Drccei-scs can be
arranged h as naany cprrtigjra;ions as excefs§|pe;-di$aies.
Edilabie cunnnunity data base aHows iM£;yrp#^p o|f de;
climate, and resource
ii&p^&
|
Program Output
• Treatment U'aw^Ms^ng res^li#mBits an
cost, :djffl'lf&t,. or
§:fiv0 wate.quality
:
^^i
Index
loteasible
FIGURE 2.1 WAWTTAR INPUTS AND OUTPUTS
2.4
LIMITATIONS OF THE PROGRAM
WAWTTAR is not a dynamic program and does not directly analyze the response of a given
system to variable influent conditions. WAWTTAR does not build the treatment trains to be
evaluated. The building of treatment trains must be done by a user familiar with these processes
and their general capabilities. Sensitivity to varying influent values must be explored by multiple
trials of treatment systems with different influent quality.
WAWTTAR is primarily intended for use on real world water and waste water treatment and
reuse problems, although it can be used for theoretical or academic problems as well. While
efforts have been made to provide accurate cost and performance data, the user should validate
the reasonableness of all construction cost, operational cost, and performance data for all
processes relative to the problem setting. The user is encouraged to add new processes to the
database and exchange this new data with other users and the WAWTTAR developers.
3.0 GETTING STARTED
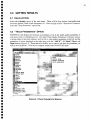
3.1 OPEN THE PROGRAM
If WAWTTAR is properly installed, a new Start Menu group titled WAWTTAR will appear. To
launch the program, simply select the WAWTTAR program from the WAWTTAR group in the
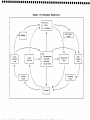
Start Menu. The program opens with two graphics, the title screen, and the screen illustrated in
Figure 2.1. After viewing each of these screens, you can move to the next screen by clicking the
mouse anywhere on the image. After the two graphics images have been displayed, the program
displays the main menu, a window entitled WAWTTAR with several pull-down menus (Figure
3.2). WAWTTAR operates exclusively through these pull-down menus and their associated
windows and dialog boxes. The graphic interface makes using WAWTTAR straightforward and
intuitive.
WAWTTAR
•gjle
Edit
Calculate
Display
preferences
Help
FIGURE 3.1 OPENING WINDOW WITH PULLDOWN MENU
3.2 EDIT FILES
When beginning work on a new problem, the Edit menu is the one to begin with. It leads to all of
the editable data tables that are used to describe the problem under consideration and the criteria
for the solution. Upon selecting Edit, you will be given a choice between five different data
tables: Collection System Data, Community Data, Process Data, Standards, and Train
Descriptions.
FIGURE 3.2 GRAPHIC OVERVIEW OF PROGRAM CALCULATIONS
Water supply,
wastewater treatment
trains, on-site process
requirements
Remaining
trains and
process
The Community
Profile:
Feasible trains
and process
The Appropriate Solution
Filter:
Needs
Capabilities
Resources
Reuse process requirements
Public health standards
Disposal standards
Plants/animals
Infeasible alternatives:
•
Inadequate local
geophysical hydro logical
setting
•
Inadequate construction or
O&M resources
•
Inadequate personnel
resources
F
Infeasible alternatives:
•
Violation of reuse technology
needs
•
Failure to meet public health
standards
•
Failure to meet ecological
standards
Prefeasibility
Assessment
Feasible alternatives:
User cost
Least total cost
Least O&M cost
Least capital cost
Adaptability '
Performance data
Minimum impact
11
Selecting any of these five data tables presents a dialog box with the same set of possible actions
accessed via buttons. The first button is entitled Edit. The Edit button opens the indicated table,
allowing the user to review the database for each of the categories and/or to add new data if the
data record is not locked. If a new record is to be created and is named, new information can be
placed in the data file. All existing processes in the Process, Collection System, and Standards
data tables are locked (read only) preventing the data from being changed. New data, updated, or
corrected data can easily be added by copying the record (process, collection system, or
standard), giving the copied item a new name, and then changing the data associated with the
copied data.
The second button to the right side of the selection window is entitled New. This allows one to
create a new record as mentioned above (be sure to give the file a unique name). The third
button is the Copy button and allows the user to quickly add or change data to an existing record
with a new name. The fourth button is the Delete button that allows the user to delete a record.
A warning window comes up to verify the delete action. The fifth button is a Print button which
allows the user to print the information associated with the selected item (the print mode is
strictly informational, not presentation quality).
After the database has been accessed, the Done button is selected which automatically saves any
changes made. Select Cancel to move back to the previous window master menu without saving
the last set of changes to the database.
3.3
COMMUNITY DATA
3.3.1 Introduction
The community profile questions are listed in Section 3.3.2 through 3.3.7. A short explanation,
description, data source, etc. is found after each question. Each section of questions is organized
under the various tabs found on the Community Data Window (see Figure 3-3). This data should
be gathered in collaborative manner with local planners and engineers. There will always be
concerns about the information requirements found in this profile. It is important to understand
how and when the data in the community profile is used in the decision support program. Some
of the data needs to be as exact as possible, while in other cases, rough data estimates are
sufficient.
The questions fall roughly into several categories: General (location), Demographic, Resources,
HydroMet (hydro-meteorological), Financial, and On-Site. The importance of the questions
concerning population, water demand or wastewater production, planning horizon, influent
characteristics, effluent standards and geological and hydrological conditions, should be known
to anyone with a background in water and wastewater treatment. Their discussion is beyond the
scope of this manual. Any standard text on water and wastewater treatment will have detailed
information for those who need or desire further elaboration on the importance of this
information.
Other categories are just as important, but frequently overlooked. The location and responsible
institutions, for instance, have a major impact on what technology is feasible to use. A complex
12
and highly technological treatment system may be a good option in terms of strict influent physical
characteristics and treatment requirements, but will likely fail in remote areas or where there is
little in the way of government support or training opportunities.
The availability and cost of resources can dramatically affect the feasibility of treatment and
reuse options in every project stage from construction to everyday operations and maintenance.
Resources in this case include the type and reliability of power supply, manpower from simple
unskilled labor to technical and professional personnel, treatment chemical availability, and any
other type of human or physical capital that might be necessary.
Finally, cultural factors of the community in question are of high importance but are infrequently
recognized. Cultural attitudes and norms regarding defecation, waste handling, gender relations,
preferred dwellings and family structure can affect everything from raw waste quality to what
kinds of technology are permissible. Failure to adequately characterize and account for these
factors in planning and design can result in the selection of inappropriate technology, and
ultimately in the failure of any treatment system, no matter how well designed from a physical and
technological standpoint.
jCommunity: La'ie
•••,-.'>•
•
•:n.
::
i''' : jv'./$jr^
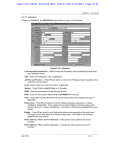
FIGURE 3.3 COMMUNITY DATA OPENING WINDOW
13
Once a new community is named or an existing community file is selected, the Edit Community
button is selected (Figure 3.3). This button opens a window which has six tabs arranged in the
upper left-hand corner. The six tabs have a total of 53 questions in the following categories
1) General, 2) Demographics, 3) Resources, 4) Hydro/Met, 5) Finances, and 6) On-site.
When the window opens, the General tab questions 1 through 7 are displayed. When selecting
the first question for example, Community name, a 40 character input slot opens in the answer
section of the window on the right side. All of the questions in the "General" category require
typing in input data. Some questions in the other categories require checking a box and or typing
in numbers. Once a question has been answered with new data, a green checkmark will appear
on the left side of the question. The green checkmark serves as an indication that this question
has been answered.
After responding to all of the questions in the "General" category, select the Demographics tab.
This group of nine questions (question 8 through 16) requires a good understanding of the
community, and how it works. Each community demographics question requires typing in a
response. After answering the "Demographics" questions, select the Resources tab. There are
10 "Resource" questions, numbered 17 through 26.
Community: La'ie
•The Q.uBstion;-v::^7:"-x-?i:
PleaSe-idfeeck (*
available in the
^sV^-:•,
::
••
* ':•/•
. ^•^.•S^?.^.^^T"W
# A t i § w S r s : •. •
17. CunstiuLtion equipment
1b. O/M equipment
:
v.
•
r
•••:
—
:•••••
1^ acicis.-neutralization
F^lime/ddlbrnite
I-' adiyated carBbn
P ammonia
P bromide
:;
-'i^i0'•'
: :
--0$--
P caJdurn carbonate
2J Mudiu
24. Lab equipment
25 Process COMR.' •:.. . ;
R cajciurri Florida
W calcium riypochlarite
c»ffcipn ctioxide
2B U/M management
l/;:.sodium fluoride
^^PP^Iidde
::.F
7
'/. I?i:8Qdiurrj. hydroxide
Srsodiumhypd^ifpri
--p^tonnegas.
. F-cp^gutaiit'aid.s
mmeta&is
W sodium; nitt^te1
; 17 copper sulfate
-
?Jbf«c chloride
• • $
v*>..i>j
• ' R hydrogen peroxide
•-.-Reset
-
sodium sulfide
Cancel
Done
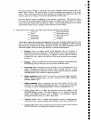
FIGURE 3.4 TYPICAL COMMUNITY TAB WINDOW - COMMUNITY RESOURCES
1
14
The questions in the "Resources" Section of the community data attempt to characterize the
support the community can supply to the development and the maintenance of the treatment
technologies being considered (Figure 3.4). These questions require the user to indicate the
availability of that particular resource in the community. The default condition for these
questions assumes that all of the resources are available. To indicate that a resource is not
available, the user clicks on the box, which removes the checkmark, hi case of doubt, it is
recommended that the user start by assuming a resource is NOT available. If this causes a
particular treatment train to be deemed unfeasible by the program, this will be detailed in the
Infeasible Solutions File (Section 5.1), and the user can decide whether making the resource
available is justified.
After answering all of the "Resource" questions, the user should click on the Hydro/Met tab that
contains seven questions numbered 27 through 33. These questions pertain to the hydrological
and meteorological conditions of the proposed treatment site.
There are nine questions numbered 34 through 42 in the Financial tab category. The "Financial"
questions relate to applicable currency, cost indices, and inflation rate.
The last tab is the On-site tab, which contains eleven questions numbered 43 through 53. The
"On-site" condition specifications are factors in evaluating on-site treatment, as opposed to
centralized treatment.
After answering all applicable questions, save the input data and return to the "Choose a
Community" dialog by pressing the Done button. To return to the "Choose a Community"
dialog without saving the input data, press the Cancel button. From the "Choose a Community"
dialog, data can be entered for another community, or the user can return to the main menu by
pressing the Exit button.
3.3.2 General Tab Questions (1-7)
1.
What is the name you wish to use to identify this community or problem?
,
..
(40 char., max.)
The name given the community should be specific enough to be able to both locate the site on local
maps and to communicate to the users the approach being taken in the process. In some cases, this
might be a village, a town, a city, or an informal peri-urban area.
2.
What is the name of the neighborhood?
(20 char., max.)_
The name of the neighborhood should be specific enough to be able to relate to the community user
group. If several neighborhoods are involved, they should also be listed. If the problem involves a
large city that would include a large list of neighborhoods then this section need not be filled in. For
some on-site treatment cases, if the community has distinctly differing conditions and cultural values,
the problem must be divided into these sub-components. The program does not allow wide variations
in geophysical and/or cultural differences to be placed into a single community profile (a limitation.)
15
3.
In what state or province is the community located?
(20 char., max.).
This information should be specific enough to identify the formal macro governmental unit responsible
for water and wastewater to the local community and to the national government.
4.
In what country is the community located?
(20 char., max.).
Country or autonomous political area.
5.
What is the planning group or department?
(20 char., max.)
The local planning group should be the closest governmental unit to the community that is involved in
the planning, the financing, and the designing of water and sanitation services.
6.
What is the name of the responsible Agency, Ministry, or institutional stakeholders?
„_
(60 char., max.)
This refers to the highest governmental unit(s) within the country that plans, approves, finances, and/or
designs water and sanitation services (including water reuse).
7.
Specify the base year for the demographic data, land value, and water use data?
The population should represent the best estimate for the community. The year entered here represents
the year in which demographic and water use data are available. These data will be brought up to date
using growth rate data supplied below.
_ _
3.3.3 Demographic Tab Questions (8-16)
8.
What is the population of the community (in 1,000s ofpeople) in the baseyear?^
The population of the community represents one of the three important factors in determining the
design flow. The other two factors are the indoor water use and the rate of growth of the population for
a specific design period. The population given should be the base year target population for the
project. Sometimes the target population is less than the population in the demographic unit. For
example, a project might be proposed to supply sanitation coverage for a fraction of the population in
demographic unit.
9.
What is the annual population growth rate (in percent) for the community?
The population growth rate should be conservative at best and could include potential immigration
factors associated with the delivery of water and sanitation services. If governmental policies are such
that the magnet effect should not be considered, then use of the model at two different growth rates to
predict unserviced population for the project period. A population growth rate of 1% per year results
m
about a 22% increase in population in 20 years, while a 3% growth rate results in an 80% increase in
population in 20 years.
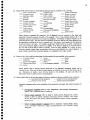
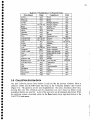
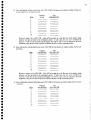
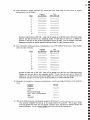
J0. What is the base year gross population density of the community (in persons per square km) ? _
The habitation density is used to estimate the construction costs for wastewater sewerage systems and
to select appropriate on-site treatment processes. This unit cost for collective systems is based upon the
density and the total number of people. In cases where the communities served have distinctly different
densities, the problem must be separated into those different communities and the results combined on
a spreadsheet. Certain on-site alternatives are not feasible, for example, under conditions of high
density.
16
Typical Population Densities
Landuse
Residential single family dwelling, large lots (0.5-1.0 ha)
Single family dwelling small lots
Multiple family dwelling, small lots
Multiple story multiple families
Commercial
Industrial
Persons/km2
1270-3700
3700*8700
8700-25000
25000-250000
3700-7500
1250-3700
11. What is the average number of persons living in a single dwelling in the community? ^____
The number of persons living in a single dwelling is used to: 1) normalize cost data to service units
(dwellings), and 2) size decentralized on-site treatment system units.
12. What is the estimated annual growth rate (in percent) in community land area?
__^_
The estimated annual growth rate in community land area is used to calculate the collection cost for a
given project period. In many cases, the land area growth is zero. This becomes an important issue in
sprawl-type development where sanitation services are being considered.
13. What is the base year per capita water use rate per day (liter/day/person) ?„
The per capita water use should be based upon current indoor and outdoor water uses at the home. The
assumption is that both of these needs will be met with a distributed water supply service. If excessive
irrigation and animal watering exists in the community and the present (existing) source can continue to
meet this need, then only indoor water use value should be used. The WHO minimal water need is 80
liters/capita/day. Collected wastewater systems add significantly to this basic need quantity. Water use
can vary from 250 to 6001/c/day in developed countries.
14. What is the estimated expected annual rate of change per capita water use (percent per year) ?
The change in water use should reflect the change in socio-economic conditions causing water use to
change due to the supply-demand for water. In the case of water conservation, the water use can go
down to some minimal rate, and in the case of a new system in a water-starved community, the water
use can go up to some maximum value. In many cases, in more developed countries, the water usage is
decreasing due to water conservation requirements. A good target fora water-conserved system is 185
to 200 1/c/day.
15. What is the base year per capita wastewater production (liters/day/person)?
The estimated per capita wastewater flow rate should be based upon the water use rate. In developed
countries, the indoor water use is usually 70-80% of the total water use. This number can be
considerably different if excessive horticultural and home agricultural irrigation is done, if it is used in
air-conditioning, and if swimming pools exist in a large portion of the population. It is best to build a
simple indoor water use model to estimate this number using local plumbing guidelines, cultural factors
(bathing and praying), technology limitations, etc.
16. What is the estimated expected annual rate of change in per capita wastewater production (percent/year)?
The estimated annual change in wastewater flow rate is a function of the socio-economic changes
(increasing rate) and/or water conservation policies. In some cases, both of these factors exist. This
represents a net change in indoor water use. See question 15.
3.3.4 Resource Tab Questions (17-26)
17. Please check (click on the box) those construction equipment types that are available in the community:
heavy equipment
light equipment
manual equipment
17
This question assists the planner, especially working in remote, inaccessible, and/or politically detached
sites to determine the basic (minimum) level of construction equipment available. In the vast majority
of projects, all of these types of equipment are available. Heavy equipment is differentiated from light
equipment in that heavy equipment would require a skilled operator and would normally be brought
into small communities for a specific task in the construction process. In some cases, community
participation can significantly reduce the cost of me project by minimizing the need for expensive and
technologically complex construction equipment. This is especially true with on-site treatment systems
and alternative wastewater collection systems.
18. Please check (click on the box) those O&M equipment types that are available in the community:
Electric motors
Portable generators
Electronic test equipment
Portable water pumps
Hand tools
Water sampler
Hoist
Welding equipment
Laboratory instruments
The list of O&M equipment types is designed to represent the "general types" of equipment necessary
to operate and maintain various "technical classifications" of water and wastewater treatment systems.
The list was not meant to be inclusive of all equipment requirements. Studies performed in the mid197O's indicated that this equipment list comprised the principal components related to the supportable
water and wastewater treatment technologies. Many examples exist where items on this list can be
replaced with other items in a community or are not necessarily needed. Not available has many
meanings in this regard. It might be available but no one locally knows show or wants to use it. It
might mean it is locally available by importing via complicated shipping and customs processes.
"Available" can be interpreted several ways by the user. The strictest interpretation is that the
equipment is on-site and spare parts and tools are also on-site. Another interpretation might be that the
equipment is locally available, either by sharing with organizations and/or by hiring local contractors.
Another interpretation of available might be that there is a regional/country level stock supply of
equipment. It is important to keep this interpretation in mind in the planning process.
19. Please check (click on the box) those construction and O&M materials that are available in the community:
Building Blocks
Mixers
Cement
Motorized Pumps
Clay
Motors
Clay liner
_ _ Plastic Pipe & Fittings
CobbleStone
Programmed Logic Controllers
___Corrugated Aluminum or Tin
Rebar/Reinforcing Steel
Fiber Reinforced Plastic
Sand/Gravel for Concrete
Fiberglass
Small Barrels
Geotextile Liner
Steel/Fabricated Tanks
Hand Pumps
Steel Pipes & Fittings
Hand Tools
_
Wire/Electrical Supplies
Imported Processes
Wood/Lumber
The list of construction and O&M materials represents the types of material commonly required for
various technologies. Again, this is not an inclusive list of all the material necessary to operate and
maintain systems, only a principal component list of those found in a wide range of technology types.
The most critical items found on this list are those associated with higher technology types. Simpler
technologies generally require simpler materials to construct, operate and maintain. Again, "available"
can be interpreted many ways (see question 18).
20. Please check (click on the box) those energy resources that are available in the community:
electricity - intermittent
electricity - reliable
gasoline/diesel-intermittent
gasoline/dies el - reliable
natural gas - intermittent
natural gas - reliable
18
•
•
•
•
-
•
•
•
'
•
•
:
.
•
'
/
•
•
• •
• • '
•
•
•
•
'
•
.
'
•
•
'
•
'
;
'
••
•
•
;
•
The energy resources available to operate the water and/or wastewater treatment system refer to the
primary source of energy. This question relates to both the dependability and availability of the energy
source. This assumes that gasoline and diesel generators for example also require fuel supply, fuel
transport, and local fuel storage, which is more dependable than an electric grid.
9
A
Quite often electrical energy is available but is only available at certain times. This question needs to
be answered in the most pessimistic climate the planner can imagine since power failure is a critical
factor in the failure of many water and wastewater systems. A process called backup power is available
when building treatment trains to minimize system failure due to power outages.
™
£
^
w
9
•
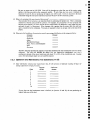
21. Please check (click on the box) those types of labor that are available in the community:
Contractor
Skilled Construction
Driver
Skilled Maintenance
Laboratory
Skilled Operational
Management
'
Technician
Professional
Unskilled
9
A
~
f
^
W
Labor types to support the operation and maintenance of the system is another critical constraint on the
type of water and wastewater technology. This factor combined with availability of O&M equipment
and material has accounted for the greatest proportion of failed and/or poorly functioning water and
wastewater systems. Each of the labor types might have a unique cultural definition.
9
A
^
•
Contractor refers to available private sector businesses who can construct to
specification unit process requiring; 1) concrete forming, 2) pipe fitting and laying, 3)
electrical, and 4) excavation/terraforming. In addition, a contractor must have the skills
to estimate job costs, organize subcontractors, follow plans and specifications, prepare
invoices, etc.
A
~
^
^
. 9
•
Laboratory refers to personnel who have been trained to perform routine performance
and monitoring analytical tests and to fill out necessary monitoring reports.
^
9
•
Management refers to personnel necessary for both a level of technology and size of
system. Management positions are usually found in systems with five or more
operation and maintenance personnel with more complex tasks and experience required
with large systems, and it could be an engineering position.
9
A
;
•
Skilled construction usually refers to personnel who can operate simple equipment,
perform limited operational tasks, and have construction level skills (carpentry,
plumbing, electrical, etc.)
^»
^
4)
•
Skilled maintenance refers to personnel who have been trained and also have
experience in; 1) pipe fitting and mechanical processes, 2) electric motor and controls,
3) welding, 4) concrete forming and placement, 5) electronic instrumentation, etc.
™
f
^
•
Skilled operator refers to a trained and experienced operator for medium to high
technology treatment systems. The skilled operator can be a transitional personnel
familiar with industrial processes such as refineries, food processing, irrigation
pumping/distribution systems, etc. or have similar skills.
A
^
9
A
•
Technician usually refers to a person with specialized training to operate/maintain
technical processes or support equipment (e.g. computer systems, process control, etc).
9
^
•
Unskilled labor usually refers to personnel who can perform repetitive tasks requiring
hand tools with little to no training and a maximum of supervision.
9
A
19
22. Please check (click on the box) those
Acids - neutralization
Activated carbon
___ Aluminum sulfate
Ammonia
Bromide
___ Calcium carbonate
Calcium chloride
Calcium hypochlorite
Carbon dioxide
Carbon source
Chlorine dioxide
Chlorine gas
types of chemicals that are available in the community:
Coagulant aids
Sodium bicarbonate
Copper sulfate
Sodium carbonate
_____ Ferric chloride
Sodium chloride
_____ Ferrous/ferric sulfate
Sodium fluoride
Hydrogen peroxide
Sodium hydroxide
_______ Iodine
Sodium hypochlorite
Lime/dolomite
Sodium metabisulfate
Oxygen
Sodium nitrate
Ozone
Sodium nitrite
Polyelectrolytes
Solvents
Potassium permanganate
Steam
Soda ash
Sulfur dioxide
These chemicals represent the cumulative list of chemicals that are required in the water and
wastewater treatment processes included in this program. None of the processes requires all of the
chemicals, and many processes do not require any chemicals. Availability of chemical supplies can be
interpreted several ways. The most restrictive definition would be to indicate only those chemicals that
are immediately available at the local or regional level. This means a local supplier has the chemicals
in their inventory at all times. For example, liquid bleach might always be available, commercially
white gaseous chlorine might not always be available. If the chemical needs to be imported only for
this use, then it should not be listed as available. There are many examples in a variety of socioeconomic cultural settings where systems have failed due to unavailability of a critical chemical. A
good example would be lack of gaseous chlorine for a community water supply system.
23. Please check (click on the box) those types of media supplies that are available in the community:
Activated Carbon
____ Gravel
Resins
Anthracite
Membranes
Rock
Aquatic macrophytes
____ Plastic
Sand
Diatomeceous Earth
Porous aeration material
Wood
__ Garnet
Media supplies refer to process support media that is lost, saturated, consumed, eroded, and or
corroded in use. Often only sufficient media supplies are available at the time of after many years of
use. Substitution of media is most often the solution to this problem. In some cases this is an
appropriate solution in other cases it is not appropriate.
24. Please check (click on the box) those types of laboratory equipment that are available in the community:
Non-Electrical Lab Equipment
__ Simple Electrical Lab Equipment
Process Control Testing
Sophisticated Lab Equipment
Laboratory equipment refers to the availability of the equipment, spare parts, and technical manuals for
O&M.
•
Non-electrical equipment refers to color comparators, refractometers, thermometers
Imhoff Cones, methylene blue DO testing, etc.
•
Process control equipment refers to digital or analog sensors integrated into control
system to allow for remote operations based upon process condition. This would
include pH system, DO system, chlorine/dechlorination systems, remote equipment
operators, etc.
•
Simple electronic laboratory equipment refers to incubators, vacuum pumps, drying
ovens, probe/meter instruments, simple spectrophotometers, and volumetric testing
equipment.
20
•
Sophisticated laboratory equipment refers to GC, AA, fluometers, mercury analyzer,
complex dual beam spectrophotometers, computers coupled with analytical equipment
output, incubators, etc.
25. Please check (click on the box) those types of process control equipment that are available in the
community:
Analog/meter controls
PLCprocess controllers
Mechanical controls
Pneumatic controls
PLC status indicators
This list refers to the type of control system in the treatment system. It is assumed that many plants will
have all of these types of control equipment. The answer should be directed at the communities
capability to support these types of systems by direct hire of technicians, contractor, direct technical
assistance, parts and repair tools rather than available for purchase at the time of construction.
26. Is there a state/central government agency or institution that would provide institutional supervision for
operation and maintenance of distribution/collection and treatment facilities?
___^
This question deals with the existing or potential long-term sustainability of a project as it relates to
management and technical support for operation and maintenance of a system. This is a specific type
of organization that supports water and wastewater treatment systems by: 1) standardization of
equipment and parts, 2) operator training, 3) technical assistance for operation and maintenance, 4)
laboratory assistance and training, etc. A "yes" answer to this question indicates strong institutional
support for the system. If an institution exists but is not effective, then the answer should be "no", or an
assessment should be made to determine the level of support to insure effectiveness.
3.3.5 Hydro/Met Tab Questions (27-33)
27. Please provide the average monthly precipitation and evaporation rates (in mm/month) in the community.
The monthly hydrological data for the site is critical for the calculation of reuse rates of the programs.
If no irrigation reuse is being proposed, this information is not necessary. If irrigation is being
proposed, this information is used to determine the area required to dispose of the wastewater and to
determine the size of the storage volume necessary to store wastewater during those months irrigation is
not possible.
If local precipitation and evapotranspiration data is not available, data from the closest similar
climatological zone can be used. Quite often, knowing only the annual millimeters of the dominant wet
and dry seasons is enough to be useful in this calculation. Simple approximations can be made by
dividing the annual rainfall into seasons and by using local irrigation requirements for ET losses.
Month
January
February
March
April
May
June
July
August
September
October
November
December
Evaporation
mm/month
_.
^^____
.
Precipitation
mm/month
.
^_____
21
28. What is the average annual minimum ground surface temperature (in degrees C)?_
This question relates to the potential for the use of composting systems.
29. What is the average depth to the frost line (in meters)? .
This question determines the applicability of some treatment processes in extremely cold climates.
30. Provide information on results of tests on the quality of raw water intended for use as a potable water
supply for the community:
The information provided in this question is only used for problems related to water supply. The list
includes both primary and secondary drinking water contaminants. In most cases, a community will not
have a full description of all these constituents. In general, all of the non-critical constituents should be
set to zero or left blank. The critical constituents for surface drinking water are shown in the list below.
Within this group, only a few constituents are commonly used in standards and in reporting treatment
efficiencies. It is important in certain situations to include constituents not found in the short list,
especially when dealing with long-term chronic exposures to organics and metals. The bold items are
the most common constituents listed in standard or goals. The full list is presented in Table 3.2.
m
Constituent
Solids, coarse
S.S.
TDS
Turbidity
Coliform, total
Coliform, fecal
Enteric viruses
Salmonella
Shigella
Cyst
Helminths (ova)
Units
Kg/m3
mg/1
mg/1
NTU
#/100 ml
#/100 ml
PFU/L
#/100 ml
#/100ml
#/100ml
#/100 ml
pH
pH
Color
THM
THM precursors
Alkalinity
Hardness, total
Iron
Manganese
Taste & odor
Temperature
Fluoride
Nitrate
TCU
ug/1
ug/1
mg./
mg/1
mg/1
mg/1
FTN/OTN
deg C
mg/1
mg/1
Measurement
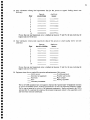
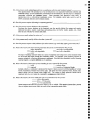
31. Provide information on the quality ofwastewater that is produced by the community:
The principle constituent normally considered in domestic waste water include:
1) CBOD
2) settleable solids
3) suspended solids
4)pH
5) oil and grease
6) fecal/total coliform
22
The other constituents are critical for advance secondary, tertiary, reuse and industrial treatment
systems. Second tier constituents could be:
1) nitrogen forms
2) phosphorus forms
3) metals
4) oocysts
5) COD
Under many conditions of reuse, other constituents must be considered. The fiill list of constituents
considered by WAWTTAR is presented in Table 3.2.
The list of wastewater constituents is designed to be inclusive of all types of biological material,
inorganic constituents, and organic constituents found in domestic and industrial waste. Since
industrial waste can be either a minor contribution or a sole contribution to a wastewater treatment
system, this list must be inclusive of all possible constituents. The program was designed to perform
pre-feasibility analysis for most of the major industrial waste types. Typical domestic effluent
composition is found below. These values can vary by a factor of 2 to 3 on either side of the stated
value. These values are based on 360 liter/c/d of indoor water use.
Composition of Domestic Sewage - Can be 50% to 150% of these values
Constituent
Average
Solids, total
500
350
Volatile
150
Fixed
300
Suspended, total
250
Volatile
50
Fixed
Dissolved, total
200
Volatile
100
100
Fixed
BOD (5-day, 20°C)
200
Oxygen consumed
75
Dissolved oxygen
0
Nitrogen, total
50
20
Organic
Free ammonia
30
0.05
Nitrites (NO2)
Nitrates (NO3)
0.20
Estimated wastewater production
320 liters/capita/day
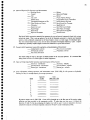
The followings table can be used to estimate the mineral addition to indoor water use. This can be a
critical factor in water reuse.
23
Range of Mineral Pickup in Domestic Sewage
Mineral constituent
of property
_»_____^____^__
Dissolved solids
Boron (B)
Percent Sodium
Sodium (Na)
Potassium (K)
Magnesium (CaCO3)
Calcium (CaCO5)
Total Nitrogen (N)
Phosphate (PO4)
Sulfate(SO4)
Chloride (Cl)
Total Alkalinity (CaCO3)
,
Normal range,
parts per million
100-300
0.1-0.4
5-15*
40-70
7-15
15-40
15-40
20-40
20-40
15-30
20-50
100-150
*In percent
32. If the wastewater treatment system receives a point source input other than the collection system, please
provide the name of the point-source loading
file:
.
(30 characters, max.)
The point source loading file allows the user to co-mingle wastewater (treated or untreated) with the
new problem's wastewater flow. For example if an industrial facility's effluent was to be added to the
problem's wastewater flow, then the new combined flows and mass loading would be calculated. If the
problem's wastewater flow is coming from a newly constructed collection system and is co-mingled
with an existing collected system, then the flows and mass loadings are combined. The file whose
name is specified here would normally be generated as the "Optimal Cone." File (specified on the Go
dialog) by WAWTTAR itself from a previous run of the program. The file must reside in the directory
named "results" under the WAWTTAR home directory.
33. Is a central wastewater collection system in existence for the community? (Yes/No)
This refers to the condition where an existing collection system exists and the problem is to select a
wastewater treatment system only.
3.3.6 Financial Tab Questions (34-42)
34. What year is the project scheduled to begin (first year in the planning horizon) ?.
The program calculates the cost of the project for a given project period including updating costs to
reflect inflation from the base year at which process costs were computed (1992) and starting year of
the project.
35. How many years are to be included in the planning horizon (length of the proposed project)?
This represents the end of the project economic calculation not the end of the utility of the project. In
most cases, the economic life (period used to recoup capital investments) is less than the "useful life of
the project". In most cases, this is a 20 or 30-year period but may be 10 to 15 years for on-site
sanitation projects.
36. What is the name (or abbreviation) for the local currency? (10 char., max.)
The name of the currency unit is placed here.
__
24
37. What is the US dollar exchange rate for the local currency (i.e., U.S.S1.00 = how many units of local
currency)?
The exchange rate for the US dollar is important in converting the unit cost of processes (data was
collected in US dollars) to local currency. The program accounts for inflation but does not account for
currency de-evaluation policies.
38. What is the annual interest rate or public works discount rate (percent per year) that should be used in
evaluating costs of water and wastewater treatment facilities?
^
____
..
The annual interest rate should be the value commonly used in funding public works projects by central
banks and/or by bilateral and multilateral development organizations. In some cases, these are highly
discounted rates.
39. What is the anticipated annual rate of inflation (percent per year)?
;
The most conservative answer to this question would be the predicted inflation rate based upon past
data. In most cases, this is not a constant and its actual value is highly dependent on local and global
economic conditions and national political and socio-economic conditions.
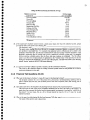
40. Construction cost indices: Please give an estimate for the ratio of the following construction cost
categories in the community to the cost in the U.S.:
Item
Ratio
Concrete
Earthwork
Labor
Manufactured equipment
Pipes, valves, fittings
.
Steel
Structures
_____
The construction cost indices are based upon work done in the United States showing the percentage of
dollar effort attributed to the seven categories for various water and wastewater technologies. In the
U.S. study, the total cost (engineering and construction) was distributed amongst the seven categories
and normalized to represent 100 percent of the total cost. Each community problem must estimate the
relative difference between the US cost and the local cost in whole number units. For example, if labor
cost is 50% in the community of interest compared to the US, then 0.5 is placed next to labor. If
chemical cost is 2.5 times more in the community of interest, then 2.5 is placed next to chemical in the
item column.
Data for this information can be obtained from national statistical records, multilateral funding
organizations, Engineering News Record (ENR) cost comparisons, etc. These indices can be adjusted
to calibrate the economic component of the model. Since the output is used to compare alternatives - a
good first guess still gives a good comparison among alternatives. If the user would like to converge
on the estimated actual construction costs, then calibration is necessary by adjusting the indices
(usually the estimated cost at this stage of planning is +5O/-3O percent of as-built cost).
41. O&M cost indices: Please give an estimate for the ratio in the community of the following O&M cost
categories to the cost in the U.S.:
Item
Mti°.
Chemicals
Energy
Labor
Materials
The O&M cost indices are based upon work done in the United States showing the percentage of dollar
effort attributed to the four categories for various water and wastewater technologies. In the U.S.
study, the total cost (engineering and construction) was distributed amongst the four categories and
normalized to represent 100 percent of the cost. Each community problem must estimate the relative
difference between the US cost and the local cost in whole number units. For example if labor cost is
25
50% in the community of interest compared to the US labor cost, then 0.5 is placed next to labor in the
item column. If the manufacturing equipment is 5 times more costly in the community of interest then
5 is placed next to manufacturing equipment in the item column.
Data for this question can be obtained from national statistical records, multilateral funding
organizations, Engineering News Record cost comparisons, etc. These indices can be adjusted to
calibrate the economic component of the model. Since the output is used to compare alternatives - a
good first guess still gives a relatively good comparison. If the user would like to converge on the
estimated actual costs then calibration is necessary by adjusting the indices to local cost by comparing
WAWTTAR output with as build system cost in the community/country of interest.
42. What is the base year value of land (in 1000 U.S. dollars per hectare) where treatment facilities would be
built?
Land value can be an important determinant in the cost and location of a wastewater treatment/reuse
facility. This should only be used if in fact land will be purchased for the treatment plant, hi most
cases, the value of the land should reflect the fair market value of the land, not the speculative value of
the land. If the land is being supplied by the government, then no cost should be attached to the land.
If the land is in extremely short supply and other uses for the land are needed, then the opportunity cost
of the land could be used.
3.3.7 On-Site Tab Questions (43-53)
43. Which of the following is the predominant surface soil/ground type to a depth of 2 meters?
gravel, coarse sand
coarse to medium sand
fine sand to loamy sand
sandy loam, loan
loam, porous silt loam
silty clay loam, clay loam
rocky
boulder
bedrock
The predominant soil depth question addresses several criteria for selecting on-site treatment systems.
Since the majority of on-site receptacles require excavation, the workability of soil to down to 1.5
meters is critical. Predominantly rocky soils are ideal for excavations. Predominantly sandy soils
require special construction techniques to maintain sidewall structural integrity. Subsurface geological
formations (1.5 to 3.0) are important in terms of the separation between wastewater infiltration trenches
and groundwater levels. Certain soil types (clay loam) can provide excellent receptacle structures that
are more or less water tight with a minimum of infiltration.
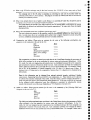
44. What is the characteristic percolation rate for the area? (seconds /cm) .
While the percolation rate (rate at which clean water moves through (the soil) has limited value in
establishing loading rates, it is commonly used to establish areal requirements to dispose of treated
effluent. Most soils, including highly porous soils, will reach the same percolation resistance if loaded
continuously with partially treated effluent. Intermittent loading with high quality effluent produces an
effluent that performs closer to the infiltration rate of clean water.
26
Recommended Rates of Wastewater Application for Trench and Bed Bottom Areas
Soil Texture
Gravel, coarse sand
Coarse to medium sand
Fine sand, loamy sand
Sandy loam, loam
Loam, porous silt loam
Silty clay loam, clay loam
Percolation Rate
<1
1-5
6-15
16-30
31-60
61-120
<25
25-120
121-360
361-720
721-1440
1441
45. What is the minimum wet weather depth to the water table (meters)?
The minimum depth to the highest level of groundwater affords optimum protection of a groundwater
resource utilized for drinking water.
46. What is the minimum horizontal distance (in meters) between the boundaries of the proposed treatment and
disposal sites and a potable water well?
The minimum distance between a sanitation device (receptacle/treatment disposal/reuse) and a natural
potable water source minimizes the potential for water borne disease transfer to humans drinking,
bathing, cooking, and/or collecting food supplies.
47. What is the minimum horizontal distance (in meters) between the boundaries of the proposed treatment and
disposal sites and a natural watercourse (e.g., stream, lake, estuary, etc.)?
The minimum distance between a sanitation device (receptacle/treatment disposal/reuse) and a natural
watercourse minimizes the potential for water borne disease transfer to humans drinking, bathing,
cooking, and/or collecting food supplies.
48. Do the majority of community members live in multistory buildings?
This question relates to on-site technology options available for multi-story buildings.
limited technologies available for sanitation for multi-story buildings.
There are
49. In the community, is squatting the most predominant position for defecating? ,
This question only pertains to on-site/decentralized treatment alternatives. The alternative treatment
trains for on-site treatment systems require a different approach than treatment trains developed for
centralized collection/treatment systems. An on-site treatment train begins with the initial point of
deposition of human waste.
50. In this community, are there cultural/religious factors that require males and females to use different
structures for defecating?
In many cultures, sanitation facilities may be gender specific. Male and female community members
may be prohibited from using the same sanitation facility. If the answer to this question is yes, two
sanitation facilities are required for each dwelling.
51. Please check (click on the box) those types of anal cleansing materials used in the community.
bulky, degradable
non-bulky, non-degradable
bulky, non-degradable
non-bulky, degradable
water
The type of cleaning materials relates to a series of constraints and sizing issues as the treatment trains
are developed and sorted through the community profile. For example, water cleansing requires an
aqueous receptacle, collection, and treatment component. Non-bulky/non degradable (rocks) cleansing
material requires a complete different set of conditions for the feasible alternatives.
52. Please check (click on the box) those types of waste handling categories for which cultural/religious
barriers exist in the community:
urine
treated sludge
nightsoil
treated and composted sludge
27
In many cultures, a community is dominated by negative values associated with the handling of various
levels of treatment of human feces and/or urine. The levels run from composted waste, human urine,
treated sludge, and raw human waste (night soil). The answer to these questions insures that a
treatment train does not violate the community's predominant cultural beliefs.
53. Which of the following street widths best describes the accessibility to 90% of the dwellings of the
community?
_
<0.8 m (footpaths)
0.8 m-2.75 m (carts)
>2.75 m (automobiles)
This ensures that any treatment train containing a vehicle transport system matches the conditions in the
community.
3.4
TRAIN DESCRIPTIONS
3.4.1 Introduction
Developing a collection of processes to met a particular standard, guideline, and/or reuse goal is
referred to as "building treatment trains". The developers of the WAWTTAR program assumed
that the program users would have at the very least an acquaintance with water and wastewater
treatment processes. At best, the user should be familiar with conventional and non-conventional
treatment processes. This familiarity should include process performance ability, equipment
description, operation and maintenance requirements, human resource requirements, effective
combinations of processes, and area requirements. The program does not automatically build
treatment trains. The user must select processes and arrange them in logical order in terms of the
flow of the water, wastewater, and/or solids. There are no default treatment trains in the
database. The program developers feel strongly that the user should develop the trains from a
variety of information sources (i.e., textbooks, past experiences, technical journals, research
activities, observation/discussions with operators). It is suggested that users not familiar with
treatment process spend time with the resources listed above, familiarizing themselves with the
processes and associated applications, constraints, and requirements.
The development of a wide range of alternative treatment trains is at the heart of the
WAWTTAR program. There are large numbers of uniquely different treatment trains possible
by combining the various unit processes found in the process database. The number and types of
alternatives developed is a decision the user must make early in the facility planning process. The
wider the variety and the greater the number of treatment train alternatives, the greater the
probability that a sustainable solution will be found. This initial step in the facility planning
process is referred to as the prefeasibility step. Allowing infrastructure planners to consider the
community's capabilities along with wider range of technological processes maximizes the utility
of the decision process in terms of the investment contributions by all concerned parties. The
power of the WAWTTAR decision support system is the ability to compare the appropriateness
of standard treatment trains to indigenous and innovative treatment trains, hi most cases, the
number of alternatives used in the facility planning process is too small, and not inclusive of
potentially useful treatment trains. The diagnostic nature of the program (Infeasible Solutions
file, see Section 5.1) allows the user to identify the specific resources or conditions which would
not support a particular process within a treatment train. This aspect of program is as valuable as
the program's ability to select those trains and processes that can be supported in a community.
28
3.4.2 Operation
Under the Main Menu Edit pulldown menu, the last item in the list is Train Descriptions.
Selecting "Trains Descriptions" opens a window that can be used to build and edit treatment
trains. Select New Train if a new train is to be developed. Enter a short descriptive name for the
train in the text box that opens at the bottom of the dialog box. This name will appear in the
scrolling window under select a train to edit. Once the name is placed in the text box, the Edit
Train button activates. The next step is to select this Edit Train button. The Build a Train
window opens (Figure 3.5). The first thing to enter is the Train ID code, name, or number in the
upper right-hand corner. This should be a unique alphanumeric of 5 to 10 characters, which will
label the alternative in the graphic output of the program if the alternative is feasible. The next
thing to select is the Train Type (water supply, wastewater treatment, and wastewater on-site),
immediately below the Train ID input slot. Clicking on the circle in front of the appropriate
solution will select that type.
Build a Train
I] wastewater- primary
Clarifier. Primary, Rectangular
Dry Alum/ Primary
Ferric Chloride/Primary
Flow Equalization
Flow Metering
Granular Activated Carbon
Grit Chamber
Imhoff Tanks
In-Gravi1y Oil Removal
In-Liming (NH3-air stripping)
In-Neutralization
In-Solvent Extraction
In-Steam Stripping
Low Ume / Primary
OS3-Commumty UASB
Pond, Anaerobic
Preliminary Treatment
Q-Chlorination (gas)
Screen, Bar, Hand Cleaned
Screen, Bar, Mechanical
Screen. Bar, Hand Cleaned
Grit Chamber
Clarifier, Primary, Circular
A.S. Conventional, w/SecClarif
Chlorination (gas wastewater)
Digestion, Aerobic
FIGURE 3.5 TRAIN DESCRIPTION INITIAL WINDOW
If wastewater is selected, for example, six categories of processes show up under Select a
Process Type, to the left of the Train Type selection. This list is designed to assist the user in
selecting process in the general order of occurrence in the treatment train. When "wastewater primary" is selected, for example, a list of primary treatment processes appears in the left-hand
part of the window. Some processes are found in more than one "Train Type". Listed below are
the process categories found in each of the three train types.
29
To build a train, a process is selected by clicking on the desired process name under the Select a
Process scrolling window and adding the process to the list of train processes by clicking on the
"Add ->" button. The process now appears on the right side under the Processes in Train
window. If a process needs to be removed from train, the process name is selected under the
"Processes in Train" column and the "<- Delete" button is selected. Once the user becomes
familiar with the procedure, processes can be found quickly by selecting the first letter of the
process name. The scrolling window on the left will move to that particular area in the list. The
full list can be viewed by either moving the down arrow on the list or by moving the scroll bar on
the left side of the window.
After all the potential processes for a particular train have been selected and added to the
"Processes in the Train" list by the "Add" button on the Build a Train window, the user moves
the next window by clicking the mouse on the "Next -> " button found at the bottom right of the
screen. The next windows gives the user an opportunity to place the processes of interest for this
particular train in their correct flow sequence, and to identify the solids receiving processes. This
second "Build a train" window shows the processes selected on the left side of a two-column
table (Figure 3.6). This window allows the user to place the processes in their train sequence (in
the direction of liquid or solids movement).
To begin placing the processes in order, click the arrow on the top entry on the left side of the
window entitled "Process". Clicking on the arrow opens a dropdown list in which all of the
processes selected in the previous window are available. At this point, the user should identify
the first process in the new treatment train by clicking on the process name. Next, move to the
second position in the list, click on the arrow again to bring the dropdown list, and select the
second process. Continue until you have all of the processes you want in the correct order.
Repeat for the processes receiving solids in the right-hand column. This is the train
configuration stored under the ID you have given it. If you fail to do this step, you will not have
processes under the indicated name.
You can repeat this procedure for as many treatment trains as you want to evaluate. Since the
purpose of WAWTTAR is to act as a screening tool for options, the user is encouraged to
generate as many different potential trains as possible in the early stages.
30
TABLE 3.1 PROCESS TYPES (WATER, WASTEWATER, AND ON-SITE)
Select a Process Type - Wastewater Treatment
Wastewater primary
Wastewater secondary
Wastewater tertiary
Wastewater disinfection
Wastewater disposal
Solids handling
Storage
Select a Process Type - Wastewater On-Site
On-site (dry)
receptacle
On-site (dry)
structure
On-site (dry)
temporary storage
On-site (dry)
collection
On-site (dry)
treatment
On-site (dry)
disposal
On-site (wet)
receptacle
On-site (wet)
structure
On-site (wet)
temporary storage
On-site (wet)
collection
On-site (wet)
treatment
On-site (wet)
disposal
Solids handling
Storage
Select a Process Type
Water supply
Water supply
Water supply
Water supply
Solids handling
Storage
- Water Supply
groundwater
surface water
surface and groundwater
wastewater
31
Bar+Grt+PC+AS+CHIor+AirDig+SldgBed
;.^De^p||i:^feiplacing processes ir> sequential prder^^tei:
^ j l t m & r i d ^i^i^bbess'flbmdrQpddwrifii^pf ' •
:
Train Processes -:: -Svfc •: h
A S . Conventional. w/SecClarif
ChIorination (gas wastewater)
Digestion. Aerobic
V-Drying Beds
FIGURE 3.6 TRAIN DESCRIPTION SECOND WINDOW
3.5 STANDARDS
The user must choose a standard to be applied to the treatment train(s) selected ("no standard" is
an available option). The Standards data table, found under the Edit pulldown menu as
Standards, can be viewed and modified as necessary. WAWTTAR uses the standard you
specify to evaluate the feasibility of each treatment train you constructed or chose. Treatment
standards can be created and edited by clicking the Standards option, generating a screen much
like the other ones described earlier (Figure 3.7).
Editing standards require four pieces of information: the name of the standard, description
(application), the standard type (wastewater or water), and constituent limits (the same list found
in the community file and the process file). The constituent list allows the entry of an upper limit
(usual situation) and a lower limit (dissolved oxygen, for example).
32
Standard: WHO Guidelines-Irrigation
FIGURE 3.7 EDITING STANDARDS
Not all of the constituents need a value. Again, this list is all-inclusive and constituents that are
not of interest can be left blank. In most cases, only limits for the most common constituents
need to be defined. Remember that this program was designed to allow evaluation of industrial
waste streams entering municipal wastewater systems. In those cases and in the case of industrial
waste treatment, the non-traditional constituents are significant. The full list of constituents for
which standards can be defined is listed in Table 3.2.
33
TABLE 3.2 WATER QUALITY PARAMETERS
Constituent
Acidity
Alkalinity
Aluminum
Arsenic
Asbestos
Boron
Cadmium
CBOD
Chlorides
Chromium
COD
Coliform, fecal
Coliform, total
Color
Copper
Cyanide
Cysts
Detergents
Enteric viruses
Flow
Fluoride
Grit
Hardness, total
Helminths (ova)
Hydrogen sulfide
Iron
Lead
Manganese
Mercury
Molybdenum
NBOD
Units
Constituent
mg/L
mg/L
mg/L
Ug/L
No./100 mL
mg/L
Nickel
Nitrate
Nitrite
Nitrogen, ammonia
Nitrogen, organic
Nitrogen, total
Oil & grease
Pesticides
pH
Phenols
Phosphorus, total
Protozoa
Radium
Salmonella
Selenium
Silver
Solids, settleable
Solids, suspended
Solids, total dissolved
Solids, total dry weight
Strontium
Sulfate
Sulfides
Taste and odor
Temperature
THM
THM precursors
TOC
Turbidity
VOCs
Zinc
mg/L
mg/L
Uff/L
mg/L
No./lOOmL
No./100 mL
TCU
UR/L
No./lOOmL
mg/L
PFU/L
mVday
mg/L
kg/m J
mg/L
No./100 mL
W?/L
mg/L
Hg/L
mg/L
Hg/L
mg/L
Units
mg/L
mg/L
mg/L
WS/L
mg/L
mg/L
PH
Hg/L
mg/L
No./lOOmL
pCi/L
No./lOOmL
ug/L
mL/L
mg/L
mg/L
kg/m J
£Ci/L
mg/L
Ug/L
FTN/OTN
°C
ng/L
ng/L
mg/L
NTU
Ug/L
UgA.
3.6 COLLECTION SYSTEM DATA
The Edit Collection System Data window is laid out like the previous windows. Select a
collection system and the Edit button will bring up the "Collection Systems" data window
(Figure 3.8). The questions are few and straightforward. The name, description, photo files,
drawing files, text files, references and the construction cost curve (based on dollars versus
population density) are asked for. A plot of the cost curve can be displayed and printed. When
the collection system is described, return via the Done button (lower right-hand comer) to the
WAWTTAR main menu.
;[£
34
Collection System: Condominial Sewers
- L "-~ SL ^tt,^ :i &!ti^Mlr : --* £ -
1 :€#.
actsludgeemp1y.jpg
c£;
Activated Sludge I.fif
Activated Sludge 2.fif
SJ
Activated Sludge 3.fif
Adsorptiontrench.pcx
y..
aeratorZ.jpg
-y''/
aeratorbank1.jpg
by
aeratortypes.po:
aerators shaft propeller.frf
aerators swing arm.jpg
')
aerobic sludge digestor.po
anaerobic dig fixed
anaerobic digester arcata.jf^j
anaerobic digestor.pcx
"•ananerabic dig fix cover a.fjtj
Construction of a condominial sewer system.
v
v^B&Hgfe
^ ^ ^
FIGURE 3.8 EDITING THE COLLECTION SYSTEM DATA
35
4.0 GETTING RESULTS
4.1 CALCULATIONS
Select the Calculate option of the main menu. There will be five choices: Include/Exclude
Processes, Include Trains, Track Parameters, Go - Water Supply and Go - Wastewater Treatment.
Select the "Track Parameters" option first.
4.2 "TRACK PARAMETERS" OPTION
WAWTTAR will display the discharge concentration of up to ten water quality parameters of
your choice from a comprehensive list. The Select Water Quality Parameters to Display window
is set up similar to previous windows, with the list of water quality parameters on the left, and the
parameters of choice displayed on the right along with the "Add ->", "<- Delete", Reset, and
Done buttons (Figure 4.1). These buttons will allow you to choose and alter the parameters you
wish to have displayed. When this is complete, return to the WAWTTAR menu.
Select Water Quality Constituents to Display
<
-
*
•
•
•
•
#
*
•
'
:
•
'
-
•
•
•
•
-Water Quality Constituents:
acidity
alkalinity
aluminum
arsenic
asbestos
ascaris
boron
cadmium
CBOD
chlorides
chromium
COD
coliform, fecal
coliform, total
color
copper
Constituents lu Display:
CBOD
coliform. fecal
nitrogen, ammonia
solids, suspended
:; .i *
ill
.iign
cyanide
cysts
detergents
enteric viruses
flow
fluoride
grit
hardness, total
helminths (ova)
hydrogen sulfide
I iron
Iff fjsi
Reset
•
•••'•*
•s
..so
FIGURE 4.1 TRACK PARAMETERS WINDOW
Done
i
36
4.3 "INCLUDE/EXCLUDE PROCESSES" OPTION
Selecting the Include/Exclude Processes option will bring up the "Specify Processes to Include
or Exclude" window (Figure 4.2). The user can specify which processes in the database may be
included in a feasible treatment train, must be included in a feasible train, and must not be
included in a feasible train. The May Include AH Processes button will allow every treatment
process in the database to be included. Unless otherwise specified, all treatment processes can be
included. This feature is used to compare only those trains sharing certain characteristics, for
example using a specific primary process (wastewater treatment) but different secondary
treatment processes. This is particularly useful when there are many trains to compare.
Specify Processes to Include or Exclude
mmj^m^^&M^m^m- • » ;igj§:
ijwastewater - primary^
Anaerobic Unflow-RAFA
Clarifier, Primary, Circular
Clarifier. Primary. Rectangular
Comminutor
Dry Alum / Primary
Ferric Chloride/Primary
Flow Equalization
Flow Metering
Granular Activated Carbon
Grit Chamber
Grit Chamber settling
Imhoff Tanks
In-Gravity Oil Removal
In Liming (NH3-air stripping)
In Neutralization
In-Solvent Extraction
In-Steam Stripping
Low Lime / Primary
OS3-Community UASB
Pond. Anaerobic
Preliminary Treatment
Q - Chlonnation (gas)
Screen. Bar, Hand Cleaned
:ess
mcludo this process
include AH t IUCPSS nt i ni!» Typtt
Mny Include All
FIGURE 4.2 INCLUDE/EXCLUDE PROCESSES
4.4 "INCLUDE TRAINS" OPTION
By default, all treatment trains are available for consideration for the target community. In some
cases however, the user may wish to limit the evaluation to a select group of treatment trains.
Selecting the Include Trains option brings up a window that has all the trains on the left-hand
scrolling list box (Figure 4.3). By highlighting their names and clicking "Add -^", these trains
to be considered can be specified. The selected trains will appear on the right-hand side-scrolling
list box. If all trains are to be included, click on "Add AH -^". If trains are to be removed from
consideration, click on the train in the right hand list, then click on '*<- Remove.
37
Select Trains to Consider
-Available Trains
AnPond+OxPond+FSW w/Nit+chlor
Bar+Grt+PC+AS+CHIor+AirDig+SldgBe
Commun+SBR+Chlor+AnDigest+SldgBi
Extended Air (pkg)
Integrated Pond Sys+Chlor
OxDitch+Chlor
i
OxPond+FSW+Chlor
Septic AbsTr Loam
Septic AbsTr Sandy
TF+PC+UV+SludgeLag+Comp
Ado - >
Integrated Pond Sys+Chlor
OxPond+FSW+Chlor
Add All - »
<<
Remove All
Beset
FIGURE 4.3 INCLUDE TRAIN
4.5 "GO" COMMANDS
The "Go" commands instruct the program to perform calculations either for water supply or
wastewater treatment problems. There are two Go commands; Go - Water Supply and Go Wastewater Treatment. The Go - Wastewater Treatment, which brings up the Setup Treatment
Option Calculations screen is shown in Figure 4.4.
The user must choose a community by selecting the Community button that displays all the
community names. Choose a community by highlighting the community. The name of the
community should appear opposite the Community button.
If the community does not have a collection system (Community profile Question 33), click on
the Collection Sys button, and then select a collection system from the available choices. The
"without collection" choice is available if you do not want to include the cost of a collection
system in this analysis. If the community already has a collection system, leave this entry blank.
The small button to the right of the response box can be used to clear the input.
38
Jetup Treatment Option Calculations
tie PerfornicL
-Select a Reuse Process
Cooling (Heat Exchanger)
Cooling (Tower)
Overland Flow, Gravity
Z - Body Contct. Water Activ.
Z - Boiler Feed Water
Z - Chemical Processing
Z - Coldwater Fisheries
Z - Constructed Wetlands
Z - Food Processing
Z - Forest Preserve Irrig.
Z - Grnd. Wtr. Rechrg. D. I.
Z - Grnd. Wtr. Rechrg. R.I.
Z - Livestk and Wldlf Watering
Z - Low Flow Augmentation
Z - Misc. Non-Pot. Urban Reuse
Z - Nonbdy Cntct Water Activ.
Z - NonProcd. t ood Croo Irrn
Z - Once-Thru Cooling Water
Z - Paper Manufacturing
Z - Petroleum Processing
Z - Primary Metals Processing
Z - Primary Production
Z - Procd. Food Crop Irrig.
.,_
":"^r.-: ;:f
FIGURE 4.4 Go- WASTEWATER TREATMENT WINDOW
If a reuse option at the end of the treatment trains is desired, select it by clicking the Reuse
button, then selecting a reuse process from the list box. If reuse is not desired, leave this entry
blank.
The desired treatment or discharge standard for the community is selected in a similar fashion. A
"no standard" response is available if no treatment limits are required.
The choices for Removal Efficiency allow the user to chose calculations of treatment process
performance based on the maximum efficiency, the minimum efficiency, or the mean efficiency.
By choosing one of three levels of treatment; high, low, and mean, the user can test the
sensitivity of treatment efficiency against the various treatment alternatives.
The user can also specify the names of the Feasible and Tnfeasible solution files and Optimal
Cone, file by entering new names in the displayed text boxes (the extensions are ,rtf for the
Feasible and Infeasible Solution files, and txt for optimum concentration). The Optimal Cone,
file is the concentration of each water quality constituent for the highest ranking treatment train.
These files will appear in the results directory in the WAWTTAR home directory.
The three choices for "Sort Key" (upper right-hand corner) specify whether the feasible treatment
trains to be sorted by minimum capital cost, minimum O&M cost, or minimum total cost. This
39
question allows the user to sort the alternatives based upon these cost factors. For example, a
community member might be interested in the least cost appropriate solution for their
community. A donor agency might be interested in knowing the capital cost sort. A government
agency (public entity) might be interested in the total cost (up from capital cost and user cost) in
practicing the infrastructure investments.
Finally, the user can select whether the costs should be computed as annualized costs or total
project costs. The equations used in these cost calculations are given in Appendix C.
When these criteria are selected, press the Go button. WAWTTAR will perform the specified
calculations for each of the treatment trains you have constructed. A message to the effect that
calculations are in progress will appear. When the calculations are complete, the WAWTTAR
main window will be displayed.
40
5.0
DISPLAYING RESULTS
After WAWTTAR is finished with the calculations, the program output is written to the two
output files specified on the Go menu. These files are the Feasible Solution File and the
Infeasible Solution File. The Display menu can be used to view these files, along with other
output files.
Opening the Display menu will give you several options. The user can select the Infeasible
Solution File, Feasible Solution File, the Feasible Solution Graph command, the Impact
Reference File, Bibliographic Reference File, WAWTTAR Image Gallery, or Raster Image File.
5.1
INFEASIBLE SOLUTION FILE
A description of any treatment train that does not meet the criteria established by the user will be
sent to the Infeasible Solution File. The design or performance criteria not met will be listed for
each process in the train responsible for making the train infeasible. Frequently, infeasible trains
can yield more insight into the current problem and design process than feasible trains, so the
user is encouraged to examine, edit and re-calculate the performance of infeasible trains. A good
train may be found infeasible by the inclusion of a given process that is incompatible with
influent quality, and may be rendered feasible with a relatively minor alteration.
5.2
FEASIBLE SOLUTION FILE
Detailed descriptions of any feasible treatment trains will be written to the Feasible Solution File.
Per process breakdowns of capital cost, O&M cost, land requirements and land cost, as well as
total cost for the train, total per capita cost & total cost per dwelling for each treatment train will
be provided. Adaptability Indices, ranging from 1-4, rating the adaptability of each train to
upgrading, varying hydraulic loading and changes in influent quality are reported. Solids
Production is detailed on a process by process basis. Final Effluent Quality for the tracked
constituents is reported. Finally, Potential Social and Environmental Impacts are reported as
code numbers which are explained at the end of the file.
The treatment trains are ranked by the chosen cost factor and listed with construction, O&M and
total costs after the individual treatment train breakdowns. A list of the annualized costs, project
costs, land requirements and social and environmental impacts for the optimal train follows. The
impact code numbers and associated impacts arc listed. Like the Infeasible File, the Feasible File
is exportable to a text editor and can be printed using the toolbar at the top of the screen.
5.3
FEASIBLE SOLUTION GRAPHS
The Feasible Solution Graph command yields two types of three-dimensional graphs showing
construction, O&M and total cost for each feasible treatment train (Figures 5.1 and 5.2). The
trains are identified by their ID numbers. This graph can be printed with the Print button on the
right.
41
mma
Project Life Costs of Feasible Treatment Trains
50000 (<
to
.1 n
II
40000
o
o
30000
ost(
o
20000
o
10000
o"
d
T": I
I W| i
.;
ij•
rPr;
' 1 H'
Pondi
0
o
TJ
E
O
Q.
a.
X
1
B
•
i
ML
••7
LJi
yy 'I
• MM m,
H
B
§
CD
>
>
1
1
HH^
<
«>
o
Stacked
Bar
Print
Treatment Train ID'S
Capital Cost 1 0/M Cost
I Total Cost
sZMMMmMm®mmim<mvn::<:>
FIGURE 5.1 COST COMPARISON, BAR GRAPH
I
Project Life Costs of Feasible Treatment Trains
100000
W
80000
o
o
60000
%
40000
&
o
O
20000
I
>
I
S.
6
o
Q.
par
8
Print
Treatment Train ID's
•
Capital Cost
I 0/M Cost
1 Total Cost
Exit
FIGURE 5.2 COST COMPARISON, STACKED BAR GRAPH
I
42
6.0 INTERPRETATION AND EDITING OF RESULTS
6.1 TRAIN DATA
The Infeasible Solution file diagnoses why specific processes within trains did not meet the
community and/or the standards specified. A full header showing community location, flow,
population, removal efficiency specified, and standard is printed out in this file. The first thing to
check is the demographic and flow information in this header. Often a data error is made in the
community profile that results in treatment trains being infeasible due to these data errors. In
addition, check to be sure that any resource limit that eliminates a process is reasonable for the
community, and that standards are not being met by an insignificant amount.
The Feasible Solution file will also give a header with the location, flow, population, removal
efficiency and standard used. Each train is then listed with its processes. The construction cost,
O&M cost and areal requirement are given. The unit cost per capita and dwelling is listed after
each treatment train. If parameters are being tracked, their values are listed. Do not be
concerned with significant figures on the concentrations of the water quality parameters as the
computer "predicts" removal rates with more "precision" than can be measured.
The treatment train adaptability indices are also given. Each process has been rated from 1 (low)
to 4 (high) on its ability to: 1) be upgraded, 2) handle varying flows, and 3) handle changes in
influent constituent. The train index is the average of the index for each process in the train. The
closer the "treatment" index is to 4.0, the more flexible the train, and the closer to 1.0 the index
is, the less flexible the train. This can be used as a secondary criterion in choosing treatment
alternatives or could be used to eliminate an otherwise appropriate solution if flexibility is
important.
At the end of the file, all feasible trains are summarized for easy comparison, with the train
construction cost, O&M cost, and total cost. The lowest cost (O&M, construction, or total)
alternative is summarized.
Impact reference number(s) are also shown if appropriate, after each feasible treatment train.
This applies only to on-site processes. A list of the impacts can be found at the end of the file. A
complete explanation of each impact can be viewed using the Display Impact Reference File
option from the WAWTTAR main menu.
6.2 OTHER FACTORS TO CONSIDER
6.2.1 Land Requirement Significance
This criterion category refers to those wastewater treatment processes, often referred to as
"natural treatment systems", which utilize ponds, wetlands, fields, soil mantle, forested areas,
etc., as the ecological substrate for treatment. While these processes have many positive
attributes, their application might be limited in areas that are highly urbanized, and that have
difficult geological conditions, competing agricultural activities, and hydrological hazards. Many
43
of these types of systems have multiple benefits that can be used to justify the expense of
purchasing land that might be highly valued. Examples of multiple benefits associated with landintensive treatment processes are:
1)
2)
3)
4)
5)
6)
7)
open space/green belt,
park - passive recreation,
storage for irrigation and/or intermittent discharges,
habitat value, i.e., wetlands, freshwater supply, wetland habitat, etc.
agronomic return on irrigated crop,
horticultural watering,
aquaculture units.
One of the most important considerations in the use of land-intensive systems is that it
establishes a footprint which subsequent facility planning activities can utilize without the need
for "new" space. This constitutes a positive impact in a perspective of long-term planning of
infrastructure i.e., 30-70 year horizon. For example, the large footprint of an oxidation pond can
later be used to build a more compact system (e.g., activated sludge system) to handle demand
growth.
6.2.2 Specialized Operation and Maintenance Requirement
Some water and wastewater treatment processes require highly specialized technicians to both
operate and/or maintain certain wastewater treatment processes. Good examples would be
automatic chlorine analyzers which pace the amount of dechlorination chemicals (SO2 for
example). Another example would be SBR (Sequencing Batch Reactors), which have program
logic control systems that are adjusted by company representatives. This criterion is to alert the
planner, who might casually indicate in the Community Data that the community has this
capability, that these types of systems are highly dependent on specialized technicians supplied
by service contracts or by vendors.
6.2.3 Solids Production
While solids removal, treatment, storage and disposal is an integral part of a water or wastewater
treatment system, some processes require significantly more attention than others. This criterion
category is to alert the planner to the fact that time and money issues must be considered in
handling the solids. Criterion for inclusion in this category are the production of solids with
potential pathogens, solids which have been chemically treated, solids which have significant
degradable organic material remaining, etc. For example, an oxidation pond treatment train
(oxidation pond the only process) would have no impacts in this category. On the other hand, a
high-rate activated sludge, chemically treated and dewatered by a belt press, would have a higher
impact score in this category.
6.2.4 High Electrical Requirements
This impact category is to identify processes which are energy-intensive. There are few
examples where no electricity is needed to either collect, treat, and or dispose of water,
wastewater and/or solids. Some processes are energy-intensive and therefore require a
44
dependable high quantity of electrical energy. In most cases, this can best be estimated by
determining the backup power requirements for energy-demanding processes. These processes
are those that have to function all the time to achieve treatment. A good example is activated
sludge. Air blowers or oxygen generators need to be available all the time to insure that oxygen is
available to the organism and that mixing can occur. Energy-intensive systems can also require
significant maintenance associated with pumps, aeration devices, etc. This category is designed
to alert the planner to those systems that require an uninterrupted electrical supply. In those
communities where electrical energy is intermittent and unpredictable, energy-intensive
processes should not be used without backup primary energy generating capacity.
•1
45
7.0 TREATMENT PROCESS DATA
The main purpose of the Process data table in WAWTTAR is to provide information on the
capabilities, physical and cultural limitations, costs, resource requirements, and possible
environmental impacts of water and wastewater treatment and reuse processes. The significance
of the physical capabilities and limitations of a given treatment process should be obvious to
anyone with a background in water or wastewater treatment, as should the significance of costs
and resource requirements (where a resource is any kind of human or material requirement of a
process). Cultural limitations and environmental impacts are also of prime importance, but are
often not given sufficient attention. Cultural limitations are significant for the reasons discussed
previously - a treatment technology that is in conflict with cultural norms of a given location is of
little use. Environmental impacts are important since water and wastewater treatment systems
have byproducts and influence local conditions. It is important to avoid substituting one set of
environmental problems for another, such as a wastewater treatment process that negatively
impacts groundwater or drilled wells due to byproducts and hydroiogical conditions.
Alternatively, some processes such as constructed wetlands can have beneficial environmental
impacts, and scenarios exist where such possible benefits should be taken into account in a
positive sense.
Nearly 200 water and wastewater treatment processes are provided in the WAWTTAR database.
All of the data associated with each process is available for review by the user. In addition, while
the list includes a wide range of processes, user can easily add new processes to take into account
factors such as local conditions and new technologies. The general approach to accessing (either
viewing or changing) the process data is the same as with the other data tables as described in
Chapter 4. Reviewing or adding processes can be accomplished by clicking on Process Data
under the Edit menu.
7.1 OVERVIEW OF PROCESS DATA
To access the data associated with a particular process, select the process on the left-hand side of
the alphabetically sorted list box (Figure 7.1). Once the process has been highlighted, select the
Edit Process button. A window appears that has six tabs in the upper left corner. Each of the
tabs has a set of questions that define the process characteristics. The tabs are: General,
Construction, O/M (Operation and Maintenance), Siting, Impacts, and On-Site Miscellaneous.
The questions associated with some of these tabs are shown in Figures 7.2 and 7.3. Clicking on a
question number opens the response window for that question. Some responses require typing in
descriptions or words, some responses require clicking on boxes (required/not required), and
some responses require numbers. A list of the 67 process data questions along with a discussion
of each question is in Section 7.3.
Each process can have up to three generic construction, cost, O&M cost and land requirement
curves based on hydraulic loading, organic loading, and solids loading. If more than one cost
curve is defined, the one that produces the highest cost (or highest land area) is used. The
majority of the cost and landuse data came from U.S. EPA references. All costs were brought
forward to a common base year of 1992 based on an ENR (Engineering News Record) index of
4985. Costs are brought up to the first year of the project based on inflation rate data provided in
the community profile. Most of the cost curves are average costs in the United States for a wide
46
variety of geographical and economic settings. These cost curves can be indigenized by
adjusting based on component cost factors for the community of interest using data provided in
Question 40 and 41 in the Community profile. For construction costs, the relevant component
cost categories are labor, earthwork, manufactured equipment, structures, concrete, steel, and
appurtenances (pipes, valves and instruments). For O&M cost, the relevant categories are labor,
chemicals, materials, and energy.
Choose a Process
Proeess to
Absorption Bed. Loamy Soil
Absorption Bed. Sandy Soil
Absorption Trench, Clay Soil
Absorption Trench. Loamy Soil
Absorption Trench. Sandy Soil
Air Stripping
Carbon Regeneration
Carbon/Fluidized Bed Reac
Carbon/Suspended Growth
Chemical Oxidation
Chemical Reduction
Chlorination (gas wastewater)
[Clarification. Secondary
Clarifier. Primary. Circular
Clarifier. Primary. Rectangular
Comminutor
Complete Mix Suspended Gro
Cooling (Heat Exchanger)
Cooling (Tower)
Digester, Biogas
.Digestion, 2 Stage Anaerobic
Edit Process
New Process/
Copy Proi%§&
• •• ^ ,.tf!$t
:.
•
.. t
•^^^jf-
FIGURE 7.1 PROCESS SELECTION SCREEN
7.2
CREATING NEW PROCESSES
The user has the option of constructing new processes at any time. Processes supplied with the
WAWTTAR program cannot be modified, but they can be copied and those copies can be freely
modified. While entering data for a new treatment process is easy, gathering the necessary data
requires a detailed understanding of the process.
The easiest way to create a new process is to select an existing one it resembles, and click on the
Copy Process button. A green input box will open at the bottom of the screen, asking for a
name for the new process. After entering the name, click on Edit Process at the top.
After each question has been answered, a green check mark will appear to the left of the
question. The Cancel button returns to the master menu. The Close button saves the new data.
A listing of all data associated with the selected treatment process can be printed by clicking the
Print button.
47
7.3 PROCESS PROFILE
7.3.1 General Tab Questions (1-7)
V^
7
J .On«*«/Miw.
• I V
1
. - " ' . . .
. .
:
'
•i-V.-»«-;.I«A::
••••':•••••
.
•'.•.'•.••-•,••••**':.:'.••'*•"•'•'••:••:'•.•
*:^:.v-'.;i7--. r --.i:>.
f j * ^ i ' " . - , ;
,;•.••••
f
•• • ~ ^ ; .
•-<•':
•
v'i'-.Ui'irmon li.':: i inna '".Ironea
;
: : ;
:
^ -
..•.,
•'•••-!•.'.•„•
?
!
' i j s
, ^.::---;^;^;-.-,^y
, ..^.•-/-•^•j.j-v^-.-g
:.••-••••.•-y.-->-•;•;;••-..•,
J.;-...
-.'>::":.;;7..^:
'.' ;^:.i..'". •'•,'*;••*•
ri:pji)i
FIGURE 7.2 PROCESS PROFILE: GENERAL QUESTIONS SCREEN
1.
What is the name of the process? (40 char, max.)
'
2.
Please enter a description of the process. (200 char, max.)
3.
Please select the process type:
IVastewater - Primary
Wastewater - Secondary
Wastewater Tertiary
Wastewater - Disinfection
Reuse - Areal distribution
Reuse - Known volumetric use rate
On-site (dry) - Receptacle
On-site (dry) - Structure
On-site (dry) - Temporary storage
On-site (dry) - Collection
On-site (dry) - Treatment
On-site (dry) - Disposal
On-site (wet) - Receptacle
On-site (wet) - Structure
On-site (wet) - Temporary storage
On-site (wet) - Collection
On-site (wet) - Treatment
On-site (wet) — Disposal
Water supply - Groundwater
Water supply - Surface water
Water supply — surface and groundwater
Water supply and wastewater
Solids handling
Storage
48
These correspond to the categories available in the "Train Description" first "Build a Train" edit
window (see above, Section 3.4.2). Failure to check a category, or checking an incorrect one, could be
a source input error, so care should be taken when entering a new process to insure that the correct
category is listed.
4.
Identify flies containing photographs of this process (5 max.)
WAWTTAR can serve as a simple encyclopedia of water and wastewater treatment technologies. To
that end, photos, drawings, and text files can. be associated with a process. Graphics file formats that
can be displayed include .BMP, .JPG, .PCX, and .FIF. Due to the outrageous licensing fees and
restrictions imposed by UNISYS, .GIF and .TIFF files are not supported. Graphics files must be
placed in the graphics directory under the WAWTTAR home directory. Select a graphics file name
from the list on the left, and click the Add—> button to associate it with the process. Graphics files can
be unassociated from the process by selecting the file name in the right list box and clicking on the
^-Delete button. A graphics file can be displayed after it is selected by clicking the Display button.
Descriptive captions can be viewed (and entered) in the caption text box.
5.
Identify files containing line drawings of this process (5 max.)
See the discussion for question 4 above.
6. Identify files containing text information for this process (2 max.)_
WAWTTAR can serve as a simple encyclopedia of water and wastewater treatment technologies. To
that end, photos, drawings, and text files can be associated with a process. Text file formats that can be
displayed include .TXT and .RTF. Text files must be placed in the textinfo directory under the
WAWTTAR home directory. Select a text file name from the list on the left, and click the Add->
button to associate it with the process. Text files can be unassociated from the process by selecting the
file name in the right list box and clicking on the -(-Delete button. A text file can be displayed after it
is selected by clicking the Display button.
7. Please indicate the monthly reuse rate
Month
Reuse Rate mm or
January
_____
February
March
i
April
_
May
___
June
July
August
September
October
November
December
— _
The reuse rate units are mm for areal application processes, and 103m3 for volumetric reuse processes.
7.3.2 Construction Tab Questions (8-16)
8.
Please check (click on the box) those equipment items that are required for construction of this process.
heavy equipment
light equipment
manual equipment
This question addresses the minimal equipment requirement. The issue is whether the process can be
constructed with manual labor only, light equipment and/or heavy equipment. It is assumed that less
sophisticated and natural systems have some minimal manual equipment requirement as compared to
more complex and sophisticated systems requiring light to heavy construction equipment. In most
cases, these relate the need and/or type of contractor needed to construct the plant.
49
Process: Screen. Bar, Hand Cleaned
I TIC
Impacti
0/M
General
, . n-site/Misc
|
Siting
1 Construction
U C U t ^ ^ l l t j f 1T
•""'"
""
LW1
ln
-"--^ VIlw " v ^
™--™
.y^.^i.1.1.—
_
^.i-.vrv,.
V -, W . W - J WAVI-™-..
,
TJ.^U^^
; Please check (click on the box) those i|llerials that are rGcjuirtijf for
. construction of thiSfrrac&s*J:sf;:,-i
-Answers:
"•'.
!~ building blocks
: p cement
I T clay
. '••-
iiappsuansirMEHGn equipment
Construction energy
• l~ day liner
f/\ 2. Const cost-hydraulic
Qgnst cost -organic
- solids
••
| V cobble stone
J| ••
• r~^cfjffugoJwd aluminum or tin
£j, liber reinforced plastic
I P fiberglass
p geotextile liners
r hand pumps
V hand tools
. F" imported processes
i
• "
•••"
Reset
p
^Ji^Q
' concrete
JT1 small betit
r steel/fabricated tanks : '*
F steel pipe and frttingsr
r wire/electrical su
V:
i T nfi
t " plastic ptpes,&ncl fittings
n Progfernmed Logic Controllers
•p; rebaf/reirrforcing.steel . ? "filKI"'
•T-
••
or
'
•
"
:, -at"
: ; & ! » : ? • '
yelp
Done
FIGURE 7.3 PROCESS PROFILE: CONSTRUCTION MATERIALS SCREEN
9.
Please check (click on the box) those materials that are required for construction of this process.
. Building Blocks
__ Mixers
Cement
_ Motorized Pumps
Slay
_Motors
_ Clay liner
_ Plastic Pipe & Fittings
_ Cobble Stone
_ Programmed Logic Controllers
_ Corrugated Aluminum or Tin
_Rebari'Reinforcing Steel
_ Fiber Reinforced Plastic
_ Sand/Gravel for Concrete
_ Fiberglass
_ Small Barrels
_ Geotextile Liner
_ Steel/Fabricated Tanks
Hand Pumps
_ Steel Pipes & Fittings
_ Hand Tools
_ Wire/Electrical Supplies
_ Imported Processes
Wood/Lumber
This question addresses the minimal materials required for constructing the process. This list is not
meant to be all-inclusive, but to be representative of the general types of construction equipment
required for different types of processes.
50
10. Please check (click on the box) those types of energy that are required for construction of this process.
electricity - intermittent
electricity - reliable
gasoline/diesel - intermittent
___^gasoline/diesel - reliable
This question applies to the primary (prime) source of energy necessary to operate the processes. Does
the process require one of the general types of energy listed?
11. Please check (click on the box) those types of labor that are requiredfor construction of this process,
Contractor
_
Skilled Construction
Driver
_
Skilled Maintenance
„
Laboratory
Skilled Operational
Management
Technician
Professional
Unskilled
Labor types to support the operation and maintenance of the system is another critical constraint on the
type of water and wastewater technology. This factor combined with availability of O&M equipment
and material has accounted for the greatest proportion of failed and/or poorly functioning water and
wastewater systems. Each of the labor types might have a unique cultural definition.
•
Contractor refers to available private sector businesses who can construct to
specification unit process requiring; 1) concrete forming, 2) pipe fitting and laying, 3)
electrical, and 4) excavation/terraforming. In addition, a contractor must have the skills
to estimate job costs, organize subcontractors, follow plans and specifications, prepare
invoices, etc.
•
Laboratory refers to personnel who have been trained to perform routine performance
and monitoring analytical tests and to fill out necessary monitoring reports.
••'
Management refers to personnel necessary for both a level of technology and size of
system. Management positions are usually found in systems with 5 or more operation
and maintenance personnel with more complex tasks and experience required with
large systems, and it could be an engineering position.
•
Skilled construction usually refers to personnel who can operate simple equipment,
perform limited operational tasks, and have construction level skills (carpentry,
plumbing, electrical, etc.)
•
Skilled maintenance refers to personnel who have been trained and also have
experience in; 1) pipe fitting and mechanical processes, 2) electric motor and controls,
3) welding, 4) concrete forming and placement, 5) electronic instrumentation, etc.
•
Skilled operators refer to a trained and experienced operator for medium to high
technology treatment systems. The skilled operator can be a transitional personnel
familiar with industrial processes such as refineries, food processing, irrigation
pumping/distribution systems, etc. or have similar skills.
•
Technician usually refers to a person with specialized training to operate/maintain
technical processes or support equipment (e.g. computer systems, process control, etc).
•
Unskilled labor usually refers to personnel who can perform repetitive tasks requiring
hand tools with little to no training and a maximum of supervision.
51
12. Enter information relating construction costs (1992 USS) for this process to hydraulic loading (in/day) (or
storage capacity for storage processes):
Capacity
n?/dav
Point
1
2
•
.
'
••
.
'
'
Cost
10001992 USS
:..
•'
3
•
'
'
'
'
•
•
•
:
'
•
4
5
.
.
.
7
8
9
10
.:
.
Be sure to report cost in 1992 USS. Costs will be brought up to the first year of the project using
inflation rate data provided in the community profile. If more than one cost curve is defined (in
Question 13 and 14), the one producing the highest cost will be used. Costs are adjusted to the local
community using the cost factors reported in Question 40 and 41 in the Community profile.
13. Enter information relating construction costs (1992 USS) for this process to organic loading (metric tons
BOD/day):
Capacity
Cost
Point
tons BOD/dav
WOO 1992 USS
•
•
•
•
.
'
•
.
1
•
•
2
3
4
:
.
'
•
.
•
•
•
_ ^ _ — _
'
5
•
'
'
6
•
•
•
•'
••
/
.
••
•
••
.
.
:
7
8
•••
9
•:
•
7
••
' •
•
- ' •
'
.
• •
.
i o
•
•
. •
•
•
•
••
Be sure to report cost in 1992 USS. Costs will be brought up to the first year of the project using
inflation rate data provided in the community profile. If more than one cost curve is defined (in
Question 12 and 14), the one producing the highest cost will be used. Costs are adjusted to the local
community using the cost factors reported in Question 40 and 41 in the Community profile.
14. Enter information relating construction costs (1992 USS) for this process to solids loading (metric tons dry
solids/day):
Capacity
Cost
Point
tons BOD/dav
10001992 USS
:
1
.,
_______
•
••
.
3
4
'
•
'
•
•
• •
_
_
_
_
_
_
_
_
_
_
_
_
_
'
7
.•
. '
' '
9
10
•
'
:•.
.
8
'
,
•
'
'
'
':
5
6
'
••
'
'.
•
,
•
:
•
•
•
'
•
•
•
52
Be sure to report cost in 1992 US$. Costs will be brought up to the first year of the project using
inflation rate data provided in the community profile. If more than one cost curve is defined (in
Question 12 and 13), the one producing the highest cost will be used. Costs are adjusted to the local
community using the cost factors reported in Question 40 and 41 in the Community profile.
15. What is the economic life span (years) of this process? .
The economic life of a process is an important factor in calculating the project cost. This is commonly
referred to as the life cycle period for a process. For example, if a process has a 10 year economic life
and the project period is 20 years, then the process would need to be built twice, once in the first year,
and once in year 11 of the project. If the economic life is greater than the project life, then only one
unit is considered in the calculation. Processes arc assumed to have no salvage value at the end of the
project.
16. Please give the breakdown of construction costs by percentage distribution in the categories below:
Category
Percent
Concrete
Earthwork
Labor
Manufactured Equip.
Pipes, Valves, Instrumentation
Steel
Structures
The EPA study that provided the majority of cost data distributed the total construction cost over seven
categories. The total cost included the design cost, the construction management cost, and a
contingency subtotal of the above listed items was about 35 to 40% of the construction cost. In some
cases, these percentages might vary and could be adjusted.
7.3.3 Operation and Maintenance Tab Questions (17-37)
17. Enter information relating land requirements (ha) for this process to hydraulic loading (m/day) (or
storage capacity for storage processes);
Capacity
Land Area
Poinl
mjdgx
hectare
2
3
4
5
6
7
8
9
10
If more than one land requirement curve is defined (in Question 18 and 19), the one producing the
highest land area will be used.
53
18. Enter information relating land requirements (ha) for this process to organic loading (metric tons
BOD/day):
Capacity
Land Area
Point
tons BOD/dav
hectare
2
3
4
5
6
7
8
9
10
If more than one land requirement curve is defined (in Question 17 and 19), the one producing the
highest land area will be used.
,
19. Enter information relating land requirements (ha) for this process to solids loading (metric tons dry
solids/day):
Capacity
Land Area
Point
tons dry solids/dav
hectare
,
.
1
•
•
2
.
•
••
•
.
;
•
• •
3
4
•
•
.
•
' '
.
.
.
.
•
.
•
.
.
•
8
9
•:;
'
.
'•
.
'•
'
.
.
.
•
•
•
.
_
_
_
_
_
_
_
.
.
.
•
.
.
•
'
.
.
'
_
'
10
'
.
1
••;
•
•
'
;
'.
•
•
•••'
'.;,
'
•
6
;
*
.
'
'
5
7
•
• • •
•
.
\
'
'
: •
'
-
. .''
•*..
• .
•
•'•*
. 'A
'
If more than one land requirement curve is defined (in Question 17 and 18), the one producing the
highest land area will be used.
20. Equipment items that are required for operation and maintenance
Electric motors
Electronic test equipment
Hand tools
Hoist
Laboratory instruments
•
•
•
'
•
•
'
of this process:
Portable generators
Portable water pumps
Water sampler
Welding equipment
•
•
•:":
;
'•'?.
J
•'•].
-ij
£
.
'
The list of O&M equipment types is designed to represent the "general types" of equipment necessary
to operate and maintain various "technical classifications" of water and wastewater treatment systems,
The list was not meant to be inclusive of all equipment requirements. Studies performed in the 1970's
indicated that this equipment list comprised the principal components related to the supportable water
and wastewater treatment technologies.
•
•
•
'
.
•
/
|
%
..;
I
54
21. Chemicals that are required for operation and maintenance of this process:
Acids - neutralization
Coagulant aids
Activated carbon
Copper sulfate
_ _ Aluminum sulfate
Ferric chloride
Ammonia
\ Ferrous/ferric sulfate
_,
Bromide
Hydrogen peroxide
_
Calcium carbonate
Iodine
Calcium chloride
Lime/dolomite
Calcium hypochlorite
Oxygen
„ _ Carbon dioxide
Ozone
Carbon source
Polyelectrolytes
Chlorine dioxide
Potassium permanganate
Chlorine gas
Soda ash
Sodium bicarbonate
Sodium carbonate
Sodium chloride
Sodium fluoride
Sodium hydroxide
Sodium hypochlorite
Sodium metabisulfate
Sodium nitrate
Sodium nitrite
Solvents
Steam
Sulfur dioxide
These chemicals represent the cumulative list of chemicals that are required in the water and
wastewater treatment processes included in this program. No process requires all of the chemicals, and
many processes do not require any chemicals. Availability of chemical supplies can be interpreted
several ways. The most restrictive definition would be to indicate only those chemicals which are
immediately available at the local or regional level. This means a local supplier has the chemicals in
their inventory at all times. For example, liquid bleach might always be available, commercially white
gaseous chlorine might not always be available. If the chemical needs to be imported only for this use,
then it should not be listed as available. There are many examples in a variety of socio-economic
cultural settings where systems have failed due to unavailability of a critical chemical. A good
example would be lack of gaseous chlorine for a community water supply system.
22. Types of media that are requiredfor operation and maintenance of this process:
Activated Carbon
Gravel
Resins
Rock
Membranes
Anthracite
Sand
Aquatic macrophvtes
Plastic
Wood
Porous aeration material
Diatomeceous Earth
Garnet
Media refers to process support media that is lost, saturated, consumed, eroded, and or corroded in use.
23.
Laboratory supplies that are required for operation and maintenance of this process:
Non-Electrical Lab Equipment
Simple Electrical Lab Equipment
Process Control Testing
Sophisticated Lab Equipment
Laboratory equipment refers to the equipment, spare parts, and technical manuals required for O&M.
•
Non-electrical equipment refers to color comparators, refractometers, thermometers
Imhoff Cones, methylene blue DO testing, etc.
•
Process control equipment refers to digital or analog sensors integrated into control
system to allow for remote operations based upon process condition. This includes pH
system, DO system, chlorine/dechlorination systems, remote equipment operators, etc.
•
Simple electronic laboratory equipment refers to incubators, vacuum pumps, drying
ovens, probe/meter instruments, simple spectrophotometers, volumetric testing
equipment.
•
Sophisticated laboratory equipment refers to GC, AA, fluometers, mercury analyzer,
complex dual beam spectrophotometers, computers coupled with analytical equipment
output, incubators, etc.
55
24. Material Required for Operation and Maintenance
Building Blocks
Cement
Clay
Clay liner
CobbleStone
Corrugated Aluminum or Tin
Fiber Reinforced Plastic
Fiberglass
Geotextile Liner
Hand Pumps
Hand Tools
Imported Processes
Mixers
Motorized Pumps
Motors
Plastic Pipe & Fittings
Programmed Logic Controllers
Rehar/Reinforcing Steel
Sand/Gravel for Concrete
Small Barrels
Steel/Fabricated Tanks
Steel Pipes & Fittings
Wire/'Electrical Supplies
Wood/Lumber
The list of O&M construction material list represents the type of material commonly found with various
technology types. This is not an inclusive list of all the materials necessary to operate and maintain
systems, only a principle component list of those found to exist in a wide range of technology types.
The most critical items found on this list are those associated with higher technology types. Simpler
technologies generally require simpler construction materials to operate and maintain.
25. Process control equipment requiredfor operation and maintenance of this process:
Analog/meter controls
_ _ _ PL C process controllers
Mechanical controls
Pneumatic controls
_____ PLC status indicators
The items in the list refer to the type of control system in the treatment process. It is assumed that
many plants will have all of these types of control equipment.
26. Types of energy required for operation and maintenance of this process:
electricity - intermittent
electricity - reliable
gasoline/diesel - intermittent
gasoline/diesel - reliable
natural gas - intermittent
natural gas - reliable
27. Enter information relating operation and maintenance costs (1992 USS) for this process to hydraulic
loading (m/day) (or storage capacity for storage processes):
Point
1
2
3
4
5
6
7
8
9
10
Capacity
rrf/dav
Cost
10001992 USS
Be sure to report cost in 1992 USS. Costs will be brought up to the first year of the project using
inflation rate data provided in the community profile. If more than one cost curve is defined (in
Question 28 and 29), the one producing the highest cost will be used. Costs are adjusted to the local
community using the cost factors reported in Question 40 and 41 in the Community profile.
56
28. Enter information relating operation and maintenance costs (1992 USS) for this process to organic
loading (metric tons BOD/day):
Capacity
Cost
Point
tons BOD/dav
1000 1992 USS
, . .
1
________
2
.
.
' •
3
' •' '
.
'
' :.•
•
•
:
4
•
5
•
•
•
:
'
'
:
•
•
•
•
•
•
•
•
•
.
6
.
_
' •
'
'
_
_
_
_
_
_
:
• '
7
'
8
9
10
. '
_
'
-
'
' • •
_ _ _ _ _ _
Be sure to report cost in 1992 USS. Costs will be brought up to the first year of the project using
inflation rate data provided in the community profile. If more than one cost curve is defined (in
Question 27 and 29), the one producing the highest cost will be used. Costs are adjusted to the local
community using the cost factors reported in Question 40 and 41 in the Community profile.
29. Enter information relating operation and maintenance costs (1992 USS) for this process to solids loading
(metric tons dry solids/day):
Capacity
Cost
Point
tons BOD/dav
10001992 USS
1
2
'
.:.
'
. '
3
:
4
5
8
•
•' •
•
••
.
______
•
6
7
:;
•
:
.
••
'•
•
:
'
'
'
'
'
'
•
'
9
10
Be sure to report cost in 1992 USS. Costs will be brought up to the first year of the project using
inflation rate data provided in the community profile. If more than one cost curve is defined (in
Question 27 and 28), the one producing the highest cost will be used. Costs are adjusted to the local
community using the cost factors reported in Question 40 and 41 in the Community profile.
30. Please give the breakdown of operation and maintenance costs by percentage distribution in the categories
below:
Category
Percent
Concrete
______
Earthwork
,„
Labor
_____
Manufactured Equip.
Pipes, Valves, Instrumentation
________
Steel
Structures
31. What is the solids production rate (kg/m3dry weight) for this process?
••••..-•
,' . .:
This question "estimates" the amount of dry solids produced by a process. This is not a weight
produced dynamically based upon the influent constituent level, and subject to chemical dosage and
removal efficiency. This is an average number and is only useful at the planning level.
57
32. What is the percent moisture of solids?
This information is used to calculate a bulk density of the solids material based upon its water content.
The percent moisture of solids vary depending upon the processes, the relative humidity, and the type
and length of storage.
33. For each water quality constituent (including flow rate), provide the minimum and maximum value
allowable in the water entering the process for it to function properly.
This question places influent upper and lower limits on constituent concentrations entering a process.
A train is infeasible if these limits are violated for a process in the train. Only enter data for those
constituents for which upper or lower bounds are known. These limits enforce to some extent the
integrity of the ordering of processes in the treatment train since placing a process out of order
frequently produces a constituent influent value exceeding a design limit. The full list of constituents is
available in Table 3.2.
34. For each water quality constituent, provide the mean, minimum and maximum percent treatment removal
efficiency that can be expected of this process.
This question identifies the effectiveness of the process in removing water borne constituents. The data
in this section comes from textbooks, reports, literature values, vendor material, and personal
communication. A range of removal efficiencies (high, mean, and low) is listed for those parameters in
which data can be obtained.
An attempt was made to obtain the highest quality data available for the key water, wastewater, and or
reuse constituents. In all cases, there is not a complete set of removal efficiency for all constituents.
As new removal data is developed, the process can be copied and the new data can be added. The full
list of water quality constituents is provided in Table 3.2.
35. What is the level of adaptability of the process to upgrading?.
Low
Medium
High
This question deals with the ability of the process to be upgraded in its capacity to process constituents
by not significantly increasing the footprint and/or infrastructure within the processes. This does not
necessarily apply to simple modularization of the processes. An example would be replacing the sand
in a rapid sand filter with a dual media.
36. What is the level of adaptability of the process to variable flow?
_ Low
Medium
High
This question deals with the processes ability to handle wide fluctuations in flow. This is most
important when dealing with communities that have high inflow and infiltration in their sewage system.
An oxidation pond has high adaptability to flow variation, compared to complex mixed activated
sludge that has low adaptability to flow variation.
37. What is the level of adaptability of the process to change in influent?
Low
Medium
High
This question addresses the processes ability to handle wide variations in the influent concentration of a
particular constituent. A good example would be the low adaptability of UV disinfection to wide
variations of turbidity level.
7.3.4 Siting Tab Questions (38-45)
38. Enter the maximum allowable monthly precipitation (mm) for proper functioning ofthis process:
__
39. Please enter the minimum allowable ground surface temperature (°C) for proper functioning of this
process^
This question relates to the potential for the use of composting systems.
58
40. Please enter the maximum allowable depth tofrostline (m) for properfunctioning of this process.
This question relates to the potential for any water carriage component of a system or burial treatment
process as it relates to freezing conditions.
41. Check all soil types at depths from 0 to 2 meters for which this process can be constructed and function
properly.
gravel, coarse sand
_ coarse to medium sand
_fine sand to loamy sand
. sandy loam, loan
loam, porous silt loam
silty clay loam, clay loam
rocky
boulder
_ bedrock
The predominant soil depth question addresses several criteria for selecting on-site treatment systems.
Since the majority of on-site receptacles require excavation, the workability of soil to down to 1.5
meters is critical. Predominantly rocky soils are ideal for excavations. However, predominantly sandy
soils require special construction techniques to maintain sidewall structural integrity. Subsurface
geological formation (1.5 to 2.0m deep) is important in terms of the separation between wastewater
infiltration trenches and groundwater levels. Certain soil types (clay loam) can provide excellent
receptacle structures which are more or less water tight with a minimum of infiltration.
42. Please enter the minimum soil percolation rate (sec/cm) for proper functioning of this process:
This question addresses the processes use of percolation/infiltration for the movement of liquid into the
soil. A low value here would suggest the processes would not be appropriate for this setting due to
surface pooling; a high value might also be inappropriate due to the rapid movement of leachate into
potential groundwater drinking water supplies.
43. Please enter the minimum allowable wet weather depth to the water table (m) that this process can
accommodate: ^
______^__
_^_^__
The minimum depth to the highest level of groundwater affords optimum protection of a groundwater
resource utilized for drinking water.
44. What is the minimum horizontal separation distance (m)from this process to groundwater source?
The minimum distance between a sanitation device (receptacle/treatment/disposal/reuse) and a
groundwater source minimizes the potential for water borne disease transfer to humans drinking,
bathing, cooking, and/or collecting food supplies.
45. What is the minimum horizontal separation distance (m) from this process to natural watercourse?
The minimum distance between a sanitation device (receptacle/treatment/disposal/reuse) and a natural
watercourse minimizes the potential for water borne disease transfer to humans drinking, bathing,
cooking, and/or collecting food supplies.
7.3.5 Impact Tab Questions (46-55)
46. Is this process a potential source of ammonia or nitrate/nitrogen in the percolate? ,
This question addresses a liquid stream from a wastewater treatment process which has the potential to
contaminate a groundwater drinking water supply by the addition of ammonia, nitrite, and or nitrate.
47, Is this process a potential source of pathogenic organisms in shallow groundwater?
,
_
This question addresses a liquid stream from a wastewater treatment process which has the potential to
contaminate a groundwater supply by the addition of human pathogens.
59
48. Does this process produce the potential of nutrient loads (e.g. phosphorus) to freshwater receiving
systems ?
This question addresses the potential for eutrophication and/or hyper-eutrophication conditions to exist
in freshwater surface waters receiving treated effluent.
49. Does this process produce the potential of nutrient loads (e.g. nitrogen) to marine or estuarine receiving
systems ?
This question addresses the potential for eutrophication and/or hyper-eutrophication conditions to exist
in estuarine and nearshore marine coastal waters receiving treated effluent.
50. Does this process produce the potential for waterborne diseases in receiving surface waters?
This question addresses a liquid stream from a wastewater treatment process that has the potential to
contaminate surface receiving water by the addition of human pathogens.
5J. Does this process produce the potential for pathogenic water- or fomite-borne diseases from flies,
cockroaches, or rodents?
.
The question addresses the potential source of human pathogens via vectors such as flies, rats,
cockroaches resulting from this process.
52. Does this process produce the potential for mosquito vector borne diseases?.
This question addresses the potential for creating mosquito habitat (standing water).
55. Does this process require a significant and ongoing user and health education component for its successful
implementation?
.
„___
This question addresses the need for community participation and health education as an element in the
successful implementation of a water supply/sanitation project. The considerations for this component
should include time and budget for all phases of a project (planning, design, construction, management,
and operation and maintenance). WAWTTAR does not cost the education component.
54. Does this process produce the potential for odors within the sanitation device? _
This question addresses the potential for odors from within a sanitation device.
55. Does this process produce the potential for odors outside the sanitation device?
This question addresses the potential for odors outside a sanitation device.
7.3.6 On-Site/Miscellaneous Tab Questions (56-67)
56. Does this process require a government agency or institution to provide institutional supervision for
operation and maintenance?
This question addresses the long term sustainability and expansion of an on-site treatment and
collection system. This could be the most critical factor in terms of both the safe use and health
education component, the maintenance and operation of a community on-site system, and the expansion
in coverage of on-site systems for a community,
5 7. Can this process be used in multistory buildings?
This question relates to the on-site technology options available for multi-story buildings. There are
limited technologies available for sanitation for multi-story buildings.
58. What is the maximum population density (persons/km') that this process can accommodate?
Some on-site treatment systems are relatively land intensive, and are inappropriate in high-density
urban areas.
60
59. Is this process easily adapted/upgraded into a waterborne collection and treatment system?_
This question deals with potential use of an on-site process in an upgraded waterborne collection and
treatment system. In most communities, investment in on-site sanitation is the first step in a community
wastewater collection and treatment system. Some processes lend themselves more easily to
incorporation into a collected/wet wastewater system. For example, septic tanks could be used in
STEP centralized collection and treatment systems.
60. Does this process require defecating in a squatting position? .
61. Does this process require darkness at the receptacle?
Processes that require darkness at the receptacle can also provide habitat for vectors and vermin.
Darkened structures, usually cooler than surrounding areas, can harbor snakes, spiders, etc., which
deter the use of facility by children and adults.
62. Is this process easily adapted to unisex use?
63. Is this process easily used by children less than 4 years old?
64. Does this process require a daily addition of a carbon source (e.g. wood chips, paper, green waste, etc.)?
65. Please check each of the anal cleansing materials that can be accommodated by this process.
bulky, degradable
non-bulky, non-degradable
bulky, non-degradable
non-bulky, degradable
water
The type of cleaning materials relates to a series of constraints and sizing issues as the treatment trains
are developed and sorted through the community profile. For example, water cleansing requires an
aqueous receptacle, collection, and treatment component. Non-bulky/non degradable (rocks) cleansing
material requires a complete different set of conditions.
66. Please check each of these types of waste handling by users required by this process.
urine
treated sludge
nightsoil
treated and composted sludge
In many cultures, a community is dominated by negative values associated with the handling of various
levels of treatment of human feces and/or urine. The levels run from composted waste, human urine,
treated sludge, and raw human waste (night soil). The answer to these questions insures that a
treatment train does not violate the community's predominant cultural beliefs.
67. Please check each of the street widths that can be accommodated by this process:
<0.8 m (footpaths)
0.8 m-2.75 m (carts)
>2.75 m (automobiles)
Some transport and collection processes require a cart or vehicle. This question insures that a process
does not require street access widths in excess of the communities street widths.
61
APPENDIX A WATER REUSE
A.I OVERVIEW OF WATER REUSE
Water reuse is a common occurrence. Water shortages and the recent recognition in much of the
world of the need to conserve water has focused attention upon the value of intentional reuse.
Planners recognize the need for a hierarchy of water use in the community. Not all water need be
of the same quality, and the wastewater of a community should be considered a resource.
Wastewater should be seen as a source of usable water and a source of valuable nutrients, such as
nitrogen and phosphorus. As a resource, it has value that has been enhanced by its collection and
treatment.
Abundant supplies of clean surface and underground waters in the world have been taken for
granted until recent years. Severe contamination of many surface supplies has occurred.
Increasing instances of groundwater contamination are being found. Thus, our relatively fixed
volume of water may become less and less usable. Adequate pollution control measures must be
taken and conservation and reclamation of resources must become the rule.
Water has always been used and reused by humans. In the natural water cycle, evaporation and
precipitation is one form of reuse. The return of wastewater to the streams and lakes of the country
is common. The unplanned reuse of wastewater is not new. The planned reuse of wastewater for
beneficial purposes has been done in some areas for many years, but it is here that we need to
concentrate our efforts for far greater use of our wastewater.
The quality and quantity of wastewater produced by a community depends upon such factors as the
source of supply, population density, industrial practices, and even the attitudes of the local
population. The quality of the environment can be improved by reducing pollution at the source,
providing adequate treatment of the wastewater, and by recycling and reusing wastewater. Public
support and some change in social behavior will be required in most instances. Since there are
many different types of wastewater reuse and the term "reuse" has different meanings to different
people, the following definitions are offered:
•
Municipal Wastewater: The spent water of a community, consisting of water-carried wastes
from residences, commercial buildings, and industrial plants and surface or groundwater that
enter the sewerage system.
•
Advanced Waste Treatment: Treatment systems that go beyond the conventional primary and
secondary processes. Advanced waste treatment systems may include biological processes, the
use of chemicals, activated carbon, filtration or separation by membranes.
•
Indirect Reuse: Indirect reuse of wastewater occurs when water already used one or more times
for domestic or industrial purposes is discharged into fresh surface or underground waters and
is used again in its diluted form.
•
Direct Reuse: The planned and deliberate use of treated wastewater for some beneficial
purpose such as irrigation, recreation, industry, prevention of saltwater intrusion by recharging
of underground aquifers, and potable reuse.
Potable reuse can be further divided into two categories as follows:
:
62
Indirect Potable Reuse: The planned addition of treated wastewater to a drinking water
reservoir, underground aquifer, or other body of water designed for potable use that provides a
significant dilution factor.
Direct Potable Reuse: The planned addition of treated wastewater to the headwork of a potable
water treatment plant or directly into a potable water distribution system.
A.2 SPECIFIC CONSIDERATIONS GOVERNING REUSE
The reuse of treated effluents is most applicable where large volumes of water are used and the
wastes are not highly contaminated. The location and type of the treatment plant and the possible
transport of the renovated water are important considerations. A wastewater reclamation plant
need not always be located at the same place as the wastewater disposal point, nor should the
renovation process be dependent upon treating the total flow. Treatment processes work most
efficiently and economically when dealing with a steady flow of wastewater rather than with the
irregular flow normally experienced from urban sources. This condition can be obtained by
withdrawing only a part of the urban wastewater. As wastewater—treated or untreated—has been
reused in agriculture for a long time, many countries have developed standards for this purpose.
An important question is whether the reuse will result in multiple recycle. Multiple recycle
produces a buildup of refractory materials, especially inorganic ions, and may require the use of
demineralization or other specialized processes. In-plant reuse of industrial water, where actual
consumption is small, may lead to a high degree of recycle. However, reuse of municipal
wastewater, except for domestic reuse, probably would not lead to multiple recycle.
Another consideration in reuse is the character of the wastewater entering the treatment plant,
especially with respect to industrial pollutants. Care must be used to exclude materials that would
be detrimental to the reuse application. This is especially true for domestic reuse, but also applies
to less sophisticated reuse applications. These materials may not be those usually considered toxic.
For example, waters having heavy metal contamination or high total dissolved solids should be
considered unacceptable. Each reuse options has its own unique water quality requirement.
Another point that must be considered is distribution of the renovated water. A multiplicity of
piping systems, each one containing different quality renovated water may not be practical. If the
consumers are widely distributed, however, one piping system in addition to the existing municipal
water system is almost certain to be the most that will be economically realistic.
A.3 INDIRECT REUSE
As treatment of wastewater improves, future effluents will be less damaging to receiving water
quality. In the treatment of polluted rivers, the methods employed at present are based upon those
developed over the years for the treatment of relatively unpolluted river water. It appears that
sufficient note may not have been taken of the increasing proportion of wastes in many rivers.
It appears, therefore, that the public health aspects of the production of potable water from polluted
rivers should be reviewed. When rivers contain a high proportion of effluent, the production of
water from them should be regarded as analogous to the direct recovery of water from a sewage or
industrial effluent, and safeguards appropriate to the situation should be imposed. There is a need
for appropriate safeguards for the unintentional reuse of wastewater occurs widely because of the
use of river water for agriculture, recreation, and industrial supply.
63
A.4 DIRECT REUSE
Treated wastewater may be deliberately used in a planned way for a variety of purposes. If the
planning of wastewater treatment facilities can incorporate potential reuse options in the facility
planning process both environmental and economic benefits may be realized.
A.5 ECONOMICS OF REUSE
Pricing of water and all of the costs that go into the acquisition, purification, power and pumping,
transmission and distribution and support services is vastly complicated. Subsidies and variable
bookkeeping practices add to the difficulty of finding the true cost of water. The following is a
checklist for determining if wastewater reuse is potentially practical:
•
existing or future fresh water supply is limited
;
•
existing or future fresh water supply is relatively expensive
a
the area presently includes or will include individual entities who use high volumes of water
O municipal wastewater of relatively high quality is presently discharged for disposal
Q for improved wastewater effluent are impending or are anticipated
Water-short areas of the world may not have a choice-they will have to reuse wastewater.
WAWTTAR emphasizes the need for appropriate technologies consonant with local socioeconomic conditions. Some of the factors, which severely handicap projects to provide safe
drinking water and efficient sewage disposal, are:
•
shortage of resources (including trained personnel and finances)
•
lack of governmental support within the developing countries
•
inadequate institutional structures (insufficient organization and administration)
•
lack of local interest and acceptance of the project
•
capital and O&M cost recovery
Planning for adequate water supply and sanitation must be considered an integral part of the
development process, and overall national plans should be formulated and implemented. Each
country should make use of its own water resources agency to collect pertinent data and to plan
with a regional approach rather than a case-by-case approach. Efforts should be made to innovate
and test treatment technologies that are appropriate for their setting. Strong ties should be
established between water agencies and universities. Planning tools should be made available to
assist governments in the implementation of water supply and sewage schemes. Frequently, proper
sewage treatment and excreta disposal have been given such a low priority that pollution control
has been postponed until the problem was too great for a solution using available community
resources. A national plan and greater governmental involvement will help to alleviate this
problem. National planning efforts should serve as the framework for technology selection,
institutional development, and financing/cost recovery.
64
APPENDIX B DELPHI PROCESS
B.I
SYSTEM COMPARISON SPREADSHEET
One of WAWTTAR's main uses lies in helping the user go through a true design process,
examining as many options as possible rather than narrowing down on one favored technology
from the start. We have included a spreadsheet example showing how the information supplied by
WAWTTAR can be used in a Delphi selection process. The spreadsheet Delphil.xls is located in
the directory support in the WAWTTAR home directory as a Microsoft Excel 5.0 file.
B.2 DESCRIPTION OF WORKSHEETS
The workbook file contains four sheets: two data entry sheets and two calculation sheets. Data to
be entered by the designer are in shaded (light blue) cells; other cells perform automatic
calculations and generally do not need to be changed by the user. The first sheet, entitled
Parameters, lets the designer pick selection criteria and enter basic information.
•
Six selection criteria are already entered: construction cost in thousands ofUSS, O&M cost
in thousands of USS, land requirements in acres, and the three dimensional adaptability
indices (adaptability to changes in influent quality, adaptability to varying hydraulic head,
and adaptability to upgrades).
•
Space has been reserved for up to seven water quality constituent concentrations. In our
example, we use five (suspended solids, CBOD, NBOD, phosphates as phosphorus, and
nitrates as nitrogen).
•
For each criterion, including the ones already entered, the designer picks a weight, and the
spreadsheet calculates the total point value. All treatment trains evaluated will be
automatically ranked from zero to 10 for each criterion by the spreadsheet; this will then be
multiplied by the weight picked by the designer for this criterion. The maximum point
value is given by the sum of all criterion weights multiplied by 10 (maximum rating for a
given criterion). In our example, the criteria add up to 2.00, yielding a maximum point
value of 20.
•
In addition, the Parameters sheet also asks some financial data: the base inflation rate, the
number of periods a year (in our example, it is quarterly), the year of reference, and the land
cost in 1992 dollars.
The second sheet is called Basic Data, and allows the designer enter the information on each
treatment train to be used in the selection process.
•
Space has been reserved for 30 systems.
•
For each system, the user enters a name or identification number, and the values obtained
for each criterion form the WAWTTAR output (feasible trains).
The third sheet, Comparison, performs the ranking calculations for each system using the
information supplied by the designer in the first two sheets. These systems will now receive a
score, from zero to the maximum point value (0 to 20 in our example). The highest score is the
preferred alternative according to the designer's selection criteria and weight.
65
It is important to remember that this is an indicative score, not a final optimization result. Slight
changes in the weighing criteria could change the scores dramatically, as could slightly differences
in the WAWTTAR community data (causing different WAWTTAR output results). However,
when there are many alternatives to compare, this scoring method allows the designer to narrow the
options to the "top" five or six.
The Comparison sheet will not sort the alternatives by rank, but this can easily done by the user by
copying the value (not the formulas) into another sheet and performing a Sort operation.
The fourth and last sheet, Current Cost, brings WAWTTAR's 1992 costs to current value for the
year of reference (1999 in our example.)
66
APPENDIX C ECONOMIC CALCULATION METHODOLOGY
WAWTTAR allows the user to specify whether costs are computed on an annual or total project
basis. The following section presents the economic calculation methodology used by WAWTTAR
for both the total cost basis and annual cost basis.
C.I
TOTAL COST BASIS
If the total cost basis has been selected, WAWTTAR calculates capital, O&M and land costs
according to the following methodology.
C.I.I
TOTAL CAPITAL COST
The total capital cost of each treatment process is drawn from the capital cost vs. flow/loading
curves stored in the corresponding process tile in 1992 US dollars. The cost of each treatment
process is multiplied by the percentage contribution of each cost category and the local cost index
corresponding to each category, to yield the adjusted capital cost per category in 1992 US dollars.
jk
~ICjk
*ikrj
where;
j
2
- adjusted cost of treatment process k in cost category j , 1992 dollars.
= total cost of treatment process k, 1992 dollars.
X.,
=
fraction of the total cost of treatment process k in cost category j .
Yj - local cost index corresponding to categoryy.
The total adjusted cost of a treatment process in 1992 dollars is the sum of the adjusted costs of
each cost category.
(2)
rf
where;
ACk
= total adjusted cost of a treatment process k, 1992 dollars.
592
ACjk
= adjusted cost of a treatment process k in cost category/.
The total cost of a treatment process in the base year is calculated by inflating the 1992 total cost
via the inflation rate.
TC$kIY={ACSk92}\
+
r)(IY-m2)
0)
where;
TCk
= total cost of treatment process k in the initial year of the project.
ACk
= total adjusted cost of treatment process k.
r = inflation rate.
IY= initial year of the project.
The total capital cost of a treatment train is the sum of the total capital costs of all treatment
processes in the train.
TCm
$Y
=
v/t
(4)
where;
CTV
TC
= total capital cost of a treatment train in the initial project year.
G* TV
TCk
C.1.2
= total capital cost of treatment process k in the initial project year.
TOTAL LAND COST
The land use requirements for each treatment process in hectares are drawn from the x-y plots of
land use vs. flow, BOD loading, or solids loading. The land requirements are then multiplied by
the land value in 1992 US dollars per hectare stored in the community file to obtain the total land
cost per treatment process in 1992 dollars.
TLCi91 ={LCm\LRk)
(5)
where;
SO?
TLCk
= total land cost for treatment process £ in 1992 dollars.
LC
= 1992 land cost per hectare.
LRk = land requirement for process k in hectares.
The land cost is then inflated to the initial project year using the inflation rate for the given
community.
TLC$kIY =(TLCsk92Xl + rfY-m2^
(6)
where;
ff TV
TLCk
= total cost of land for treatment process k in the initial project year.
TLCk
- total land cost for treatment process k, 1992 dollars.
The total land use and land cost for a treatment train are the sum of the land use and land cost for
all treatment processes.
TLCSIY
.
•
"
.
•
= Y,TLCkIY
v
*
W
:
•
•
•••
•
•
•
•
.
.
where;
TLC
cry
tf
ry
TLCk
C.1.3
:
- total land cost for the treatment train in the initial project year.
= total land cost for treatment process k in the initial project year.
OPERATIONS AND MAINTENANCE COST
Annual O&M costs are drawn directly from curves of annual O&M cost vs. flow/loading in each
process file. The annual O&M cost of each treatment process is multiplied by the percentage
contribution of each O&M cost category and the local cost index corresponding to each category,
to yield the adjusted annual O&M cost per category in 1992 US dollars.
AOMfk2=OMk$92XjkYj
where;
AOM j k
OMk
Xjk
= adjusted annual O&M cost of process k in cost category j , 1992 dollars.
= annual O&M cost of treatment process k, 1992 dollars.
= fraction of the annual O&M cost of treatment process k in cost category j .
(8)
68
Yj = local O&M cost index corresponding to category/
The annual adjusted O&M cost of a treatment process in 1992 dollars is the sum of the annual
adjusted costs of each cost category.
AOM$k92
=^AOM$JP
Y/.
(9)
where;
AOMk
= adjusted annual O&M cost for treatment process k, 1992 dollars.
AOM jk
= adjusted annual O&M cost of treatment process k for cost category j .
The annual O&M cost of a treatment process in the initial project year is found by inflating the
1992 annual O&M cost by the inflation rate.
OM$kIY ={AOM$kn\\
+
rfY-m2^
(10)
where;
cry
OMk
= annual O&M cost for treatment process k in the initial project year.
AOMk
= annual adjusted O&M cost for treatment process &, 1992 dollars.
The annual O&M cost in the initial project year for the treatment train is the sum of the annual
O&M costs for all treatment processes.
OMm
= %OM$kIY
V/t
(11)
.
where;
OM
= annual O&M cost for the treatment train in the initial project year.
* wy
OMk
= annual O&M cost for treatment process k in the initial project year.
The O&M cost for each succeeding year in the planning period is calculated by inflating the
previous year's O&M cost by the inflation rate.
OM$CY =(oM$PY)\
+ r)
(12)
where;
OM
= O&M cost the treatment train in the current year of the planning period.
OM
= O&M cost of the treatment train in the previous year of the planning period.
This calculation results in a series of / annual costs starting with the initial O&M cost and ending
with the O&M cost in the last year of the planning period. This series is summed to obtain the
total O&M cost.
TOM$IY = j^OMfCY
••
.
/=I
(13)
v
•••.;.
where;
TOM
= total O&M cost of the treatment train over the planning period.
OM[
= annual O&M cost in year/of the planning period
/ = year of the planning period,
n = last year of the planning period.
C.1.4
TOTAL PROJECT COST
The total project cost is the sum of the total capital costs, the total land costs, and the total O&M
costs for the entire treatment train.
TPCm = TC$IY+TLCSIY+
TOM$IY
(14)
where;
<h r y
TPC
TC
TLC
TOM
C.2
= total project cost in the initial year of the planning period.
= total capital cost for the train in the initial year of the planning period.
= total land cost for the treatment train in the initial year of the planning period.
= total O&M cost for the treatment train over the planning period.
ANNUAL COST BASIS
If the annual cost basis has been selected, WAWTTAR calculates annual capital costs, annual
land costs and annual O&M costs according to the following methodology.
C.2.1
ANNUAL CAPITAL COST
The total cost of a treatment process k in the initial project year is calculated as in equations (1)
through (3). The total cost in the initial project year is amortized by the capital recovery factor
(CRF) appropriate for the interest rate and planning period specified in the community file.
AnCl17 =(TCr)0RF(i,n)
(15)
where;
AnCk
= annual capital cost of treatment process kin the initial project year.
TC$kIY
= total capital cost of treatment process k in the initial project year.
CRF(i n) = capital recovery factor for interest rate i and planning period n in years.
A special case arises if the planning period is longer than the economic life of a process stored in
the process file. In this case, the cost of the treatment process is amortized over the economic life.
The annual cost of the treatment train is the sum of the annual costs of all treatment processes.
AnCm =
where;
AnCm
= annual cost of the treatment train in the initial project year.
= annual cost of treatment process k in the initial project year.
C.2.2
ANNUAL LAND COST
The total cost of land for a given treatment process in the initial project year is calculated as in
equations (4) through (7). The total land cost in the initial project year is amortized by the CRF to
obtain an annual cost.
AnL\n ={LC%IY)CRF(i,n)
where;
(17)
7 0
AnLk
= annual land cost for treatment process k in the initial project year.
LC
= total land cost for treatment process k in the initial project year.
•••'$
The annual cost of the treatment train is the sum of the annual costs of all treatment processes.
AnL$ir =
where;
AnLSIY ~ annual land cost for the treatment train in the initial project year.
;
An.]}" = annual land cost for treatment process k in the initial project year.
C.2.3
H
ANNUAL OPERATIONS AND MAINTENANCE COST
j
Annual O&M costs are drawn directly from curves of annual O&M cost vs. flow/loading in each
process file. The annual O&M cost of each treatment process is multiplied by the percentage
contribution of each O&M cost category and the local cost index corresponding to each category,
to yield the adjusted annual O&M cost per category in 1992 US dollars, as in equation 8. The
adjusted O&M cost for each treatment process in 1992 US dollars is found via equation 9. The
annual O&M cost for each treatment process in the initial project year is then found via equation
10.
C.2.4
|
v
;
•;
TOTAL PROJECT C O S T
The total project cost given by WAWTTAR is the sum of the capital costs, the land costs, and the
O&M costs for the entire treatment train over the planning period. Capital, O&M and land costs
are all assumed uniform over the planning period; therefore, the total costs are simply the annual
costs multiplied by the length of the planning period.
TPCm=nUnCm+OMm+AnLm)
where;
TPC
AnCm
OM
AnL
= total project cost in the initial project year.
= annual cost of the treatment train in the initial project year.
09)
;
;
I
i
;
I
IY
- O&M cost for the treatment train in the initial project year.
= annual land cost for the treatment train in the initial project year.
n = length of the planning period in years.
,;
!