1
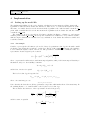
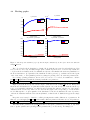
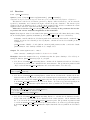
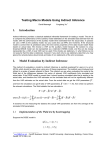
Shock Elasticities in Dynare User’s Manual Toolbox version 0.2∗ Jaroslav Borovička Lars Peter Hansen University of Chicago Federal Reserve Bank of Chicago University of Chicago National Bureau of Economic Research [email protected] [email protected] December 8, 2011 Abstract We provide a ready-to-use set of functions for Dynare/Dynare++ that calculates approximate sensitivities of asset prices and payoffs to structural shocks in DSGE models. The method is based on a quadratic approximation of shock elasticities introduced in Hansen and Scheinkman (2010), Borovička, Hansen, Hendricks, and Scheinkman (2011), and Borovička and Hansen (2011) that can be fully embedded in Dynare/Dynare++. ∗ We thank Ondra Kamenı́k, Michel Juillard and Junghoon Lee for useful discussions. All errors remain our own. The views expressed herein are those of the authors and not necessarily those of the Federal Reserve Bank of Chicago or the Federal Reserve System. Contents 1 Introduction 1 2 Quick-start guide 1 3 Installation 2 4 Implementation 4.1 Setting up the model file . . . . . 4.1.1 An example . . . . . . . . 4.2 Running the elasticity calculation 4.3 Parameter file . . . . . . . . . . . 4.4 Plotting graphs . . . . . . . . . . 4.4.1 Plotting graphs manually 4.5 Output file . . . . . . . . . . . . . . . . . . . 3 3 3 4 5 6 7 7 5 What the elasticity toolbox 5.1 Dynamics . . . . . . . . . 5.2 Shock elasticities . . . . . 5.3 Entropy decomposition . . does . . . . . . . . . . . . . . . . . . . . . . . . . . . . . . . . . . . . . . . . . . . . . . . . . . . . . . . . . . . . . . . . . . . . . . . . . . . . . . . . . . . . . . . . . . . . . . . . . . . . . . . . . . . . . . . . . . 9 9 10 10 6 Function reference 6.1 Functions . . . . . . . . 6.1.1 dynare elasticity 6.1.2 plot elast graphs 6.2 Parameter file . . . . . . . . . . 10 11 11 12 13 . . . . . . . . . . . . . . . . . . . . . . . . . . . . . . . . . . . . . . . . . . . . . . . . . . . . . . . . . . . . . . . . . . . . . . . . . . . . . . . . . . . . . . . . . . . . . . . . . . . . . . . . . . . . . . . . . . . . . . . . . . . . . . . . . . . . . . . . . . . . . . . . . . . . . . . . . . . . . . . . . . . . . . . . . . . . . . . . . . . . . . . . . . . . . . . . . . . . . . . . . . . . . . . . . . . . . . . . . . . . . . . . . . . . . . . . . . . . . . . . . . . . . . . . . . . . . . . . . . . . . . . . . . . . . . . . . . . . . . . . . . . . . . . . . . . . . . . . . . . . . . . . . . . . . . . . . . . . . . . . . . . . . . . . . . . . . . . . . . . . . . . . . . . . . . . . . . . . . . . . . . . . . . . . . . . . . . . . . . . . . . . 1 Introduction The elasticity toolbox implements the calculation of shock-price and shock-exposure elasticities constructed in Borovička and Hansen (2011). The toolbox integrates seamlessly with Dynare and Dynare++, and generates the shock elasticities from the second-order approximation of the model solution. The shock elasticities measure the sensitivity of expected returns and expected cash flows to the exposure to structural shocks. The economic theory underlying the construction in continuous time can be found in Hansen and Scheinkman (2010) and Borovička, Hansen, Hendricks, and Scheinkman (2011). Borovička and Hansen (2011) construct discrete-time counterparts and specifically focus on the second-order approximation utilized in the elasticity toolbox. The underlying idea is to develop valuation accounting methods that decompose expected returns associated with cash-flow streams into the contributions of individual structural shocks across different maturities of the payoffs from the cash-flow stream. Consider a single cash flow (e.g., a zero coupon bond, a consumption strip in the language of Lettau and Wachter (2007), or a dividend strip in Binsbergen, Brandt, and Koijen (2011)) maturing t periods ahead. The shock-exposure elasticity is a function of the current state and the maturity of the cash flow t that measures how the expected cash flow is exposed to a shock today. Similarly, the shock-price elasticity captures how the expected return on this cash-flow changes in response to this shock. Borovička, Hansen, Hendricks, and Scheinkman (2011) and Borovička and Hansen (2011) show how to decompose expected returns into the shock elasticities associated with shocks at different horizons. Consequently, shock elasticities can be viewed as fundamental building blocks of asset pricing moments. The toolbox also constructs decompositions of entropy measures analyzed in Alvarez and Jermann (2005) and Backus, Chernov, and Zin (2011). It turns out that shock elasticities and entropy decompositions share a common mathematical structure which we exploit. In conjunction with Dynare, the construction of shock elasticities yields several other benefits. First, shock-exposure elasticities can be interpreted as nonlinear versions of impulse response functions. Dynare and Dynare++ construct impulse responses in a nonlinear model by simulating it. The shock-exposure elasticities constructed using the elasticity toolbox are analytical, and thus they can be evaluated at an arbitrary point of the state space without a need to resimulate the model. Second, the elasticity toolbox produces a term structure of elasticities across many horizons without the need to specify large numbers of variables in Dynare. Every cash-flow stream or stochastic discount factor is represented by a single variable that defines the one-period increment in the logarithm of that object. The elasticity toolbox then builds up the term structure iteratively from the one-period increments. This version of the elasticity toolbox was tested with Dynare version 4.2.1, and Dynare++ version 1.3.7. 2 Quick-start guide This section provides a quick recipe for a reasonably experienced Dynare user on how to start using the elasticity toolbox as quickly as possible. 1. Download the Matlab files for the elasticity toolbox.1 Unpack them into a folder that is on Matlab’s path. 2. Include stochastic discount factor (prefixed sdf ) and cash flow (prefixed cf ) variables into your Dynare model file (modelname.mod). These variables have the form of one-period logarithmic growth rates. The extended model file may, for example, include the one-period increment in the logarithm of the stochastic discount factor of a recursive-utility representative household, and the increments in the logarithms of the cash flows associated with aggregate consumption and investment (see the example file example RBC.mod in the examples directory). In the code below, c stands for consumption, v for the continuation value of a representative household, i for investment, and da for the permanent shock which is used to scale model variables in order to obtain a stationary solution. 1 The current version is available at http://home.uchicago.edu/∼borovicka/software.html. 1 ... var sdf household cf consumption cf investment; ... model; ... sdf household = log(BETA) - GAMMA*(c - c(-1) + da) + (RHO-GAMMA)*(v+da - ev(-1)); cf consumption = c - c(-1) + da; cf investment = i - i(-1) + da; ... end; ... 3. Run Dynare or Dynare++ on the model file. Preferably, calculate the second-order approximation. By default, Dynare stores the results in the file modelname results.mat, and Dynare++ in modelname.mat. In the following, the latter is used. 4. Adjust the model parameters, using one of the three following options. In every case, you should set the model frequency in model periodlength and model periodname properly to calculate the right scaling of the shock elasticities. Shock elasticities and entropy decompositions are always annualized. (a) Edit directly the default file default elast parameters.m. (b) Copy the default model parameter file to modelname elast parameters.m, and edit that. (c) Name the parameter file arbitrarily, and call it using a second parameter when running the elasticity calculation. The code attempts to load every parameter file from the list above, in the given order, so that latter parameter settings overwrite the prior ones. 5. Run the elasticity calculation. File names are entered without extensions. The second parameter can be omitted. The code below opens the file modelname.mat with the model solution generated by Dynare, reads parameter values from the three parameter files described above (the last being param filename.m), and produces shock elasticities which are stored in the elast structure and in the file modelname elasticity.mat. elast = dynare elasticity(’modelname’, ’param filename’); 6. Shock-price and shock-exposure elasticity plots are produced by default. To inspect the results, check the elast structure, or the file modelname elasticity.mat. The following sections in the manual describe the implementation in more detail. 3 Installation 1. Download the latest version of the elasticity toolbox.2 2. Unpack the zip file into your preferred directory, say c:\elast toolbox\. 3. Add the directory to your Matlab. In Matlab, either use the menu File → Set path. . . , or type: addpath(’c:/elast toolbox/’); 4. Test the toolbox. Go to the examples directory (c:/elast toolbox/examples/), and run the following code. This should produce graphs with shock-price and shock-exposure elasticities for the two shocks in the model (in this example, no output file is generated but the graphs will be stored by default in (c:/elast toolbox/examples/graphs/). 2 http://home.uchicago.edu/∼borovicka/software.html. 2 dynare(’example RBC.mod’); dynare elasticity; 4 Implementation 4.1 Setting up the model file The fundamental building blocks of the elasticity calculations are increments in additive functionals — logarithms of cash flows and stochastic discount factors. These need to be defined in the Dynare model file. The name of a variable that denotes the increment in the logarithm of the cash flow must contain the cf prefix, while a variable that denotes the increment in the logarithm of the stochastic discount factor must contain the sdf prefix. The elasticity toolbox processes the model solution calculated in Dynare or Dynare++, and extracts variables prefixed with cf and sdf . Shock-exposure elasticities are calculated for every cash-flow variable, while shock-price elasticities are calculated for every combination of a stochastic discount factor variable and a cash-flow variable. 4.1.1 An example Consider a prototypical real business cycle model, driven by permanent technology shocks with a small predictable component in the growth rate of technology. The model file example RBC.mod provided with the toolbox defines the Dynare version of the model. The problem is to maximize the continuation value of a representative household given by the recursion Vt = (1 − β) Ct1−ρ 1 i 1−ρ 1−ρ h 1−γ 1−γ + βEt Vt+1 where γ represents the risk aversion toward intratemporal gambles, while ρ is the intertemporal elasticity of substitution, subject to the feasibility constraint α Yt ≡ A1−α Kt−1 = Ct + It t and the law of motion for capital Kt = (1 − δ) Kt−1 + It . The level of technology A is specified as dat+1 = log At+1 − log At = µ + xt + σa εa,t+1 where x is a stationary process xt+1 = ρxt + σx εx,t+1 . Notice that the shocks in the model have permanent components, which makes the model nonstationary. In the resulting Dynare code, variables will be scaled by the level of technology. The stochastic discount factor of the representative household is given by St+1 =β St Ct+1 Ct −ρ ρ−γ Vt+1 1 i 1−γ h 1−γ Et Vt+1 and the return on capital is Rt = α Kt−1 At α−1 3 + 1 − δ, which allows to write the Euler equation as 1 = Et St+1 Rt+1 . St To produce a stationary representation of the model, all endogenous variables Z should be scaled by A. If we are interested in a logarithmic expansion, we can define logarithms of the scaled quantities as zt = log Zt . At Increments of variables, however, are stationary even in the nonstationary version of the model. We can take advantage of this fact and define the stochastic discount factor functional and two cash-flow functionals as sdf householdt cf consumptiont cf investmentt = log St − log St−1 = log β − ρ (ct − ct−1 + dat ) + 1 + (ρ − γ) vt + dat − log Et−1 [exp ((1 − γ) (vt + dat ))] 1−γ = log Ct − log Ct−1 = ct − ct−1 + dat = log It − log It−1 = it − it−1 + dat Why is this advantageous? Impulse response functions constructed by Dynare or Dynare++ correspond to responses of the scaled versions of the variables, and thus need to be readjusted by adding back the response of the shock. On the other hand, the shock elasticities constructed by the elasticity toolbox represent responses of the original, unscaled variables. In this way, the elasticity toolbox can directly produce the correct shock elasticities with respect to permanent shocks, which are often important in asset pricing applications. Naturally, the stationary counterparts of the shock elasticities can be produced as well by defining stationary versions of the stochastic discount factor and cash flows. The following code is a fragment from the model file example RBC.mod, available in the elasticity toolbox. ... var sdf household cf consumption cf investment; ... model; ... sdf household = log(BETA) - GAMMA*(c - c(-1) + da) + (RHO-GAMMA)*(v+da - ev(-1)); cf consumption = c - c(-1) + da; cf investment = i - i(-1) + da; ... end; ... 4.2 Running the elasticity calculation The core function providing the user interface is dynare elasticity. This function retrieves the solution of a model calculated by Dynare or Dynare++, processes it, and calculates the shock-price and shock-exposure elasticities for objects specified in the model file. Important: In order to generate correctly annualized shock elasticities, you need to specify the correct frequency at which the parameter values are defined (the default is quarterly). The frequency can be set by modifying the parameter file. Annualization implies that shock elasticities are divided by the square root of period length, and entropies by the period length. See Section 4.3 for details. If you use Dynare++, you would typically run (for a generic model filename modelname.mod): system(’dynare++ modelname.mod’); // or run dynare++ from the command line elast = dynare elasticity(’modelname’); // Dynare++ produces an output file called modelname.mat 4 Remember you need to set the path to your Dynare++ executable file properly. The elasticity toolbox processes the output from Dynare++, plots the elasticity graphs (unless switched off in the parameter file, see Section 4.3), and returns the elast structure that contains the results (see Section 4.5). The elast structure is also stored in the file modelname elasticity.mat. If you use Dynare, you can use two alternatives. If you invoke the elasticity calculation right after running Dynare, the elasticity toolbox can read the variables directly from memory. For example: dynare(’modelname.mod’); elast = dynare elasticity; In this way, the results are not stored in a file (the toolbox does not know the filename) but you can store the elast structure manually into a file for later use. You can also provide a filename as an input parameter. Dynare typically stores the output in a Matlab data file named modelname results.mat. If you wish to load the Dynare model solution later, you can use: dynare(’modelname.mod’); % some code here system(’ren modelname results.mat modelname.mat’); elast = dynare elasticity(’modelname’); // or use mv on Unix machines Renaming the file with the Dynare model solution is not necessary. The only consequence of not changing the file name is that modelname will subsequently be replaced by modelname results, and the elasticities will be stored in modelname results elasticity.mat. The elasticity toolbox automatically detects if the supplied file with the model solution was produced by Dynare (it searches for variables named oo , M , and options ), or by Dynare++ (any other case). There is no extensive checking that the files have the right structure. The structure of the stored output is described in Section 4.5. 4.3 Parameter file All parameters that determine what is calculated and displayed are stored in the parameter file. The parameter file contains essential parameter settings that include model frequency, choice of elasticity calculations, and model adjustments. The parameter file is a piece of Matlab code that defines fields in the param structure. Default parameter values are stored in the file default elast parameters.m. This file also contains a detailed description of all settings. Further details are provided in Section 6.2. For every model with Dynare solution stored in, say, modelname.mat, Dynare additionally searches for the file modelname elast parameters.m. This file should contain any user-specific settings. One way to produce it is to copy the default parameter file and modify the parameters. At least the model frequency must be set correctly (the default is quarterly), so you will always need to set something up manually. Finally, you can also provide a user-specific parameter filename as a second argument when running dynare elasticity. You typically want to do this if you have multiple variants of the model file but want to apply the same user-specific setting to all of them, or, alternatively, one model file that should be evaluated using different settings. The following code requests to retrieve parameters from param filename.m. dynare elasticity(’modelname’,’param filename’); The elasticity toolbox loads all files sequentially, using values defined in later files to override values from previous files. To summarize, the sequence is: 1. default elast parameters.m. 2. modelname elast parameters.m 3. param filename.m, where param filename is the second (non-mandatory) argument specified when calling the dynare elasticity function. 5 4.4 Plotting graphs −3 cf_consumption 12 cf_investment x 10 0.01 eps_a eps_x eps_a eps_x 10 0.008 8 6 0.006 4 2 0.004 0 0.002 −2 0 −4 0 20 40 60 maturity (quarters) 80 100 0 20 sdf_household − cf_consumption 80 100 sdf_household − cf_investment 0.09 0.09 eps_a eps_x 0.08 0.07 0.06 0.06 0.05 0.05 0.04 0.04 0.03 0.03 0 20 40 60 maturity (quarters) 80 eps_a eps_x 0.08 0.07 0.02 40 60 maturity (quarters) 100 0.02 0 20 40 60 maturity (quarters) 80 100 Figure 1: Shock-exposure elasticities (top row) and shock-price elasticities (bottom row) for the model defined in example RBC.mod. The code plots the shock elasticities by default. Shock elasticities are state-dependent (if the model is solved to the second order), and thus an appropriate evaluation point needs to be chosen. By default, the code plots the shock elasticity at the deterministic steady state, and simulates the stationary distribution of the shock elasticities to plot quartiles of the distribution. Other options (e.g., evaluation at the fixed point of the decision rule, or other quantiles), and more settings for plotting can be chosen in the parameter file. If you change plotting parameters, the model does not need to be resolved, it is sufficient to call the plot elast graphs function with the elasticity results file as a parameter: plot elast results(’modelname elasticity’); Figure 1 plots the shock-exposure and shock-price elasticities for the example RBC model. Each panel shows the shock elasticities for one particular cash flow (in the case of shock-exposure elasticities in the top row), or one particular combination of a cash flow and a stochastic discount factor (in the case of shock-price elasticities in the bottom row). There are two curves in the graph, each corresponding to one shock in the model. Although the code plots quantiles of the distribution of the shock elasticities, the state dependence of the shock elasticities in this model is extremely limited, so that the whole distribution appears as a single line. In specific cases, it may be desirable to call the plotting function with a different set of parameters. In that case, you can supply plot elast results with a different parameter file name as a second parameter. plot elast results(’modelname elasticity’,’param filename’); This will call the parameter file param filename.m, and update parameters (obviously, it only make sense to update parameters for plotting). In the parameter file, you can, among other things, set: 6 1. Points of the state space (deterministic steady state, fixed point of the nonlinear rule) at which the elasticities should be evaluated. 2. Quantiles of the simulated distributions of elasticities. 3. Horizons, grouping, and other layout features. 4.4.1 Plotting graphs manually Graphs can be plotted manually as well, using the output stored in the elast structure (see Section 4.5 for how the elasticities are stored). The following Matlab code fragment plots the shock-price elasticity of cash flow k priced using stochastic discount factor j for shock m, evaluated at the fixed point of the decision rule: load(’modelname elasticity.mat’); % results stored in elast j = 1; % stochastic discount factor index k = 1; % cash flow index m = 1; % shock index disp(sprintf(’SDF: %s, cash flow: %s, shock: %s’, ... elast.Eprice(j,k).sdf name, elast.Eprice(j,k).cf name, elast.model.shock names(m))); figure; plot(squeeze(elast.Eprice(j,k).XHBAR(m,:,:))); Similarly, you can plot elasticities corresponding to quantiles of the elasticity distribution, specified in param.simul quantiles in the parameter file. For instance: plot(squeeze(elast.Eprice(j,k).simul quantiles(m,n,:))); plots the n-th of the list of quantiles in param.simul quantiles (j, k, m are as previously). 4.5 Output file Shock elasticities are stored in a data structure named elast, and are returned in two ways. elast = dynare elasticity(’modelname’); 1. As a return argument of the dynare elasticity function (if specified). 2. In a file named modelname elasticity.mat. If no model name is specified (when dynare elasticity is called immediately after solving the model using Dynare, and retrieves the model solution from the memory), then no output file is saved. The output file contains the same elast structure as the return argument of the function. The elast structure contains the following fields: • param - The list of all parameters used in the model. See the file default elast parameters.m and Section 6.2 for detailed explanations. • model original - The model solution, generated by Dynare/Dynare++. The notation corresponds to Dynare++. – X - the dynamics of the law of motion for the economy ′ ′ ′ ′ ′ ′ ′ (1) ⊗ Xt Wt+1 = + A2 Xt′ Wt+1 Zt+1 = A0 + A1 Xt′ Wt+1 = A0 + Ax Xt + Aw Wt+1 + Axx (Xt ⊗ Xt ) + 2Axw (Xt ⊗ Wt+1 ) + Aww (Wt+1 ⊗ Wt+1 ) where Zt+1 contains both state variables (at indices given by state vars), and other observed variables. The X field also contains specific values of X (expansion points, steady state, etc.), see the description of elast.X below. The covariance matrix SIGMA2 must be an identity matrix. 7 – expansion-order - order of approximation – state-vars - vector of indices of the variable vector X that contain state variables – var names - names of all variables in X. var names tex contains the names of variables in TEX format, if model is solved by Dynare. – shock names - names of all shocks in W . shock names tex contains the names of variables in TEX format, if model is solved by Dynare. • model - The model solution to the second order, in recursive-linear form generated by the elasticity toolbox. This specification of the model dynamics doubles the number of state variables. The structure of the data is the same as for model. • X - the dynamics of the law of motion for the economy, reduced to only state variables. The structure contains both the matrices for the Dynare++ notation (1), as well as the matrices for the notation (3) used in Borovička and Hansen (2011). – A.. - coefficient matrices for the notation (1) – THETA., LAMBDA. - coefficient matrices for the notation (3) – XSTEADY - deterministic steady state of the model – XEXP - the point around which the expansion is expressed (this can be different from the deterministic steady state in Dynare++ when centralization of the law of motion is used (which is the default)) – XMEAN - mean of the stationary distribution obtained from Dynare. Not recommended to be used. Full higher-order approximations typically do not have stationary distributions because the dynamics are only locally stable. In ill-behaving models, XMEAN does not need to provide meaningful information. – XHSTEADY - deterministic steady state, as a deviation from XEXP. – XHMEAN - mean of the stationary distribution, as a deviation from XEXP. – XHBAR - ‘fix point’ of the deterministic rule, as a deviation from XEXP. This fix point is obtained by iterating on (1) while setting all shocks Wt to zero. For a first-order expansion, XHBAR is zero by construction. XHBAR will also be zero when the model is solved using Dynare++ to the second order with the --centralize option activated (default setting) because the centralization is deliberately chosen so as to zero out XHBAR. – SIGMA - a matrix with shock volatilities on the diagonal. Must be an identity matrix. • Ecf - vector of cash flow specifications. The length of the vector corresponds to the number of cf variables in the model file. Every cash flow is specified as a function H (x, w) that represents the one-period increments in the logarithm of the cash-flow Yt+1 − Yt = H (Xt , Wt+1 ) = Γ0 + Γ1 X1,t + Γ2 X2,t + Γ3 (X1,t ⊗ X1,t ) (2) +Ψ0 Wt+1 + Ψ1 (X1,t ⊗ Wt+1 ) + Ψ2 (Wt+1 ⊗ Wt+1 ) . The coefficient matrices for one cash flow correspond to one observational equation from the law of motion (1). – GAMMA., PSI. - coefficient matrices (row vectors). • Esdf - vector of stochastic discount factor specifications. See Ecf for details. • Eexposure - a tensor containing the shock-exposure elasticities. The shock-exposure elasticity of cashflow k with respect to shock m at horizon t is stored in Eexposure(k) and takes the linear form εkm (x, t) = Γ0 (m, 1, t) + Γ1 (m, :, t) x1,· 8 – XSTEADY - shock-exposure elasticity evaluated at the deterministic steady state – XEXP - shock-exposure elasticity evaluated at the point around which the expansion is expressed – XBAR - shock-exposure elasticity evaluated at the ‘fix point’ of the deterministic rule – XMEAN - shock-exposure elasticity evaluated at the mean of the distribution of X (calculated by Dynare or Dynare++) – simul quantiles - shock-exposure elasticity evaluated at the quantiles of the distribution of elasticities. simul quantiles(m,n,t) is the elasticity with respect to shock m, at quantile n and horizon t. – cf name - name of the cash flow variable for which the shock-exposure elasticity is calculated – cf index - index of the cash flow variable in the vector of variables – name - name of the shock-exposure elasticity function used for graph titles, etc. – sdf name, sdf index - unused • Eprice - matrix of shock-price elasticities. Eprice(j,k) contains the shock-price elasticity of cash flow k under stochastic discount factor j. For details, see Eexposure. The only additional fields defined are: – sdf name - name of the stochastic discount factor variable for which the shock-exposure elasticity is calculated – sdf index - index of the stochastic discount factor variable in the vector of variables • Eentropy sdf, Eentropy cf - (experimental, needs more testing) entropy decomposition for multiplicative functionals representing the stochastic discount factors and cash flows, respectively. These fields have the same structure as Eexposure or Eprice. The only exception that the first dimension in the GAMMA. and X... matrices does not index the shock but has only one element which represents the entropy. By default, entropies are not plotted (see Section 6.2 for details). 5 What the elasticity toolbox does The construction of the shock elasticities performed by the toolbox is based on theory developed in Hansen and Scheinkman (2010) and Borovička, Hansen, Hendricks, and Scheinkman (2011) for the continuous-time case, and in Borovička and Hansen (2011) for the discrete-time case. 5.1 Dynamics Borovička and Hansen (2011) consider the following triangular (recursively-linear) state vector system: X1,t+1 = Θ10 + Θ11 X1,t + Λ10 Wt+1 X2,t+1 = Θ20 + Θ21 X1,t + Θ22 X2,t + Θ23 (X1,t ⊗ X1,t ) +Λ20 Wt+1 + Λ21 (X1,t ⊗ Wt+1 ) + Λ22 (Wt+1 ⊗ Wt+1 ) . (3) where the iid shock vector satisfies W ∼ N (0, I). Such a system allows for stochastic volatility, and we restrict the matrices Θ11 and Θ22 to have stable eigenvalues. Cash flows and stochastic discount factors are constructed as multiplicative functionals. A multiplicative functional is a process M = exp (Y ) where Y us a so-called additive functional. Increments of additive functionals are modeled as stationary functions of the state vector and the shock vector Yt+1 − Yt = Γ0 + Γ1 X1,t + Γ2 X2,t + Γ3 (X1,t ⊗ X1,t ) (4) +Ψ0 Wt+1 + Ψ1 (X1,t ⊗ Wt+1 ) + Ψ2 (Wt+1 ⊗ Wt+1 ) . Examples of such increments include the increment in the logarithm of the consumption process, log Ct+1 − log Ct , or the increment in the logarithm of the stochastic discount factor, log St+1 − log St . 9 It turns out that equilibrium models solved by perturbation methods used in Holmes (1995) or Lombardo (2010) satisfy the functional form (3). 5.2 Shock elasticities Shock elasticities capture the sensitivity of multiplicative functionals with respect to small perturbations. Consider a perturbation r2 2 log H1 (r) = − |αh (X0 )| + rαh (X0 ) · W1 2 h i 2 where r is a scalar parameter, αh is the direction of the exposure, and we impose the scaling E |αh (X0 )| = 1. A shock elasticity function for process M is defined as d E [Mt W1 | X0 = x] ε (x, t) = log E [Mt H1 (r) | X0 = x] = αh (x) · . dr E [Mt | X0 = x] r=0 Borovička and Hansen (2011) show how to construct the shock elasticities in closed form for the dynamics (3–4). These formulas are implemented in the elasticity toolbox. Two types of shock elasticities are of special interest. Given a cash-flow process G, a shock-exposure elasticity d εg (x, t) = log E [Gt H1 (r) | X0 = x] dr r=0 represents the sensitivity of the expected cash flow G to the shock W in direction αh . Additionally, given a stochastic discount factor process S, a shock-price elasticity d d log E [Gt H1 (r) | X0 = x] − log E [St Gt H1 (r) | X0 = x] εp (x, t) = dr dr r=0 r=0 captures the sensitivity of the expected return on the cash flow G to the shock W in direction αh . 5.3 Entropy decomposition Alvarez and Jermann (2005), Backus, Chernov, and Zin (2011) and others analyze entropy measures. The t-period entropy of a multiplicative functional M is 1 [log E [Mt | X0 = x] − E [log Mt | X0 = x]] . t Borovička and Hansen (2011) show that one can decompose the entropy into one-period contributions by utilizing conditioning information. Define the one-period contribution as ζm (x, t) ≡ log E [Mt | X0 = x] − E [log E [Mt | W1 , X0 ] | X0 = x] Then t 1X 1 E [ζm (Xt−j , j) | X0 = x] . [log E [Mt | X0 = x] − E [log Mt | X0 = x]] = t t j=1 The function ζm (x, t) shares the functional form that fits the dynamics (3)–(4), and its computation can therefore be implemented in this toolbox as well. 6 Function reference This section describes the functions that provide the user interface, and the structure of the parameter file. 10 6.1 6.1.1 Functions dynare elasticity Syntax: [elast =] dynare elasticity[(modelname[, param filename])] Calculates shock-price and shock-exposure elasticities, from a model solved using Dynare or Dynare++. The function reads the model solution generated by Dynare either from memory or from a mat file specified by modelname, and constructs shock-price and shock-exposure elasticities. The function plots graphs for the shock elasticities (can be controlled in the parameter file), and stores results in the return argument elast, and in an output file modelname elast parameters.mat. Make sure to set the model periodlength parameter correctly in the parameter file in order to produce the correct annualized magnitudes of the elasticities. Input: If any input is omitted, it is assumed that dynare elasticity is called immediately after solving the model using Dynare (dynare(’modelname’)), and variables M and oo are stored in memory. – modelname - mat file with the model solution (without the extension). If the mat file contains the oo variable, it is treated as a data file produced by Dynare, otherwise it is treated as a datafile produced by Dynare++. – param filename - Matlab code file (without extension) with parameters that overrides the default parameterization of the elasticity calculation. See example below. Output: The return argument can be omitted. – elast - structure containing the results. See Section 4.5 for details. Examples: Start in the examples directory, and make sure that the dynare elasticity toolbox folder (containing the function dynare elasticity.m) is on your path. 1. Solve the model example RBC.mod using Dynare, calculate shock elasticities from the model solution stored in memory, and store the elasticities in the elast structure. The specification parameters will only be read from default elast parameters.m, located in the main toolbox directory. dynare(’example RBC.mod’); elast = dynare elasticity; 2. Solve the model example RBC.mod using Dynare, rename the model solution file, calculate shock elasticities from the model solution file, and store the elasticities in the elast structure. Shock elasticities will also be stored in the file example RBC elasticity.mat. The specification parameters will be read from default elast parameters.m (located in the main toolbox directory), and subsequently from example RBC elast parameters.m (if it exists in the directory with the model solution file). dynare(’example RBC.mod’); system(’ren example RBC results.mat example RBC.mat’); % on Unix machines, use mv instead of ren elast = dynare elasticity(’example RBC’); 3. Solve the model example RBC plusplus.mod using Dynare++, calculate shock elasticities from the model solution file, and store the shock elasticities in the elast structure. Shock elasticities will also be stored in the file example RBC plusplus elasticity.mat. The specification parameters will be read from default elast parameters.m (located in the main toolbox directory), and subsequently from example RBC plusplus elast parameters.m (if it exists in the directory with the model solution file). 11 system(’dynare++ example RBC plusplus.mod’); % Dynare++ must be on your system path. Alternatively, run Dynare++ from the command line. elast = dynare elasticity(’example RBC plusplus’); 4. Calculate shock elasticities from a model solution stored in example RBC.mat, using a parameter file name myparam.m which overrides parameter values loaded from files described in previous examples. The parameter files are searched in the following order: (a) default elast parameters.m - stored in the toolbox directory, searched automatically (b) modelname elast parameters.m - stored in the directory where the model solution file is. In this example, the toolbox would search for examples/example RBC elast parameters.m. This file does not need to exist. (c) myparamfile.m - if it is specified as the second argument when running dynare elasticity. This file should be stored in the same directory as the model solution file (in this example, examples/myparamfile.m). elast = dynare elasticity(’example RBC’,’myparamfile’); 6.1.2 plot elast graphs Syntax: [fighandles =] plot elast graphs(model[, param filename]) Plots graphs for previously calculated elasticities. The function can be called to re-plot shock elasticities without the need to resolve the model. The second argument param filename can be used to provide a different parameter file with alternative graph specifications. See Section 6.2 for the description of the graph plotting parameters. Input: – model - This argument can either be a structure containing the calculated elasticities (see the elast structure returned by dynare elasticity), or the name of a file containing this structure. – param filename - filename with parameters that overrides the default parameterization for the graph plotting. Output: The return argument can be omitted. – fighandles - handles for the plotted figures, for easier referencing in automated processing. Examples: 1. Load shock elasticities from example RBC elasticity.mat, and use the file mygraphparams.m as the parameter file to override selected graph plotting parameters. fighandles = plot elast graphs(’example RBC elasticity’,’mygraphparams’); 2. Load shock elasticities from the elast structure obtained previously using dynare elasticity. Use the parameter file mygraphparams.m to override selected graph plotting parameters. fighandles = plot elast graphs(elast,’mygraphparams’); 12 6.2 Parameter file The parameter file controls the behavior of the shock elasticity toolbox. This is a regular Matlab code file that is called as a piece of code, so an incorrect syntax will result in an error. Make sure to set the model periodlength parameter correctly in the parameter file in order to produce the correct annualized magnitudes of the elasticities. When calling dynare elasticity(’modelname’,’param filename’), three different parameter files are searched, in the following order: (a) default elast parameters.m - stored in the toolbox directory, searched automatically. Although this file can be edited directly, it may be more desirable to provide model-specific parameter values using the following parameter files. (b) modelname elast parameters.m - stored in the directory where the model solution file is. This file does not need to exist. (c) param filename.m - if it is specified as the second argument when running dynare elasticity. This file should be stored in the same directory as the model solution file. The latter files may contain only a subset of parameters which should be overwritten. The graph-plotting function plot elast graphs may be supplied with another parameter file that contains graph-specific parameter values. Model-related parameters • model periodlength - period length in the model. Required to be set appropriately in order to produce the correct annualized magnitudes of shock elasticities. • model periodname - textual information about the period length in the model • model T - maximum horizon for which to calculate the shock elasticities • model recursive - type of recursive approximation method to be applied = 1 - Split the dynamics of the state vector X into first- and second-order dynamics and construct the dynamics for X1,· and X2,· (respects separation of first- and second-order terms) [default]. = 2 - Split the dynamics of X into first- and second-order dynamics and construct the dynamics for X1 and X1,· + X2,· (the X1,· + X2,· variable is easier to interpret as X). Distribution simulation parameters • simul distribution run - (0 or 1) determines whether simulated quantiles of the shock elasticities should be calculated [default = 1] • simul paths - number of paths simulated in parallel • simul dropperiods - number of initial periods to drop, in order to mitigate the impact of initial conditions • simul record periods - number of periods for the calculation of the simulated stationary distribution. The total number of data points is simul paths × simul recordperiods. • simul calc shockpriceelast - (0 or 1) determines whether quantiles of the shock-price elasticities should be calculated [default = 1] • simul calc shockexposureelast - (0 or 1) determines whether quantiles of the shock-exposure elasticities should be calculated [default = 1] 13 • simul calc entropy sdf, simul calc entropy cf - (0 or 1) determines whether quantiles of the entropy decomposition for stochastic discount factors and cash flows, respectively, are calculated [default = 0] (needs more testing!) • simul quantiles - vector of quantiles on the (0, 1) interval for which the shock elasticities should be recorded • simul zerooutthreshold - numerical threshold for resetting escaping paths in the simulations. This may only be an issue for models which are not in the recursive-linear form [default = 0, i.e., no threshold]. Plotting parameters • plot graphs - (0 or 1) determines whether graphs will be plotted [default = 1]. Additional parameters determine desired subsets of shock elasticity types and entropy decompositions to be plotted. • plot periodlength - length of period for the horizontal axis of the graphs. This does not influence the scaling of the shock elasticity functions which are always annualized. • plot periodname - textual information that will be used as a descriptor for the horizontal axis. • plot horizon - maximum horizon plotted. • plot elastscale - scaling of the elasticity unit [default = 1, annualized shock elasticity] • plot elastunit - text description of the shock elasticity unit, displayed as the label on the vertical axis • plot doxsteady, plot doxexp, plot doxbar, plot doxmean - (0 or 1) plot shock elasticities for specific values of the state vector X. For the description of the individual points (XSTEADY, XEXP, XBAR, XMEAN), see the description of X in the output file in Section 4.5. • plot doquantiles - (0 or 1) plot shock elasticities at individual quantiles [default = 1] • plot shock indices - plot only shock elasticities corresponding to selected shock indices. By default, the vector is empty, and all elasticities corresponding to all shocks are plotted. Enumerate the shock indices if only a subset of shock should be plotted [default = []]. • plot savedirectory - subdirectory in which graphs will be stored [default = graphs] • plot saveeps, plot savefig, plot savepng - (0 or 1) save graphs in the specified formats (jpg, Matlab figure, png). • plot filename spec - by default, all graph file names have a common prefix, corresponding to the name of the model file. plot filename spec can specify a second prefix used after the model file name. • plot graphtitle - (0 or 1) determines whether to plot graph titles [default = 1] • plot titlenote - textual information that will appear at the end of each graph title (e.g., to distinguish different versions of the graphs) • plot graphlegend - (0 or 1) determines whether to plot the legend into each of the graphs (the legend contains entries for each plotted shock) [default = 1] • plot lineorder - plot line type specification • plot linewidth - line width for plotting the shock elasticities at the individual points (XSTEADY, XEXP, XBAR, XMEAN). Quantiles are always plotted with width = 1. • plot horiz scaling - horizontal size of the graph, in pixels 14 • plot vert scaling - vertical size of the graph, in pixels • plot figure rows, plot figure columns - specifies the number of subplots plotted in each graph. By default, both values are equal to 1, which implies that each cash flow (for shock-exposure elasticities) and each combination of a cash flow and a stochastic discount factor (for shock-price elasticities) is plotted into a new graph window (the filename for the graph will contain the name of the stochastic discount factor and/or cash flow). When there are many cash flows, this may open too many windows. These two options allow to control the number of subplots in each graph window for more concise plotting (in this case, the filenames will only contain an index number). It may be desirable to change the size of the graph window (above) when using multiple subplots in a single window. Specific parameters • env displayverbose - (0 or 1) produce much more text output [default = 0]. • env displaysilent - (0 or 1) produce no text output, overrides env displayverbose [default = 0]. References Alvarez, Fernando, and Urban J. Jermann, 2005. “Using Asset Prices to Measure the Persistence of the Marginal Utility of Wealth.” Econometrica. 73 (6): 1977–2016. Backus, David K., Mikhail Chernov, and Stanley E. Zin, 2011. “Sources of Entropy in Representative Agent Models.” NBER Working paper W17219. Binsbergen, Jules H. van, Michael W. Brandt, and Ralph S. J. Koijen, 2011. “On the Timing and Pricing of Dividends.” Forthcoming in American Economic Review. Borovička, Jaroslav, and Lars Peter Hansen, 2011. “Examining Macroeconomic Models through the Lens of Asset Pricing.” University of Chicago. Borovička, Jaroslav, Lars Peter Hansen, Mark Hendricks, and José A. Scheinkman, 2011. “Risk-Price Dynamics.” Journal of Financial Econometrics. 9 (1): 3–65. Hansen, Lars Peter, and José A. Scheinkman, 2010. “Pricing Growth-Rate Risk.” Forthcoming in Finance and Stochastics. Holmes, Mark H., 1995. Introduction to Perturbation Methods, Springer. Lettau, Martin, and Jessica A. Wachter, 2007. “Why Is Long-Horizon Equity Less Risky? A Duration-Based Explanation of the Value Premium.” The Journal of Finance. 62 (1): 55–92. Lombardo, Giovanni, 2010. “On Approximating DSGE Models by Series Expansions.” ECB Working paper No. 1264. 15