1
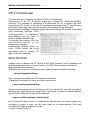
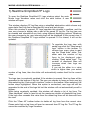
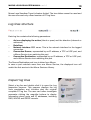
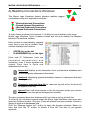
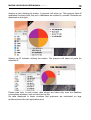
Murus
Logs Visualizer
User Manual
INDEX
Introduction
3
Welcome to Murus Logs Visualizer
4
How to install Murus Logs Visualizer
4
How to start Murus Logs Visualizer
4
How Murus Logs Visualizer works
5
How to start Murus Logs Visualizer at login
5
Reading PF Logs
6
OS X Console app
7
Shell Terminal
7
Displaying PF Logs
8
1) Realtime Simplified PF Logs 9
Log lines structure
10
Inspect log lines
10
2) Realtime Connections Windows
11
3) PF Logs Statistics
13
Chapter 1
Introduction
MURUS LOGS VISUALIZER MANUAL rev 1.0
4
Welcome to Murus Logs Visualizer
Murus Logs Visualizer is a tool for monitoring PF log file on OS X 10.9 Mavericks
and OS X 10.10 Yosemite. It opens as a menulet, its icon is displayed in the OS X
menu bar, on top of the screen, near the clock.
Despite being a companion app for Murus Firewall, Murus Logs Visualizer is a
standalone application and can be used without Murus. To use it as a standalone
application you need to manually configure both PF firewall ruleset and PF logging
system. For the best experience and to use all Murus Logs Visualizer features you
need to use it with Murus. Murus Logs Visualizer can seamlessly work with Murus Lite, Murus Basic and
Murus Pro. How to install Murus Logs Visualizer
To i n s t a l l M u r u s L o g s V i s u a l i z e r d o w n l o a d t h e Z I P fi l e f r o m
www.murusfirewall.com, unzip it and open the DMG disk image file. Drag the
Murus Logs Visualizer icon to your Applications folder (or wherever you want in
your Macintosh HD).
How to start Murus Logs Visualizer
To start Murus Logs Visualizer right click its icon and select Open from popup
menu. If you have selected to open only application from known developers, you
OS X system may ask you to confirm in order to open Murus Logs Visualizer for
the first time.
The activation window will appear. Insert your registration data (email and serial
number) and click Activate Murus Logs Visualizer to activate it and start it.
If you don’t own a license you can start Murus Logs Visualizer as tryout and use it
for 30 minutes. Murus Logs Visualizer Tryout is feature limited so you have access
only to a restricted set of features.
Murus Logs Visualizer starts as OS X menu item, with an icon near the clock on
top-right of your Mac screen.
Click the icon to open the features menu. Access all Murus Logs Visualizer
features from this menu.
MURUS LOGS VISUALIZER MANUAL rev 1.0
5
How Murus Logs Visualizer works
Murus Logs Visualizer constantly reads the PF firewall log file stored in the hidden
directory /var/log. This log file is updated by the PF firewall running in background.
Murus Logs Visualizer reads and displays PF log lines using different graphical and
logical abstractions.
For this reason it is mandatory to properly configure Murus in order to
activate the logging system. Please refer to the Murus manual for more
information.
Murus Logs Visualizer is only capable of displaying PF logs. You can’t change the
logging policies, and you can’t change (or see) the PF ruleset. While Murus Logs
Visualizer is able to work on the PF logs stream, for example ignoring PF logs
matching specific patterns, it is not able to change or interfere with the PF logging
policy. The PF log file stored in /var/log depends exclusively on Murus PF
configuration. The user doesn’t need to be an administrator in order to run Murus Logs Visualizer,
and doesn’t need to authenticate as administrator. PF log file permissions allow
every user to read it. This choice has been made to comply with the ALF logging
policies. ALF (Application Level Firewall, the OS X built-in application firewall
managed by OS X System Preferences) log file has exactly the same read/write
permissions. How to start Murus Logs Visualizer at login
The user can choose to automatically start Murus Logs Visualizer at login. You can
do it manually putting Murus Logs Visualizer icon in your user’s Login Items in
System Preferences Users panel, or you can simplify this process clicking the
“Gear” button in Murus Logs Visualizer main menu to open the Options window
and clicking the “Start Murus Logs Visualizer at user login” button in the Murus
Logs Visualizer Options window.
Chapter 2
Reading PF Logs
Learn how to read PF log files using tools provided by OS X
MURUS LOGS VISUALIZER MANUAL rev 1.0
7
OS X Console app
The common way to display log files on OS X is Console.app.
Console.app is an OS X default application located in /Applications/Utility
directory. It is capable of displaying and searching all OS X system log files,
including the PF log file. If you want to automatically display the PF log file when
opening Console.app, then you should open it from Murus Logs Visualizer.
Console.app is capable of displaying logs from archived log file as well, expanding
your searching abilities. And,
most importantly, it is capable of
autoupdating the log view, in
order to display realtime logs.
To activate this feature click the
right-bottom button in the
Console.app window. Console.app displays plain log
lines. While being the most
informative way to display PF
logs, it may be confusing.
Shell Terminal
Another way to display the PF log file is the shell Terminal. This is probably the
most favorite choice for unix-savvy users. The OS X Terminal.app is located in /Applications/Utility directory.
To display the current PF log file the user needs to issue this shell command:
cat /var/log/pffirewall.log
This command will display the PF firewall until the end.
To display it one page at a time, the shell command is:
more /var/log/pffirewall.log
These two commands above will display only the saved file, and will not update
showing new logs unless you retype these commands. In order to display realtime
logs the user needs to run this shell command:
sudo /usr/sbin/tcpdump -lnettti pflog0
the Terminal will ask the user to authenticate because this command needs root
privileges in order to work, so the user must be an administrator. This shell
command will display realtime PF logs. To stop it press Control C.
Chapter 3
Displaying PF Logs
Learn how to display PF logs using Murus Logs Visualizer
1) Realtime Simplified PF Logs
2) Realtime Connections
3) PF Logs Statistics
MURUS LOGS VISUALIZER MANUAL rev 1.0
9
1) Realtime Simplified PF Logs
To open the Realtime Simplified PF Logs window select the main
Murus Logs Visualizer menu and click the sixth button. A new
window will open.
This window displays PF log files using a simplified abstraction which shows only
some data. Each log line is described by icons and text strings.
When this window is opened, PF logs populate this window in realtime, and the
user may choose to display also a part of the saved PF log file. The log view can
be cleaned and reloaded at any time, using different displaying options. Whatever
the user chooses to do, new incoming logs will be displayed in the current view, if
the Realtime Simplified PF Logs window is opened. If it is closed, it will not be
updated. To populate the logs view with
saved logs click the “Read saved
logs” button in the toolbar. To
choose how many rules to read
use the “Read lines” slider. This
slider sets the number of log
lines to be displayed when
clicking “Read saved logs”. The
number of displayed lines will
increase when new logs are
recorded.
If you set the slider to a value
which is higher than your actual
number of log lines, then the slider will automatically restore itself to the correct
value.
The logs view is constantly updated if the window is opened. New log lines will be
appended to the bottom of the list. The user can choose to focus on each new log
lines selecting the “Auto scroll to bottom” button in the toolbar. When selected, the
button stays highlighted. When this option is unchecked, new logs will still be
appended to the end of the logs list but the window will not automatically scroll to
bottom.
While being constantly updated, this window will display a lot of log lines. The
“Max displayed” slider is used to set the maximum number of displayed log lines.
If the logs view exceeds this value then the oldest log lines will be removed from
the view.
Click the “Clear All” toolbar button to delete all log lines from the current view.
Please note that no log lines will ever be removed from PF log file. The PF log file
cannot be modified by Logs Visualizer. MURUS LOGS VISUALIZER MANUAL rev 1.0
10
Murus Logs Visualizer Tryout is feature limited. The two sliders cannot be used and
the user can read only a fixed number of PF log lines.
Log lines structure
Each log line contains the following parameters:
-
An icon displaying the action (block or pass) and the direction (inbound or
outbound)
Date/time Network interface BSD name. This is the network interface for the logged
connection.
Connection Source, represented by an IP address, a TCP or UDP port, and
a Murus Service icon matching this port
Connection Destination, represented by an IP address, a TCP or UDP port,
and a Murus Service icon matching this port
The Source/Destination port icon is taken from Murus. In case a port matches more than one Murus Service, the displayed icon will
match the first service in the Murus Services Library.
Inspect log lines
Select a log line and double click it to open the Log
Inspection popover. This popover displays the log
lines parameters and includes also the original
complete PF log line. The user can further investigate
parameter clicking the magnifier buttons to display
information about ports and IP addresses, including
DNS, WHOIS and GEOIP records.
MURUS LOGS VISUALIZER MANUAL rev 1.0
11
2) Realtime Connections Windows
This Murus Logs Visualizer feature displays realtime logged
connections using four separated windows:
-Blocked Inbound Connections
-Passed Inbound Connections
-Blocked Outbound Connections
-Passed Outbound Connections
To open these windows click buttons 1-4 in Murus Logs Visualizer main menu.
Murus Logs Visualizer Tryout is feature limited and can only display the Blocked
Inbound Connections window.
Each window is automatically updated
every time a new log is created. Each
window displays two columns:
-
PORTS list, on the left
IP ADDRESSES list, on the right
Ports and IP Addresses Lists are
populated automatically and
constantly, even if these windows are
closed. Each item in Ports and
Addresses list can be:
Inspected (display ports description from /etc/services database and
dns/whois/geoip addresses information)
Analyzed (displaying graphical statistics based on displayed data and
filtering results)
Temporary removed from list (in case new log will arrive, the item will
re-appear in the list)
Ignored (item will never appear in the list anymore unless you remove
the ignore from the ignore management window)
The user accesses these four features with four buttons on top of each list. To clean all four windows content select the Murus Logs Visualizer main menu and
open the Options window. Click the “Clean all address and port records” button to
empty all ports and addresses lists.
Click the “Manage Ignore List” button to open the Ignores windows. Select an
entry and click the “X” button to remote it from list. The item is not ignored
anymore.
MURUS LOGS VISUALIZER MANUAL rev 1.0
12
Analyze a port clicking the button. A popover will show up. This popover lists all
addresses involved with this port. Addresses are sorted by records. Records are
displayed on the right.
Analyze an IP Address clicking the button. The popover will show all ports for
selected IP.
Please note that, in both cases, data shown are taken only from the Realtime
connections windows, and not from the log file. So data displayed in these windows and popovers are calculated on logs
produces since the last application start.
MURUS LOGS VISUALIZER MANUAL rev 1.0
13
3) PF Logs Statistics
This Murus Logs Visualizer window displays statistics about
saved PF log files, including archived files. Click the sixth button
in the Murus Logs Visualizer main menu to open Logs Statistics
window. This window displays two separated statistics, one for IP
addresses and one for ports, using graphics and lists.
The user chooses how many PF files to read using the “Files” toolbar slider. By
default it is set to 1, meaning it will only read current PF log file. The slider
maximum value is represented by the total amount of PF log files stored in your /
var/log directory. If the slider is blocked at 1 and cannot be changed, then it means
that you have only one PF log file. Choose the maximum number if displayed items
for both Addresses and Ports using the “Results” toolbar slider.
The user can choose which kind of
logs wants to analyze. Use the two
radio buttons matrix to choose
between passed or blocked
connections, and between inbound or
outbound connections.
Click the “Generate Statistics” button
in the toolbar to start calculating
statistics. The time needed to
accomplish this task depends on how
big are PF log files. A progress
indicator will display the task status.
If no log lines matched the selected
statistics criteria, no result will appear.
Once finished this window will draw results for both Addresses and Ports. It is
possible to further investigate both selecting an item in the list and clicking the
magnifier buttons on top of both lists.
The Addresses magnifier button will open a popover with WHOIS, DNS and GEOIP
records for selected IP address.
The Ports magnifier button will open
a popover which further displays
statistics about selected port. The
popover shows a list of IP addresses
involved with selected port.
Addresses are sorted by records. The
user can get more information about
these IP addresses selecting an
address in the list and clicking the
magnifier button.