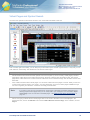
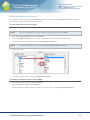
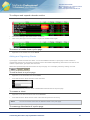
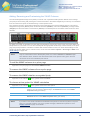
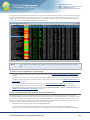
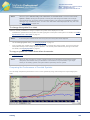
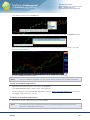
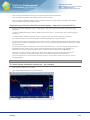
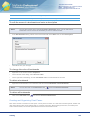
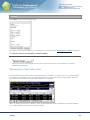
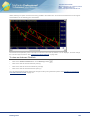
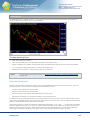
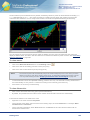
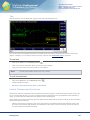
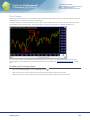
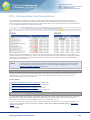
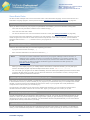
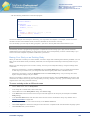
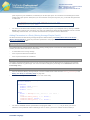
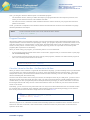
1
TeleTrader Professional
User Guide
TeleTrader Software GmbH
TeleTrader Software GmbH
Marc-Aurel-Straße 10-12, 1010 Vienna, Austria
E-Mail [email protected]
Internet http://professional.teletrader.com
Contents
First Steps with TeleTrader Professional
9
Additional Online Resources .......................................................................................................................................... 9
Logging in to TeleTrader Professional .......................................................................................................................... 10
QuickBar and Documents ............................................................................................................................................. 12
Price Pages and News ................................................................................................................................................. 14
Virtual Pages and Symbol Search ................................................................................................................................ 18
Charts and Technical Analysis ..................................................................................................................................... 21
Saving Your Data in Workspaces ................................................................................................................................. 26
Finding Securities (Symbols)
29
QuickBar ....................................................................................................................................................................... 29
QuickBar Content .............................................................................................................................................. 30
Opening Symbols from the QuickBar ................................................................................................................ 31
Symbol Search ............................................................................................................................................................. 32
Searching for Securities from the Toolbar ......................................................................................................... 33
Searching for Securities in the Symbol Search Dialog ...................................................................................... 34
Filtering Search Results .................................................................................................................................... 36
Sorting and Grouping Search Results ............................................................................................................... 38
Opening Symbols from the Search Results ....................................................................................................... 38
Calling Symbol Search from a Document .......................................................................................................... 41
Smart Symbol Search ....................................................................................................................................... 42
Creating and Using Search Templates.............................................................................................................. 43
Saving Search Results to Tabs ......................................................................................................................... 45
Displaying Symbols and Other Data
46
Price Page .................................................................................................................................................................... 48
Vertical Price Page ....................................................................................................................................................... 50
Chart ............................................................................................................................................................................. 52
News ............................................................................................................................................................................ 53
Market Depth ................................................................................................................................................................ 55
Time and Sales............................................................................................................................................................. 56
Watch List ..................................................................................................................................................................... 58
Options Matrix .............................................................................................................................................................. 59
Profile ........................................................................................................................................................................... 60
Analyzer ....................................................................................................................................................................... 61
Web Watch ................................................................................................................................................................... 62
Quick Quote.................................................................................................................................................................. 63
Ticker............................................................................................................................................................................ 63
Opening Symbols ......................................................................................................................................................... 63
Opening Symbols in New Documents ............................................................................................................... 64
Opening Symbols from Existing Documents ..................................................................................................... 66
Opening Symbols using Keyword Commands .................................................................................................. 67
Displaying News for a Symbol ........................................................................................................................... 68
Displaying Company Profiles for a Symbol ....................................................................................................... 69
Displaying Analyst Recommendations for a Symbol ......................................................................................... 70
Opening Related Symbols in a Price Page ....................................................................................................... 71
Displaying Symbols in the Ticker....................................................................................................................... 72
Changing, Inserting and Removing Symbols ................................................................................................................ 73
Changing Symbols ............................................................................................................................................ 73
Converting Futures to Forward Contracts ......................................................................................................... 74
Inserting Symbols .............................................................................................................................................. 74
Copying Symbols .............................................................................................................................................. 75
Removing Symbols ........................................................................................................................................... 76
Customizing Documents, Pop-up Windows and Panes
Contents
78
2
TeleTrader Software GmbH
Marc-Aurel-Straße 10-12, 1010 Vienna, Austria
E-Mail [email protected]
Internet http://professional.teletrader.com
Customizing Price Pages ............................................................................................................................................. 79
Adding and Removing Columns ........................................................................................................................ 80
Rearranging and Resizing Rows and Columns ................................................................................................. 81
Set Individual Color for Columns / Fields .......................................................................................................... 82
Set Individual Number of Characters for Columns / Fields ................................................................................ 83
Changing the Number of Decimal Places .......................................................................................................... 83
Changing the Update Style of a Column ........................................................................................................... 83
Changing the Grid Style .................................................................................................................................... 84
Changing Font and Colors of a Price Page ....................................................................................................... 85
Inserting, Changing and Removing Headers ..................................................................................................... 86
Adding and Organizing Sheets .......................................................................................................................... 87
Sorting the Contents of a Price Page ................................................................................................................ 88
Freezing a Column ............................................................................................................................................ 89
Selecting Rows or Columns of a Price Page ..................................................................................................... 89
Linking Documents to a Price Page .................................................................................................................. 89
Loop documents linked to Price Page automatically ......................................................................................... 91
Adding, Removing and Customizing Study Columns ........................................................................................ 91
Inserting Price Page Expressions...................................................................................................................... 94
Adding, Removing and Customizing the VWAP Columns ................................................................................. 98
Adding, Removing and Customizing the News Flash Columns ....................................................................... 100
Changing the Time interval of a Loop.............................................................................................................. 101
Displaying Chain Symbols in a Price Page ..................................................................................................... 101
Customizing Charts .................................................................................................................................................... 103
Customizing the General Chart Properties ...................................................................................................... 104
Customizing the Chart Pane Properties .......................................................................................................... 104
Customizing Symbol / Time Series Properties ................................................................................................ 105
Customizing News ...................................................................................................................................................... 105
Showing and Hiding News Headlines and Stories........................................................................................... 106
Changing Font, Colors and Headline Data of News ........................................................................................ 107
Filtering News Stories ..................................................................................................................................... 107
Searching for Keywords in News..................................................................................................................... 108
Quick Keyword Search in News ...................................................................................................................... 110
Customizing Market Depth ......................................................................................................................................... 110
Showing and Hiding Views .............................................................................................................................. 111
Customizing the Price View ............................................................................................................................. 112
Customizing the Summary View...................................................................................................................... 112
Customizing the Graph View ........................................................................................................................... 113
Customizing the Depth View ........................................................................................................................... 114
Setting the Maximum Number and Colors for the Depth Levels in Market Depth ........................................... 115
Filtering Information in Market Depth .............................................................................................................. 115
Customizing Time and Sales ...................................................................................................................................... 116
Showing Data for a Single Symbol or Multiple Symbols in Time and Sales .................................................... 117
Showing and Hiding Views .............................................................................................................................. 117
Adding and Removing Symbols in Time and Sales ......................................................................................... 118
Assigning Colors to Individual Symbols........................................................................................................... 119
Changing the Number of Decimal Places ........................................................................................................ 119
Changing the Grid Style, Font and Colors of the Time and Sales View .......................................................... 120
Adding and Removing Columns in the Time and Sales View .......................................................................... 120
Changing the Amount of Data Displayed in Time and Sales ........................................................................... 122
Filtering Information in Time and Sales ........................................................................................................... 123
Customizing the Price Page View ................................................................................................................... 123
Linking Documents to Time and Sales ............................................................................................................ 124
Displaying Chain Symbols in Time and Sales ................................................................................................. 124
Customizing Options Matrix ........................................................................................................................................ 127
Showing, Hiding and Changing Views ............................................................................................................. 127
Changing the Number of Decimal Places........................................................................................................ 128
Filtering Information in the Options Matrix ....................................................................................................... 128
Showing Greeks and the Put/Call Ratio .......................................................................................................... 129
Customizing the Underlying View .................................................................................................................... 129
Customizing the Greeks View ......................................................................................................................... 130
Customizing the Options Matrix View .............................................................................................................. 131
Customizing Watch Lists ............................................................................................................................................ 132
Changing Font and Colors .............................................................................................................................. 133
Entering Amounts, Buy Dates and Prices in a Watch List ............................................................................... 134
Customizing Web Watch ............................................................................................................................................ 135
Contents
3
TeleTrader Software GmbH
Marc-Aurel-Straße 10-12, 1010 Vienna, Austria
E-Mail [email protected]
Internet http://professional.teletrader.com
Managing Visited Links ................................................................................................................................... 135
Navigating Between Web Pages ..................................................................................................................... 136
Customizing Quick Quote ........................................................................................................................................... 136
Changing the Fields, Update Style, Font and Colors of Quick Quote .............................................................. 136
Displaying Market Depth in a Quick Quote document ..................................................................................... 137
Customizing the Ticker Pane ...................................................................................................................................... 137
Changing the Data Displayed in the Ticker ..................................................................................................... 138
Changing Speed and Direction of the Ticker ................................................................................................... 138
Changing Font and Colors of the Ticker .......................................................................................................... 139
Filtering Information in the Ticker .................................................................................................................... 139
Customizing the Navigation Pane............................................................................................................................... 140
Customizing the QuickBar ............................................................................................................................... 141
Customizing FastLook ..................................................................................................................................... 142
Customizing the DataBar ................................................................................................................................ 143
Undocking, Moving and Hiding Panes............................................................................................................. 144
Saving your Preferences in Templates ....................................................................................................................... 145
Applying Templates to Documents .................................................................................................................. 146
Organizing Templates ..................................................................................................................................... 147
Organizing and Saving Documents
150
Workspaces ................................................................................................................................................................ 150
Creating and Saving Workspaces ................................................................................................................... 150
Opening Saved Workspaces ........................................................................................................................... 152
Closing Workspaces........................................................................................................................................ 152
Uploading Workspaces to TeleTrader Mobile ................................................................................................. 153
Optimizing the Load Time of Workspaces ....................................................................................................... 154
Virtual Pages .............................................................................................................................................................. 155
Switching Between Virtual Pages .................................................................................................................... 155
Copying and Moving Content Between Virtual Pages ..................................................................................... 156
Opening and Saving Virtual Pages.................................................................................................................. 157
Organizing Virtual Pages ................................................................................................................................. 157
Documents ................................................................................................................................................................. 158
Creating and Saving Documents ..................................................................................................................... 159
Opening Saved Documents ............................................................................................................................ 159
Changing the Size of a Document Window ..................................................................................................... 160
Changing the Document Window Captions ..................................................................................................... 162
Arranging Document Windows on the Screen ................................................................................................. 162
Printing Documents ......................................................................................................................................... 163
Closing Documents ......................................................................................................................................... 164
FastLook ..................................................................................................................................................................... 166
Adding Folders and Symbols to FastLook ....................................................................................................... 167
Opening Symbols from FastLook .................................................................................................................... 167
Organizing FastLook Items ............................................................................................................................. 168
Sending Workspaces, Virtual Pages or Documents via E-Mail................................................................................... 169
Using the Internal Address Book ..................................................................................................................... 170
Multi-Monitor Systems ................................................................................................................................................ 171
Charting
173
Elements of a Chart .................................................................................................................................................... 173
Creating Charts and Opening Documents from a Chart ............................................................................................. 174
Changing the Data Compression................................................................................................................................ 175
Changing the Chart Type ........................................................................................................................................... 176
Finance Charts ................................................................................................................................................ 178
Point and Figure Charts .................................................................................................................................. 181
Three Line Break Charts ................................................................................................................................. 182
Renko Charts .................................................................................................................................................. 183
Kagi Charts ..................................................................................................................................................... 184
Heikin Ashi Charts ........................................................................................................................................... 185
Changing the Type of the Price Scale ........................................................................................................................ 185
Inserting, Overlaying and Changing Symbols in a Chart ............................................................................................ 187
Comparing the Performance of Overlaid Symbols .......................................................................................... 188
Inserting a Chartable Expression................................................................................................................................ 189
Syntax of Chartable Expressions .................................................................................................................... 192
Contents
4
TeleTrader Software GmbH
Marc-Aurel-Straße 10-12, 1010 Vienna, Austria
E-Mail [email protected]
Internet http://professional.teletrader.com
Changing the Appearance of Chartable Expressions ...................................................................................... 200
Using Keyword Commands in Charts ......................................................................................................................... 201
Navigating and Organizing a Chart............................................................................................................................. 204
Zooming a Section of a Chart .......................................................................................................................... 204
Scaling the Time Series to the Screen ............................................................................................................ 206
Setting, Moving and Editing Bookmarks .......................................................................................................... 208
Creating and Organizing Chart Panes............................................................................................................. 209
Using Sheets in Charts .................................................................................................................................... 211
Reading Values from a Chart ..................................................................................................................................... 212
Displaying the Data Table View .................................................................................................................................. 214
Customizing the Chart ................................................................................................................................................ 216
Customizing the Time Series .......................................................................................................................... 216
Customizing the Chart Background and Headers ........................................................................................... 225
Customizing Price and Time Scales ................................................................................................................ 228
Customizing Chart Objects .............................................................................................................................. 233
Continuous Contracts / Continuation Charts .............................................................................................................. 234
Creating a Continuation Chart ......................................................................................................................... 235
Changing Continuation Settings ...................................................................................................................... 235
Rollover of Continuous Contracts .................................................................................................................... 237
Back Adjustment of Continuous Contracts ...................................................................................................... 239
Sharing and Printing Charts........................................................................................................................................ 240
Printing Charts................................................................................................................................................. 240
Saving Charts as Picture Files ........................................................................................................................ 241
Using Charts Offline ................................................................................................................................................... 242
Drawing Tools
244
Adding Drawing Objects to a Chart ............................................................................................................................ 244
Snapping to the Nearest Price with the Magnet .............................................................................................. 246
Lines and Trend Channels .............................................................................................................................. 246
Linked Parallel Lines ....................................................................................................................................... 249
Regression Lines and Regression Channels .................................................................................................. 251
Shapes ............................................................................................................................................................ 252
Fibonacci Fans ................................................................................................................................................ 252
Fibonacci Trend Line ....................................................................................................................................... 253
Fibonacci Retracements and Expansions ....................................................................................................... 254
Fibonacci Arcs ................................................................................................................................................. 256
Speed Resistance Lines .................................................................................................................................. 257
Gann Square ................................................................................................................................................... 258
Gann Fans ...................................................................................................................................................... 259
Pivot Points ..................................................................................................................................................... 260
Andrews Pitchfork ........................................................................................................................................... 262
Wave and Harmonics ...................................................................................................................................... 264
Text ................................................................................................................................................................. 267
Vertical, Fibonacci and Cycle Lines................................................................................................................. 267
Price Change................................................................................................................................................... 269
Arrows ............................................................................................................................................................. 270
Customizing Drawing Objects..................................................................................................................................... 270
Extending and Shortening Lines with Extension Points ................................................................................... 271
Changing the Title, Color and Line Style ......................................................................................................... 272
Moving and Copying Drawing Objects ............................................................................................................ 273
Customizing Lines and Trend Channels .......................................................................................................... 274
Customizing Linked Parallel Lines................................................................................................................... 274
Customizing Regression Lines and Regression Channels .............................................................................. 275
Customizing Shapes ....................................................................................................................................... 275
Customizing Fibonacci Fans ........................................................................................................................... 276
Customizing Fibonacci Trend Line .................................................................................................................. 277
Customizing Fibonacci Retracements and Expansions................................................................................... 279
Customizing Fibonacci Arcs ............................................................................................................................ 281
Customizing Speed Resistance Lines ............................................................................................................. 283
Customizing Gann Square .............................................................................................................................. 283
Customizing Gann Fans .................................................................................................................................. 285
Customizing Pivot Points ................................................................................................................................. 285
Customizing Andrews Pitchfork ....................................................................................................................... 288
Customizing Wave and Harmonics ................................................................................................................. 288
Contents
5
TeleTrader Software GmbH
Marc-Aurel-Straße 10-12, 1010 Vienna, Austria
E-Mail [email protected]
Internet http://professional.teletrader.com
Customizing Text............................................................................................................................................. 290
Customizing Vertical, Fibonacci and Cycle Lines ............................................................................................ 290
Customizing Price Change .............................................................................................................................. 293
Customizing Arrows ........................................................................................................................................ 294
Hiding and Deleting Drawing Objects ......................................................................................................................... 294
Hiding Drawing Objects ................................................................................................................................... 294
Hiding and Showing Lines / Levels with Visibility Points ................................................................................. 296
Deleting Drawing Objects ................................................................................................................................ 297
Analysis Tools
299
Inserting Studies ......................................................................................................................................................... 300
Setting the Parameters of a Study................................................................................................................... 302
Defining the Appearance of a Study ................................................................................................................ 305
Viewing the Source Code & Study Info ........................................................................................................... 309
Changing the Properties of Inserted Studies ................................................................................................... 309
Hiding and Deleting Inserted Studies .............................................................................................................. 310
Moving and Copying Inserted Studies ............................................................................................................. 311
Basing Studies on Other Studies..................................................................................................................... 311
Editing and Managing Studies .................................................................................................................................... 312
Changing the Default Settings for Studies ....................................................................................................... 313
Editing Study Descriptions, Categories and Tags ........................................................................................... 314
Editing the Source Code of Studies................................................................................................................. 316
Creating New Studies...................................................................................................................................... 318
Deleting Custom Studies ................................................................................................................................. 318
Importing, Exporting and Sharing Studies ....................................................................................................... 318
Alerts (Notifications)
321
Price Alerts ................................................................................................................................................................. 321
News Alerts ................................................................................................................................................................ 325
Time Alerts ................................................................................................................................................................. 326
Intersection Alerts ....................................................................................................................................................... 326
Study Alerts ................................................................................................................................................................ 328
Customizing the Alerts Window for Price Alerts.......................................................................................................... 329
Opening Documents from the Alerts Window ............................................................................................................. 330
Enabling, Disabling and Deleting Alerts ...................................................................................................................... 331
Viewing the Alerts History ........................................................................................................................................... 332
Setting the Action on Triggering an Alert .................................................................................................................... 332
Notification Action............................................................................................................................................ 334
E-Mail Action ................................................................................................................................................... 335
Sound Action ................................................................................................................................................... 336
Display Action.................................................................................................................................................. 336
Print Action ...................................................................................................................................................... 337
Global Settings and Options
338
General Settings ......................................................................................................................................................... 339
Subscription Settings....................................................................................................................................... 339
Chart Settings ............................................................................................................................................................. 340
Data Table Settings ......................................................................................................................................... 341
Cross Scale Marker Settings ........................................................................................................................... 342
Document Defaults Settings ............................................................................................................................ 342
Point Style Settings ......................................................................................................................................... 343
Saving Settings ............................................................................................................................................... 343
Watermark Settings ......................................................................................................................................... 344
Price Page Settings .................................................................................................................................................... 344
News Flash Settings........................................................................................................................................ 344
Aribtrage List Settings ..................................................................................................................................... 345
VWAP Settings ................................................................................................................................................ 345
Quick Quote Settings.................................................................................................................................................. 346
Default Responses Settings ....................................................................................................................................... 346
Double-Click Actions Settings ......................................................................................................................... 346
Data Info Settings ....................................................................................................................................................... 347
Font and Names Settings ................................................................................................................................ 347
Contents
6
TeleTrader Software GmbH
Marc-Aurel-Straße 10-12, 1010 Vienna, Austria
E-Mail [email protected]
Internet http://professional.teletrader.com
Time Zone Settings .................................................................................................................................................... 348
E-Mail Settings ........................................................................................................................................................... 348
File Locations Settings ............................................................................................................................................... 349
Symbol Search Settings ............................................................................................................................................. 350
Font Settings ................................................................................................................................................... 350
Grid Settings ................................................................................................................................................... 351
Logging Settings ......................................................................................................................................................... 351
Detach Settings .......................................................................................................................................................... 351
Updater Settings ......................................................................................................................................................... 352
Shortcuts .................................................................................................................................................................... 352
Toolbars ..................................................................................................................................................................... 356
Status Bar ................................................................................................................................................................... 361
Importing and Exporting Security Data
363
RTD – Retrieving Real-Time Data with Excel ............................................................................................................. 364
DDE – Dynamic Data Exchange with Excel / Open Office ......................................................................................... 366
Starting and Stopping the DDE Connection .................................................................................................... 366
Copying Live Quote Data to Microsoft Excel with DDE ................................................................................... 367
Setting up a DDE Link with Live Data.............................................................................................................. 368
Setting up a DDE Link with Historical Data ..................................................................................................... 370
Security Data Wizard .................................................................................................................................................. 373
Importing External Data to the Local Database ............................................................................................... 373
Maintenance of the Local Database ................................................................................................................ 376
Importing Security Lists .............................................................................................................................................. 377
Copy Data to the Clipboard as Text ............................................................................................................................ 378
RTD – Real-Time Data in Excel
380
Setting Up the RTD Component ................................................................................................................................. 382
System Requirements for the RTD Component .............................................................................................. 382
Downloading and Installing the RTD Component ............................................................................................ 383
Starting and Stopping the RTD Connection .................................................................................................... 384
Choosing the Time Zone for the RTD Component .......................................................................................... 388
Setting up an RTD Link with Live Data ....................................................................................................................... 388
Tips and Examples for Retrieving Live Data ................................................................................................... 392
Setting up an RTD Link with Historical Data ............................................................................................................... 393
Tips and Examples for Retrieving Historical Data ........................................................................................... 396
Searching for Symbols with RTD ................................................................................................................................ 397
Tips and Examples for Looking Up Symbols ................................................................................................... 398
Symbol Syntax for Securities, Forwards and Continuous Contracts ............................................................... 399
Samples for the RTD Component............................................................................................................................... 403
Troubleshooting the RTD Component ........................................................................................................................ 404
Available Field Names ................................................................................................................................................ 405
HTTP Trading Integration for Online Brokers
429
Creating Brokers and Portfolios .................................................................................................................................. 429
Logging In and Accessing a Portfolio ......................................................................................................................... 431
Placing Orders ............................................................................................................................................................ 431
Changing the Trading Settings ................................................................................................................................... 433
Customizing Broker Configurations ............................................................................................................................ 434
Customizing Portfolio Configurations .......................................................................................................................... 436
Available Brokers........................................................................................................................................................ 437
Connection Settings
438
TeleTrader MDS Login Dialog .................................................................................................................................... 438
Connection Settings in the Login Dialog ..................................................................................................................... 439
Monitoring the Connection on the Status Bar ............................................................................................................. 441
Connection Log in the Information Pane .................................................................................................................... 443
Datafeed Options........................................................................................................................................................ 443
Troubleshooting
Contents
445
7
TeleTrader Software GmbH
Marc-Aurel-Straße 10-12, 1010 Vienna, Austria
E-Mail [email protected]
Internet http://professional.teletrader.com
Connection Problems ................................................................................................................................................. 445
Testing your Connection with the Connectivity Checker ............................................................................................. 446
Error Messages .......................................................................................................................................................... 447
Sending an Error Report (Support Package) .............................................................................................................. 449
Reporting Bad Ticks or Wrong Data ........................................................................................................................... 449
Clean Reinstallation.................................................................................................................................................... 450
System Requirements ................................................................................................................................................ 451
Updates
453
Automatic Update Process ......................................................................................................................................... 453
Checking for Updates ................................................................................................................................................. 454
Changing the Update Interval ..................................................................................................................................... 455
Third Party Software
456
Alternative Ways to Connect to the TeleTrader Servers ............................................................................................. 456
Sharing Workspaces Through Online Drives .............................................................................................................. 456
Installing TeleTrader Professional on Apple Mac ....................................................................................................... 457
TeleTrader Language
459
Creating Custom Studies ............................................................................................................................................ 460
What Is A Programming Language? ............................................................................................................... 460
Introduction to the TeleTrader Language ........................................................................................................ 461
Some Basic Rules ........................................................................................................................................... 464
Basing Your Study on an Existing Study ......................................................................................................... 466
Language Reference .................................................................................................................................................. 472
Program Execution .......................................................................................................................................... 473
Declaration Section ......................................................................................................................................... 479
Execution Section............................................................................................................................................ 488
Function Reference .................................................................................................................................................... 501
Drawing Functions........................................................................................................................................... 502
Mathematical Functions .................................................................................................................................. 510
Date / Time Functions ..................................................................................................................................... 514
System Functions ............................................................................................................................................ 518
Text Functions ................................................................................................................................................. 529
Error Messages .......................................................................................................................................................... 531
Syntax Coloring .......................................................................................................................................................... 532
Customer Support
534
Index
536
Contents
8
TeleTrader Software GmbH
Marc-Aurel-Straße 10-12, 1010 Vienna, Austria
E-Mail [email protected]
Internet http://professional.teletrader.com
First Steps with TeleTrader Professional
If you have not used TeleTrader Professional before, this Getting Started guide will show you how to log in and start
working with Professional. With the use of some practical examples we will take you on a guided tour of the program
and show you how to display securities, use different document types for visualizing quote data, retrieve news stories
for a specific security, analyze charts with drawing tools and analysis tools, organize documents into virtual pages
and much more.
Before we start, take a look below at the overview of the most important parts of the TeleTrader Professional main
window, and examples for the different document types.
TeleTrader Professional Version 11.0
Additional Online Resources
This User Guide covers the features and handling of TeleTrader Professional, as well as the syntax of the TeleTrader
Language, which is a simple programming language that you can use to create your own indicators or signals
If you want to get a visual introduction to the basic functions of TeleTrader Professional, we also offer a range of short
Video Tutorials (maximum 5 minutes each). You can either watch them online (you will need a Flash plug-in for
seeing them) or download them to your computer in .avi format.
First Steps with TeleTrader Professional
9
TeleTrader Software GmbH
Marc-Aurel-Straße 10-12, 1010 Vienna, Austria
E-Mail [email protected]
Internet http://professional.teletrader.com
You can find further information about TeleTrader Professional on the Web:
▫
On http://professional.teletrader.com/events you find the current schedule for our free online webinars, where we
regularly present an introduction to TeleTrader Professional or focus on individual features of the program
▫
On http://professional.teletrader.com/?faq you find a collection of Frequently Asked Questions that is regularly
updated and expanded
▫
On http://professional.teletrader.com/?release_notes you find the latest release notes which give you an
overview of the new features of the latest versions
Logging in to TeleTrader Professional
When you start TeleTrader Professional for the first time, you will be asked to log in. This is because TeleTrader
Professional must connect to the Market Data Server to get the latest quotes from the exchanges. You should by now
have received an e-mail with your login data (user name and password).
Note
▪
If you do not know your login data yet, you can click on the link Sign up for a Demo Account! in
the TeleTrader MDS Login dialog to sign up for a free trial account of TeleTrader Professional. If
you have signed up already, but have lost your password, click on the link Forgot your
Password? and enter your user name in the form that appears. Your account data will be sent to
the e-mail address that you provided during the registration process.
Double-click the TeleTrader Professional icon that you find on your desktop. Alternatively, you can also click on
the Windows Start button, and then select All Programs > TeleTrader Professional.
Note
If you are using Windows 8, press the Window key or move the cursor to the lower left corner of
the screen. The Start screen will open. Then, click on the TeleTrader Professional icon.
▪
To log in, you just have to enter the user name that you have received into the field User Name, and the
password into the field Password. You can copy the password from the e-mail and paste it into the text box to
make sure you don’t mistype any character.
▪
Click I accept the terms in the license agreement. If you want to, you can read the End User License
Agreement by clicking on the button EULA.
First Steps with TeleTrader Professional
10
TeleTrader Software GmbH
Marc-Aurel-Straße 10-12, 1010 Vienna, Austria
E-Mail [email protected]
Internet http://professional.teletrader.com
▪
▪
You can see that there are several other possible settings in the dialog. We recommend that you keep the default
settings:
-
The Save check box should be selected. The next time you log in, you don’t have to enter your user name
and password again.
-
The Reopen last workspace check box should also be selected. When you start Professional, the
workspace that you worked with last will be opened automatically. (You will learn about workspaces later.)
-
The Always show login dialog check box should be cleared. The login dialog will not be displayed again on
future logins, and Professional will automatically log you in using your last login information. You can
however still bring up the login dialog during startup if you press the SHIFT key while starting Professional.
-
The field Server should be set to mds*.ttweb.net. This is the address of the TeleTrader Market Data Server.
Click OK to start Professional. You should now see the main window of the program with the Quick Introduction
page.
Note
Professional only displays the Quick Introduction on the first start of the program. If you want
to read it again later, go to the Help menu and select Quick Introduction.
Help! Something went wrong
If you don’t see the main Professional window by now, your computer probably has a problem with connecting to the
TeleTrader Market Data Server. Do not despair – there are several things that you can do. Read about them in the
section on troubleshooting connection problems on page 445.
First Steps with TeleTrader Professional
11
TeleTrader Software GmbH
Marc-Aurel-Straße 10-12, 1010 Vienna, Austria
E-Mail [email protected]
Internet http://professional.teletrader.com
QuickBar and Documents
Now that you have successfully started TeleTrader Professional for the first time, we will take you on a little guided
tour of the program. We will start with the empty screen that you see when first starting Professional, and start to fill it
with different documents, organize these in so-called virtual pages, and save them in a workspace. At the end of this
tour you should be able to use the most important features and tools of Professional.
If you need further information at some stage, you will find many links to in-depth explanations for every topic.
The QuickBar holds popular security lists
▪
When you look at the main window of TeleTrader Professional, you can see a bar or pane on the left side of the
window. This is called the Navigation pane. It consists of three tabs: QuickBar, DataBar and FastLook. If you
don’t see the Navigation pane, go to the View menu and click Navigation Pane.
▪
For now, we are only interested in the QuickBar. This is the tab which shows a list of icons. Most icons contain a
group of popular securities. (Some icons contain different things, such as the icon Virtual Pages.) The QuickBar
is a good starting point for building your own workspace, because it offers fast access to important securities.
Furthermore, the lists here are maintained on the server, so they are always up-to-date. If you can’t see the
QuickBar already, click on the tab QuickBar at the bottom of the Navigation pane.
▪
We want to open a list of all stocks that are part of the Dow Jones Industrial Average index, which is an American
index. Click on the icon USA in the QuickBar.
First Steps with TeleTrader Professional
12
TeleTrader Software GmbH
Marc-Aurel-Straße 10-12, 1010 Vienna, Austria
E-Mail [email protected]
Internet http://professional.teletrader.com
▪
You now see a list of different exchanges and market segments. Click on the group NYSE, and then on Dow
Jones Industrial Average. You should now see a list of all stocks that are part of this index, and an entry All
Symbols. Click on this entry.
▪
A price page opens which lists all securities that are part of the Dow Jones Industrial Average (DJIA). You will
learn more about price pages in the next section, Price Pages and News on page 14.
Note
You might wonder why the entry to open all securities is called "All Symbols". This is because in
TeleTrader Professional, all stocks, futures, options, indices and other securities are called
symbols. This term is widely used throughout the program, and we too will speak of a symbol from
now on every time we refer to any type of security in TeleTrader Professional.
You can also open charts from the QuickBar
▪
In addition to the list of stocks that are part of the DJIA, we also want to open a chart that shows the development
of this index. You can also do this from the QuickBar – click on the icon USA again, click on the group NYSE, but
now choose Indices.
▪
You now see a list of all indices on the New York Stock Exchange. Click on the entry Dow Jones Industrial
Average Index.
▪
A chart opens that shows the DJIA. You will learn more about charts in the section Charts and Technical Analysis
on page 21.
Note
You can also open other kinds of documents from the QuickBar. See Opening Symbols from the
QuickBar on page 31.
Most windows that show quote data are called "Documents"
You now have opened two windows on the screen: The price page with the stocks that are part of the DJIA index, and
the chart that shows the DJIA symbol. These windows are also called documents in Professional. Most documents
are used to display quote data, like the Price Page and Chart that you have opened so far. You can also use the
following documents to display quote data: Market Depth displays a summary of all orders that are currently in the
market, Time and Sales is a chronological list of all orders and trades, the Options Matrix shows an overview of all
Call and Put options for an underlying, and a Watch List is a special price page with basic portfolio functionality.
There are also two additional kinds of documents that do not hold quote data: The News document (you will learn
more about this in the next section, Price Pages and News on page 14) and the Web Watch document, which is like a
web browser window that is integrated in Professional.
Documents are in essence like windows that are displayed inside Professional. What distinguishes them from other
windows, like dialogs, pop-up windows and panes, is that you can create as many documents as you like and even
save them.
First Steps with TeleTrader Professional
13
TeleTrader Software GmbH
Marc-Aurel-Straße 10-12, 1010 Vienna, Austria
E-Mail [email protected]
Internet http://professional.teletrader.com
Price Pages and News
This is how your screen may look like now (you can move the document windows around on the screen and also
resize them like any other window):
We will now work a bit more with the price page and also create some more documents.
A price page is like a customizable table
▪
As you can see, a price page shows many symbols in a table. Each row of a price page holds one symbol (as
was explained already, symbol is the term used in TeleTrader Professional for every kind of security).
Note
▪
A price page looks like a spreadsheet – in fact, you can also export data from a Professional price
page to spreadsheet software like Microsoft Excel or Open Office by using DDE or RTD links. See
Importing and Exporting Security Data on page 363.
You can customize many parts of a price page – choose a new background color, use a different font etc. To
show you an example, right-click anywhere in the price page. A menu is opened (the so-called context menu –
more about context menus below). Click on the last option in the menu – Properties.
First Steps with TeleTrader Professional
14
TeleTrader Software GmbH
Marc-Aurel-Straße 10-12, 1010 Vienna, Austria
E-Mail [email protected]
Internet http://professional.teletrader.com
▪
A dialog opens. On the left side of the dialog you can see that some groups of properties have been defined (the
so-called property sheets) – click on Update there. These are the settings that control the update styles that are
used in the price page – the visual effects that are displayed when prices rise or fall.
▪
You want to highlight the name of a DJIA stock in red if prices fall, and in green when prices rise. To do this, click
on Name in the list Columns. Then, select the checkbox Color text. The text of the column Name will now be
colored according to the price changes.
▪
You now have to choose the colors that should be used. Usually, the colors green (for upwards movements) and
red (for downwards movements) should already be selected – but you can also choose other colors, if you like.
Just click on the arrow next to the color that you want to change.
▪
Click OK to apply your changed settings to the price page. You should see the changes immediately.
Note
You can save all your preferred settings in a so-called template. See Saving your Preferences in
Templates on page 145.
You can open all kinds of documents from a price page
▪
The price page does not only display the quote data for the symbol: You can also work with a symbol displayed
there and, for example, open it in a chart document. Double-click on the 3M COMPANY symbol (that is, the row
that holds the 3M COMPANY security) – a new chart document will open.
Note
▪
A double-click on a symbol will almost always open a chart (except when you double-click in a
chart, of course). You can change this in the Professional Program Options, though. See DoubleClick Actions Settings on page 346.
You can open other types of documents too: Right-click on the 3M COMPANY symbol and choose Open. A submenu shows all available options for this symbol. Click on Time and Sales.
First Steps with TeleTrader Professional
15
TeleTrader Software GmbH
Marc-Aurel-Straße 10-12, 1010 Vienna, Austria
E-Mail [email protected]
Internet http://professional.teletrader.com
▪
A time and sales document opens, where you can see a chronological list of all orders and trades. We will not
discuss this document in depth here - you can read more about it in the section Time and Sales on page 56.
You can show related news for a symbol
▪
Leave the time and sales window open and return to the price page (just click on it and it will jump to the
foreground).
▪
Let’s say that you have looked at the chart for 3M COMPANY and seen a very sudden price movement at a
specific date. You have the feeling that this is due to some news that have arrived on this day. You want to see
the news for 3M – but you do not want to manually sift through all news messages from that day to see if
something relevant comes up. Fortunately, Professional can do this for you: Just right-click on the symbol 3M
COMPANY in your price page and choose Open > Search News.
▪
A news document opens which only contains news messages concerning 3M. They are ordered chronologically,
so you can easily find out what happened on that specific day.
Note
The news messages are identified by the ISIN of the symbol, so this feature only works when both
the symbol and the news feed you are working with contain ISINs.
First Steps with TeleTrader Professional
16
TeleTrader Software GmbH
Marc-Aurel-Straße 10-12, 1010 Vienna, Austria
E-Mail [email protected]
Internet http://professional.teletrader.com
The context menu shows the most suitable commands
As you have seen, the most frequently needed commands are often available from the context menu in TeleTrader
Professional. To display it, just click with the right button of your mouse on a document (or any other part of the
Professional window). You will see a menu that shows the commands that are most suitable for the current situation.
First Steps with TeleTrader Professional
17
TeleTrader Software GmbH
Marc-Aurel-Straße 10-12, 1010 Vienna, Austria
E-Mail [email protected]
Internet http://professional.teletrader.com
Virtual Pages and Symbol Search
You have now opened four document windows. Your screen will look similar to this one:
A bit crowded, right? Fortunately, you can keep all your documents open and still organize them in a way that you can
work with them comfortably: Just divide them into several Virtual Pages.
Virtual pages are containers for documents
▪
We will divide the documents we have opened so far into two parts (or, more correctly, virtual pages): The first
page will be called Stocks and contain the price page, the chart of 3M and time and sales for 3M. The second
page will be called Indices and contain the chart of the Dow Jones Industrial Average. We will add a second chart
there later.
▪
First, a little information about virtual pages: You can think of them like of the pages in a book. What you see now
on the screen is the first page of your "book" – the first virtual page. You have 19 other pages available that you
can use to organize your windows – all of them are empty at the moment.
Note
▪
If you want to see some good examples for virtual pages, TeleTrader Professional delivers some
already prepared virtual pages that you can easily add to your workspace. Just click File > Open
Virtual Page to see an overview of available pages. See Opening and Saving Virtual Pages on
page 157.
We are now going to fill the second virtual page: Click on the chart of the DJIA so that it is displayed in the
foreground. Now, click on the Window menu and click Move Window to Virtual Page. In the submenu, choose
Page 2.
First Steps with TeleTrader Professional
18
TeleTrader Software GmbH
Marc-Aurel-Straße 10-12, 1010 Vienna, Austria
E-Mail [email protected]
Internet http://professional.teletrader.com
▪
The chart window is now removed from the screen – that is, from the first virtual page. It is now only visible on
the second virtual page. You can easily switch to this page by clicking on the icon Virtual Pages in the QuickBar
and choosing Page 2.
Each virtual page can have a name
▪
Now, we want to assign different names to the pages instead of just calling them Page 1 and Page 2. You should
be on Page 2 at the moment (you can see this in the status bar).
▪
On the Window menu, click Page Title. A dialog appears where you can enter the new name Indices for this
virtual page. Click OK when you are done.
▪
Switch to the first virtual page now. You can use the QuickBar, or you can click on the name of the active virtual
page in the status bar and then choose the first page from the pop-up.
▪
Repeat the procedure (Window > Page Title) and name this page Stocks.
With Symbol Search you can find all available symbols
▪
Switch back to the second virtual page – now called Indices.
Note
▪
If you like to work with the keyboard, you can try a different method of switching between virtual
pages – just press the F12 key on your keyboard. This will always take you to the next page, or the
first page if you are currently on the last page. In our current setup (two pages), this means that
F12 will always switch to the other of two pages.
As there is plenty of space on this virtual page, we want to display a second chart with a different index here –
the NASDAQ 100. You could also find this index on the QuickBar, of course – however, for demonstration
purposes, we will use Symbol Search to find it.
First Steps with TeleTrader Professional
19
TeleTrader Software GmbH
Marc-Aurel-Straße 10-12, 1010 Vienna, Austria
E-Mail [email protected]
Internet http://professional.teletrader.com
▪
With Symbol Search you can find all symbols that are available for you (that is, included in your data package).
There are several ways of using symbol search – we will use the Symbol Search toolbar, which is located in the
top part of the main window along with all the other toolbars.
▪
The Symbol Search toolbar consists of four fields, with which you can narrow down your search. We will now
only use two of them to find the NASDAQ 100. The first of those is the leftmost field – here, you enter your
search term.
▪
Next, open the third field, that is at the moment labeled <All Types>. Choose Index there, as we want to find a
stock index.
▪
Click the green button on the right or press the ENTER key to start the search.
▪
The Symbol Search dialog is displayed with your search results. You probably received more than one result –
select the one that you want to by clicking on it (hint: its ticker is NDX.X).
▪
Now, click on the chart document button to open this symbol in a chart. You can also try the other buttons to see
which documents you get (or you can refer to the section Opening Symbols from the Search Results on page
38).
▪
The NASDAQ 100 index is opened in a chart. You can now move it around on the screen so that you can see
both charts on your virtual page. (Or, try the menu command Window > Tile Horizontally).
First Steps with TeleTrader Professional
20
TeleTrader Software GmbH
Marc-Aurel-Straße 10-12, 1010 Vienna, Austria
E-Mail [email protected]
Internet http://professional.teletrader.com
Charts and Technical Analysis
You have now divided your screen into two virtual pages. On each page, you display at least one chart document:
We will now work with these charts and for example add a trend line and a study, set an alert and link a chart to the
price page.
Charts can have different data compressions
▪
You should now see the virtual page Indices on the screen (if you don’t, press F12 to switch to it). This page
contains two charts. We now want to change the compression of one of these charts from Daily to Weekly.
▪
Click on the chart that you want to change (it doesn’t matter which of them you choose). Then have a look at the
Chart toolbar: You can see that one icon is selected. This is the icon for daily compression – this means that
each bar (or candle) that you see on the chart represents the data for one day.
▪
Now click on the icon to the right of the selected icon – the compression is changed to Weekly. This means that
each bar on the chart represents a week’s data.
Note
You can also display charts with a monthly compression and even intraday or tick compressions.
With drawing tools you can draw trend lines and many other objects
▪
To work with the chart, and better interpret the data you are seeing there, you can use a range of drawing tools in
Professional. These are graphical studies that are applied to the chart, or rather, to the time series displayed in
the chart.
Note
A time series is the visualization of a symbol with its current and historic data – it means that for
each point in time you have a set of values (the Open, High, Low and Close prices of the security)
that are normally displayed as bars or candles. As you have already learned, you can change the
compression of these bars, so that each bar represents a day, a week, a month or some other
period of time (e.g. 5 minutes).
▪
We will now draw a trend line on one of our charts. The trend line is one of the most basic drawing tools. As you
probably know, it needs two reference points, which are usually placed at two pivots (highs or lows) of the time
series.
▪
You can find all drawing tools on the Drawing toolbar. To activate the Free Line tool, click on its icon.
First Steps with TeleTrader Professional
21
TeleTrader Software GmbH
Marc-Aurel-Straße 10-12, 1010 Vienna, Austria
E-Mail [email protected]
Internet http://professional.teletrader.com
▪
Now you will draw the trend line on the chart. It has two reference points – to set the first reference point (starting
point), click on this point in the chart and hold the mouse button down.
▪
Move the mouse pointer to the second reference point (end point) and release the mouse button when you have
reached the second point.
▪
The trend line is now inserted into the chart. You can move it around by dragging it with the mouse, you can
extend or shorten it with its so-called extension points (see Extending and Shortening Lines with Extension
Points on page 271) and duplicate it with its visibility point (see Lines and Trend Channels on page 246).
Indicators and signals help you interpret the price development
▪
There is also a second way to interpret the data on your charts, and even generate buy and sell signals: You can
add a study to your chart. These are mathematical techniques that use calculations and statistics to help you
identify and analyze market opportunities and risks. An indicator visualizes the data in a different way to help you
interpret it more easily, whereas a signal also gives you hints to establish long or short positions or identifies
typical constellations that have been significant in the past.
Note
▪
Please always bear in mind that no matter which indicator or signal you use, in the end you always
have to take the responsibility for your trading decisions yourself.
We will add an indicator to one of our charts: The Simple Moving Average, which calculates the sum of a number
of values over a period of time and divides them by their number. The result is drawn on the chart as a line that is
used to identify or confirm a trend.
First Steps with TeleTrader Professional
22
TeleTrader Software GmbH
Marc-Aurel-Straße 10-12, 1010 Vienna, Austria
E-Mail [email protected]
Internet http://professional.teletrader.com
▪
To insert an indicator (or a signal), you use the Insert Study dialog: Right-click on the chart and choose Insert
Study.
▪
The dialog shows all available studies on the left side, and their parameters and other attributes on the right side.
Look for Moving Average Simple in the list on the left side. You will find it under the letter M, or in the category
Trend. Click on it to choose it as the study that you want to insert.
▪
You can now adapt the parameters of this study. As you know, the Moving Average is always based on a certain
period of time. When the period is longer, it lags behind the actual price movements more, but its interpretation is
also more significant. Change the parameter period to a value of your choice: Click in the Value column and
enter the new value there.
Note
You can also change the appearance of the study on the Appearance tab, or look at how it is
calculated on the Source tab. See Defining the Appearance of a Study on page 305.
First Steps with TeleTrader Professional
23
TeleTrader Software GmbH
Marc-Aurel-Straße 10-12, 1010 Vienna, Austria
E-Mail [email protected]
Internet http://professional.teletrader.com
▪
Now you can click Insert to insert the Moving Average into your chart. It is drawn as a line in the same chart
pane as your symbol. (Other indicators or signals can be inserted in a separate pane by default.)
▪
Click Close to return to your chart.
Note
If you want to add Volume and Open Interest to your chart: These are also defined as studies
and can be inserted in the same way as any other study from the Insert Study dialog.
Every indicator or signal can be customized
▪
Like in a price page (and essentially, in all documents), you can do many customizations in a chart. You can for
example change the color of the Moving Average that you just have inserted. To do this, click on the study line so
that it is selected.
▪
For changing the color and style of a line in a chart, which is a task done rather often, two icons are available on
the Drawing toolbar. To change the color of the line, click on the Color icon and choose a new color from the
color selector.
▪
If you want to change the line style, click on the Next Line Style icon. With each click, another line style is
applied. Just click until you reach the style you like.
First Steps with TeleTrader Professional
24
TeleTrader Software GmbH
Marc-Aurel-Straße 10-12, 1010 Vienna, Austria
E-Mail [email protected]
Internet http://professional.teletrader.com
Note
Of course you can also change all of these (and many more) properties in the Chart Properties
dialog. There are a lot of options available, so customizing a chart is explained in more depth
elsewhere: See Customizing the Charts on page 216.
Set alerts to get notifications about certain events
▪
When you are monitoring an indicator like the Moving Average, you are often interested in its intersections with
the time series. That means, you want to know for example when the price rises above the Moving Average line
or falls below the Moving Average line. You could of course look at the chart every few minutes to see if
something has changed, but there is a much easier way: Just let Professional notify you when something
interesting happens. For this, you use alerts.
▪
There are five types of alerts: Time alerts (these work sort of like an alarm clock), Price alerts (notify you when
the price reaches a certain level), News alerts (when news messages arrive that contain a certain keyword),
Study alerts (when a signal marker appears on the chart) and Intersection alerts. We will use an intersection alert
to tell when the price of our symbol crosses the Moving Average line.
▪
Right-click in the chart where you inserted the Moving Average indicator and choose Insert > Intersection Alert.
A dialog is shown – you now have to choose under which conditions you want to be notified. First, you have to
choose what two objects are interesting to you. In our example, the first object is the symbol of the chart (for
example the NASDAQ 100), and the second interesting object is the Moving Average line, which is called movs
in the dialog.
Note
If you see another object that is called Line1, this might be your trend line. You can see that
intersection alerts can also be used with drawing tools!
▪
Next to the Object fields, you can see two lists called Field. Here, you define what value of each object is
interesting to you. For the Moving Average, you only have one value to choose from. But your symbol offers
more possibilities: You could monitor the Open, High, Low or Close price, or even the Volume or Open Interest of
the security. Normally, you will choose the Close price here, which is also the default setting.
▪
You have even more settings to define in which case you want to be notified: In the Type list you can choose if
you want to be notified on any intersection, or just when the price crosses the Moving Average line from above
(First < Second) or from below (First > Second). In the Evaluation list, you can choose if Professional should
check the conditions for the alert after each tick, or only after the bar is complete.
First Steps with TeleTrader Professional
25
TeleTrader Software GmbH
Marc-Aurel-Straße 10-12, 1010 Vienna, Austria
E-Mail [email protected]
Internet http://professional.teletrader.com
▪
When you have set all conditions for your alert, click OK. You will now see the Alerts window that shows an
overview of all alerts that are active at the moment. Double-click in the Actions column: The Alert Action Editor
appears. Here, you can choose which kind of notification you want to receive when the alert is triggered (that is,
when the symbol’s time series and the Moving Average line actually intersect): It can be a Notification that is
shown on the screen as a pop-up, a Sound or even an E-Mail that is sent to you.
Note
If you want to use the E-Mail notification, you have to configure Professional for using your e-mail
account first. See E-Mail Settings on page 348.
Saving Your Data in Workspaces
You have created two virtual pages with many documents on them and learned about the most important concepts
and functions of TeleTrader Professional. Before we end the guided tour, you now should save your work so that you
can return to it later. To do this, we will introduce one last (but very important) concept: The workspace.
Workspaces are containers for virtual pages and their documents
▪
As you have already learnt, TeleTrader Professional offers documents like a chart or a price page to display
quote data (or news). You can arrange several of these documents onto a virtual page to get a better overview of
your work. And, as you will learn now, you can arrange several virtual pages into a workspace so that you can
easily save them all at once. Your work will not get lost, and of course you can also open these virtual pages all
at once, so that you can reuse them later on.
First Steps with TeleTrader Professional
26
TeleTrader Software GmbH
Marc-Aurel-Straße 10-12, 1010 Vienna, Austria
E-Mail [email protected]
Internet http://professional.teletrader.com
▪
Every time that you start TeleTrader Professional, it automatically opens a workspace for you. If you have
selected the option Reopen last workspace in the login dialog, it will open the last workspace that you have
worked with. If you did not select this option, Professional creates a new, empty workspace when you start the
program. You can of course then open one of your saved workspaces.
Note
▪
If you work with multiple monitors, a Professional workspace also remembers on which monitor it
was displayed last and will automatically switch to this monitor. See Multi-Monitor Systems on
page 171.
So, when you opened Professional for the very first time, you actually also created your first workspace. All the
documents you opened, and the virtual pages you created, are automatically part of this workspace. You see that
creating a new workspace is very easy. However if you don’t save your workspace before you close Professional
(or open another workspace), your work will be lost.
Save your workspace before you close Professional
▪
Therefore, you will now save your first workspace: To do this, choose File > Save Workspace. The dialog Save
workspace as appears.
▪
Choose the location where you want to save your workspace. Professional will suggest to save it into your
Documents folder. This is usually a good idea, as all the other default workspaces are already there, and some
shortcuts in the program require the workspaces to be all in one place.
Note
If you absolutely want to store your workspace in a different place, you are of course free to do so.
You should however consider to change the path for Documents under Tools > Options > File
Locations to your new location.
▪
Enter a name for your workspace in the File name box.
▪
Click Save. Your workspace is now saved on your computer – when you start Professional the next time, it
should either be automatically opened, or you can open it manually with File > Open Workspace (depending on
your settings in the login dialog).
▪
Now that your work is safe, you can close Professional (you can of course also leave it open and try out some of
the other tools, if you want too!). On the File menu, click Exit.
First Steps with TeleTrader Professional
27
TeleTrader Software GmbH
Marc-Aurel-Straße 10-12, 1010 Vienna, Austria
E-Mail [email protected]
Internet http://professional.teletrader.com
▪
Maybe Professional will ask you again if you want to save your workspace. This might happen if you have made
any additional changes to your documents or virtual pages after you saved the workspace for the last time. If you
click Yes, these changes will be saved too. If you click No, they won’t be.
Note
You can also save the answer to this question. For example, if you always want to save all
changes, select the check box Don’t ask this question again and click Yes. From now on,
Professional won’t ask again and simply save all changes to a workspace when you close it. You
can of course later change this setting (under Tools > Options > Default Responses).
First Steps with TeleTrader Professional
28
TeleTrader Software GmbH
Marc-Aurel-Straße 10-12, 1010 Vienna, Austria
E-Mail [email protected]
Internet http://professional.teletrader.com
Finding Securities (Symbols)
TeleTrader Professional offers two ways of finding the securities (symbols) that you want to display:
▫
You can access the most popular symbols from the QuickBar, which is a part of the Professional navigation
pane.
▫
With Symbol Search, you can find all symbols that are available to you, based on your data package.
What is a symbol?
In TeleTrader Professional, all stocks, futures, options, indices and other securities are called symbols. A symbol is
the unique identification given to every security that is traded on an exchange or over-the-counter market.
Each symbol has a type, which designates the category of the security or financial instrument. These categories are:
Stock, Future, Index, Currency, Warrant, Bond, Mutual Fund, Interest Rate, Option, Put Option, Call Option,
Certificate.
There is an additional special symbol type: The so-called chain symbol. This symbol does not hold data from one
security, but is rather a pointer to a list of "normal" symbols of different types, like a list of index constituents. The list
of symbols contained in a chain is automatically updated on the server. This means that when for example some new
stocks are added to the list of index constituents, the chain list will be automatically updated. Currently, chain symbols
can only be opened in price pages and time and sales documents – in other document types, you can only open the
list of symbols that the chain refers to (but the list will not be updated when it changes on the server).
QuickBar
The QuickBar is a part of the Professional navigation pane, which is located on the left side of the main window. It
contains prepared lists of the most popular securities (symbols) and offers fast access to news stories and information
from the Web. You can open these securities in price pages, charts and other documents directly from the QuickBar
menus.
If you want to customize the QuickBar, you can change its font and colors. See Customizing the QuickBar on page
141.
Normally, the QuickBar is displayed automatically when you start TeleTrader Professional. If the QuickBar is not
visible, either the navigation pane was closed manually, or another view is chosen to be displayed instead of the
QuickBar.
Finding Securities (Symbols)
29
TeleTrader Software GmbH
Marc-Aurel-Straße 10-12, 1010 Vienna, Austria
E-Mail [email protected]
Internet http://professional.teletrader.com
To display the QuickBar
▪
On the View menu, click Navigation Pane.
▪
In the navigation pane, click on the tab QuickBar.
QuickBar Content
The QuickBar consists of a list of icons. By clicking on one of the icons, you open a menu that contains different
groups and symbols. For example, the icon Europe contains a group for each Central European country that
TeleTrader provides data for.
Some QuickBar icons, such as News, Symbol Tools or Virtual Pages, offer different functionalities, for example
opening a search mask for certificates or navigating between virtual pages.
For different versions of TeleTrader Professional, the QuickBar will display different icons. You find here a list of the
most commonly displayed icons.
Overview of worldwide indices
Austrian indices, index constituents and Exchange Traded Funds
German indices, index constituents and Exchange Traded Funds
Other European indices and index constituents
US indices, index constituents and selected Exchange Traded Funds.
Indices and index constituents from South East Europe
Indices and index constituents from Central and Eastern Europe
Indices and index constituents from other countries
Commodities and Financials Futures Overview and selected derivatives from
futures and options markets
Currency snapshots, spot rates and forward rates from different Forex data
suppliers
Finding Securities (Symbols)
30
TeleTrader Software GmbH
Marc-Aurel-Straße 10-12, 1010 Vienna, Austria
E-Mail [email protected]
Internet http://professional.teletrader.com
Interest rates (EURIBOR / LIBOR) and a variety of deposit rates, forward rates and
interest rate swaps from GTIS Money Markets
Opens the News window: See News on page 53
Opens search masks where you can search for warrants, certificates and funds
Navigates between your virtual pages: See Switching Between Virtual Pages on
page 155
To learn more about opening groups and single symbols in price pages, charts or other documents, see Opening
Symbols from the QuickBar on page 31.
Note
The content of the QuickBar is defined by TeleTrader and cannot be changed by the user. The
support team can provide you with QuickBar updates, if needed.
Opening Symbols from the QuickBar
Each QuickBar icon holds several groups of symbols. You can either open a whole group at once in a price page
document, or open a single symbol out of one group as a chart or other document.
To open a group of symbols in a price page
▪
Click an icon in the QuickBar.
▪
In the menu that appears, select the group that you want to open.
▪
In the submenu, select All Symbols.
▪
All symbols of this group are displayed in a price page
To open a single symbol in a chart
▪
Click an icon in the QuickBar.
▪
In the menu that appears, right-click the group which contains the symbol that you want to open.
▪
If the group contains more than fifty symbols, a submenu will appear dividing the symbols by alphabet (exception:
Futures and Currency groups). Select the first letter of the symbol that you want to open.
▪
In the submenu, select a symbol.
▪
The symbol is displayed in a chart document by default.
Note
If you want to change the default document, see Default Responses Settings on page 346.
To open a single symbol in other documents
▪
Click an icon in the QuickBar.
▪
In the menu that appears, right-click the group which contains the symbol that you want to open.
▪
If the group contains more than fifty symbols, a submenu will appear dividing the symbols by alphabet (exception:
Futures and Currency groups). Select the first letter of the symbol that you want to open.
Finding Securities (Symbols)
31
TeleTrader Software GmbH
Marc-Aurel-Straße 10-12, 1010 Vienna, Austria
E-Mail [email protected]
Internet http://professional.teletrader.com
▪
In the submenu, right-click on a symbol (or move the mouse pointer to the symbol and wait for a moment).
▪
An additional menu appears:
▪
Choose the document type from the list. You can also use a template: Right-click the document type and choose
a template from the list. Double-click the document type to use the default template.
▪
The symbol is displayed in the chosen document.
Note
You can also open a price page with related symbols with the command Related Symbols. See
Opening Related Symbols in a Price Page on page 71.
To copy a symbol to an existing document with drag and drop
▪
Click an icon in the QuickBar.
▪
In the menu that appears, select the group which contains the symbol that you want to open.
▪
In the submenu, select a symbol.
▪
Hold the mouse button down and move the symbol.
▪
Drag the symbol to its new location and release the mouse button to drop it there. Depending on the target
document or window where you drop the symbol, you can choose its exact location (see Copying Symbols on
page 75 for details).
Symbol Search
With Symbol Search you can find all symbols that are available in your data package. You can search for the name of
a security, its ticker symbol, its ISIN or its local identification number, such as WKN. The Symbol Search dialog is
shown whenever you start a search or want to insert, change or replace a symbol in one of your documents.
You can start a search from the Symbol Search toolbar, by opening the Symbol Search dialog, or by starting a search
from any document.
The Symbol Search dialog is also shown automatically when you create a new document and try to change or insert
symbols in a document.
After you have defined your search parameters and started the search, you can filter, sort and group the search
results. You then can open one or more of the symbols in a document, or display news , company profiles and analyst
recommendations for symbols. With Smart Symbol Search, you can even include all settings and the preferred
document that will be opened in one search query.
You can save your search settings as a search template, or save your search results in so-called tabs.
If you want to customize the general search settings, like colors and fonts used or the behavior of the toolbar, see
Symbol Search Settings on page 350.
Finding Securities (Symbols)
32
TeleTrader Software GmbH
Marc-Aurel-Straße 10-12, 1010 Vienna, Austria
E-Mail [email protected]
Internet http://professional.teletrader.com
Searching for Securities from the Toolbar
The Symbol Search toolbar is displayed in the top part of the main window and includes the basic features to start
and refine your search. It consists of four fields. You enter your search term in the first field.
To start a search from the Symbol Search toolbar
▪
Enter your search term in the first field. This can be the name of a security, its ticker symbol or ISIN.
Note
You can also choose a search term from a list of terms that you have used before by clicking the
arrow button.
▪
You can optionally limit the search results to one exchange. Select the exchange from the list. All other
exchanges will be ignored.
▪
You can also select the type of symbol that you want to search for. If you want to search for all symbol types,
leave this setting to <All Types>.
▪
You can search for all characteristics (fields) of a symbol, or only search for its name, ticker symbol, ISIN or local
ID (e.g. WKN).
▪
When you have finished your settings, click on the green button or press the ENTER key to start the search.
Finding Securities (Symbols)
33
TeleTrader Software GmbH
Marc-Aurel-Straße 10-12, 1010 Vienna, Austria
E-Mail [email protected]
Internet http://professional.teletrader.com
▪
The search results are displayed in the Symbol Search dialog. (If you instead want to open the search results in
a price page or other document per default: See Symbol Search Settings on page 350.)
▪
Click on the symbol that you want to open in a document.
▪
Click on the Open button and select the document type.
Note
You can also display news, a company profile or analyst recommendations for most symbols. If
you want to open a continuation chart for a futures contract, click on the continuation tab that
appears and change the continuation settings to your needs – see Changing Continuation Settings
on page 235.
Searching for Securities in the Symbol Search Dialog
The Symbol Search dialog offers more complex opportunities to refine your search. You can for example select more
than one exchange or symbol type at once.
To start a search with the Symbol Search dialog
▪
On the File menu, click Symbol Search to display the Symbol Search dialog.
▪
Enter your search term in the first field on the left side. This can be the name of a security, its ticker symbol or
ISIN.
Note
You can also choose a search term from a list of terms that you have used before by clicking the
arrow button.
Finding Securities (Symbols)
34
TeleTrader Software GmbH
Marc-Aurel-Straße 10-12, 1010 Vienna, Austria
E-Mail [email protected]
Internet http://professional.teletrader.com
▪
You can optionally limit the search results to a number of exchanges. In the Exchanges list, select the check box
next to each exchange that you want to include in your search. If you want to include all exchanges, select <All>.
▪
You can also select the symbol types that you want to search for. In the Types list, select the check box next to
each type that you want to include. If you want to search for all symbol types, select <All>.
▪
You can search for all characteristics (fields) of a symbol, or limit the search to its name, ticker symbol, ISIN or
local ID (e.g. WKN). In the Search By list, select the check boxes next to each field that you want to include.
▪
You can also include ceased symbols (for example expired futures contracts) in your search. To do so, select the
check box Search ceased symbols.
▪
When you have finished your settings, click on the green button or press the ENTER key to start the search.
Finding Securities (Symbols)
35
TeleTrader Software GmbH
Marc-Aurel-Straße 10-12, 1010 Vienna, Austria
E-Mail [email protected]
Internet http://professional.teletrader.com
▪
The search results are displayed on the right side of the Symbol Search dialog.
▪
Click on the symbol that you want to open in a document.
▪
Click on the Open button and select the document type.
Note
You can also display news, a company profile or analyst recommendations for most symbols. If
you want to open a continuation chart for a futures contract, click on the continuation tab that
appears and change the continuation settings to your needs – see Changing Continuation Settings
on page 235.
Filtering Search Results
When the search results are displayed in the Symbol Search dialog, you can then filter the results. You can also
remove some or all symbols from the search result set.
To filter the search results by exchange
With this filter, you can show symbols that are traded on a certain exchange (e.g. only NASDAQ listings).
▪
In the Exchanges list, click on the names of the exchanges that you want to include in the search results.
Note
Click on the name of the exchange, do not select or clear the check box next to it.
Finding Securities (Symbols)
36
TeleTrader Software GmbH
Marc-Aurel-Straße 10-12, 1010 Vienna, Austria
E-Mail [email protected]
Internet http://professional.teletrader.com
▪
The exchanges that you included in your filter are highlighted.
▪
The search results that are not traded on these exchanges are hidden in the results pane.
To filter the search results by symbol type
With this filter, you can show symbols with a certain symbol type (e.g. only stocks and indices).
▪
In the Types list, click on the names of the symbol types that you want to include in the search results.
Note
Click on the name of the type, do not select or clear the check box next to it.
▪
The symbol types that you included in your filter are highlighted.
▪
The search results that do not have these symbol types are hidden in the results pane.
To filter the search results by selection
With this filter, you can show symbols that have similar content with another symbol that you select.
▪
Right-click on a symbol in the column that you want to choose as your filter. For example, right-click in the ISIN
column of a symbol.
▪
Choose Filter By Selection.
▪
The search results that do not have the same content in this column as the symbol that you selected are hidden
in the results pane.
To remove filters
When you want to display all search results again, you have to remove the filters.
▪
In the Exchanges or Types list, click on <All> to remove exchange and symbol type filters.
▪
In the results pane, right-click on any symbol and choose Remove Filter to remove selection filters.
▪
All search results are now shown again in the results pane.
To remove symbols from the search results
▪
Right-click on the search result that you want to remove from the list and choose Remove.
▪
If you want to clear the list, choose Remove All. To remove all results except the one that is highlighted at the
moment, choose Remove All Except.
Finding Securities (Symbols)
37
TeleTrader Software GmbH
Marc-Aurel-Straße 10-12, 1010 Vienna, Austria
E-Mail [email protected]
Internet http://professional.teletrader.com
Sorting and Grouping Search Results
You can sort your search results by column, or group them by their ISIN or symbol type.
To sort the search results by column
You can sort your search results by all columns that are displayed in the results pane. You can only sort by one
column at the same time.
▪
Click on the column header that you want to sort by.
▪
To change the order from ascending to descending, click on the column header again.
To group the search results by ISIN or symbol type
When you group your search results, the symbols are visually arranged into different folders. You can either group by
ISIN or symbol type.
▪
In the Group by section, select the ISIN or Type checkbox.
▪
The symbols are visually arranged into folders.
▪
To show the symbols inside a folder, double-click the folder.
▪
To return to the folder view, double-click the return icon in the first line of the results pane.
Opening Symbols from the Search Results
Finding Securities (Symbols)
38
TeleTrader Software GmbH
Marc-Aurel-Straße 10-12, 1010 Vienna, Austria
E-Mail [email protected]
Internet http://professional.teletrader.com
You can open one or more symbols from the search results in a document, for example a price page or chart. First,
you have to select the symbol(s) that you want to open. Then, select the document type.
Note
You can also display news, a company profile or analyst recommendations for most symbols.
To select symbols from the search results
▫
To select one symbol, click on it.
▫
To select several symbols at once, click on the first symbol, hold the CTRL key, and then click on all other
symbols you want to select.
▫
To select several consecutive symbols, click on the first symbol, hold the SHIFT key, and then click on the last
symbol.
▫
To select all symbols, right-click on any symbol and choose Select all.
▫
To select only symbols whose ticker, name or ISIN match your search term exactly, select Select only exact
matches in the Group by section.
Note
Select only exact matches is activated by default.
To open market depth, time and sales, price page or chart documents for selected
symbols
▪
Click on one of the document buttons:
Market Depth
Time and Sales
Price Page
Chart
Continuation Chart (only available for futures)
Note
If you have selected several symbols, and open a new price page, watch list or time and sales
document for them, by default all symbols will be combined in one document. If you keep the CTRL
key pressed while choosing the document type, each symbol will be opened in a separate
document.
If you open a new chart document while selecting several symbols, holding the CTRL key will open
overlaid symbols in one chart pane. To open every symbol in its own chart pane, hold both the
CTRL + SHIFT while choosing the document type Charts.
If you open a chain symbol (pointer to a list of symbols, for example DAX#XETRA), this is treated
in the same way as opening several symbols at once for most documents. Special treatment of
chain symbols is only possible in price pages (see Displaying Chain Symbols in a Price Page on
page 101) and time and sales documents (see Displaying Chain Symbols in Time and Sales on
page 124).
Finding Securities (Symbols)
39
TeleTrader Software GmbH
Marc-Aurel-Straße 10-12, 1010 Vienna, Austria
E-Mail [email protected]
Internet http://professional.teletrader.com
To open other documents for selected symbols
▪
Click on the Open button.
▪
Select the document type that you want to open.
Note
You can also right-click the selected symbols and select Open.
To open market depth, price page or chart documents for continuation symbols
(futures)
For futures symbols, you can open a continuation contract in any document, for example a price page or chart:
▪
Click on the futures contract that you want to open as a continuation symbol.
▪
Click on the Continuation tab in the top left corner of the Symbol Search dialog.
▪
Adapt the continuation settings to your needs, that is, define how the continuation symbol should be constructed
out of the individual futures contracts (see Changing Continuation Settings on page 235).
▪
Click on one of the document buttons:
Market Depth
Price Page
Chart
Note
You can also open the continuation symbol in other document types by clicking the Open button
and selecting the document type that you want to use (for example vertical price page, watch list,
etc.).
Finding Securities (Symbols)
40
TeleTrader Software GmbH
Marc-Aurel-Straße 10-12, 1010 Vienna, Austria
E-Mail [email protected]
Internet http://professional.teletrader.com
Available options for opening symbols
The symbols are opened differently depending on what option you choose:
▫
Price Page: If you selected several symbols, they will all be displayed in one price page. See Price Page on
page 48.
▫
Chart: An individual chart document is opened for each symbol. See Chart on page 52.
▫
Continuation Chart: A continuation chart document is opened for each symbol. This option is only available for
futures. See Continuous Contracts / Continuation Charts on page 234.
▫
Search News: News stories for the selected symbols are displayed, if available. See News on page 53.
▫
Market Depth: An individual market depth document is opened for each symbol. See Market Depth on page 55.
▫
Time and Sales: If you selected several symbols, they will all be displayed in one time and sales document. See
Time and Sales on page 56.
▫
Options Matrix: An individual options matrix document is opened for each symbol. See Options Matrix on page
59.
▫
Watch List: If you selected several symbols, they will all be displayed in one watch list. See Watch List on page
58.
▫
Profile: Company profiles for the selected symbols are displayed, if available. See Profile on page 60.
▫
Analyzer: Analyst recommendations for the selected symbols are displayed, if available. See Analyzer on page
61.
▫
Quick Quote: An individual quick quote document is opened for each symbol. See Quick Quote on page 63.
Note
If you want to open a document with a specific template, click on Open, right-click the document
type and select a template. Double-click the document type to use the default template.
Calling Symbol Search from a Document
The Symbol Search can be called directly from within a document. Simply enter the search term on the keyboard and
proceed with the normal symbol search procedure.
▪
In any document, start typing the search term on the keyboard.
▪
An input field appears.
▪
Proceed with entering your search term and press the ENTER key when finished.
▪
The Symbol Search dialog is displayed with the search results for your search term.
▪
Click on the symbol that you want to open.
▪
Click OK.
Note
The new symbol will replace the previous symbol in the document. In price pages and watch lists,
only the symbol in the active row will be replaced (except in case of chain symbols in price pages,
where all symbols in the document will be replaced). In time and sales documents, the symbol will
either be added to the document (when you started the search in the time and sales view), or the
symbol in the active row will be replaced (when you started the search in the price page view), or
all symbols will be replaced (in case of chain symbols). In the options matrix, the underlying symbol
will be replaced.
Finding Securities (Symbols)
41
TeleTrader Software GmbH
Marc-Aurel-Straße 10-12, 1010 Vienna, Austria
E-Mail [email protected]
Internet http://professional.teletrader.com
Smart Symbol Search
Smart Symbol Search uses a special syntax to make it possible to conduct a complete search with using only
keyboard commands. You can limit a search to certain exchanges and symbol types without using the Symbol Search
dialog interface. You can also define with what document type the search results will be opened afterwards. The
Symbol Search dialog will only be shown when there is more than one result for your search.
To start a Smart Symbol Search
You can use the Smart Symbol Search commands everywhere where you can also start a normal search:
▫
Enter the Smart Symbol Search commands in the first field of the Symbol Search toolbar; see Searching for
Securities from the Toolbar on page 33
▫
Enter the commands in the search field of the Symbol Search dialog; see Searching for Securities in the Symbol
Search Dialog on page 34
▫
Enter the commands in any document; see Calling Symbol Search from a Document on page 41
▫
Enter the commands in the Change Symbol dialog; see Changing Symbols on page 73
Syntax of Smart Symbol Search
Smart Symbol Search works with separators to distinguish between the different parts of a search query.
A search query consists of four parts:
Symbol
Search term for the desired symbol.
For example: EURUSD, MSFT, DAX
Exchange
Beginning of the exchange or market name. If you enter only some letters, all exchanges that
match these letters will be included in the search.
For example: XE will include Xetra, Xetra European Stars and Xetra US Stars
Type
Beginning of the symbol type name. If you enter only some letters, all symbol types that match
these letters will be included in the search.
For example: S will include Stocks, but I will include Index and Interest Rate
Document
New document that will be opened automatically when a single result is returned by the search.
In all other cases, the Symbol Search dialog will be displayed with the search results.
C
Chart
P
Price Page
T
Time and Sales
O
Options Matrix
M
Market Depth
N
News
CO
Continuation Chart
Q
Quick Quote
In a search query, you do not have to use all four parts. You can:
▫
Skip parts at the end by simply not adding them, for example: MSFT.NASDAQ
▫
Skip parts in the middle by typing two separators instead of one, for example: MSFT..S.C
The following separators can be used for Smart Symbol Search by default: full stop ( . ), hyphen ( - ), comma ( , ),
plus sign ( + ).
It does not make a difference which separator you use, but you must stick to one separator in each search query, that
means you cannot mix separators.
Finding Securities (Symbols)
42
TeleTrader Software GmbH
Marc-Aurel-Straße 10-12, 1010 Vienna, Austria
E-Mail [email protected]
Internet http://professional.teletrader.com
Examples
GOOGLE-XE-S-C
Opens a new chart with the Google stock on Xetra. Exchanges included in the search
were also Xetra ETF, Xetra European Stars and Xetra US Stars.
MSFT,NASDAQ
When called from the Symbol Search toolbar, opens the Symbol Search dialog with
the Microsoft stock on NASDAQ (as no document is specified, the dialog is opened).
When called from within a document, the search result will replace the symbol that
was previously shown there.
EURUSD+FOREX+C
Opens the Symbol Search dialog with results for the EURUSD currency pair on all
markets that start with "Forex".
FDAX 2008Z..F.CO
Opens a continuation chart for the December 2008 FDAX future. Note that no
exchange was specified in the second part of the query.
To customize Smart Symbol Search separators
The Smart Symbol Search separators can be customized.
▪
On the Tools menu, click Options.
▪
In the left pane, choose Symbol Search.
▪
In the right pane, modify the separators for Smart Symbol Search:
▪
Click OK.
Note
It is recommended not to add the colon ( : ) or the space character (blank) as a separator, as they
are part of some symbol names.
Creating and Using Search Templates
You can save your search settings in a search template. This means that you can e.g. create a template to search for
futures on Eurex. Several search templates have been predefined already. You can change them or create your own
additional search templates.
To use a search template
▪
Click on the Search Settings arrow.
▪
Choose a search template from the list.
Finding Securities (Symbols)
43
TeleTrader Software GmbH
Marc-Aurel-Straße 10-12, 1010 Vienna, Austria
E-Mail [email protected]
Internet http://professional.teletrader.com
▪
Enter your search terms and start the search.
To create a new search template
▪
Choose your settings in the Exchanges, Types and Search By lists. For example, select "Eurex" in the
Exchanges list and "Future" in the Types list.
▪
In the Search Settings box, enter the name for your search template.
▪
Click on the Search Template button and choose Add. The search template is now saved.
▪
Enter your search terms and start the search.
To change an existing search template
▪
Choose your settings in the Exchanges, Types and Search By lists.
▪
Click on the Search Template button and choose Save as.
▪
Choose the template that you want to change. The new settings are saved in this template and replace the old
settings.
To set a default search template
▪
Click on the Search Settings arrow and choose the template that you want to use as default.
▪
Click on the Search Template button and choose Set As Default.
Note
The default template is used when opening the Symbol Search dialog (see Searching for
Securities in the Symbol Search Dialog on page 34), creating a new document with File > New
Document (see Opening Symbols in New Documents on page 64), and when inserting symbols
into a document (see Inserting Symbols on page 74).
To rename a search template
▪
Click on the Search Settings arrow and choose the template that you want to rename.
▪
Click on the Search Template button and choose Rename.
To delete a search template
▪
Click on the Search Settings arrow and choose the template that you want to delete.
▪
Click on the Search Template button and choose Delete.
Finding Securities (Symbols)
44
TeleTrader Software GmbH
Marc-Aurel-Straße 10-12, 1010 Vienna, Austria
E-Mail [email protected]
Internet http://professional.teletrader.com
Saving Search Results to Tabs
You can automatically save your search results in the Symbol Search dialog. Each search results page is then
available as a tab:
New tabs are created automatically for each search as long as the option Save search to Tab is enabled:
To restart the search for a tab
You can start the search that is saved in a tab again with the same (or different) settings, in order to find new results
or reload the previous search results.
▪
Click on the tab to make it active.
▪
The search settings for this saved search are displayed on the left side of the Symbol Search dialog. You can
change these settings if necessary.
▪
Right-click on the tab and choose Restart Search.
To rename a tab
Note
The name of a tab is equal to its search term. If you rename a tab and then restart the search on
this tab, it will be conducted with the new search term (name) that you entered.
▪
Right-click on the tab and choose Rename.
▪
Enter the new name and press the ENTER key.
To move a tab
▪
Click on the tab and hold the mouse button down.
▪
Drag the tab to the desired location and release the mouse button.
To delete a tab
▪
Right-click on the tab and choose Delete.
To delete all tabs
▪
Right-click on any tab and choose Delete All.
To delete all tabs except the active one
▪
Click on the tab that you want to keep to make it active.
▪
Right-click on the tab and choose Delete All Except.
Finding Securities (Symbols)
45
TeleTrader Software GmbH
Marc-Aurel-Straße 10-12, 1010 Vienna, Austria
E-Mail [email protected]
Internet http://professional.teletrader.com
Displaying Symbols and Other Data
TeleTrader Professional can be used to display quote data for a wide range of securities, as well as current news
from all over the world, fundamental data such as company profiles or financial figures, and analyst
recommendations.
Quote data can be visualized in different ways, depending on your needs. For example, if you want to display the last
price of several symbols at once, you will probably choose a tabular layout, as in a price page or watch list. If you
want to show the development of historical and current data for one symbol at once, you will choose a chart where
you can see the whole time series of a symbol.
News stories, company profiles and analyst recommendations can be requested specifically for a symbol. News
headlines can also be displayed in a constantly updating overview.
In TeleTrader Professional, you can display symbols, their quote data and other data in documents, or in a pop-up
window or pane.
Professional documents
Documents are windows displayed inside the Professional main window. Each document shows a different view of
the data and offers different functions. You can create as many documents as you like and save them inside a
workspace.
The following document types are available:
Displaying Symbols and Other Data
Price Page
Overview of symbols in a table
Vertical Price
Page
Overview of symbols in a table in transposed
view compared to "classic" price pages
Chart
Visualization of the time series of a symbol
News
Current news from all over the world
Market Depth
Summary of all orders that are currently in the
market
Time and Sales
Chronological list of all orders and trades
46
TeleTrader Software GmbH
Marc-Aurel-Straße 10-12, 1010 Vienna, Austria
E-Mail [email protected]
Internet http://professional.teletrader.com
Watch List
Overview of symbols with basic portfolio
functionality
Options Matrix
Matrix of Call and Put options for an underlying,
grouped by strike price or expiration date
Quick Quote
Current price activity of one symbol
Profile
Fundamental values, company information and
balance sheet data
Analyzer
Graphical representation of analyst
recommendations
Note: The Analyzer is not included in all data
packages.
Web Watch
Any web page in an embedded browser window
Ticker pane
The Ticker pane also shows quote data on the screen. Unlike documents, you can only display it on the screen once.
Ticker
Live ticker with several symbols
What is a symbol?
In TeleTrader Professional, all stocks, futures, options, indices and other securities are called symbols. A symbol is
the unique identification given to every security that is traded on an exchange or over-the-counter market.
Each symbol has a type, which designates the category of the security or financial instrument. These categories are:
Stock, Future, Index, Currency, Warrant, Bond, Mutual Fund, Interest Rate, Option, Put Option, Call Option,
Certificate.
There is an additional special symbol type: The so-called chain symbol. This symbol does not hold data from one
security, but is rather a pointer to a list of "normal" symbols of different types, like a list of index constituents. The list
of symbols contained in a chain is automatically updated on the server. This means that when for example some new
stocks are added to the list of index constituents, the chain list will be automatically updated. Currently, chain symbols
can only be opened in price pages and time and sales documents – in other document types, you can only open the
list of symbols that the chain refers to (but the list will not be updated when it changes on the server).
Displaying Symbols and Other Data
47
TeleTrader Software GmbH
Marc-Aurel-Straße 10-12, 1010 Vienna, Austria
E-Mail [email protected]
Internet http://professional.teletrader.com
Price Page
You use a price page document when you want to display an overview of several symbols. A price page displays
symbols in a table, which is similar to popular spreadsheets.
Note
You can even export quote data from a price page to a spreadsheet software. See RTD –
Retrieving Real-Time Data with Excel on page 364 and DDE – Dynamic Data Exchange with Excel
/ Open Office on page 366.
Each row holds a symbol
The rows of a price page each hold one symbol and its data.
Each row has a so-called row header on the left. When you click on a row header, you select the whole symbol and
can then for example move it, change it or delete it.
The row header also shows which row is active at the moment: The active row is marked with an arrow sign. This
arrow is usually black. When it is red, this means that you have switched to the highlight mode. In highlight mode you
can show additional data about the symbols of your price page in linked documents (charts, time and sales, news,
market depth, options matrix and quick quote).
Price pages can also display chain symbols, which are symbol lists that are automatically updated on the server (for
example, a list of index constituents).
Learn more:
Rearranging and Resizing Rows and Columns on page 81
Sorting the Contents of a Price Page on page 88
Selecting Rows or Columns of a Price Page on page 89
Linking Documents to a Price Page on page 89
Displaying Chain Symbols in a Price Page on page 101
Each column holds a data field
The data that belongs to one symbol is organized in columns. The header of the column shows the name of the data
field that is displayed in this column. You can choose which columns should be displayed in a price page.
Displaying Symbols and Other Data
48
TeleTrader Software GmbH
Marc-Aurel-Straße 10-12, 1010 Vienna, Austria
E-Mail [email protected]
Internet http://professional.teletrader.com
You can assign an update style to some columns, which means that a visual effect is displayed whenever new quotes
arrive, depending on whether for example the price moved up or down. You can also define the number of decimals
that is used for a column.
The data inside the columns is organized in single cells. Each cell holds the a single value for a specific symbol.
Note
For delayed symbols, the number of delayed minutes is displayed in square brackets in the column
Ticker. In case a symbol is currently not available to you, the text "Not authorized" will appear in
the column Name.
Learn more:
Adding and Removing Columns on page 80
Changing the Update Style of a Column on page 83
Changing the Number of Decimal Places on page 83
Freezing a Column on page 89
Studies and expressions (formulas) in price pages
TeleTrader Professional offers a large amount of analysis tools (studies) to calculate indicators and signals. All
available TeleTrader studies that can be shown on a chart, including custom studies that you wrote yourself, can also
be shown in a price page.
For less complicated calculations, or calculations that need to take into account fields that are only shown in a price
page (such as fundamental data), you can also use so-called price page expressions. Those are mathematical
calculations that use simple formulas to calculate a result of the values already visible on your price page.
Learn more:
Adding, Removing and Customizing Study Columns on page 91
Inserting Price Page Expressions on page 94
Volume Weighted Average Price (VWAP) columns
You can extend your price page to show several VWAP columns: The Volume Weighted Average Price, its standard
deviation and other associated values. All VWAP calculation parameters can be customized.
Learn more:
Adding, Removing and Customizing the VWAP Columns on page 98
News Flash columns
You can show the latest related news stories for a symbol in a price page. The News Flash button displays the
number of recent news stories; the News Headline column displays the latest headline.
Learn more:
Adding, Removing and Customizing the News Flash Columns on page 100
Headers and sheets
To organize your price page, you can use headers, which form groups of rows, and sheets, which are represented by
tabs at the bottom of the price page. Headers also show the number of advancing and declining symbols in a group of
rows.
Learn more:
Inserting, Changing and Removing Headers on page 86
Adding and Organizing Sheets on page 87
Adapt the appearance of a price page to your needs
You can change the appearance and color of the grid lines of a price page, the font of the price page texts, the color
of the text and the background color of the price page.
Displaying Symbols and Other Data
49
TeleTrader Software GmbH
Marc-Aurel-Straße 10-12, 1010 Vienna, Austria
E-Mail [email protected]
Internet http://professional.teletrader.com
Learn more:
Changing the Grid Style on page 84
Changing Font and Colors on page 85
Get notifications when prices change or news come in
To get an automatic notification (sound, message or e-mail) when the price of a symbol reaches a certain level, use
price alerts. You can also be notified with a news alert whenever a specific keyword or phrase shows up in an
incoming news story.
Learn more:
Price Alerts on page 321
News Alerts on page 325
Alternative templates: Market Watch, My Market Watch, Last & Net Change
For price pages, three additional standard templates are available. They show the data in a more condensed way.
Market Watch
Note
My Market Watch
Last & Net Change
The possibilities to customize price page based on these templates are restricted. You can assign
update styles and change the font and colors. For My Market Watch, you can also add and
remove columns (data fields).
Vertical Price Page
The Vertical Price Page document shows symbols in columns and fields in rows (the data is transposed compared to
"classic" price pages). They offer the same functionality as "classic" price pages (only with columns / rows reversed),
with the following exceptions: No sorting functionalities, no headers and sheets, no VWAP, no column freezing, no
support for chain symbols.
Each column holds a symbol
The columns of a vertical price page each hold one symbol and its data.
Displaying Symbols and Other Data
50
TeleTrader Software GmbH
Marc-Aurel-Straße 10-12, 1010 Vienna, Austria
E-Mail [email protected]
Internet http://professional.teletrader.com
Each column has a so-called column header on the top. When you click on a column header, you select the whole
symbol and can then for example move it, change it or delete it.
The column header also shows which column is active at the moment: The active column is marked with an arrow
sign. This arrow is usually black. When it is red, this means that you have switched to the highlight mode. In highlight
mode you can show additional data about the symbols of your vertical price page in linked documents (charts, time
and sales, news, market depth, options matrix and quick quote).
Learn more:
Rearranging and Resizing Rows and Columns on page 81
Selecting Rows or Columns of a Price Page on page 89
Linking Documents to a Price Page on page 89
Each row holds a data field
The data that belongs to one symbol is organized in rows. The header of the row shows the name of the data field
that is displayed in this row. You can choose which row should be displayed in a vertical price page.
You can assign an update style to some rows, which means that a visual effect is displayed whenever new quotes
arrive, depending on whether for example the price moved up or down. You can also define the number of decimals
that is used for a row.
The data inside the row is organized in single cells. Each cell holds the a single value for a specific symbol.
Learn more:
Adding and Removing Columns on page 80
Changing the Update Style of a Column on page 83
Changing the Number of Decimal Places on page 83
Studies and expressions (formulas) in vertical price pages
TeleTrader Professional offers a large amount of analysis tools (studies) to calculate indicators and signals. All
available TeleTrader studies that can be shown on a chart, including custom studies that you wrote yourself, can also
be shown in a vertical price page.
For less complicated calculations, or calculations that need to take into account fields that are only shown in a price
page (such as fundamental data), you can also use so-called price page expressions. Those are mathematical
calculations that use simple formulas to calculate a result of the values already visible on your vertical price page.
Learn more:
Adding, Removing and Customizing Study Columns on page 91
Inserting Price Page Expressions on page 94
News Flash columns
You can show the latest related news stories for a symbol in a price page. The News Flash button displays the
number of recent news stories; the News Headline column displays the latest headline.
Learn more:
Adding, Removing and Customizing the News Flash Columns on page 100
Adapt the appearance of a vertical price page to your needs
You can change the appearance and color of the grid lines of a vertical price page, the font of the vertical price page
texts, the color of the text and the background color of the vertical price page.
Learn more:
Changing the Grid Style on page 84
Changing Font and Colors on page 85
Displaying Symbols and Other Data
51
TeleTrader Software GmbH
Marc-Aurel-Straße 10-12, 1010 Vienna, Austria
E-Mail [email protected]
Internet http://professional.teletrader.com
Chart
A chart document shows a visual representation of the whole time series of a symbol. You can display more than one
symbol in a chart, and also add studies (indicators or signals) or drawing objects (for example trend lines) to a chart.
Data compressions & chart types
The symbol (time series) displayed in a chart can be visualized with different chart types (for example line, bar,
candlestick, Point and Figure) and data compressions (monthly, weekly, daily, intraday or tick charts).
To show the historical data of the chart in a tabular format, you can use the Data Table View.
Learn more:
Changing the Data Compression on page 175
Changing the Chart Type on page 176
Inserting, Overlaying and Changing Symbols in a Chart on page 187
Customizing the Time Series on page 216
Displaying the Data Table View on page 214
Chart panes
Each chart can have one or more panes. You can display different symbols or studies in a chart pane. You can
customize the appearance of a chart pane and its header.
Learn more:
Creating and Organizing Chart Panes on page 209
Customizing the Chart Background and Headers on page 225
Navigating and Organizing a Chart on page 204
Displaying Symbols and Other Data
52
TeleTrader Software GmbH
Marc-Aurel-Straße 10-12, 1010 Vienna, Austria
E-Mail [email protected]
Internet http://professional.teletrader.com
Scales
Each chart has a horizontal time scale and a vertical price scale. If you display more than one symbol in one chart
pane, you can also add a second price scale to the chart.
Learn more:
Changing the Type of the Price Scale on page 185
Reading Values from a Chart on page 212
Customizing Price and Time Scales on page 228
Sheets
Similar as with price pages, you can organize your chart with sheets. Each sheet can have a different data
compression or chart type.
Learn more:
Using Sheets in Charts on page 211
Navigating and Organizing a Chart on page 204
Get notifications when prices change, chart objects intersect or signals appear
To get an automatic notification (sound, message or e-mail) when the price of a symbol reaches a certain level, use
price alerts. You can also get a notification when two chart objects that are in the same chart pane cross (so-called
intersection alert). These chart objects can for example be drawing objects (trend line, Fibonacci levels, etc.) or
studies (trigger lines, intersections with the time series, etc.). Use study alerts to get notified whenever a new signal
marker (Buy / Sell signal) appears on the chart.
Learn more:
Price Alerts on page 321
Intersection Alerts on page 326
Study Alerts on page 328
News
A news document shows an overview of several news stories with their headlines. Each headline has a marker
indicating whether the story has already been read.
Note
System messages informing you for example about exchange outages are also displayed as news
stories coming from the news service "TeleTrader Professional" and using a special news
template.
Displaying Symbols and Other Data
53
TeleTrader Software GmbH
Marc-Aurel-Straße 10-12, 1010 Vienna, Austria
E-Mail [email protected]
Internet http://professional.teletrader.com
News overview or specific news for a symbol
You can decide whether you want to see a news overview with current, updating news from all over the world, or a
news document that only shows relevant news for one specific symbol. You can also display the latest news headline
for a symbol in price pages.
Learn more:
Displaying News for a Symbol on page 68
Adding, Removing and Customizing the News Flash Columns on page 100
Displaying headlines or stories
The news document is usually split in two parts, with the top part showing the news headlines, and the bottom part
showing the open story. You can instead display only headlines, or only the news story, and adapt the colors and font
used to your needs.
Learn more:
Showing and Hiding News Headlines and Stories on page 106
Changing Font, Colors and Headline Data of News on page 107
Filtering and searching for keywords
You can filter the news stories that are shown in a news document by news service, category, keyword or range. In
addition, you can search for keywords or phrases in a news story or in the headlines. To get an automatic notification
whenever a news story with specific content arrives, use news alerts.
Learn more:
Filtering News Stories on page 107
Searching for Keywords in News on page 108
Quick Keyword Search in News on page 110
News Alerts on page 325
Displaying Symbols and Other Data
54
TeleTrader Software GmbH
Marc-Aurel-Straße 10-12, 1010 Vienna, Austria
E-Mail [email protected]
Internet http://professional.teletrader.com
Market Depth
In a market depth document, you can see a summary of all orders that are currently in the market. The document is
continuously updated as new orders arrive and existing orders are filled or being pulled from the market.
A market depth document consists of four parts, or views. The orders that are currently in the market are grouped by
their depth level in every view. Each depth level can be colored differently.
Note
Market depth is only available if the exchange provides the necessary data.
Learn more:
Showing and Hiding Views on page 111
Setting the Maximum Number and Colors for the Depth Levels in Market Depth on page 115
Filtering Information in Market Depth on page 115
Price view
The price view displays the inside market quote for the symbol (highest bid and lowest ask price) in columns – think of
it as a price page with only one symbol. It can be customized in the same way as a price page: You can insert and
rearrange columns, change the update style of a column and customize font, colors and grid lines.
Learn more:
Customizing the Price View on page 112
Summary view
The summary view shows a table with a summary of all orders that are in the market, grouped by depth level. The
best bids and asks are displayed at the top. You can see the bid / ask prices of each level, the calculated spread, the
number and accumulated size of the orders at this level, and the accumulated size of orders over all levels.
Learn more:
Customizing the Summary View on page 112
Displaying Symbols and Other Data
55
TeleTrader Software GmbH
Marc-Aurel-Straße 10-12, 1010 Vienna, Austria
E-Mail [email protected]
Internet http://professional.teletrader.com
Graph view
The graph view visualizes the data displayed in the summary view. Each bar represents a depth level. The length (or
height) of the bar represents the size of the orders at this depth level. The bars can be displayed vertically (ask bars
are shown in the top part) or horizontally (ask bars are shown in the right part).
The graph view is divided into two sections: The ask section and the bid section. The background color for each
section can be set individually. You can also choose if you want the two sections to take up the same amount of
space (fixed separation line), or if you want to see which side has more orders with a floating separation line.
Learn more:
Customizing the Graph View on page 113
Depth view
The depth view shows all bids and asks side by side. It shows more detailed data than the summary view (at the
moment only available for NASDAQ). The best bids and asks are displayed at the top.
Learn more:
Customizing the Depth View on page 114
Time and Sales
The time and sales document is a chronological list that shows all market activity of one or several symbols. Each bid
and ask that is in the market and each trade that takes place on the exchange is listed here row by row. You can also
use the time and sales document to verify the quotes of a symbol. Each time and sales document consists of two
views: The price page view and the time and sales view.
Time and sales data for multiple symbols or for one single symbol
You can display the market activity for a single symbol, or all trades, bids and asks for multiple symbols. By default,
all new time and sales documents show the time and sales data for all symbols at once. You can also switch between
the symbols manually instead. In addition, you can add and remove symbols, and assign a different color to every
symbol.
Time and sales documents can also display chain symbols, which are symbol lists that are automatically updated on
the server (for example, a list of index constituents).
Displaying Symbols and Other Data
56
TeleTrader Software GmbH
Marc-Aurel-Straße 10-12, 1010 Vienna, Austria
E-Mail [email protected]
Internet http://professional.teletrader.com
To organize the contents of a time and sales documents, you can use sheets – in each sheet, you can use different
columns, colors and fonts.
Learn more:
Showing Data for a Single Symbol or Multiple Symbols in Time and Sales on page 117
Showing and Hiding Views on page 117
Adding and Removing Symbols in Time and Sales on page 118
Assigning Colors to Individual Symbols on page 119
Adding and Removing Columns in the Time and Sales View on page 120
Displaying Chain Symbols in Time and Sales on page 124
Each row in the price page view shows a symbol
The price page view shows all symbols that are visible in the time and sales document. This allows you to easily
switch between the symbols, if you have chosen to only see time and sales data for the selected symbol. Like in a
normal price page, you can insert and rearrange columns, change the update style of a column and customize font,
colors and grid lines. You can also link other documents like charts to the price page view of time and sales.
Learn more:
Customizing the Price Page View on page 123
Linking Documents to Time and Sales on page 124
Each row in the time and sales view shows a trade or order
The rows of the time and sales view either show an order that was placed or a trade that was done. For trades, the
last price and the volume of the trade is displayed, for orders the Bid or Ask price and the size of the order is shown.
The data shown for each trade or order is organized in columns. You can change the appearance and color of the
grid lines, the font and color of the text and the background color of time and sales.
Learn more:
Changing the Grid Style, Font and Colors of the Time and Sales View on page 120
Change the data displayed
By default, the time and sales document is updated every time a new order or trade is entered for the symbol.
However, you can also use it to display historical data from a specific period of time. Additionally, a filter lets you
define price and/or volume ranges.
Learn more:
Changing the Amount of Data Displayed in Time and Sales on page 122
Filtering Information in Time and Sales on page 123
Get notifications when prices change
To get an automatic notification (sound, message or e-mail) when the price of a symbol reaches a certain level, use
price alerts.
Learn more:
Price Alerts on page 321
Displaying Symbols and Other Data
57
TeleTrader Software GmbH
Marc-Aurel-Straße 10-12, 1010 Vienna, Austria
E-Mail [email protected]
Internet http://professional.teletrader.com
Alternative template: Time and Sales US
An alternative, US-style standard template is available for time and sales documents. It shows the data in a more
condensed way.
Note
The possibilities to customize US-style time and sales documents are restricted. You can change
the amount of data displayed and change the font and colors of the time and sales document.
Watch List
Watch list documents are very similar to price pages. They show an overview of several symbols in a table. In
addition to the functionalities of a price page, watch lists also offer basic portfolio functionalities.
Price page with additional functionality
A watch list consists of a part that works like a normal price page. You can add, remove and customize columns just
like on a normal price page. In addition, each watch list shows eight additional columns after the price page columns.
The first four columns you have to fill yourself when you add a symbol to your portfolio, the other four columns are
calculated automatically.
Learn more:
Customizing Watch Lists on page 132
Simulate your portfolio in real-time
For each symbol in your portfolio, enter the date when you bought the security, the price you paid, the amount you
bought and optionally also a multiplier (for example for Forex adjustments or derivative contracts). The value of your
asset and profit / loss calculations for your portfolio are calculated automatically by the watch list, based on the
current quotes at the exchange.
Learn more:
Displaying Symbols and Other Data
58
TeleTrader Software GmbH
Marc-Aurel-Straße 10-12, 1010 Vienna, Austria
E-Mail [email protected]
Internet http://professional.teletrader.com
Entering Amounts, Buy Dates and Prices in a Watch List on page 134
Options Matrix
The options matrix shows all options for an underlying symbol (for example a stock, index or future). The options are
grouped by expiration date or by strike price, with Calls on the left side and Puts on the right side.
Note
Currently the options matrix is only available for options traded on Eurex.
When you try to open an options matrix for an underlying symbol for which more than one options
product is traded on Eurex (e.g. the BASF stock), you can choose the appropriate options in a
dialog (e.g. BASF Options or BASF European Options). To remember your choice, select the
option Always use this product in the dialog. If you want to see the dialog again later, press and
hold the SHIFT key while trying to open an options matrix for this underlying.
You can also easily open a price page with options symbols / underlyings by using the command
Related Symbols. See Opening Related Symbols in a Price Page on page 71.
Underlying view and options matrix view
Information about the underlying symbol is shown on top. Below, the options for this symbol are displayed: Calls on
the left and Puts on the right. The column layout in the options matrix view can be mirrored or identical on both sides.
You can also change the number of decimal places that is shown for both the underlying and its options.
Learn more:
Showing, Hiding and Changing Views on page 127
Changing the Number of Decimal Places on page 128
Customizing the Underlying View on page 129
Customizing the Options Matrix View on page 131
Displaying Symbols and Other Data
59
TeleTrader Software GmbH
Marc-Aurel-Straße 10-12, 1010 Vienna, Austria
E-Mail [email protected]
Internet http://professional.teletrader.com
Options organized into groups
The options are grouped by their expiration date or by their strike price. Grouping by expiration date is the default
setting – in that case, the middle column (shown in the same color as the group headers) displays the available strike
prices for the chosen expiration date. The group containing the front month options is expanded automatically – other
groups can be expanded or collapsed by double-clicking their group header.
Learn more:
Showing, Hiding and Changing Views on page 127
Greeks, Put/Call Ratio and filtered Put/Call Ratio
You can show both the so-called "Greeks" and the Put/Call Ratio in the options matrix document. The Greeks
(Theoretical Value, Delta, Gamma, Vega, Theta, Rho) for the highlighted options contracts are shown in a separate
Greeks view. The current Put/Call Ratio of all options for an underlying is shown as an additional column in the
underlying view of the options matrix. You can also add a column showing the filtered Put/Call Ratio there – this ratio
is calculated only from the data that is currently visible in the options matrix (taking into account all expanded groups
and filter settings).
Learn more:
Showing Greeks and the Put/Call Ratio on page 129
Customizing the Greeks View on page 130
Filter by expiration date or strike price
You can choose which expiration dates and strike prices should be visible in the options matrix view.
Learn more:
Filtering Information in the Options Matrix on page 128
Get notifications when prices change
To get an automatic notification (sound, message or e-mail) when the price of an option reaches a certain level, use
price alerts.
Learn more:
Price Alerts
Profile
TeleTrader maintains an extensive database of fundamental data, covering over 1.500 companies, including all large
listed companies. You can access detailed company profiles including a company calendar, performance data and
sector comparison information, fundamental values and multi-year balance data.
Displaying Symbols and Other Data
60
TeleTrader Software GmbH
Marc-Aurel-Straße 10-12, 1010 Vienna, Austria
E-Mail [email protected]
Internet http://professional.teletrader.com
Use the Professional icon
to open documents (chart, market depth, time and sales) from the profile and easily
show arbitrage lists or sector comparison price pages. Click the
icon to show the symbol's PDF factsheet.
Learn more:
Displaying Company Profiles for a Symbol on page 69
Analyzer
TeleTrader Analyzer evaluates the most important stock analyses of banks, brokers and other institutions with
statistical methods and graphically illustrates them on the screen. It shows the prevailing trend of analyst
recommendations in a graphical overview. The assumed potential (price target) of the stock is directly plotted on a
chart; buy / sell / hold recommendations are visualized in a "tachometer".
By clicking on the Analyzer chart in the web watch window, you can open a chart document in Professional that
shows the channel of price targets as an additional symbol.
Note
The Analyzer is not available in all data packages. Contact the support team if you are interested –
see Customer Support on page 534.
Displaying Symbols and Other Data
61
TeleTrader Software GmbH
Marc-Aurel-Straße 10-12, 1010 Vienna, Austria
E-Mail [email protected]
Internet http://professional.teletrader.com
Learn more:
Displaying Analyst Recommendations for a Symbol on page 70
Web Watch
A web watch document is an embedded browser window that can display any Internet web page, just like you would
with your normal Internet browser. As the browser window is embedded in TeleTrader Professional, it can be
positioned on a virtual page, saved in a workspace etc. just like any other Professional document.
To open a new web watch browser window
You can open a new web watch browser window, just like you would open any Professional document, with File >
New Document.
See Opening Symbols in New Documents on page 64 for details.
Displaying Symbols and Other Data
62
TeleTrader Software GmbH
Marc-Aurel-Straße 10-12, 1010 Vienna, Austria
E-Mail [email protected]
Internet http://professional.teletrader.com
History of visited links
All links that you visit while a web watch window is open are automatically stored in a history of visited links. You can
access and edit this history if needed.
Learn more:
Managing Visited Links on page 135
Browser navigation bar
At the top of each web watch window, a navigation bar gives you access to the basic functions of a web browser,
such as going back to the previous page, searching and reloading the current page, etc.
Learn more:
Navigating Between Web Pages on page 136
Quick Quote
Quick Quote shows the current price activity for one specific symbol. Quick Quote displays only data from one
symbol. The data displayed depends on the symbol type, that means for stocks other data is shown than for futures.
You can customize the data shown in Quick Quote as well as its font, colors, orientation and update style. You can
also show Market Depth data in the Quick Quote document.
Learn more:
Changing the Fields, Update Style, Font and Colors of Quick Quote on page 136
Quick Quote Settings on page 346
Ticker
The ticker pane displays the last price and change for several symbols, similar to the tickers known from stock
exchanges or TV screens. The symbols in the live ticker are scrolled continuously in one direction. You can add
symbols to the ticker and remove them again, change how symbols are displayed in the ticker, and adapt the font and
colors used in the ticker.
Learn more:
Displaying Symbols in the Ticker on page 72
Changing the Data Displayed in the Ticker on page 138
Changing Speed and Direction of the Ticker on page 138
Changing Font and Colors of the Ticker on page 139
Filtering Information in the Ticker on page 139
Opening Symbols
To display a symbol, you first have to open it in a document. You can do this in several ways:
▫
Use the QuickBar, which holds the most popular symbols: See Opening Symbols from the QuickBar on page 31
Displaying Symbols and Other Data
63
TeleTrader Software GmbH
Marc-Aurel-Straße 10-12, 1010 Vienna, Austria
E-Mail [email protected]
Internet http://professional.teletrader.com
▫
Use Symbol Search to find and open a specific symbol: See Opening Symbols from the Search Results on page
38
▫
Create a new empty document and insert one or more symbols there: See Opening Symbols in New Documents
on page 64
▫
Take a symbol that is already displayed in a document and open it in another document: See Opening Symbols
from Existing Documents on page 66
▫
Create a new document with default symbol / template from main window or any document: See Opening
Symbols using Keyword Commands on page 67.
▫
Open a symbol that was stored in FastLook: See Opening Symbols from FastLook on page 167
If you want to display a symbol in the live ticker, see Displaying Symbols in the Ticker on page 72.
Opening Symbols in New Documents
When you open a symbol in a new document, you first choose which document type you want to display, and then
add one or more symbols with the Symbol Search dialog. For example, you could create a new chart document and
add the DAX symbol to it.
Note
The Symbol Search dialog will not show up for news and web watch documents, as those don’t
show quote data.
To open a symbol in a new document
▪
On the File menu, click New Document.
Note
▪
You can also click on the New Document icon in the Main toolbar:
In the New Document dialog, choose the document type by clicking on the corresponding tab.
Displaying Symbols and Other Data
64
TeleTrader Software GmbH
Marc-Aurel-Straße 10-12, 1010 Vienna, Austria
E-Mail [email protected]
Internet http://professional.teletrader.com
▪
In the Template pane on the left side, click on the template that you want to use. You can see a preview of the
template in the Preview pane on the right side.
Note
The default template (red label) is preselected. You can change the default template: See
Organizing Templates on page 147.
▪
Click OK. The Symbol Search dialog is displayed.
▪
Enter your search term in the first field on the left side and change the search settings, if necessary. For more
information, see Searching for Securities in the Symbol Search Dialog on page 34.
▪
Click on the green button or press the ENTER key to start the search.
▪
Select the symbol(s) that you want to open with the new document.
▪
Click OK. The new document is formatted with the chosen template.
To open a symbol in a new document from the toolbar
▪
Click on the arrow of the New Document icon in the Main toolbar.
Displaying Symbols and Other Data
65
TeleTrader Software GmbH
Marc-Aurel-Straße 10-12, 1010 Vienna, Austria
E-Mail [email protected]
Internet http://professional.teletrader.com
▪
Choose a document type from the list.
▪
In the Symbol Search dialog, enter your search term in the first field on the left side and change the search
settings, if necessary. For more information, see Searching for Securities in the Symbol Search Dialog on page
34.
▪
Click on the green button or press the ENTER key to start the search.
▪
Select the symbol(s) that you want to open.
▪
Click OK. The new document is formatted with the default template.
Note
For time and sales documents and price pages, there are additional standard templates. See Price
Page on page 48 and Time and Sales on page 56.
Opening Symbols from Existing Documents
When a symbol is already shown on the screen inside a document, you can display the symbol in a different
document type. For example, you can open a market depth document for each symbol displayed in a price page.
To open a symbol with the default document type
▪
In a price page, chart, market depth, time and sales, options matrix, quick quote or watch list document, doubleclick on the symbol.
Note
▪
In market depth and quick quote documents, you can double-click anywhere in the document. In
price pages, watch lists, options matrix and time and sales documents, you have to double-click on
the row of the symbol that you want to open. In charts, you have to double-click the time series
(bars, candles or other data points) of the symbol.
A new document is opened for the symbol. The document is formatted with the default template.
Double-click in…
Opens…
Price Page
Chart
Chart
Time and Sales
Market Depth
Chart
Time and Sales
Chart
Options Matrix
Chart
Watch List
Chart
Displaying Symbols and Other Data
66
TeleTrader Software GmbH
Marc-Aurel-Straße 10-12, 1010 Vienna, Austria
E-Mail [email protected]
Internet http://professional.teletrader.com
Quick Quote
Note
Chart
You can change the default document that is opened. See Double-Click Actions Settings on page
346.
To open a symbol with other document types
▪
In a price page, chart, market depth, time and sales, options matrix, quick quote or watch list document, rightclick on the symbol and choose Open.
Note
In market depth and quick quote documents, you can right-click anywhere in the document. In
price pages, watch lists, options matrix and time and sales documents, you have to right-click on
the row of the symbol that you want to open. In charts, you have to right-click the time series (bars,
candles or other data points) of the symbol.
▪
Choose the document type from the list.
▪
A new document is opened for the symbol. The document is formatted with the default template.
Note
From price pages, watch lists, options matrices and the price page view of time and sales
documents, you can open separate documents for more than one symbol simultaneously. Select
the symbols by clicking on them while keeping the CTRL key pressed (see Selecting Rows or
Columns of a Price Page on page 89), then follow the steps above.
If you select several symbols, and open a new price page, watch list or time and sales document
for them, by default all symbols will be combined in one document. If you keep the CTRL key
pressed while choosing the document type, each symbol will be opened in a separate document.
If you open a new chart document while selecting several symbols, holding the CTRL key will open
overlaid symbols in one chart pane. To open every symbol in its own chart pane, hold both the
CTRL + SHIFT while choosing the document type Charts.
To open a symbol using a template
▪
In a price page, chart, market depth, time and sales, options matrix, quick quote or watch list document, rightclick on the symbol and choose Open.
▪
Right-click the document type you want to use (or move the mouse pointer to the document type and wait for a
moment) – an additional menu will appear to the right.
▪
Choose a template from the list.
▪
A new document is opened for the symbol. The document is formatted with the chosen template.
Opening Symbols using Keyword Commands
Besides opening symbols from the QuickBar, search results, or from existing documents, you can also open them
from the Professional main window or in a different document type by using keyword commands. For example, you
can open a market depth document for a default symbol (DAX) by typing the following command: .MD over the
Professional main window area and then pressing the ENTER key. Every document is opened with its default template.
Keyword commands are typed commands that are entered in the same way as chartable expressions. They are used
for easier manipulation of documents. Each keyword command can be entered either as a full keyword, or by typing
the appropriate keyword abbreviation. For example: To open a news document with the default template, you can
type .NEWS or .NE and press the ENTER key.
Displaying Symbols and Other Data
67
TeleTrader Software GmbH
Marc-Aurel-Straße 10-12, 1010 Vienna, Austria
E-Mail [email protected]
Internet http://professional.teletrader.com
Note
When entering keyword commands, you have to enter the minimum number of characters required
for that specific command to be executed. For example, in order to excecute the NEWS command,
you can type any number of characters from the minimum up to the whole command: .NE, .NEW,
or .NEWS.
Keyword commands – important characteristics
▪
Keyword commands are not case sensitive. This means that keyword commands can be typed as .NEWS or
.news.
▪
All keyword commands must start with a point. Typing just NEWS without the point instead of .NEWS will not
execute the command.
To open a price page document from the Professional main window - using
keyword command
▪
In the Professional main window, just type the keyword abbreviation, for example .PP.
▪
Price page documenbol (default symbol) and is formatted using the default template.
To open a market depth document from another document - using keyword
command
▪
In price page document, click in the row of the desired symbol.
▪
Type the keyword abbreviation, for example .MD.
▪
Market depth document opens for the selected symbol and is formatted using the default template.
List of keyword commands:
Keyword command
Minimal command
abbreviation
.PP
.PP
Opens the Price Page document
.VP
.VP
Opens the Vertical Price Page document
.WL
.WL
Opens the Watch List document
.CH
.CH
Opens the Chart document
.MD
.MD
Opens the Market Depth document
.TS or .T&S
.TS or .T&S
Opens the Time & Sales document
.QQ
.QQ
Opens the Quick Quote document
.NEWS
.NE
Opens the News document with the default template.
Note
Action taken
If you enter keyword commands over a detached document, newly opened document will also be
detached.
Displaying News for a Symbol
For each symbol that is shown in a document, in the Symbol Search results or in FastLook, you can call up related
news stories in a separate document. If you want to see an overview of all current news stories, use the QuickBar or
open a default news document from the File menu.
Displaying Symbols and Other Data
68
TeleTrader Software GmbH
Marc-Aurel-Straße 10-12, 1010 Vienna, Austria
E-Mail [email protected]
Internet http://professional.teletrader.com
To show related news for a symbol
There are several ways to show a news document with relevant news for a symbol:
▫
Find the symbol with Symbol Search and open a document showing related news with the Open button: Opening
Symbols from the Search Results on page 38.
▫
Right-click on a symbol that is already displayed in a document and open related news with Open > Search
News: Opening Symbols from Existing Documents on page 66.
▫
Right-click on a symbol that was stored in FastLook and open related news with Open > Search News: Opening
Symbols from FastLook on page 167.
Note
The ISIN of a symbol is used to search for relevant news stories. If the chosen security does not
have an ISIN, or the news service does not support ISIN search, this feature will not work.
To show a current news overview
There are several ways to show a news overview:
▫
Click on the icon News in the QuickBar:
▫
Create a news overview document with File > New Document: See Opening Symbols in New Documents on
page 64.
To show the latest headline for a symbol in a price page
See Adding, Removing and Customizing the News Flash Columns on page 100.
Displaying Company Profiles for a Symbol
You can call up the profile for a company directly from the symbol that is displayed in a document. This works similar
to opening the symbol in a new document.
To request a company profile for a specific symbol
▫
Find the symbol in the QuickBar and open it with the document type Profile: See Opening Symbols from the
QuickBar on page 31
▫
Find the symbol with Symbol Search and open its profile with the Open button: See Opening Symbols from the
Search Results on page 38
▫
Right-click on a symbol that is already displayed in a document and open its profile with Open > Profile: See
Opening Symbols from Existing Documents on page 66
▫
Right-click on a symbol that was stored in FastLook and open its profile with Open > Profile: See Opening
Symbols from FastLook on page 167
To switch the market of the displayed symbol
▪
Click the market's name on top of the profile and choose another market from the list.
Displaying Symbols and Other Data
69
TeleTrader Software GmbH
Marc-Aurel-Straße 10-12, 1010 Vienna, Austria
E-Mail [email protected]
Internet http://professional.teletrader.com
To open a Professional document from the profile
▪
Click the Professional icon
and choose Price page, Chart, Market Depth or Time & Sales to open the
symbol in a Professional document.
▪
On the Overview page, click the
icon in the Markets section to open an arbitrage list for the symbol, or click
the same icon in the Sector comparison section to open a price page with other companies in the same sector.
To open a PDF factsheet for the symbol
▪
Click the
icon to open a PDF factsheet for the symbol.
Displaying Analyst Recommendations for a Symbol
You can call up a web watch window with analyst recommendations (Analyzer) directly from the symbol that is
displayed in a document. This works similar to opening the symbol in a new document.
From the Analyzer document, you can open a Professional chart showing the price targets for a stock as a channel.
Note
The Analyzer is not available in all data packages. Contact the support team if you are interested –
see Customer Support on page 534.
To request analyst recommendations for a specific symbol
▫
Find the symbol in the QuickBar and open it with the document type Analyzer: See Opening Symbols from the
QuickBar on page 31
▫
Find the symbol with Symbol Search and open the Analyzer with the Open button: See Opening Symbols from
the Search Results on page 38
▫
Right-click on a symbol that is already displayed in a document and open the Analyzer with Open > Analyzer:
See Opening Symbols from Existing Documents on page 66
▫
Right-click on a symbol that was stored in FastLook and open the Analyzer with Open > Analyzer: See Opening
Symbols from FastLook on page 167
To open a chart with price targets from the Analyzer
▪
Click on the chart that is shown in the Analyzer window.
Displaying Symbols and Other Data
70
TeleTrader Software GmbH
Marc-Aurel-Straße 10-12, 1010 Vienna, Austria
E-Mail [email protected]
Internet http://professional.teletrader.com
▪
A Professional chart document opens that shows the symbol of the security and an additional symbol with the
analyst recommendations.
Opening Related Symbols in a Price Page
For each symbol that is shown in a document, you can also search for related symbols and display them in a price
page. A related symbol usually has the same ISIN as the original symbol, and may have the same or a different
symbol type; it may also be related hierarchically (for example, options for a stock / underlying for an option contract
or index chain for a stock).
When you are looking at a news story where an ISIN is mentioned, you can also open a list of related symbols by
clicking on it.
To open a list of related symbols
▪
In a price page, chart, market depth, time and sales, options matrix, quick quote or watch list document, rightclick on a symbol and choose Related Symbols.
▪
Choose from the list which symbols should be shown:
<Name of related chain>
For some symbols, you can open a related chain symbol. For example, if a stock is
part of an index, you can open the appropriate index chain in a price page.
Arbitrage List
Shows all symbols that have the same ISIN and symbol type (such as stock, future
etc.) as the original symbol in a price page. The list is sorted by exchange – you
can customize the order of exchanges under Tools > Options > Price Page >
Arbitrage Lists (see Aribtrage List Settings on page 345).
Same ISIN
Shows all symbols that have the same ISIN in a price page. This could also
include other symbol types than that of the original symbol.
Symbol Search
Opens the Symbol Search dialog with the ISIN of the original symbol as the search
term, and its symbol type preselected in the search settings.
All Options
Shows all Eurex options related to the original symbol in a price page.
Put Options
Shows the Eurex Put options related to the original symbol in a price page.
Displaying Symbols and Other Data
71
TeleTrader Software GmbH
Marc-Aurel-Straße 10-12, 1010 Vienna, Austria
E-Mail [email protected]
Internet http://professional.teletrader.com
▪
Call Options
Shows the Eurex Call options related to the original symbol in a price page.
Underlying
Shows an arbitrage list of the underlying symbol for a Eurex options contract in a
price page.
A price page containing the list of related symbols will be opened. The price page is formatted with the default
template.
To open a list of related symbols using a template
▪
In a price page, chart, market depth, time and sales, options matrix, quick quote or watch list document, rightclick on a symbol and choose Related Symbols.
▪
Right-click the symbol list you want to use (or move the mouse pointer to the symbol list and wait for a moment) –
an additional menu will appear to the right.
▪
Choose a template from the list.
▪
A price page containing the list of related symbols will be opened. The price page is formatted with the chosen
template.
To open a list of related symbols from a news story
▪
In a news story, click on an highlighted ISIN to open a price page with an arbitrage list of related symbols.
Displaying Symbols in the Ticker
The ticker is a pane inside the Professional main window. When you add symbols to it, Professional will automatically
store them and display these symbols each time you show the ticker pane.
To display the ticker pane
▪
On the View menu, click Ticker.
▪
By default, the ticker pane is empty. You have to add symbols to it.
To add a symbol to the ticker
▪
Right-click on the ticker pane and choose Insert Symbols.
▪
The Symbol Search dialog is displayed.
▪
Enter your search term in the first field on the left side and change the search settings, if necessary. For more
information, see Searching for Securities in the Symbol Search Dialog on page 34.
▪
Click on the green button or press the ENTER key to start the search.
▪
Select the symbol(s) that you want to add to the ticker.
▪
Click OK.
Note
You can also add symbols with drag and drop (see Copying Symbols on page 75) or in the Ticker
Symbols dialog (see below).
To remove a symbol from the ticker
▪
Right-click on the ticker pane and choose Edit Symbols.
Displaying Symbols and Other Data
72
TeleTrader Software GmbH
Marc-Aurel-Straße 10-12, 1010 Vienna, Austria
E-Mail [email protected]
Internet http://professional.teletrader.com
▪
In the Ticker Symbols dialog, select the symbol that you want to remove.
▪
Click Delete.
▪
Click OK.
Note
You can also add symbols in the Ticker Symbols dialog: Click Add and choose the symbol(s)
from the Symbol Search dialog.
Changing, Inserting and Removing Symbols
In each document and also in the ticker pane, you can change a symbol that is displayed in the document. In
documents which can show more than one symbol (price pages, watch lists, time and sales and charts), you can also
insert and remove symbols.
Changing Symbols
You can change a symbol in one document or in all open documents at once. You can also change a symbol stored
in FastLook with this method.
Note
Sometimes the exchanges assign a different name to a symbol. When this happens, you will be
notified by the support team to use the new symbol. You can use the steps described below to
change the symbol in all open documents at once.
To change a symbol
▪
In a price page, chart, market depth, time and sales, options matrix, quick quote or watch list document, select a
symbol.
▪
On the Tools menu, click Change Symbol.
▪
In the Change Symbol dialog, the symbol that will be replaced is displayed in the From field.
Note
If you want to change another symbol, you can choose it from the From list.
▪
In the To field, enter a search term and click Find.
▪
In the Symbol Search dialog, select the new symbol and click OK.
▪
Set the document options:
-
Note
Active document: The symbol is changed only in the document where you selected the symbol.
You can also replace the symbol in the active document by just overwriting it with a new symbol –
see Calling Symbol Search from a Document on page 41.
Displaying Symbols and Other Data
73
TeleTrader Software GmbH
Marc-Aurel-Straße 10-12, 1010 Vienna, Austria
E-Mail [email protected]
Internet http://professional.teletrader.com
▪
▪
Selected documents: The symbol is changed in open documents, windows and panes of a specific type.
Select the types that you want to include in the change.
Set the Virtual Pages options:
-
Active Page: The symbol is only changed in the Virtual Page that you currently see on the screen.
-
All Pages: The symbol is changed in all Virtual Pages of your workspace.
Click OK to change the old symbol to the new symbol.
Note
Chain symbols (pointer to a list of symbols) can only be changed to other chain symbols. Also,
symbols that are part of a chain that is displayed in a price page or time and sales document will
not be affected by a global change. See also Displaying Chain Symbols in a Price Page on page
101and Displaying Chain Symbols in Time and Sales on page 124.
Converting Futures to Forward Contracts
You can convert any futures symbol to a so-called forward contract. A forward contract will always show the
appropriate "front month" contract, which means that it will never show an expired futures contract. As soon as the
front month contract expires, it is automatically rolled over to the next available contract.
Note
TeleTrader Professional also offer continuous contracts and continuation charts, which
allow you to chart a longer history of data for technical analysis by combining several futures
contracts together (see Continuous Contracts / Continuation Charts on page 234). In price pages
and other documents, continuous contracts behave similar to forward contracts, in that they
automatically roll over to a newer contract. The difference between the two contract types is that
forward contracts always roll over on expiration date, whereas continuous contracts can also roll
over based on other trigger conditions, like volume or open interest.
To convert a futures symbol to a forward contract
▪
Right-click on the futures symbol and choose Convert to Forward.
Note
On the QuickBar, most symbols are already defined as forward contracts, which means that the
command Convert to Forward is in most cases no longer available for symbols that are opened
from the QuickBar (see Opening Symbols from the QuickBar on page 31).
Inserting Symbols
You can only insert additional symbols in documents that can display more than one symbol: Price pages, watch lists,
charts, and time and sales documents.
To insert a symbol in a price page, watch list or time and sales document
▪
In a price page, watch list or time and sales document, right-click on the row where the symbol should be
inserted and choose Insert Symbols.
▪
In the Symbol Search dialog, enter your search term in the first field on the left side and change the search
settings, if necessary. For more information, see Searching for Securities in the Symbol Search Dialog on page
34.
▪
Click on the green button or press the ENTER key to start the search.
▪
Select the symbol(s) that you want to insert.
▪
Click OK. The symbol is inserted in the selected row, moving the following rows down.
Displaying Symbols and Other Data
74
TeleTrader Software GmbH
Marc-Aurel-Straße 10-12, 1010 Vienna, Austria
E-Mail [email protected]
Internet http://professional.teletrader.com
To insert a symbol in a chart
▪
In a chart document, right-click in the chart pane below which the symbol should be inserted and choose Insert >
Symbol.
▪
In the Symbol Search dialog, enter your search term in the first field on the left side and change the search
settings, if necessary. For more information, see Searching for Securities in the Symbol Search Dialog on page
34.
▪
Click on the green button or press the ENTER key to start the search.
▪
Select the symbol that you want to insert.
▪
Click OK. The symbol is inserted in a new pane below the selected chart pane.
To insert a symbol into the live ticker
See Displaying Symbols in the Ticker on page 72
Copying Symbols
Symbols can be copied among documents with drag and drop. In price pages, you can also create a copy of a symbol
in the row beneath the current symbol.
To copy a symbol between documents with drag and drop
▪
▪
Select the symbol that you want to copy:
-
In a price page, watch list, options matrix or the price page view of time and sales, select the symbol by
clicking on its row header.
-
In a chart, select the symbol by clicking on the time series.
-
In the Symbol Search dialog, the QuickBar or FastLook, select the symbol by clicking on it.
Hold the mouse button down and move the symbol. The mouse pointer changes:
Dragging a symbol from a price page, watch list, options matrix, time and sales or Symbol Search
Dragging a symbol from a chart
Dragging a symbol from FastLook
▪
Drag the symbol to its new location and release the mouse button to drop it there. Depending on the target
document or window where you drop the symbol, you can choose its exact location:
Target is…
To choose the location for the symbol…
Price Page
Drop the symbol in the row where you want to insert it.
Chart
Drop the symbol inside a chart pane to insert it as an overlay.
Drop the symbol on a pane header to insert it in a separate chart pane.
Drop the symbol on an existing time series to replace it with the new symbol (note that the
pointer will lose the plus sign in this case).
Data Table
Drop the symbol on the column headers of the data table to insert it on an additional tab in
the data table and as an overlay on the corresponding chart.
Drop the symbol on the data table view of a chart to replace the current symbol in both the
data table and the corresponding chart (note that the pointer will lose the plus sign in this
case).
Market Depth
Drop the symbol anywhere to change the displayed symbol.
Time and Sales
Drop the symbol anywhere to add it to the symbol list.
Displaying Symbols and Other Data
75
TeleTrader Software GmbH
Marc-Aurel-Straße 10-12, 1010 Vienna, Austria
E-Mail [email protected]
Internet http://professional.teletrader.com
Options Matrix
Drop the symbol anywhere to change the underlying symbol.
Quick Quote
Drop the symbol anywhere to change the displayed symbol.
Watch List
Drop the symbol in the row where you want to insert it.
FastLook
Drop the symbol on the folder where you want to insert it.
Ticker
Drop the symbol anywhere to add it to the ticker.
To create a copy of a symbol in a price page
▪
In a price page, right-click on the symbol and choose Insert Copy of Symbol.
▪
In the row beneath the current symbol, an exact copy of the symbol is created. This can for example be useful for
VWAP calculations with different time periods (see also Adding, Removing and Customizing the VWAP Columns
on page 98).
Removing Symbols
You can only remove a symbol from documents that can display more than one symbol: Price pages, watch lists,
charts, and time and sales documents. You can also delete symbols from the ticker.
In price pages, you can also delete a symbol, but keep the empty row in the tabular overview.
To remove a symbol from a price page, watch list, chart or time and sales
document
Warning
▪
This action cannot be undone. This will remove the symbol from the chosen document.
In a price page, watch list, chart or time and sales document, right-click on the symbol and choose Delete (in
time and sales: Remove Symbol).
Note
In price pages, watch lists and time and sales documents, you have to right-click on the row of the
symbol that you want to remove. In charts, you have to right-click the time series (bars, candles or
other data points) of the symbol.
▪
In price pages and watch lists, you might be asked whether you want to remove the symbol or the columns that
you have marked. Choose the appropriate option and click OK.
▪
In charts, you can also use the Format Objects dialog to remove symbols: See Customizing Chart Objects on
page 233.
To clear a row in a price page
▪
In a price page document, right-click on the symbol and choose Clear.
▪
The symbol is removed from the price page, the empty row remains.
Displaying Symbols and Other Data
76
TeleTrader Software GmbH
Marc-Aurel-Straße 10-12, 1010 Vienna, Austria
E-Mail [email protected]
Internet http://professional.teletrader.com
To remove a symbol from the live ticker
See Displaying Symbols in the Ticker on page 72
Displaying Symbols and Other Data
77
TeleTrader Software GmbH
Marc-Aurel-Straße 10-12, 1010 Vienna, Austria
E-Mail [email protected]
Internet http://professional.teletrader.com
Customizing Documents, Pop-up
Windows and Panes
When you first open a document, or display a pop-up window or pane, it is shown with its default settings. You can
change how a document, pop-up or pane looks, add or remove information and organize its content. You can also link
many documents to a price page, watch list or time and sales document, so that you can display a symbol in multiple
documents at once and easily switch between symbols from a central overview table.
Most settings can be adapted in the properties dialog of the document, pop-up or pane. Other settings can be
accessed by right-clicking in the document and choosing a command from its context menu. Some manipulations,
such as moving a column in a price page, can be made with simple drag and drop operations.
Properties dialog
The properties dialog allows you to adapt the default settings to your needs. To display the dialog, right-click in the
document, window or pane that you want to customize and select Properties.
Properties dialogs are made up of several property sheets. Each property sheet contains several properties that are
related to each other. For example, the Font property sheet allows you to change the font style, font size and font
color for all text in a document. You can choose the property sheet in the left part of the dialog.
Note
Some property sheets are arranged hierarchically and displayed in several groups. In this case,
you will see a tree view on the left side of the dialog.
Customizing Documents, Pop-up Windows and Panes
78
TeleTrader Software GmbH
Marc-Aurel-Straße 10-12, 1010 Vienna, Austria
E-Mail [email protected]
Internet http://professional.teletrader.com
Context menu
The context menu shows the commands that are most suited for the current situation. To display the context menu,
right-click in the document, pop-up window or pane.
In some documents, the commands listed in the context menu depend on where in the document you click.
Where you right-click…
Commands you see…
Column headers of a price page
Insert, remove and freeze columns, sort rows
Row headers of a price page
Insert and remove symbols, headers and alerts, copy
symbols with an RTD or DDE link
Symbols / cells of a price page
Additionally: Open symbols in other documents
Upper left corner of a price page
Auto-size the price page
Sheet tabs of a price page, chart or time and sales
Insert, remove and rename sheets
Chart background, header or scales
Insert symbols, alerts, studies and bookmarks, extend
time line
Symbol / time series in a chart
Additionally: Open the symbol in other documents,
remove or hide the symbol, link the symbol to a price
page, report bad ticks
Content of a pane
Adapt the settings for the pane content
Borders of a pane
Hide / show the pane and change its docking behavior
Watch list columns
Enter and edit purchase data
Customizing Price Pages
For a price page, you can customize the following settings in the Price Page Properties dialog:
Note
Most of these settings are also available for Vertical Price Pages (only that rows and columns are
reversed), with the following exceptions: No sorting functionalities, no headers and sheets, no
VWAP / NewsFlash columns, no column freezing, no support for chain symbols.
Property Sheet
Description
Columns
Add, remove and rearrange the columns of a price page
Update
Assign an update style to specific columns
Grid
Change the appearance and color of the grid
Font
Change the font of the price page and its foreground and background color
Header
Change the foreground and background color of the headers
News Flash
Change the settings for the News Flash columns
Studies
Properties of each inserted study, such as its bases, parameters and style.
Loop Documents
Change the time interval between switching from one symbol to next symbol.
Additionally, you can resize rows and columns, insert, change and remove headers, add sheets, sort the rows of the
price page and freeze one or more columns of a price page. You can also link other documents to a price page, so
that you can display a symbol in multiple documents at once and easily switch between symbols from a central price
page. Chain symbols (automatically updated symbol lists) can be displayed in a price page as well.
For more information, see Price Page on page 48.
Customizing Documents, Pop-up Windows and Panes
79
TeleTrader Software GmbH
Marc-Aurel-Straße 10-12, 1010 Vienna, Austria
E-Mail [email protected]
Internet http://professional.teletrader.com
Adding and Removing Columns
You can add and remove columns on the Columns property sheet of the Price Page Properties dialog, or directly in
the price page by right-clicking on the column header.
To add columns to a price page
▪
Right-click in the price page and choose Properties.
Note
You can also right-click on a column header in the price page and choose Insert.
▪
In the Price Page Properties dialog, click Columns.
▪
From the Displayed Columns list, choose the column after which the new column should appear.
▪
Choose the column that you want to add from the Available Columns list.
Note
To search for a specific column, type its name into the Filter field below the list.
▪
Click the >> button.
▪
The chosen column is now moved to the Displayed Columns list.
To remove columns from a price page
▪
Right-click in the price page and select Properties.
▪
On the left side of the dialog, select Columns.
▪
On the right side of the dialog, select the column you want to remove from the Displayed Columns list.
Customizing Documents, Pop-up Windows and Panes
80
TeleTrader Software GmbH
Marc-Aurel-Straße 10-12, 1010 Vienna, Austria
E-Mail [email protected]
Internet http://professional.teletrader.com
▪
Click the << button.
▪
The chosen column is now moved to the Available Columns list.
Note
You can also right-click on the column header and choose Remove to delete the column from the
price page.
Groups in the Available Columns list
The Available Columns list is very long. Therefore, several groups have been created to make it easier to find a
specific column. To choose a column from inside a group, you first have to expand the group by double-clicking on it.
If you prefer to see an alphabetic list of all columns, select the List view checkbox below the Available Columns list.
To search for a column, type its name into the Filter field below the list. The Available Columns list then only shows
the columns matching that name.
You can see a short description of each column when you click on it.
Rearranging and Resizing Rows and Columns
You can rearrange columns on the Columns property sheet of the Price Page Properties dialog. Rows can only be
rearranged with drag and drop. To resize rows and columns, drag the separator between the rows or columns.
To rearrange the columns of a price page
▪
Right-click in the price page and select Properties.
▪
On the left side of the dialog, select Columns.
▪
On the right side of the dialog, select a column in the Displayed Columns list.
Note
▪
The columns in the Displayed Columns list are shown in the same order as they are shown in the
price page.
Click Move Up or Move Down to change the column’s place in the list.
Note
You can also rearrange the columns of a document by clicking on the column header and dragging
the column to its new position.
Customizing Documents, Pop-up Windows and Panes
81
TeleTrader Software GmbH
Marc-Aurel-Straße 10-12, 1010 Vienna, Austria
E-Mail [email protected]
Internet http://professional.teletrader.com
To rearrange the rows of a price page
▪
Click on the row header of the row.
▪
Hold the mouse button down and move the row. The mouse pointer changes:
▪
Drag the row to its new position and release the mouse button to drop it there.
To insert an empty row into a price page
▪
Right-click on the row where an empty row should be inserted and choose Insert.
▪
An empty row is inserted in the selected row, moving the following rows down.
▪
You can now for example add a symbol to the row: See Inserting Symbols on page 74.
Note
You can remove an empty row in the same way as you would remove a row that contains a
symbol. See Removing Symbols on page 76.
To resize the width of a column or the height of a row
▪
Place the mouse pointer between two columns or rows. The mouse pointer changes:
▪
Hold the mouse button down and move the mouse to widen / shorten the column or row.
Note
You can change the height of several rows at once. Select the rows by clicking on them while
keeping the CTRL key pressed, then follow the steps above.
Set Individual Color for Columns / Fields
You can change background color of each individual column of a Price Page (row of a Vertical Price Page).
Background color change does not apply to: price page headers, update color background when new quotes arrive,
VWAP button, News Flash button and News Headline if Use News Flash properties for Headline column is
enabled.
To change the color of individual Price Page column / field
▪
Right-click in the price page and choose Properties.
▪
On the right side of the Price Page Properties dialog, select column / field from Displayed Columns / fields list.
▪
Select Background color option and choose desired color.
Customizing Documents, Pop-up Windows and Panes
82
TeleTrader Software GmbH
Marc-Aurel-Straße 10-12, 1010 Vienna, Austria
E-Mail [email protected]
Internet http://professional.teletrader.com
Set Individual Number of Characters for Columns / Fields
For all text columns of a price page (or fields in a vertical price page), you can change the number of displayed
characters for each individual column (e.g. Name, Exchange, Ticker etc.).
To change the number of characters for a price page column / field
▪
Right-click in the price page and choose Properties.
▪
On the right side of the Price Page Properties dialog, select a column / field from the Displayed Columns /
Fields list.
▪
Select the option Show the first X character(s) and adapt the number of character(s) to your needs.
Changing the Number of Decimal Places
You can change the number of decimal places that is used for a specific column in price pages.
Note
To additionally show a thousands separator for large numbers (such as volume data), activate the
option Use thousands separator under Tools > Options > General (see General Settings on
page 339).
To change the number of decimal places for a price page column
▪
Right-click the column and choose Set decimal places.
▪
In the Set decimal places dialog, enter the number of decimal places that you want to use.
▪
Select Column to apply this setting only to the selected column, or select Symbol to apply it to the selected
symbol.
Note
When selecting Symbol, the custom decimal places will be used for this symbol in all documents
(charts, time and sales, market depth, options matrix, quick quote, price pages etc.). You can also
change this setting under Tools > Options > General > Subscription (see Subscription Settings
on page 339).
Changing the Update Style of a Column
You can change the update style of a column on the Update property sheet of the Price Page Properties dialog. The
update style is a visual effect that is displayed whenever new quotes arrive, depending on whether for example the
price moved up or down.
To change the update style for the columns of a price page
▪
Right-click in the price page and select Properties.
▪
On the left side of the dialog, select Update.
Customizing Documents, Pop-up Windows and Panes
83
TeleTrader Software GmbH
Marc-Aurel-Straße 10-12, 1010 Vienna, Austria
E-Mail [email protected]
Internet http://professional.teletrader.com
▪
On the right side of the dialog, select a column from the Columns list.
Note
▪
In the Update Notify section, select the update style that you want to use. The following styles are available:
Note
▪
Only the columns from this list can have an update style. You cannot add columns to this list.
Arrow
A colored arrow is placed next to the content of each cell.
Color text
The text of the cells will be colored on price movements.
Color background
The background of the cell will be colored on price movements.
You can combine the styles Arrow and Color text, but you cannot combine the style Color
background with any of the other styles.
In the Movement section, choose the color that will be used to signal price movements. You can choose different
colors when the price moves up, down, or stays the same.
Note
You can assign a flash effect to the update style Color background with the option Hide Price
Page Notify after x seconds. To change this setting, choose Tools > Options > Price Page from
the menu bar. See Price Page Settings on page 344.
Changing the Grid Style
You can change the appearance and color of the grid on the Grid property sheet of the Price Page Properties
dialog. The grid consists of horizontal and vertical lines that show the borders between rows and columns.
To change the grid style of a price page
▪
Right-click in the price page and select Properties.
▪
On the left side of the dialog, select Grid.
▪
On the right side of the dialog, adapt the default settings to your needs.
Customizing Documents, Pop-up Windows and Panes
84
TeleTrader Software GmbH
Marc-Aurel-Straße 10-12, 1010 Vienna, Austria
E-Mail [email protected]
Internet http://professional.teletrader.com
▪
You can see a preview for your settings in the Sample window at the bottom of the dialog.
Control
Description
Horizontal
Check to display horizontal grid lines between rows
Vertical
Check to display vertical grid lines between columns
Style
Line style of all visible grid lines
Color
Color of all visible grid lines
Changing Font and Colors of a Price Page
You can change the font of the price page texts, the color of the text and the background color of the price page on
the Font property sheet of the Price Page Properties dialog. You can assign different colors for alternate rows and
for old data (data that is not from today).
To change font and colors of a price page
▪
Right-click in the price page and select Properties.
▪
On the left side of the dialog, select Font.
▪
On the right side of the dialog, adapt the default settings to your needs.
▪
You can see a preview for your settings in the Sample window at the bottom of the dialog.
Control
Description
Font
Type of font used for price page texts
Font Style
Font style of price page texts (Regular, Italic, Bold, Italic + Bold)
Font Size
Size of the font used for price page texts
Foreground
Basic color of the price page text
Background
Background color of the price page
Use Alternate Color
Check to use a different color for every second row
Foreground
Color of the price page text of every second row
Background
Background color of every second row
Use different color…
Check to use a different color and font if the last trade or quote of this symbol is not
from today
Include Bid/Ask
Check to also consider the latest Bid and Ask dates when identifying old data
Uncheck to only use the date of the last trade to identify old data
Customizing Documents, Pop-up Windows and Panes
85
TeleTrader Software GmbH
Marc-Aurel-Straße 10-12, 1010 Vienna, Austria
E-Mail [email protected]
Internet http://professional.teletrader.com
Font Style
Font style of rows that contain old data
Color
Text color of rows that contain old data
Inserting, Changing and Removing Headers
A header defines a section in a price page that can be collapsed and expanded. All rows that are shown beneath a
header and before the next header belong to this header section. You can use headers to organize the content of
long price pages.
The header also shows the total number of advancing (+), declining (-) and unchanged (=) symbols within its group.
The window caption of the price page shows the total of advancing and declining symbols for all symbols on the
current sheet. You can deactivate this display under Tools > Options > Price Page – see Price Page Settings on
page 344 .
To insert a header into a price page
▪
Right-click on the row where the header should be inserted and choose Insert Header.
▪
The header is inserted in the selected row, moving the following rows down.
To rename a header
▪
Right-click on the header and choose Edit.
▪
Enter a new name for the header and press the ENTER key.
To change the colors of one header
▪
Right-click on the header and choose Properties.
▪
Choose a Foreground color for the text of this header.
▪
Choose a Background color for the background of this header.
To change the colors of all headers of a price page
▪
Right-click in the price page and choose Properties.
▪
On the left side of the dialog, select Header.
▪
On the right side of the dialog, choose the Foreground and Background color for all headers of this price page.
Customizing Documents, Pop-up Windows and Panes
86
TeleTrader Software GmbH
Marc-Aurel-Straße 10-12, 1010 Vienna, Austria
E-Mail [email protected]
Internet http://professional.teletrader.com
To collapse and expand a header section
▪
Click on the minus sign in the row header to collapse the header section.
▪
All rows that belong to this header section are hidden.
▪
Click on the plus sign in the row header to expand the header section again.
To remove a header from a price page
▪
Right-click on the header and choose Delete.
Adding and Organizing Sheets
A price page consists of at least one sheet. You can add additional sheets to a price page to make it easier to
organize the contents of a price page. Each sheet can be customized independently, that means it can have its own
columns, update styles, grid styles, font and colors.
Sheets are represented by tabs at the bottom of the price page. You can display a sheet by clicking on its tab.
To add a sheet to a price page
▪
Right-click on the sheet tabs and choose Insert.
▪
A text field is shown. Enter the name of the new sheet.
▪
Press the ENTER key. The new sheet is added behind the last sheet of the price page.
To rename a sheet
▪
Right-click on the tab of the sheet and choose Rename.
▪
A text field is shown. Enter the new name of the sheet and press the ENTER key.
Note
You cannot use the same name for different sheets in one price page.
To rearrange the sheets of a price page
▪
Click on the tab of the sheet.
Customizing Documents, Pop-up Windows and Panes
87
TeleTrader Software GmbH
Marc-Aurel-Straße 10-12, 1010 Vienna, Austria
E-Mail [email protected]
Internet http://professional.teletrader.com
▪
Hold the mouse button down and move the sheet.
▪
Drag the sheet to its new position and release the mouse button to drop it there.
To move a symbol from one sheet of a price page to another
▪
Select the symbol(s) that you want to move.
▪
Right-click on the tab of the source sheet, where the symbols are displayed at the moment.
▪
Choose Move To, and then click on the name of the target sheet, to which you want to move the symbols.
To remove a sheet from a price page
▪
Right-click on the tab of the sheet and choose Delete.
Sorting the Contents of a Price Page
You can sort the rows of a price page by each visible column. For some columns, you can also define automatic
sorting, which means that the row sort is updated regularly. You can set the update interval in seconds.
To sort the rows of a price page
▪
Right-click on the header of the column that you want to sort by and choose Sort.
▪
Choose Ascending to display the lowest values on top, or Descending to display the highest values on top.
Note
You can also double-click the column header to sort by this column. Each consecutive double-click
reverses the sort order.
To use automatic sorting for a price page
▪
Right-click on any column header and choose Sort > Automatic.
▪
In the Sort dialog, choose the column that you want to sort by from the Available Columns list.
▪
Click Add. The column is moved to the Selected Columns list.
▪
In the Automatic Sorting Options section, select the Every x seconds checkbox.
▪
Enter the update interval in seconds. The price page will be re-sorted according to the current quote data after
the amounts of seconds that you set here.
Note
You can use more than one column for automatic sorting. This will have the effect that the rows are
initially sorted by the first column on the list. For rows that have the same value in this column, the
second column will be used for sorting these rows, and so on.
Customizing Documents, Pop-up Windows and Panes
88
TeleTrader Software GmbH
Marc-Aurel-Straße 10-12, 1010 Vienna, Austria
E-Mail [email protected]
Internet http://professional.teletrader.com
To reverse the sort order for a column used in automatic sorting
▪
In the Sort dialog, click on the arrow to the left of the column name in the Selected Columns list.
▪
The arrow to the left of the column name shows the currently used sort order.
Freezing a Column
The price page can be "frozen" at a given column. This means that when you scroll the price page to the right, the
frozen columns always remain visible.
To freeze columns on a price page
▪
Right-click on the header of the rightmost of the columns that you want to keep visible and choose Freeze
Column.
▪
This column and all columns left of it will always be visible even if you scroll the price page to the right.
To unfreeze the columns of a price page
▪
Right-click on any column header and choose Unfreeze Column.
Selecting Rows or Columns of a Price Page
You can select more than one row or column of a price page, and then manipulate them all at once – you can for
example move them, open them in new documents or delete them in one step.
To select several rows (columns) from a price page
▪
Click on the header of the first row (column).
▪
Press and hold the CTRL key.
▪
Click on the headers of the other rows (columns) that you want to select.
To select several consecutive rows (columns) from a price page
▪
Click on the header of the first row (column).
▪
Press and hold the SHIFT key.
▪
Click on the header of the last row (column) that you want to select.
Linking Documents to a Price Page
Maybe you want to closely monitor several symbols at once. Instead of opening a separate chart, time and sales,
options matrix, news, quick quote or market depth document for each of the symbols, you can create a price page
that contains all of the symbols, create the other documents, and link them to the price page. This means that
whenever you select a new symbol on the price page, the linked documents will also display this symbol (for news
documents, only news stories that include the symbol’s ISIN or ticker are displayed).
Customizing Documents, Pop-up Windows and Panes
89
TeleTrader Software GmbH
Marc-Aurel-Straße 10-12, 1010 Vienna, Austria
E-Mail [email protected]
Internet http://professional.teletrader.com
Note
You can also link documents to the price page view of a time and sales document or to a watch list
in the same way as shown here. See also Linking Documents to Time and Sales on page 124.
The following example will show you how to link a chart to a price page. For other documents (time and sales, news,
market depth, options matrix and quick quote), this works in the same way. You can even link several documents to
one price page.
Note
For time and sales documents containing multiple symbols, only the first symbol in the price page
view of the time and sales document can be linked to another document.
For options matrix documents, the underlying symbol is linked to the price page.
To link a chart to a price page
▪
Create a price page with all the symbols that you want to monitor. See Opening Symbols in New Documents on
page 64.
▪
Open a chart for one of these symbols. See Opening Symbols from Existing Documents on page 66.
▪
In the chart, right-click on the time series (bars, candles or other data points) and choose Link, and then choose
the name of your price page.
▪
In the price page, double-click on any row header to switch to row highlight mode.
▪
To switch symbols, simply click on another symbol in the price page.
Note
In linked charts, you can also use the up and down arrow keys of your keyboard to switch between
the symbols of a price page. This behavior can be deactivated with the option Use arrow keys (Up
and Down) for navigating through linked charts under Tools > Options > Chart.
Behavior of chart objects in linked charts
When you link a chart to a price page, its symbol (time series) is changed whenever you select a new symbol in the
linked chart. The data compression and visible panes always stay the same for every symbol; the chart type is
remembered per symbol, if changed. Chart objects behave in the following way:
▫
Studies, like indicators or signals, are shown for every symbol of the linked chart.
▫
Drawing objects, like trend lines or Pivot Points, are only shown for the symbol where they were drawn. This
means every symbol can have its own drawing objects.
▫
Chart overlays are shown for every symbol of the linked chart.
Row highlight mode
Row highlight mode is indicated by a red arrow in the row header of the active row. To switch between normal mode
and highlight mode in a price page, you have to double-click on any row header.
In highlight mode, you can switch between symbols in linked documents by clicking on a symbol in the price page or
using the arrow keys of your keyboard.
Note
When you link documents to a watch list, you cannot use the row highlight mode. To switch
between symbols, you have to click on the row header of the symbol.
Customizing Documents, Pop-up Windows and Panes
90
TeleTrader Software GmbH
Marc-Aurel-Straße 10-12, 1010 Vienna, Austria
E-Mail [email protected]
Internet http://professional.teletrader.com
Loop documents linked to Price Page automatically
If you want to observe the markets without having to switch between different symbols in a Price Page manually, you
can use Loop Documents. It allows you to display symbols on documents linked to Price Page one by one
automatically in a certain interval. Once loop has been activated, loop starts with the first symbol in the Price Page
and all documents which are linked to this Price Page will show the symbols one by one in the default time interval of
5 seconds.
Available time intervals to choose from are: 5 Seconds, 15 Seconds, 30 Seconds, 1 Minute, 2 Minutes, 5 Minutes, 10
Minutes and Custom (1-1000 seconds).
To activate / deactivate loop from a price page
Link a desired document (e.g. chart) to a Price Page with several symbols. See Linking Documents to a Price Page
on page 89
Click the Play / Pause icon in the upper corner of the price page document:
The Play icon indicates that loop of Price Page documents is activated.
Click to pause the loop documents mode.
The Pause icon indicates that loop of Price Page documents is temporarily stopped.
Click to continue with loop documents mode.
Adding, Removing and Customizing Study Columns
TeleTrader Professional offers a large amount of analysis tools (studies) to calculate indicators and signals. All
available TeleTrader studies that can be shown on a chart, including custom studies that you wrote yourself, can also
be shown in a price page.
Depending on the study, one or more columns are added to the price page. For each row / symbol that is visible on
the price page, the current study value is calculated. Per default, the studies are calculated for daily data, but you can
also configure them to be calculated for other data compressions (Weekly, Monthly, Intraday, TickBar or Tick by Tick
data).
For each inserted study, you can hide certain study columns, suspend calculation for some rows to improve
performance, rename study , change the parameters for a study (including the time region / history that is
downloaded for each symbol), and define custom colors for study columns.
Customizing Documents, Pop-up Windows and Panes
91
TeleTrader Software GmbH
Marc-Aurel-Straße 10-12, 1010 Vienna, Austria
E-Mail [email protected]
Internet http://professional.teletrader.com
Note
You can include all studies already visible in a price page, when opening a new chart with the
option Insert existing studies when opening chart from price page. To change this setting,
choose Tools > Options > Price Page from the menu bar.
For more information about studies in general, see Analysis Tools on page 299.
To add a study to a price page
▪
Right-click in the price page and select Insert Study.
▪
All available studies are shown on the left side of the Insert Study dialog. Click on the study that you want to
insert. See also Inserting Studies on page 300 for more details about the Insert Study dialog.
▪
On the Parameters tab on the right side, adapt the bases and parameters of your study to your needs, and
choose the compression that should be used for you study (for example, Daily, 10 Minutes,..). For details about
the possible settings, see below on page 93.
▪
On the Appearance tab, adapt the colors that should be used for the study columns (if necessary). For details
about the possible settings, see below on page 94.
▪
Click Insert to insert the study into the price page. Depending on the study, one or several study columns will be
added to your price page:
Lines
For lines, such as the Moving Average
Simple, one column will be added to
the price page. It displays the most
recent value for each symbol
(depending on the chosen
compression).
Areas
For areas, such as Bollinger Bands,
two columns will be added to the price
page. They display the current Upper
and Lower value of the study area for
each symbol.
Markers
For markers, such as the Hammer
candlestick pattern, three columns will
be added to the price page. They
display the Text, Direction and Price
for the marker. A marker will only be
shown for those rows / symbols where
the marker condition has been met on
the current bar (depending on the
chosen compression).
To hide some study columns on a price page
Some studies that consist of several areas, markers or lines add many columns to the price page when inserted. You
can hide some of these columns and only keep those visible that you need.
▪
Right-click in the price page and choose Properties.
▪
In the Price Page Properties dialog, click Columns.
▪
Select the column that you want to remove from the Displayed Columns list.
▪
Click the << button.
To add hidden study columns to a price page again
▪
Right-click in the price page and choose Properties.
▪
In the Price Page Properties dialog, click Columns.
Customizing Documents, Pop-up Windows and Panes
92
TeleTrader Software GmbH
Marc-Aurel-Straße 10-12, 1010 Vienna, Austria
E-Mail [email protected]
Internet http://professional.teletrader.com
▪
From the Displayed Columns list, choose the column after which the new column should appear.
▪
Choose the column that you want to add from the Available Columns list.
▪
Click the >> button.
To remove a complete study from a price page
▪
Remove all visible study columns from the price page (see above on page 92). When all columns of a study are
hidden / removed, the complete study will be removed from the price page.
Note
You can also remove all visible study columns by right-clicking on a study cell and choosing Delete
from the context menu. In the dialog that appears, select the Study radio button (e.g. Study:
MACD) and click the OK button.
To suspend study calculations for specific symbols (rows)
Since calculating study values for many symbols at once can lead to performance problems, you can suspend study
calculations for specific symbols (rows).
▪
Right-click the symbol / row and choose Suspend Study Calculations.
Note
Once study calculations are suspended, last updated values will stay visible until calculations are
continued. To continue study calculations at a later point, right-click the symbol / row again and
choose Continue Study Calculations.
To rename study column on a price page
▪
Right-click study column header in the price page and choose Rename Study....
▪
In the Set Study Name dialog, modify current column name or enter a new one.
▪
Click the Ok button.
To set the parameters for a study in price pages
On the Parameters tab of the Insert Study dialog, you can set the bases and input parameters for a study before
you insert it. After you have inserted a study, you can still change these parameters in the Price Page Properties
dialog under Studies > [Study Name] > Parameters.
Setting study parameters in price pages generally works the same way as setting study parameters in charts (see
Setting the Parameters of a Study on page 302 for details), with the following differences:
▫
In the Data Object column under Bases, you will per default find an entry Row Symbol. Use this entry to
calculate the study for each symbol of the price page. If you choose a fixed base symbol instead (using the entry
Other and Symbol Search), the same symbol will be used as the calculation base for every row. This can be
useful for studies that need two bases (for example Spread Relative).
▫
In the Compression column under Bases, you can change the data compression of the time series that is used
to calculate the study values. The compression is set to Daily per default, but you can also use Monthly,
Weekly, Intraday, TickBar and Tick by Tick compressions instead.
▫
On the bottom right of the Parameters tab, you can change the time region that is used for calculating the study.
This setting influences the amount of historical time series data that is downloaded for each symbol of the price
page. Per default, an appropriate setting is chosen automatically for each study (often depending on the currently
set study parameters such as the period of a Moving Average). If you do not get the appropriate results for your
study, you can change this setting by selecting Use custom time region and entering the appropriate amount of
bars.
Customizing Documents, Pop-up Windows and Panes
93
TeleTrader Software GmbH
Marc-Aurel-Straße 10-12, 1010 Vienna, Austria
E-Mail [email protected]
Internet http://professional.teletrader.com
Note
▫
If you add too little history, the study might not be calculated (leading to an empty value in the
study column),
If you add too much history, this can affect performance, since the history must be downloaded for
every symbol in the price page.
It is at the moment not possible to base studies on other studies in price pages (although that is of course
possible in charts, see Basing Studies on Other Studies on page 311).
To define the appearance (colors) for a study in price pages
On the Appearance tab of the Insert Study dialog, you can choose custom colors that should be used for the study
columns on a price page before you insert the study. After you have inserted a study, you can still change these
colors in the Price Page Properties dialog under Studies > [Study Name] > Appearance.
Per default, if not defined otherwise under Appearance, the column is shown in the same color as all other price
page columns.
In contrast to defining the appearance of studies in charts (see Defining the Appearance of a Study on page 305), you
can only choose from the following settings for price page study objects:
Lines
Check the box next to the Color selection to use a custom color for the study column.
Areas
Fixed coloring
Relative coloring
Markers
Check the boxes next to the Line #1 and Line #2 selections to use a custom
color for the Upper and Lower study columns.
Each column will have its own color.
Check the boxes next to the #1 above #2 and #2 above #1 selections to use
different colors depending on which of the two area lines is higher (useful for
studies such as Moving Average Cross).
Both columns will have the same color (depending on which of the two values
is higher at the moment).
Check the box next to the Up Border and Down Border color selections to use a custom color for
the Text, Direction and Price study columns.
Inserting Price Page Expressions
A price page expression is a mathematical calculation that can be shown as an additional column in any price page
document. It uses one or more numerical values from the existing price page for its calculations.
You can only use symbols and data fields that are currently visible in the price page. Before you insert an expression,
make sure that all the values / columns that you want to use in your calculations are present on the price page. When
you insert a price page expression, you can choose symbols, operators and fields from on-the-fly assistant lists or
add operators and numbers to your expression manually.
As there are many possible uses for price page expressions, we will introduce them with a simple example. For more
details about the syntax of price page expressions, Syntax of Price Page Expressions on page 96
To insert a price page expression – an example
This price page expression shows the difference between the current High and Low price of a symbol.
Customizing Documents, Pop-up Windows and Panes
94
TeleTrader Software GmbH
Marc-Aurel-Straße 10-12, 1010 Vienna, Austria
E-Mail [email protected]
Internet http://professional.teletrader.com
▪
Make sure that the columns High and Low are visible on the price page. See also Adding and Removing
Columns on page 80.
▪
Right-click in the price page and select Insert Expression.
▪
In the new column Expr1, double-click the cell where you want to insert the expression.
▪
Type an equal sign =.
▪
In the list that appears, double-click SYMBOL (this refers to the current symbol of the row that you click in).
▪
In the field/column list, double-click the HIGH field. You can scroll the list to reveal more fields.
▪
Double-click the – operator.
▪
From the following lists, choose SYMBOL again and then the LOW field.Press the ENTER key. The expression is
now added in the chosen cell.
Note
Instead of using double-click, you can also use the ↑ and ↓ keys to highlight and then the Tab key
to select a symbol or a TeleTrader function.
To edit a price page expression
▪
Double-click the cell that contains the price page expression, or
▪
Highlight the cell and press F2 on your keyboard or
▪
Highlight the cell and type in the equal sign = (this would immediately delete the existing content).
To copy a price page expression to another cell
▪
Double-click the cell that contains the price page expression (or highlight the cell and press F2).
▪
The expression formula is automatically highlighted. You can now copy or cut the formula and paste it to another
cell in the expression column.
To fill the complete expression column with one expression
▪
Right-click the cell that contains the price page expression that you want to apply to the complete column.
▪
Choose Fill Column with Selection. The formula of the selected cell will be copied into all cells of the selected
expression column. Other (existing) content will be overwritten.
Note
When you insert a new symbol into the Price Page, the new expression cell will be automatically
filled with the expression (if available) from the previous row.
To change the name of an expression column
▪
Right-click the column header of the expression column (for example, Expr1) and choose Rename
Expression....
▪
In the dialog, type a new name for the expression column.
To delete an expression column
Warning
This action cannot be undone. When you remove an expression column, all formulas it contained
are also removed from the price page. Price page expressions are not stored anywhere (unlike
studies), so after an expression has been removed, you would have to type it again
▪
Right-click in the price page and choose Properties.
▪
In the Price Page Properties dialog, click Columns.
Customizing Documents, Pop-up Windows and Panes
95
TeleTrader Software GmbH
Marc-Aurel-Straße 10-12, 1010 Vienna, Austria
E-Mail [email protected]
Internet http://professional.teletrader.com
▪
Select the column which you want to remove from the Displayed Columns list.
▪
Click the << button.
Note
When you remove a column (field) or row (absolute symbol) that is used in one or more price page
expressions, a warning message will be shown informing you that all affected expression(s) will
become invalid if you continue. The expression column(s) will remain on the price page, but the
formulas will be invalid (they show n/a).
To save a price page expression
Price page expressions including their names can only be saved within the price page document, exported virtual
page and workspace. See also Organizing and Saving Documents on page 150.
Syntax of Price Page Expressions
A price page expression can consist of symbols, fields, operators, functions and numbers. The basic steps to insert
an expression are always the same. For more information about the possibilities of price page expressions, see the
detailed syntax description below.
To insert a price page expression – basic steps
▪
Right-click in the price page and select Insert Expression.
▪
In the new column Expr1, double-click the cell where you want to insert the expression.
▪
Type an equal sign = to start the price page expression.
▪
Do one of the following:
-
In the list that appears, double-click (or use the ↑ and ↓ keys to highlight and then the TAB key to select) a
symbol or a TeleTrader function.
-
Press the ESCAPE or BACKSPACE key to make the list disappear and type parts of the expression manually.
While typing, appropriate functions are recommended automatically. For example, typing an S will show a
list with all functions starting with S.
▪
Continue creating your expression using the syntax described below. Appropriate lists appear after using
symbols, operators or functions.
▪
After you have finished writing the expression, Press the ENTER key. The expression is now added in the chosen
cell.
Syntax of price page expressions
Relative Symbol
(Row Symbol)
Relative symbols refer to the current symbol (the symbol that shows up in the same row
as the expression cell). These symbols are not fixed – they change automatically in
every row and thus make it easier to copy a formula to another row or a complete
column.
Use the keyword SYMBOL to refer to the current row symbol.
Absolute Symbol
Absolute symbols refer to a specific symbol that will be the same for every row. They
can be used if you want to for example use the same benchmark symbol (index) in
every row.
Absolute symbols are enclosed in square brackets. To use an absolute symbol in an
expression, either choose OTHER SYMBOL from the list or type an opening square
bracket [ and choose the symbol from the list that appears by double-clicking it. The
symbol list shows the symbols that are already visible on the price page. The closing
square bracket is inserted automatically as soon as you choose the symbol.
For example:
=[ADIDAS AG O.N. (XETRA)]
Fields
For every symbol (absolute or relative), you can specify which field should be used for
Customizing Documents, Pop-up Windows and Panes
96
TeleTrader Software GmbH
Marc-Aurel-Straße 10-12, 1010 Vienna, Austria
E-Mail [email protected]
Internet http://professional.teletrader.com
the calculation. A list with all available fields (that is, all columns that are currently
visible in the price page including existing expressions and studies in price page)
appears after you enter a symbol – choose the appropriate field by double-clicking it.
The field is added to the symbol using the . (dot) operator (see below). Field names
have to be enclosed in single quotes.
For example:
=SYMBOL.'VOL'
=[ADIDAS AG O.N. (XETRA)].'LAST'
Operators
Operators connect symbols/fields with each other or with a constant number. In
addition to the standard mathematical operators, the dot operator is used to specify the
field for a symbol. You can enter operators from the keyboard manually, or choose
them from the operator list when it appears.
.
Dot operator: Use it directly after a symbol to specify a field value to
use for this symbol.
+
Addition
Subtraction
/
Division
*
Multiplication
^
Power
()
Round brackets for changing operator precedence of mathematical
operators
Standard operator precedence is the same as for all mathematical calculations:
Brackets – Power – Multiplication and Division – Addition and Subtraction.
TeleTrader Functions
You can use some functions of the TeleTrader Language inside price page
expressions. The list of available functions is automatically shown at the start of an
expression and after entering a mathematical operator. You can also type the function
manually - while typing, appropriate functions are recommended automatically. For
example, typing an S will show a list with all functions starting with S.
After choosing a function, an opening bracket is inserted and the list of symbols is
shown. You have to close the function brackets manually.
For example:
=MIN(SYMBOL.'OPEN',SYMBOL.'CLOSE')
For more information about the available functions, see the Function Reference on
page 501.
Numbers
In addition to symbols, you can also use constant numbers in an expression. To use a
number, you have to type it on your keyboard manually.
For example, you could multiply the volume of a symbol by two using the following
syntax:
=SYMBOL.'VOL'*2
More examples
=SYMBOL.'Last'*3
Multiply the Last price of the symbol that is shown in the same row by three.
=SYMBOL.'LAST'*[EUR/USD
SPOT (FOREX GTIS BASIC
FX)].'LAST'
Multiply the Last price of the symbol that is shown in the same row with the
current EURUSD rate (the EURUSD symbol must be shown in the same price
page, otherwise this expression won't work).
=(SYMBOL.'HIGH'+SYMBOL.'
LOW'+SYMBOL.'LAST')/3
Add the High, Low and Last price for the symbol that is shown in the current
row and divide it by three. (This calculation is also called the typical price,
used for example in the Commodity Channel Index.)
The columns High and Low must be added to the price page first, otherwise
this expression won't work.
For this rather complex expression, you have to manually enter round
brackets to force the correct operator precedence.
Customizing Documents, Pop-up Windows and Panes
97
TeleTrader Software GmbH
Marc-Aurel-Straße 10-12, 1010 Vienna, Austria
E-Mail [email protected]
Internet http://professional.teletrader.com
Adding, Removing and Customizing the VWAP Columns
The Volume Weighted Average Price (VWAP) of a stock over a specified market period is defined as the average
price paid per share during that period (price of each transaction in the market weighted by its volume). It is calculated
from the volumes and prices of all trades during a certain period of time.
Price page documents in TeleTrader Professional can be extended to show several VWAP columns: The Volume
Weighted Average Price (VPrice) itself, its standard deviation (VStdDev), total volume (VVolume), average volume
(VAvgVol) and the total number of transactions (VTrans) in the defined period. The VWAP values are shown with 4
decimals.
By default, the VWAP is calculated over daily data. All parameters (custom time period, price and volume filters) can
be adjusted to fit your needs. You can also manually edit the appropriate VWAP range columns directly on the price
page, temporarily freeze the calculation of VWAP data and add remarks to each row. Other default settings for the
VWAP tool, like the default type or V-Button colors, can be set under Tools > Options > Price Page > VWAP: See
VWAP Settings on page 345.
Note
Only for volume data from the XETRA(CEF) feeds, the columns Volume and VVolume might
show different values, because CEF data feeds include some special order types in the total
volume but do not show individual quote events.
To add the VWAP columns to a price page
▪
Right-click in the price page and select Insert VWAP Columns.
To remove the VWAP columns from a price page
▪
Right-click in the price page and select Remove VWAP Columns.
To remove the VWAP data for one symbol (row)
▪
Right-click on the V-Button
of the symbol and choose None.
To choose a time period for VWAP calculation
▪
Right-click on the V-Button
of the symbol and choose a time period:
Daily
Calculates the Volume Weighted Average Price with data from the current trading
session. You can choose a different day in the Date/Time section of the VWAP
Properties dialog (see below).
Last Hour
Calculates the VWAP with data from the last hour.
Custom
Calculates the VWAP for a custom time period. Choose the appropriate settings in the
Date/Time section of the VWAP Properties dialog (see below).
Note
If you want to see VWAP calculations with different time periods for the same symbol in one price
page, you can easily create a copy of any symbol and apply a different time period to it. See
Copying Symbols on page 75 for details.
Customizing Documents, Pop-up Windows and Panes
98
TeleTrader Software GmbH
Marc-Aurel-Straße 10-12, 1010 Vienna, Austria
E-Mail [email protected]
Internet http://professional.teletrader.com
To customize the VWAP calculation parameters for a symbol
▪
Click on the V-Button
▪
In the VWAP Properties dialog, adapt the default settings to your needs:
of the symbol.
Type
Choose the time period used for calculating the VWAP: Daily, Last Hour, Custom or
None.
Date / Time
Choose the begin and end date and time of a custom time period used for calculating
the VWAP. The maximum time period is 7 calendar days (calculation cross trading
sessions is possible).
Check the Begin box to set the start time of the period to the beginning of the chosen
day.
Check the End box to set the end date and time to the end of the maximum time period
(7 calendar days).
Filter
Enter the lower and upper boundaries for the volume or price range of the trades that
should be included in the calculation of the VWAP.
Fractional Volume in
%
Enter a percentage of the total volume. The calculated fraction of the total volume is
displayed in the column VFVol.
Note
All the settings above can also be manipulated from within the price page by using the editable
columns VDateF (start date), VDateT (end date), VTimeF (start time), VTimeT (end time),
VPriceF (lower price limit), VPriceT (upper price limit), VVolF (lower volume limit), VVolT (upper
volume limit) and VFVar (total volume fraction).
To temporarily freeze VWAP calculation for a symbol
▪
Right-click on the V-Button
and choose Freeze.
Customizing Documents, Pop-up Windows and Panes
99
TeleTrader Software GmbH
Marc-Aurel-Straße 10-12, 1010 Vienna, Austria
E-Mail [email protected]
Internet http://professional.teletrader.com
To add remarks to VWAP data
▪
Add the editable column Text to your price page (see Adding and Removing Columns on page 80).
▪
Double-click the empty cell and enter your remarks.
Note
▪
You can also press F2 to edit the contents of the cell.
Press the ENTER key.
Adding, Removing and Customizing the News Flash Columns
You can show the latest related news stories for a symbol in a price page. The News Flash button displays the
number of recent news stories; the News Headline column displays the latest headline. This headline is also shown
in a tooltip when moving the mouse pointer over the News Flash button. The entire news story can be read by clicking
the News Flash button.
You can customize the time period that is used for News Flash retrieval – by default, only today's news stories are
taken into account.
The News Flash button is colored depending on the age of the latest news update. To help you stay on top of current
developments, the entire row of a symbol can be colored for a few seconds whenever a news story arrives. You can
configure how long a news flash is active on a price page and specify the colors used under Tools > Options > Price
Page > News Flash (see News Flash Settings on page 344).
To add the News Flash columns to a price page
▪
Right-click in the price page and choose Insert News Flash.
To open related news stories for a symbol
▪
Click the News Flash button
of the symbol.
To change the time period for News Flash retrieval
▪
Right-click the News Flash button
▪
In the Price Page Properties dialog, click News Flash.
▪
Under Range, adapt the Display Last... option to your needs.
Note
of the symbol and choose Properties.
You can also filter the news stories that are included in the price page by service or category. See
Filtering News Stories on page 107 for details about the possible settings.
Customizing Documents, Pop-up Windows and Panes
100
TeleTrader Software GmbH
Marc-Aurel-Straße 10-12, 1010 Vienna, Austria
E-Mail [email protected]
Internet http://professional.teletrader.com
To insert a news alert for a symbol
▪
Right-click the News Flash button
▪
In the Alerts window, adapt the news alert settings to your needs. See News Alerts on page 325 for details about
the possible settings.
of the symbol and choose Insert News Alert.
To remove the News Flash columns from a price page
▪
Right-click in the price page and choose Remove News Flash.
Changing the Time interval of a Loop
You can change the time interval of the loop in the price page on the Loop Documents property sheet of the Price
Page Properties dialog.
To change time interval of a loop
▪
Right-click in the price page and select Properties
▪
On the left side of the dialog, select Loop Documents
▪
On the right side of the dialog, adapt the default setting to your needs.
Control
Description
Choose time
interval
Available periods: 5 Seconds, 15 Seconds, 30 Seconds, 1 Minute, 2 Minutes, 5 Minutes, 10
Minutes and Custom (1-1000 second(s))
Displaying Chain Symbols in a Price Page
Apart from "normal" symbols, price pages can also display so-called chain symbols. This is a special symbol type that
is in essence a pointer to a list of normal symbols of different types, usually a list of index constituents. The list of
symbols contained in a chain is automatically updated on the server. This means that when for example some new
stocks are added to the list of index constituents, the list of symbols will be automatically updated in the price page.
Customizing Documents, Pop-up Windows and Panes
101
TeleTrader Software GmbH
Marc-Aurel-Straße 10-12, 1010 Vienna, Austria
E-Mail [email protected]
Internet http://professional.teletrader.com
Chain symbols can also hold a so-called main symbol. This symbol is usually an index symbol (if the chain holds a list
of index constituents). The main symbol is shown on top of the price page, separated from the symbol list by a price
page header. The name of the chain symbol is shown in the title of the price page – chain symbol names typically
contain a pound sign (for example, DAX#XETRA or INDU#US).
Note
Some chains do not contain a main symbol. In that case, only the symbol list is shown in the price
page.
To open a chain symbol in a price page
▫
Use Symbol Search to find and open a specific chain symbol: See Opening Symbols from the Search Results on
page 38.
▫
Type the ticker or name of a chain symbol (for example DAX#XETRA) into a price page (Smart Symbol Search)
to replace all symbols that are currently visible in the price page with the chain: See Calling Symbol Search from
a Document on page 41.
▫
Open a chain symbol that was stored in FastLook: See Opening Symbols from FastLook on page 167.
▫
If a "normal" symbol is also part of a chain (for example, a stock that is part of an index), you can open the
appropriate chain by right-clicking the symbol and choosing Related Symbols > <Name of related chain>. See
Opening Related Symbols in a Price Page on page 71.
To turn off automatic list updates for chain symbols
As already mentioned, the list of symbols which are part of a chain is automatically updated on the server. New
symbols are added to the chain, other symbols are removed from the chain in regular intervals. If you display a chain
symbol in a price page, the symbol list will be automatically updated after a server-side change. This means that for
example you'll always get the current list of index constituents for the DAX#XETRA or INDU#US index chain in your
price page. Those automatic updates of the list can also be switched off:
▪
Right-click in the chain price page and choose Automatic List.
▪
The check mark next to this entry disappears, and the name of the chain (for example, DAX#XETRA or
INDU#US) is removed from the price page title. The symbol list on the price page is not updated automatically
Customizing Documents, Pop-up Windows and Panes
102
TeleTrader Software GmbH
Marc-Aurel-Straße 10-12, 1010 Vienna, Austria
E-Mail [email protected]
Internet http://professional.teletrader.com
anymore, which means that you can add / remove symbols manually. The price page now behaves exactly like a
price page without a chain symbol. Of course, quote updates for the symbols of the price page will still work.
Note
In some situations (for example, when you try to add symbols or change the sort order of a chain
price page), Professional automatically suggests to turn off automatic list updates.
The following message is shown in that case: This operation will break the connection with the
chain symbol for this document. Lists will no longer be updated. Do you want to continue?
Click Yes to turn off automatic list updates and complete the operation (for example, the new
symbol will be added, the sort order will be changed), or click No to keep automatic lists updates
turned on and cancel the operation (for example, the new symbol will not be added, the sort order
will stay the same).
To turn on automatic list updates for chain symbols
Warning
This action cannot be undone. When you turn on automatic list updates, the symbol list on the
price page is now updated automatically from the server. This also means that symbols that you
have manually added are removed from the price page, new symbols might be inserted
automatically, and a changed sort order is reverted to the default. Also, a different price page
template might be applied automatically.
This command is only available for price pages that previously contained a chain symbol at some
point, but where you have turned off the automatic list updates manually.
▪
Right-click in the price page and choose Automatic List again.
▪
The check mark next to this entry is shown again, and the name of the chain (for example, DAX#XETRA or
INDU#US) is added to the price page title. The symbol list on the price page is now updated automatically from
the server, and the appropriate price page template for this chain is applied if necessary.
To show and hide the main symbol of a chain
▪
Right-click in the chain price page and choose Show Main Symbol or Hide Main Symbol.
Chain symbols and price page templates
Whenever a chain symbol is added to a price page, an appropriate price page template is applied automatically. The
template is chosen based on the chain type.
You can of course also manually apply a template when opening the price page: See Applying Templates to
Documents on page 146.
A new template might also be applied automatically when you change the chain symbol in an already open price page
document, or turn on automatic list updates for a price page that previously contained a chain symbol.
Customizing Charts
For a chart document, you can customize the following settings in the Chart Properties dialog:
Property Sheet
Description
General
General chart properties, such as the amount of data displayed, data
compression, time scale properties and bookmark colors. See Customizing the
General Chart Properties on page 104
Pane x
Change the appearance of a chart pane, such as its background color, grid and
price scale properties. See Changing the Background Color of a Pane on page
225 and Customizing the Chart Pane Properties on page 104
Customizing Documents, Pop-up Windows and Panes
103
TeleTrader Software GmbH
Marc-Aurel-Straße 10-12, 1010 Vienna, Austria
E-Mail [email protected]
Internet http://professional.teletrader.com
> [Symbol Properties]
Properties of each displayed symbol (time series), such as the chart type, line
style, color coding of bars and trading sessions. See Customizing Symbol / Time
Series Properties on page 105
> [Drawing Object
Properties]
Properties of each drawing object, such as the line style, auto-hide options and
optional parameters. See Customizing Drawing Objects on page 270
Studies
Properties of each study, such as its bases, parameters and style. See
Changing the Properties of Inserted Studies on page 309.
You can find more details about customizing charts in the section on charting: See Customizing the Chart on page
216.
For more information, see Chart on page 52.
Customizing the General Chart Properties
The group General contains the settings that apply to the whole chart, such as the appearance of the time scale or
the data compression of the chart.
Property Sheet
Description
Time Region
Change the amount of data displayed in the chart. See Changing the Amount of
Data Displayed in the Chart on page 217
Type
Change the data compression of the chart. See Changing the Data Compression
on page 175
H.Scale
Change the font of the time scale. See Changing the Font and Colors of the
Time Scale on page 232
> Fill Type
Change the background color of the time scale. See Changing the Font and
Colors of the Time Scale on page 232
Misc.
Change the color of bookmarks, the header transparency and remove trailing
zeros on the price scale. See Setting, Moving and Editing Bookmarks on page
208, Changing the Font, Colors and Data of Headers on page 227 and
Changing the Price Display of the Price Scale on page 230
Customizing the Chart Pane Properties
The property sheets that apply to certain panes (for example Pane 1, Pane 2 etc.) contain only settings that apply to
a specific chart pane, or to an object inside a chart pane. Depending on what objects and panes you use in your
chart, different property sheets will be available here.
Property Sheet
Description
Grid
Change the appearance of the grid lines. See Changing the Style and Colors of
the Grid on page 226
V.Scale
Change the font of the price scale. See Changing the Font and Colors of Price
Scales on page 231
> Type
Change the type of the price scale. See Changing the Price Display of the Price
Scale on page 230
> Label
Change the last price label. See Changing the Labels on Price Scales on page
231
> Fill Type
Change the background color of the price scale. See Changing the Font and
Colors of Price Scales on page 231
> Scale
Change the vertical scaling of the time series. See Changing the Scaling of the
Price Scale on page 229
Second V.Scale
Change the font of the second price scale. See Changing the Font and Colors of
Price Scales on page 231
Customizing Documents, Pop-up Windows and Panes
104
TeleTrader Software GmbH
Marc-Aurel-Straße 10-12, 1010 Vienna, Austria
E-Mail [email protected]
Internet http://professional.teletrader.com
> Label
Change the last price label of the second price scale. See Changing the Labels
on Price Scales on page 231
> Fill Type
Change the background color of the second price scale. See Changing the Font
and Colors of Price Scales on page 231
Header
Change the font of the header. See Changing the Font, Colors and Data of
Headers on page 227
> Fill Type
Change the background color of the header. See Changing the Font, Colors and
Data of Headers on page 227
> Data
Change the data displayed in the header. See Changing the Font, Colors and
Data of Headers on page 227
[Symbol Ticker]
Properties of each displayed symbol (time series), such as the chart type, line
style, color coding of bars and trading sessions. See Customizing Symbol / Time
Series Properties on page 105
[Drawing Object Name]
Properties of each drawing object, such as the line style, auto-hide options and
optional parameters. See Customizing Drawing Objects on page 270
Hidden Objects
Change the settings for chart objects (symbols, drawing objects, studies etc.)
that are currently hidden on the chart. See also Customizing Chart Objects on
page 233
Customizing Symbol / Time Series Properties
Each displayed symbol (time series) can be customized per pane. You can decide how the data is plotted on the
screen (for example, as a line chart, bar chart, point and figure chart or else), what style and colors are used in the
chart and what trading sessions are used in intraday charts.
Property Sheet
Description
Display
Change the chart type of the time series. See Changing the Chart Type on page
176
Line Style
Change the line style and color coding of the time series. See Changing the Line
Style on page 219 and Color-Coding Price Relations, Intervals or Trends on
page 220
Price Display
Display price lines at the level of the current price. See Showing Price Lines at
the Level of Current Prices on page 222
Trading Sessions
Change the trading sessions for the symbol. See Changing the Amount of Data
Displayed in the Chart on page 217 and Color-Coding Price Relations, Intervals
or Trends on page 220
Customizing News
For a news document, you can customize the following settings in the News Properties dialog:
Property Sheet
Description
Filter
Set a services, keywords, categories or range filter for news stories
View
Change the font of the news document, its foreground and background colors, and the
data that is displayed in news headlines
Additionally, you can choose if headlines and/or stories are displayed in the news document, navigate between news
stories, and search for a word or phrase in news headlines or stories.
For more information, see News on page 53.
Customizing Documents, Pop-up Windows and Panes
105
TeleTrader Software GmbH
Marc-Aurel-Straße 10-12, 1010 Vienna, Austria
E-Mail [email protected]
Internet http://professional.teletrader.com
Showing and Hiding News Headlines and Stories
The news window shows news headlines and stories in a combined view by default. You can however also show only
the news headlines, or only the news stories.
To show or hide news headlines and stories
▪
Click on the appropriate icon on the News toolbar:
Headlines Only
Show only the news headlines
Headlines and
Story
Show both news headlines and stories
Story Only
Show only the news story
News headlines
When you are using the view Headlines Only, you can still display the entire news story in a separate window. You
can also choose which columns of headline data should be displayed, and whether to display the column headers.
To open a news story in a separate window
▫
Double-click a news headline, or
▫
Right-click a news headline and choose Open.
To show or hide the different columns of news headlines
▪
Click on the appropriate icon on the News toolbar:
Note
Display Source
Show / hide the Services column of a headline
Display Date
Show / hide the Date column of a headline
Display Time
Show / hide the Time column of a headline
Display Key
Show / hide the Story no. column of a headline
See also Changing Font, Colors and Headline Data of News on page 107.
To show or hide the headers of news headline columns
▪
Right-click a news headline and choose Show Column Headers.
News stories
When you are using the view Story Only, you can still navigate to different news stories from the toolbar.
To navigate between news stories
▪
Click on the appropriate icon on the News toolbar:
Last Story Received
Jump to the latest news story
Previous Story
Jump to the previous news story
Next Story
Jump to the next news story
Customizing Documents, Pop-up Windows and Panes
106
TeleTrader Software GmbH
Marc-Aurel-Straße 10-12, 1010 Vienna, Austria
E-Mail [email protected]
Internet http://professional.teletrader.com
Changing Font, Colors and Headline Data of News
You can change the font of all text that is displayed in a news document (headlines and news stories), the data that is
displayed in the headline of a news story, the color of the text and the background color of the news document on the
View property sheet of the News Properties dialog.
Note
For showing / hiding individual headline columns, see also Showing and Hiding News Headlines
and Stories on page 106.
To change the font, colors and headline data of a news document
▪
Right-click in the news document and select Properties.
▪
On the left side of the dialog, select View.
▪
On the right side of the dialog, adapt the default settings to your needs.
▪
You can see a preview for your settings in the Preview window at the bottom of the dialog.
Control
Description
Font
Type of font used for all text in the news document
Font Size
Size of the font used for all text in the news document
Bold
Check to apply a bold font to all headline text
Foreground
Color of the text
Background
Background color of the news document
Breaking News
Color of breaking news (also marked with * in the headline)
Source
Check to display the Services column of a headline
Key
Check to display the Story no. column of a headline
Date
Check to display the Date column of a headline
Time
Check to display the Time column of a headline
Filtering News Stories
You can filter the news stories that are shown in a news document by news service, category, keyword or range. With
a services filter, you can display only news stories that were sent by specific news services. With a category filter, you
can display only news stories that have the categories that you select. With a keyword filter, you can search for
specific words that appear in the text of a news story. With a range filter, you can define how many headlines will be
displayed in the news document, or choose a specific time period for the displayed news headlines.
Note
The filters you set here will also be applied when you perform a quick keyword search by simply
typing your search term into the news document. See Quick Keyword Search in News on page
110.
To filter news stories
▪
Right-click in the news document and select Properties.
▪
On the left side of the dialog, select Filter.
▪
In the Services section on the right side of the dialog, select the news services that you want to include.
Note
You can click Select All to include all news services, or Deselect All to include no news service.
Customizing Documents, Pop-up Windows and Panes
107
TeleTrader Software GmbH
Marc-Aurel-Straße 10-12, 1010 Vienna, Austria
E-Mail [email protected]
Internet http://professional.teletrader.com
▪
In the Categories section, select the categories that you want to include.
▪
In the Keyword Filter section, enter your search terms in the Search for field. Keywords will be highlighted in
the news document.
Note
▪
If you want to search only for the exact term / phrase that you entered, select the Match whole
word only checkbox.
If you want to search for the keyword only in headlines (not in the text of the news stories), select
the Find in Headlines checkbox.
If you want to display breaking news only, enter * as the keyword.
In the Range section, choose the range / time period for the displayed news headlines:
Last...
Choose the relative time period for which you want to display news, for example Last 3
hours
Records
Enter the number of headlines that you want to see
Period (from-to)
Choose an exact time period for which you want to display news (start and end date / time)
Note
There is a maximum of 1000 news headlines that can be displayed in one news document. This
limit also applies when filtering by date/time. Older headlines might not be shown, even if they
match your filter criteria.
Searching for Keywords in News
You can search for keywords or phrases in news headlines or news stories currently displayed in the news document,
in the news story that is active at the moment, or search the whole news database.
Note
If you want to get an automatic notification whenever a keyword or phrase shows up in a news
story, use alerts: See News Alerts on page 325.
To search for a word in all loaded news headlines (local search)
▪
Click on a news headline.
▪
Click on the Find icon in the News toolbar:
▪
Click on the Local Search radio button.
▪
Enter your search terms in the Search for field.
Customizing Documents, Pop-up Windows and Panes
108
TeleTrader Software GmbH
Marc-Aurel-Straße 10-12, 1010 Vienna, Austria
E-Mail [email protected]
Internet http://professional.teletrader.com
▪
Choose in which direction you want to search first: Up searches the headlines above the current headline, Down
searches the headlines below.
▪
If you want to search only for the exact term / phrase that you entered, select Match whole word only.
Note
When you activate this option, for example a search for the term "market" will only find news
headlines that contain this exact word. News headlines that contain these letters as part of another
word ("marketing", "markets", "marketwatch" etc.) will not be displayed.
▪
If your search terms are case-sensitive, select Match case.
▪
Click Find Next to highlight the next match.
To search for a word in all available news headlines and stories (news database)
▪
Click on a news headline.
▪
Click on the Find icon in the News toolbar:
▪
Click on the Search on News database radio button
▪
Enter your search terms in the Search for field.
▪
If you want to search only for the exact term / phrase that you entered, select Match whole word only.
▪
If you want to search for the keyword only in headlines (not in the text of the news stories), select the Match
headline only checkbox.
▪
Click Ok to search for news and highlight all matches.
To search for a word in a specific news story
▪
Click on the news story.
▪
Click on the Find icon in the News toolbar:
Customizing Documents, Pop-up Windows and Panes
109
TeleTrader Software GmbH
Marc-Aurel-Straße 10-12, 1010 Vienna, Austria
E-Mail [email protected]
Internet http://professional.teletrader.com
▪
Enter your search term in the Find field.
▪
If you want to search only for the exact term / phrase that you entered, select Match whole word only.
▪
If your search terms are case-sensitive, select Match case.
▪
If you want to see all matching terms in the news story at once, select Highlight all matches.
▪
Click Previous or Next to jump to the preceding / following match.
Quick Keyword Search in News
Quick keyword search lets you search for keywords in the news database more easily. You just type your search term
over the active news document, and TeleTrader Professional performs a search for this keyword in the whole news
database, using the current filter settings from the News Properties dialog, including the currently set range (see
Filtering News Stories on page 107). When you want to return to the original state of the news document (and clear
the search terms you entered) you can easily reset the news document.
To search for a word in the news database using quick keyword search
▪
Make sure that the news document is open and active.
▪
Type your search term, for example DJI.
▪
Press the ENTER key.
▪
The search is performed for the keyword DJI using the option Match whole word only. All news stories that
contain the keyword DJI and comply to the currently filter settings from the News Properties dialog (services,
categories and range filters) are displayed.
To reset the news document and clear the previous keyword search
▪
Click the Clear news search icon on the News toolbar
, or press the HOME key.
Customizing Market Depth
For a market depth document, you can customize the following settings in the Market Depth Properties dialog:
Property Sheet
Description
Price View
Add, remove and rearrange the columns of the price view
> Update
Assign an update style to specific columns in the price view
> Grid
Change the appearance and color of the grid in the price view
> Font
Change the font of the price view and its foreground and background color
Market Depth
Change the number of depth levels shown and choose their colors
> Summary View
Add, remove and rearrange the columns of the summary view
> Graph View
Change the background color, graph orientation and separation line for the graph view
Customizing Documents, Pop-up Windows and Panes
110
TeleTrader Software GmbH
Marc-Aurel-Straße 10-12, 1010 Vienna, Austria
E-Mail [email protected]
Internet http://professional.teletrader.com
> Depth View
Add, remove and rearrange the columns of the depth view
> Filter
Set a price or size filter for the market depth document
For more information, see Market Depth on page 55.
Showing and Hiding Views
A market depth document consists of four views: price view, summary view, graph view and depth view. Apart from
the price view, which is always visible, the other views can be shown or hidden.
To show and hide views in a market depth document
▪
Right-click on the market depth document.
▪
Click on a view to show or hide it.
▪
All visible views are highlighted with a check mark:
To resize the view of a market depth document
▪
Place the mouse pointer on the separation line between two views. The mouse pointer changes:
▪
Hold the mouse button down and move the mouse to widen / shorten the view.
Customizing Documents, Pop-up Windows and Panes
111
TeleTrader Software GmbH
Marc-Aurel-Straße 10-12, 1010 Vienna, Austria
E-Mail [email protected]
Internet http://professional.teletrader.com
Note
You cannot resize the price view.
Customizing the Price View
The price view displays the inside market quote for the symbol (highest bid and lowest ask price) in columns – think of
it as a price page with only one symbol. It can be customized in the same way as a price page or watch list: You can
insert and rearrange columns, change the update style of a column and customize font, colors and grid lines in the
Market Depth Properties dialog.
To add columns to and remove them from the price view
▪
Right-click in the price view and select Properties.
▪
On the left side of the dialog, select Price View.
▪
On the right side of the dialog, add and remove columns like you would in a price page.
For detailed instructions, see Adding and Removing Columns on page 80.
To rearrange and resize the columns of the price view
▪
Right-click in the price view and select Properties.
▪
On the left side of the dialog, select Price View.
▪
On the right side of the dialog, move columns up and down like you would in a price page.
For detailed instructions, see Rearranging and Resizing Rows and Columns on page 81.
To change the update style for the columns of the price view
▪
Right-click in the price view and select Properties.
▪
On the left side of the dialog, select Price View > Update.
▪
On the right side of the dialog, change the update styles like you would in a price page.
For detailed instructions, see Changing the Update Style of a Column on page 83.
To change the grid style of the price view
▪
Right-click in the price view and select Properties.
▪
On the left side of the dialog, select Price View > Grid.
▪
On the right side of the dialog, change the grid style like you would in a price page.
For detailed instructions, see Changing the Grid Style on page 84.
To change font and colors of the price view
▪
Right-click in the price view and select Properties.
▪
On the left side of the dialog, select Price View > Font.
▪
On the right side of the dialog, change font and colors like you would in a watch list.
For detailed instructions, see Changing Font and Colors on page 133.
Customizing the Summary View
The summary view shows a table with a summary of all orders that are visible in the market, grouped by depth level.
The best bids and asks are displayed at the top. You can see the bid / ask prices of each level, the calculated spread,
the number and accumulated size of the orders at this level, and the accumulated size of orders over all levels.
Customizing Documents, Pop-up Windows and Panes
112
TeleTrader Software GmbH
Marc-Aurel-Straße 10-12, 1010 Vienna, Austria
E-Mail [email protected]
Internet http://professional.teletrader.com
To add columns to and remove them from the summary view
▪
Right-click in the summary view and select Properties.
▪
On the left side of the dialog, select Market Depth > Summary View.
▪
On the right side of the dialog, add and remove columns like you would in a price page.
For detailed instructions, see Adding and Removing Columns on page 80.
To rearrange and resize the columns of the summary view
▪
Right-click in the summary view and select Properties.
▪
On the left side of the dialog, select Market Depth > Summary View.
▪
On the right side of the dialog, move columns up and down like you would in a price page.
For detailed instructions, see Rearranging and Resizing Rows and Columns on page 81.
Available columns in summary view
Column
Description
BC
BidCount: The number of orders for this bid price level
AccBidSize
Accumulated size of all buy orders – this is the running total of the BidSize
BidSize
Size of the buy orders for this bid price level
Bid
Bid price
Spread
Difference between the bid / ask pair on this level
Ask
Ask (offer) price
AskSize
Size of the sell orders for this ask price level
AccAskSize
Accumulated size of all sell orders – this is the running total of the AskSize
AC
AskCount: The number of orders for this ask price level
Customizing the Graph View
The graph view visualizes the data displayed in the summary view. Each bar represents a depth level. The length (or
height) of the bar represents the size of the orders at this depth level. The bars can be displayed vertically (ask bars
are shown in the right part) or horizontally (ask bars are shown in the top part).
To change the graph orientation
▪
Right-click in the summary view and select Properties.
▪
On the left side of the dialog, select Market Depth > Graph View.
▪
On the right side of the dialog, select Vertical or Horizontal.
Vertical graph
Horizontal graph
Customizing Documents, Pop-up Windows and Panes
113
TeleTrader Software GmbH
Marc-Aurel-Straße 10-12, 1010 Vienna, Austria
E-Mail [email protected]
Internet http://professional.teletrader.com
Separation of the graph into bid and ask sections
The graph view is divided into two sections: The ask section (top or right part) and the bid section (bottom or left part).
The background color for each section can be set individually. You can also choose if you want the two sections to
take up the same amount of space (fixed separation line), or if you want to see which side has more orders with a
floating separation line.
The floating separation line is enabled by default – the sections are then sized according to the accumulated size of
orders on the bid or ask side. For example, if you have an accumulated bid size of 600, and an accumulated ask size
of 400, the bid section will take up 60 percent of the available space in the graph view, and the ask side will take up
40 percent. The widths of the bars are then adjusted to the available space. When you see wider bars on the bid side,
for example, this means that at the moment, there are more buyers in the market.
Fixed separation line
Floating separation line
To change the background colors of the bid and ask sections
▪
Right-click in the graph view and select Properties.
▪
On the left side of the dialog, select Market Depth > Graph View.
▪
On the right side of the dialog, choose a background color for the Ask section (top part in horizontal graph view,
right part in vertical graph view) and for the Bid section (bottom part in horizontal graph view, left part in vertical
graph view).
To set a fixed separation line between the bid and ask section
▪
Right-click in the graph view and select Properties.
▪
On the left side of the dialog, select Market Depth > Graph View.
▪
On the right side of the dialog, select the Fix separation line check box.
Customizing the Depth View
The depth view shows all bids and asks side by side. The best bids and asks are displayed at the top. This view is
hidden by default – to display it, see Showing and Hiding Views on page 111.
To add columns to and remove them from the depth view
▪
Right-click in the depth view and select Properties.
▪
On the left side of the dialog, select Market Depth > Depth View.
▪
On the right side of the dialog, add and remove columns like you would in a price page.
For detailed instructions, see Adding and Removing Columns on page 80.
Note
The depth view offers similar columns as the summary view, plus an additional column Source
that shows the market participant ID of the respective bid / ask.
To rearrange and resize the columns of the depth view
▪
Right-click in the depth view and select Properties.
Customizing Documents, Pop-up Windows and Panes
114
TeleTrader Software GmbH
Marc-Aurel-Straße 10-12, 1010 Vienna, Austria
E-Mail [email protected]
Internet http://professional.teletrader.com
▪
On the left side of the dialog, select Market Depth > Depth View.
▪
On the right side of the dialog, move columns up and down like you would in a price page.
For detailed instructions, see Rearranging and Resizing Rows and Columns on page 81.
Setting the Maximum Number and Colors for the Depth Levels in Market Depth
In the summary view, graph view and depth view of a market depth document, you can see different depth levels. You
can set how many depth levels you want to display, and you can assign a color to each depth level.
Note
Changing these settings will affect all views except the price view.
To set the maximum number of depth levels in market depth
▪
Right-click in the market depth document and select Properties.
▪
On the left side of the dialog, select Market Depth.
▪
On the right side of the dialog, select the Maximum Depth checkbox.
▪
Enter the maximum number of depth levels to be displayed.
To set the colors for the depth levels in market depth
▪
Right-click in the market depth document and select Properties.
▪
On the left side of the dialog, select Market Depth.
▪
On the right side of the dialog, enter the number of different colors you want to use in the Number of colors
field.
▪
In the Colors section, click on the depth level for which you want to set the color. The label on the right shows
the selected level.
▪
Choose the color for this level.
▪
Click on each other level for which you want to set the color, and choose a color for it.
Filtering Information in Market Depth
You can filter the information that is shown in market depth by the price or size of the orders shown. With a price filter,
you can display only orders with prices inside a certain range that you define. With a size filter, you can do the same
for order sizes.
Customizing Documents, Pop-up Windows and Panes
115
TeleTrader Software GmbH
Marc-Aurel-Straße 10-12, 1010 Vienna, Austria
E-Mail [email protected]
Internet http://professional.teletrader.com
To filter the information shown in market depth
▪
Right-click in the market depth document and select Properties.
▪
On the left side of the dialog, select Depth View > Filter.
▪
On the right side of the dialog, select the Define prices check box to set a price filter.
▪
In the Prices filter section, enter the lower and upper boundaries for the price range that you want to display in
market depth.
▪
Select the Define size check box to set a size filter.
▪
In the Size filter section, enter the lower and upper boundaries for the size range that you want to display in
market depth.
Note
You can also see a Brokers filter in the dialog. This function is not available at the moment.
Customizing Time and Sales
For a time and sales document, you can customize the following settings in the Time and Sales Properties dialog:
Property Sheet
Description
Symbols
Add and remove symbols, assign colors to individual symbols
Price Page
Add, remove and rearrange the columns of the price page view
> Update
Assign an update style to specific columns in the price page view
> Grid
Change the appearance and color of the grid in the price page view
> Font
Change the font of the price page view and its foreground and background color
Time & Sales
Add, remove and rearrange the columns and fields of the time and sales view
> Time Region
Change the amount of data that is displayed in time and sales
> Grid
Change the appearance and color of the grid in the time and sales view
> Font
Change the font of the time and sales view and its foreground and background color
> Filter
Set a price or size filter for time and sales data
Additionally, you can decide if you want to show the market activity of one symbol or of several symbols, show / hide
the different views of the document, add sheets and temporarily freeze the time and sales view. You can also link
other documents to a time and sales documents, and show chain symbols (symbol lists) in time and sales.
For more information, see Time and Sales on page 56.
Customizing Documents, Pop-up Windows and Panes
116
TeleTrader Software GmbH
Marc-Aurel-Straße 10-12, 1010 Vienna, Austria
E-Mail [email protected]
Internet http://professional.teletrader.com
Showing Data for a Single Symbol or Multiple Symbols in Time and Sales
For every time and sales document, you can choose whether to display only the market activity for a single symbol, or
all trades, bids and asks for multiple symbols. This means that you can display time and sales data for many symbols
in one document. The list of symbols is displayed in the price page view (see Showing and Hiding Views on page
117). You can either switch between the symbols, which means that you can show only the time and sales data for
one selected symbol at a time, or you can show all time and sales data simultaneously (this is especially useful for
infrequently traded securities).
Note
In time and sales documents that contain a chain symbol, you cannot show data for a single
symbol. See also Displaying Chain Symbols in Time and Sales on page 124.
To show time and sales data for all / selected symbols
▪
Right-click in the time and sales view and select Show all Symbols or Show Selected Symbol.
▪
The row headers of the price page view will show a red arrow when only the time and sales data for the selected
symbol is displayed.
Note
You can also double-click any row header in the price page view to switch between these options.
Showing and Hiding Views
A time and sales document consists of two views: the price page view and the time and sales view. You can choose
which of the views you want to show. You can also freeze the time and sales view temporarily, which means that no
new records will be loaded until you unfreeze the view.
Note
In time and sales documents that contain a chain without a main symbol, the price page view is
hidden automatically and cannot be shown. See also Displaying Chain Symbols in Time and Sales
on page 124.
To show and hide views in a time and sales document
▪
Right-click on the time and sales document.
Customizing Documents, Pop-up Windows and Panes
117
TeleTrader Software GmbH
Marc-Aurel-Straße 10-12, 1010 Vienna, Austria
E-Mail [email protected]
Internet http://professional.teletrader.com
▪
Click on a view to show or hide it.
▪
All visible views are highlighted with a check mark:
To resize the view of a time and sales document
▪
Place the mouse pointer on the separation line between the two views. The mouse pointer changes:
▪
Hold the mouse button down and move the mouse to widen / shorten the view.
To freeze the time and sales view
▪
Click the Play / Pause icon in the upper left corner of the time and sales view:
The Play icon indicates that time and sales is showing new data as it comes in.
Click to freeze the time and sales view.
The Pause icon indicates that the data stream in the time and sales view is
temporarily stopped.
Click to unfreeze the time and sales view.
▪
Alternatively, you can also right-click on the time and sales document and choose Freeze Time & Sales View.
To unfreeze the time and sales view, right-click and choose Freeze Time & Sales View again.
Adding and Removing Symbols in Time and Sales
You can add symbols to the price page view of time and sales documents or remove them from the document.
Note
In time and sales documents that contain a chain symbol, you cannot add or remove symbols
manually. See also Displaying Chain Symbols in Time and Sales on page 124.
To add a symbol to a time and sales document
▪
Right-click in the time and sales document and select Properties.
▪
On the left side of the dialog, select Symbols.
▪
On the right side of the dialog, click Add.
▪
In the Symbol Search dialog, enter your search term in the first field on the left side and change the search
settings, if necessary. For more information, see Searching for Securities in the Symbol Search Dialog on page
34.
▪
Click on the green button or press the ENTER key to start the search.
▪
Select the symbol(s) that you want to insert.
▪
Click OK. The symbol is inserted into the Symbols list.
You can also insert symbols like in other multi-symbol documents: See Inserting Symbols on page 74.
Customizing Documents, Pop-up Windows and Panes
118
TeleTrader Software GmbH
Marc-Aurel-Straße 10-12, 1010 Vienna, Austria
E-Mail [email protected]
Internet http://professional.teletrader.com
To remove a symbol from a time and sales document
▪
Right-click in the time and sales document and select Properties.
▪
On the left side of the dialog, select Symbols.
▪
On the right side of the dialog, select the symbol from the Symbols list.
▪
Click Remove.
You can also remove symbols like in other multi-symbol documents: See Removing Symbols on page 76.
Assigning Colors to Individual Symbols
You can assign a different color to every symbol of a time and sales document. This color is used for the symbol in
both views (price page view and time and sales view).
Note
All symbols to which no colors have been assigned will be shown with the default colors defined
under Price Page > Font and Time & Sales > Font.
To assign colors to a symbol
▪
Right-click in the time and sales document and select Properties.
▪
On the left side of the dialog, select Symbols.
▪
On the right side of the dialog, select the symbol from the Symbols list.
▪
Select the Foreground check box, and choose a text color for this symbol.
▪
Select the Background check box, and choose a background color for this symbol.
Changing the Number of Decimal Places
You can change the number of decimal places that is used for a specific column in time and sales, or for the selected
symbol in all documents.
Customizing Documents, Pop-up Windows and Panes
119
TeleTrader Software GmbH
Marc-Aurel-Straße 10-12, 1010 Vienna, Austria
E-Mail [email protected]
Internet http://professional.teletrader.com
To change the number of decimal places for a time and sales column
▪
Right-click the column header and choose Set decimal places.
▪
In the Set decimal places dialog, enter the number of decimal places that you want to use for the selected
column.
To change the number of decimal places for a symbol
▪
Right-click in the time and sales view and choose Set decimal places.
▪
In the Set decimal places dialog, enter the number of decimal places that you want to use for the selected
symbol.
Note
The custom decimal places will be used for this symbol in all documents (charts, time and sales,
market depth, options matrix, quick quote, price pages etc.). You can also change this setting
under Tools > Options > General > Subscription (see Subscription Settings on page 339).
Changing the Grid Style, Font and Colors of the Time and Sales View
You can customize font, colors and grid lines in the time and sales view in the same way as in a price page or watch
list.
To change the grid style of time and sales
▪
Right-click in the time and sales view and select Properties.
▪
On the left side of the dialog, select Time & Sales > Grid.
▪
On the right side of the dialog, change the grid style like you would in a price page.
For detailed instructions, see Changing the Grid Style on page 84.
To change font and colors of time and sales
▪
Right-click in the time and sales view and select Properties.
▪
On the left side of the dialog, select Time & Sales > Font.
▪
On the right side of the dialog, change font and colors like you would in a watch list.
For detailed instructions, see Changing Font and Colors on page 133.
Adding and Removing Columns in the Time and Sales View
You can add, remove or edit the columns shown in the time and sales view. If you are using different sheets, you can
configure time and sales to show different columns on each sheet.
To add columns to the time and sales view
▪
Right-click in the time and sales view and select Properties.
Note
You can also right-click on the tab of a sheet and choose Edit Columns instead.
▪
In the Time and Sales Properties dialog, select the column after which the new column should appear in the
Displayed Columns list.
▪
Select the data field that you want to use as the base for the new column from the Available Fields list.
Customizing Documents, Pop-up Windows and Panes
120
TeleTrader Software GmbH
Marc-Aurel-Straße 10-12, 1010 Vienna, Austria
E-Mail [email protected]
Internet http://professional.teletrader.com
▪
Click Add Column.
▪
The new column is shown in the Displayed Columns list. It automatically has the name of the chosen data field,
and the field is added to the column.
To add fields to a time and sales column
Note
A time and sales column displays data from one or more data fields. This is often useful for
columns such as Date, where either the field Date (for trades), BidDateTime (for buy orders) or
AskDateTime (for sell orders) is shown.
▪
Right-click in the time and sales view and select Properties.
▪
In the Time and Sales Properties dialog, select the column where you want to add a new field in the Displayed
Columns list.
▪
Select the data field that you want to add from the Available Fields list.
▪
Click Add Field.
▪
The field is added to the chosen column in the Displayed Columns list.
To remove fields or columns from the time and sales view
▪
Right-click in the time and sales view and select Properties.
▪
In the Time and Sales Properties dialog, select the column or field that you want to remove from the Displayed
Columns list.
▪
Click Remove.
To edit column names
▪
Right-click in the time and sales view and select Properties.
▪
In the Time and Sales Properties dialog, select a column in the Displayed Columns list.
▪
Click Edit.
▪
Enter a new name for the column and press the ENTER key.
Customizing Documents, Pop-up Windows and Panes
121
TeleTrader Software GmbH
Marc-Aurel-Straße 10-12, 1010 Vienna, Austria
E-Mail [email protected]
Internet http://professional.teletrader.com
To rearrange and resize the columns of the time and sales view
▫
To rearrange the columns of the time and sales view, click on the column header and drag the column to its new
position.
▫
To resize the width of a column in the time and sales view, place the mouse pointer between two columns, hold
the mouse button down and move the mouse to widen / shorten the column.
To add sheets to the time and sales view
Like a price page, the time and sales view consists of at least one sheet. You can add additional sheets to create
different time and sales views for a document. Each sheet can be customized independently – that means it can use
different columns, colors and fonts (see Changing the Grid Style, Font and Colors of the Time and Sales View on
page 120). You cannot define different Time Region settings for the sheets, though – this setting will be the same in
the whole document.
For more information about how to create new sheets, rename or remove a sheet, see the information about sheets in
price pages: Adding and Organizing Sheets on page 87.
Note
You cannot move symbols from one time and sales sheet to another like you can in price pages.
Changing the Amount of Data Displayed in Time and Sales
You can change the amount of data that is displayed in a time and sales document. You can display more data, less
data, or data from a specific time period (that means, historical time and sales data).
Note
Be aware that Professional needs more system resources the more data you load in time and
sales. If you don’t need older time and sales data, keep the default setting.
To change the amount of data displayed in time and sales
▪
Right-click in the time and sales document and select Properties.
▪
On the left side of the dialog, select Time & Sales > Time Region.
▪
On the right side of the dialog, choose the appropriate option.
All
All available time and sales data is loaded and displayed in the time and sales document.
Last x days
Time and sales data for the last x days is displayed. Enter the number of days.
Records
The last x records (rows) are displayed. Enter the number of records.
The default setting is 50 records (rows).
Note
Period (from-to)
In time and sales documents that contain a chain symbol, historical data is
not loaded when opening the document. Time and sales data is only shown
as it comes in. See also Displaying Chain Symbols in Time and Sales on
page 124.
Time and sales data for a specific time period is displayed. Choose the begin and end date
and time of the period. You can use this option to display historical time and sales data.
Customizing Documents, Pop-up Windows and Panes
122
TeleTrader Software GmbH
Marc-Aurel-Straße 10-12, 1010 Vienna, Austria
E-Mail [email protected]
Internet http://professional.teletrader.com
Filtering Information in Time and Sales
You can filter the information that is shown in time and sales by the price or the volume / size of the trades / orders.
With a price filter, you can display only data with prices inside a certain range that you define. With a size filter, you
can do the same for trade volume / order sizes.
To filter the information shown in time and sales
▪
Right-click in the time and sales document and select Properties.
▪
On the left side of the dialog, select Filter.
▪
On the right side of the dialog, select the appropriate filtering option.
▪
Enter the lower and upper boundaries for the price or size range that you want to display in time and sales.
Price Filter
Last price
Set a filter for trades (column Last)
Bid price
Set a filter for Bid prices
Ask price
Set a filter for Ask prices
Size Filter
Trade volume
Set a filter for trade volume (column VolLast)
Bid size
Set a filter for Bid size
Ask size
Set a filter for Ask size
Customizing the Price Page View
The price page view can be customized in the same way as a price page: You can insert and rearrange columns,
change the update style of a column and customize font, colors and grid lines in the Time and Sales Properties
dialog.
To add columns to and remove them from the price page view
▪
Right-click in the price page view and select Properties.
▪
On the left side of the dialog, select Price Page.
▪
On the right side of the dialog, add and remove columns like you would in a price page.
For detailed instructions, see Adding and Removing Columns on page 80.
To rearrange and resize the columns of the price page view
▪
Right-click in the price page view and select Properties.
▪
On the left side of the dialog, select Price Page.
▪
On the right side of the dialog, move columns up and down like you would in a price page.
For detailed instructions, see Rearranging and Resizing Rows and Columns on page 81.
To change the update style for the columns of the price page view
▪
Right-click in the price page view and select Properties.
▪
On the left side of the dialog, select Price Page > Update.
▪
On the right side of the dialog, change the update styles like you would in a price page.
Customizing Documents, Pop-up Windows and Panes
123
TeleTrader Software GmbH
Marc-Aurel-Straße 10-12, 1010 Vienna, Austria
E-Mail [email protected]
Internet http://professional.teletrader.com
For detailed instructions, see Changing the Update Style of a Column on page 83.
To change the grid style of the price page view
▪
Right-click in the price view and select Properties.
▪
On the left side of the dialog, select Price Page > Grid.
▪
On the right side of the dialog, change the grid style like you would in a price page.
For detailed instructions, see Changing the Grid Style on page 84.
To change font and colors of the price page view
▪
Right-click in the price view and select Properties.
▪
On the left side of the dialog, select Price Page > Font.
▪
On the right side of the dialog, change font and colors like you would in a price page.
For detailed instructions, see Changing Font and Colors on page 85.
Linking Documents to Time and Sales
In the same way as you can link charts, news, options matrix and market depth documents to a price page, you can
also link them to the price page view of a time and sales document. Whenever you select a new symbol in the price
page view of a time and sales document, all linked documents will also display this symbol.
For more information on linking charts, news, options matrix, market depth and quick quote documents to a time and
sales document, see Linking Documents to a Price Page on page 89. The linking process is the same for price pages,
watch lists and time and sales documents.
Note
Time and sales documents that contain a chain symbol cannot be linked to other documents. See
also Displaying Chain Symbols in Time and Sales on page 124.
Row highlight mode in time and sales
The row highlight mode in time and sales documents is indicated by a red arrow in the row header of the active row in
the price page view. In highlight mode, you can switch between symbols in linked documents by clicking on a symbol
in the price page view or using the arrow keys of your keyboard.
In addition, the row highlight mode also means that only time and sales data for the selected symbol is shown in the
time and sales view of the document. This means that by using the row highlight mode, you show only data for the
selected symbol, both inside the time and sales document and in all linked documents. See also Showing Data for a
Single Symbol or Multiple Symbols in Time and Sales on page 117.
Displaying Chain Symbols in Time and Sales
Apart from "normal" symbols, time and sales documents can also display so-called chain symbols. This is a special
symbol type that is in essence a pointer to a list of normal symbols of different types, usually a list of index
constituents. The list of symbols contained in a chain is automatically updated on the server. This means that when
for example some new stocks are added to the list of index constituents, the list of symbols will be automatically
updated in the time and sales document.
Customizing Documents, Pop-up Windows and Panes
124
TeleTrader Software GmbH
Marc-Aurel-Straße 10-12, 1010 Vienna, Austria
E-Mail [email protected]
Internet http://professional.teletrader.com
Chain symbols can also hold a so-called main symbol. This symbol is usually an index symbol (if the chain holds a list
of index constituents). The main symbol is shown in the price page view of time and sales – in contrast to normal
multi-symbol time and sales documents, the list symbols are not displayed there. The name of the chain symbol is
shown in the title of the time and sales documents – chain symbol names typically contain with a pound sign (for
example, DAX#XETRA or INDU#US).
Note
Some chains do not contain a main symbol. In that case, the price page view is automatically
hidden and cannot be shown.
To open a chain symbol in time and sales
▫
Use Symbol Search to find and open a specific chain symbol: See Opening Symbols from the Search Results on
page 38.
▫
Type the ticker or name of a chain symbol into a time and sales document (Smart Symbol Search) to replace all
symbols that are currently visible in time and sales with the chain: See Calling Symbol Search from a Document
on page 41.
▫
Open a chain symbol that was stored in FastLook: See Opening Symbols from FastLook on page 167.
Customizing Documents, Pop-up Windows and Panes
125
TeleTrader Software GmbH
Marc-Aurel-Straße 10-12, 1010 Vienna, Austria
E-Mail [email protected]
Internet http://professional.teletrader.com
Different behavior in comparison to normal multi-symbol time and sales documents
Showing chain symbols in a time and sales document seems similar to using a normal multi-symbol time and sales
document. However, there are some differences in the behavior of time and sales documents when they contain a
chain symbol:
Normal multi-symbol time and sales
document
Time and sales document with
chain symbol
Adding / removing
symbols
You can manually add or remove symbols.
See also Adding and Removing Symbols in
Time and Sales on page 118
The symbol list is loaded automatically
from the server, and also updated
automatically. You cannot add or remove
symbols manually.
Initial loading of
historical data
When you open the document, the latest
historical data is automatically loaded from
the market data server according to the
settings under Properties > Time&Sales >
Time Region.
See also Changing the Amount of Data
Displayed in Time and Sales on page 122
When the time region is set to Records,
no historical data is loaded when opening
the document. New time and sales data is
shown as it comes in, up until the
maximum set in Properties (by default,
last 50 records).
For all other time region settings, loading
of historical data works the same as in
normal time and sales documents.
Price page view
The price page view shows all symbols that
have been added to the document. You can
show or hide the price page view.
See also Showing and Hiding Views on page
117
The price page view shows the main
symbol of the chain. If the chain does not
contain a main symbol, the price page
view is automatically hidden and cannot
be shown.
Showing market
activity for a only
single symbol
You can show data for a single symbol or for
all symbols in the time and sales view of the
document.
See also Showing Data for a Single Symbol
or Multiple Symbols in Time and Sales on
page 117
You cannot show data for a single
symbol. The command Show Selected
Symbol is disabled.
Linking of
documents
You can link other documents, like charts, to
the price page view of the time and sales
document.
See also Linking Documents to Time and
Sales on page 124
You cannot link other documents to the
time and sales document.
Note
When you drag and drop a new (normal) symbol to a time and sales document that currently
displays a chain, Professional automatically suggests breaking the connection with the chain
symbol.
The following message is shown in that case: This operation will break the connection with the
chain symbol for this document. Lists will no longer be updated. Do you want to continue?
Click Yes to turn off automatic list updates and add the new symbol to the document. The
document will now behave like a normal multi-symbol time and sales document, which means that
the symbol list is not automatically updated anymore when there are changes to the chain.
Click No to keep automatic lists updates turned on and cancel the adding of the new symbol. The
list of symbols which are part of the chain is now still automatically managed on the server. New
symbols are added to the chain, other symbols are removed from the chain in regular intervals. If
you display a chain symbol in time and sales, the symbol list will be automatically updated after a
server-side change. This means that for example you'll always get the current list of index
constituents for the DAX#XETRA or INDU#US index chain.
Customizing Documents, Pop-up Windows and Panes
126
TeleTrader Software GmbH
Marc-Aurel-Straße 10-12, 1010 Vienna, Austria
E-Mail [email protected]
Internet http://professional.teletrader.com
Customizing Options Matrix
For an options matrix document, you can customize the following settings in the Options Matrix Properties dialog:
Property Sheet
Description
Underlying
Add, remove and rearrange the columns of the underlying view
> Update
Assign an update style to specific columns in the underlying view
> Grid
Change the appearance and color of the grid in the underlying view
> Font
Change the font of the underlying view and its foreground and background color
Greeks
Change the option pricing model for calculating the greeks and its input values (volatility,
interest rate)
> Grid
Change the appearance and color of the grid in the greeks view
> Font
Change the font of the greeks view and its foreground and background color
Options Matrix
Choose the visible expiration dates and filter by strike price
> Columns
Add, remove and rearrange the columns of the options matrix view
> Update
Assign an update style to specific columns in the options matrix view
> Grid
Change the appearance and color of the grid in the options matrix view
> Font
Change the font of the options matrix view and its foreground and background color
> Header
Change the colors of the header and middle column in the options matrix view
In addition, you can change the grouping of the options (by expiration date or strike price), hide the underlying /
greeks view, and adapt the number of decimal places shown for both the underlying and its options.
For more information, see Options Matrix on page 59.
Showing, Hiding and Changing Views
An options matrix document consists of two views: The underlying view on top, which shows data about the
underlying symbol, and the options matrix view, which shows the Eurex options for this underlying. The options are
either grouped by expiration date (default) or by strike price. The underlying view can also be hidden.
To group options by expiration date or by strike price
▪
Right-click on the options matrix and choose Group by Strike Price or Group by Expiration Date to switch
between the two grouping methods.
Note
This setting can also be adapted in the Options Matrix Properties.
To expand and collapse groups
▫
Double-click on a group header to expand or collapse a group.
▫
Press and hold the CTRL key while double-clicking on a group header to expand a group and at the same time
collapse all other groups (switching between groups).
To select symbols in the options matrix view
▫
Click on a row to select an options symbol (Call side or Put side). You can also select multiple symbols by
holding the CTRL or SHIFT keys.
▫
Click on the middle column (strike price or expiration date column) to select both sides at the same time.
▫
Press CTRL + A to select all visible options symbols at once.
Customizing Documents, Pop-up Windows and Panes
127
TeleTrader Software GmbH
Marc-Aurel-Straße 10-12, 1010 Vienna, Austria
E-Mail [email protected]
Internet http://professional.teletrader.com
▫
After selecting one or more option symbols, you can perform actions on them by right-clicking the selection (for
example open a price page, copy the content to Excel etc.).
Note
You cannot select individual columns in the options matrix view.
If you double-click the middle column, the Options Matrix Properties dialog opens.
To show and hide the underlying view
▪
Right-click on the options matrix and choose Show Underlying or Hide Underlying.
Changing the Number of Decimal Places
You can change the number of decimal places that is used for both the underlying symbol and its options.
To change the number of decimal places for the options matrix
▪
Right-click the options matrix and choose Set decimal places.
▪
In the Set decimal places dialog, enter the number of decimal places that you want to use for both the
underlying symbol and the options.
Note
The custom decimal places set for the underlying symbol will be used for this symbol in all
documents (charts, time and sales, market depth, quick quote, price pages etc.). You can also
change this setting under Tools > Options > General > Subscription (see Subscription Settings
on page 339).
The decimal places set for the options symbols will only be used within options matrix documents.
Filtering Information in the Options Matrix
You can filter the options that are shown in the options matrix by expiration date and/or by strike price. Choose which
expiration dates and range of strike prices should be shown in the document.
To filter by expiration date
▪
Right-click on the options matrix document and select Properties.
▪
In the Options Matrix Properties dialog, click Options Matrix.
▪
Under Show expiration dates, select all expiration dates that should be visible in the document. Clear all check
boxes for the expiration dates that should not be visible.
To filter by strike price
▪
Select Show strike prices between...
▪
Enter the lower and upper limits of the strike price range that you want to see in the options matrix document.
To filter by distance to market price
▪
Select Show Near-the-Money options at a distance of x % to the market price.
▪
Enter the maximum distance between the market price and the strike price (in percent). Option contracts with a
strike price that has a wider distance to the market price than set here will be invisible.
To filter by trading activity
▪
Select Hide options that are not actively traded.
▪
All option contracts that have never been traded will be invisible.
Customizing Documents, Pop-up Windows and Panes
128
TeleTrader Software GmbH
Marc-Aurel-Straße 10-12, 1010 Vienna, Austria
E-Mail [email protected]
Internet http://professional.teletrader.com
Note
Options will be filtered only when reloading the options matrix document (for example, when
opening a workspace).
Showing Greeks and the Put/Call Ratio
You can show both the so-called "Greeks" and the Put/Call Ratio in the options matrix document:
▫
The Greeks (Theoretical Value, Delta, Gamma, Vega, Theta, Rho) for the highlighted options contracts are
shown in a separate Greeks view
▫
The current Put/Call Ratio of all options or the filtered Put/Call Ratio for only the visible options is shown as an
additional column in the underlying view
To show and hide the Greeks view
▪
Right-click on the options matrix and choose Show Greeks or Hide Greeks.
To change the option pricing model
You can choose the option pricing model that is used for calculating the greeks, and adapt the option model's input
values volatility and interest rate. See Customizing the Greeks View on page 130.
To add and remove the Put/Call Ratio columns
▪
Right-click in the options matrix and select Properties.
▪
On the left side of the dialog, select Underlying.
▪
On the right side of the dialog, look for the columns PutCallRatio and FilteredPutCallRatio and add or remove
them like you would in a price page (see Adding and Removing Columns on page 80).
Customizing the Underlying View
The underlying view displays information about the underlying symbol of the options matrix – for example, a stock,
index or future. It can be customized in the same way as a price page or watch list: You can insert and rearrange
columns, change the update style of a column and customize font, colors and grid lines in the Options Matrix
Properties dialog.
To add columns to and remove them from the underlying view
▪
Right-click in the underlying view and select Properties.
▪
On the left side of the dialog, select Underlying.
▪
On the right side of the dialog, add and remove columns like you would in a price page.
For detailed instructions, see Adding and Removing Columns on page 80.
To rearrange and resize the columns of the underlying view
▪
Right-click in the underlying view and select Properties.
▪
On the left side of the dialog, select Underlying.
▪
On the right side of the dialog, move columns up and down like you would in a price page.
For detailed instructions, see Rearranging and Resizing Rows and Columns on page 81.
To change the update style for the columns of the underlying view
▪
Right-click in the underlying view and select Properties.
▪
On the left side of the dialog, select Underlying > Update.
Customizing Documents, Pop-up Windows and Panes
129
TeleTrader Software GmbH
Marc-Aurel-Straße 10-12, 1010 Vienna, Austria
E-Mail [email protected]
Internet http://professional.teletrader.com
▪
On the right side of the dialog, change the update styles like you would in a price page.
For detailed instructions, see Changing the Update Style of a Column on page 83.
To change the grid style of the underlying view
▪
Right-click in the underlying view and select Properties.
▪
On the left side of the dialog, select Underlying > Grid.
▪
On the right side of the dialog, change the grid style like you would in a price page.
For detailed instructions, see Changing the Grid Style on page 84.
To change font and colors of the underlying view
▪
Right-click in the underlying view and select Properties.
▪
On the left side of the dialog, select Underlying > Font.
▪
On the right side of the dialog, change font and colors like you would in a watch list.
For detailed instructions, see Changing Font and Colors on page 133.
Customizing the Greeks View
The greeks view displays information about the so-called "Greeks" for the highlighted options contracts. You can
choose the option pricing model that is used for calculating the greeks, and adapt the option model's input values
volatility and interest rate. You can also customize font, colors and grid lines in the Options Matrix Properties dialog.
To change the option pricing model's input values (Volatility / Interest Rate)
▪
Right-click in the greeks view and select Properties.
▪
On the left side of the dialog, select Greeks.
▪
On the right side of the dialog, check Use custom values.
▪
Enter your custom values for Volatility and Interest rate.
▪
You can also change the default values for the number of Days per year that are used in calculations, and for
the number of Tree Steps that are used in the Binomial options pricing model.
Note
The default value for volatility is determined by the field Volatility1Y of the underlying symbol.
The default value for the interest rate can be set under Tools > Options > General (see General
Settings on page 339).
To change the option pricing model for calculating the greeks
▪
Right-click in the greeks view and select Properties.
▪
On the left side of the dialog, select Greeks.
▪
On the right side of the dialog, choose the option pricing model that should be used to calculate the greeks:
Black Scholes
This option pricing model is based on the Black-Scholes equation by
Fischer Black and Myron Scholes (1973). When using this model, all
option contracts are treated as if they could only be exercised on expiration
in calculations ("European options").
Binomial (Cox-Ross-Rubinstein)
This option pricing model was developed by John Cox, Stephen Ross and
Mark Rubinstein. It models the dynamics of the option's theoretical value
for discrete time intervals over the option's life and takes into account the
differences between American and European options.
Customizing Documents, Pop-up Windows and Panes
130
TeleTrader Software GmbH
Marc-Aurel-Straße 10-12, 1010 Vienna, Austria
E-Mail [email protected]
Internet http://professional.teletrader.com
To change the grid style of the greeks view
▪
Right-click in the greeks view and select Properties.
▪
On the left side of the dialog, select Greeks > Grid.
▪
On the right side of the dialog, change the grid style like you would in a price page.
For detailed instructions, see Changing the Grid Style on page 84.
To change font and colors of the greeks view
▪
Right-click in the greeks view and select Properties.
▪
On the left side of the dialog, select Greeks > Font.
▪
On the right side of the dialog, change font and colors like you would in a watch list.
For detailed instructions, see Changing Font and Colors on page 133.
Customizing the Options Matrix View
The options matrix view displays all options for an underlying, grouped by expiration date or strike price (see
Showing, Hiding and Changing Views on page 127). You can expand / collapse groups by double-clicking on their
header. Call options are shown on the left side, and Put options on the right side. The options matrix view can be
customized in the same way as a price page or watch list: You can insert and rearrange columns, change the update
style of a column and customize font, colors and grid lines in the Options Matrix Properties dialog.
To add columns to and remove them from the options matrix view
▪
Right-click in the options matrix view and select Properties.
▪
On the left side of the dialog, select Options Matrix > Columns.
▪
On the right side of the dialog, add and remove columns like you would in a price page. The columns are
added/removed on both sides (Calls and Puts) of the options matrix.
For detailed instructions, see Adding and Removing Columns on page 80.
To rearrange and resize the columns of the options matrix view
▪
Right-click in the options matrix view and select Properties.
▪
On the left side of the dialog, select Options Matrix > Columns.
▪
On the right side of the dialog, move columns up and down like you would in a price page. The columns are
rearranged on both sides (Calls and Puts) of the options matrix.
For detailed instructions, see Rearranging and Resizing Rows and Columns on page 81.
To change the column layout of the options matrix view
▪
Right-click in the options matrix view and select Properties.
▪
On the left side of the dialog, select Options Matrix.
▪
On the right side of the dialog, select Same layout on both sides to show the same column order on both the
Calls and the Puts side, or select Mirrored layout to show the reverse column order on the Puts side.
To change the update style for the columns of the options matrix view
▪
Right-click in the options matrix view and select Properties.
▪
On the left side of the dialog, select Options Matrix > Update.
▪
On the right side of the dialog, change the update styles like you would in a price page.
Customizing Documents, Pop-up Windows and Panes
131
TeleTrader Software GmbH
Marc-Aurel-Straße 10-12, 1010 Vienna, Austria
E-Mail [email protected]
Internet http://professional.teletrader.com
For detailed instructions, see Changing the Update Style of a Column on page 83.
To change the grid style of the options matrix view
▪
Right-click in the options matrix view and select Properties.
▪
On the left side of the dialog, select Options Matrix > Grid.
▪
On the right side of the dialog, change the grid style like you would in a price page.
For detailed instructions, see Changing the Grid Style on page 84.
To change font and colors of the options matrix view
▪
Right-click in the options matrix view and select Properties.
▪
On the left side of the dialog, select Options Matrix > Font.
▪
On the right side of the dialog, change font and colors like you would in a watch list.
For detailed instructions, see Changing Font and Colors on page 133.
To change font and colors of the group headers
▪
Right-click in the options matrix view and select Properties.
▪
On the left side of the dialog, select Options Matrix > Header.
▪
On the right side of the dialog, change the Foreground and Background colors. These colors also apply to the
strike / expiration date column in the middle of the options matrix.
To expand and collapse groups
▪
Double-click on a group header to expand or collapse a group.
▪
Press and hold the CTRL key while double-clicking on a group header to expand a group and at the same time
collapse all other groups (switching between groups).
Customizing Watch Lists
Watch list documents are very similar to price pages. Therefore, you can customize the same settings as in a price
page in the Watch List Properties dialog. You can also sort the rows of a watch list, freeze the leftmost columns,
select several rows or columns at once and link documents to a watch list. For more information, see Watch List on
page 58.
Additionally, you can enter data for your portfolio in the watch list columns on the right.
To add columns to and remove them from the watch list
See Adding and Removing Columns on page 80.
To rearrange and resize the columns of the watch list
See Rearranging and Resizing Rows and Columns on page 81.
To change the update style for the columns of the watch list
See Changing the Update Style of a Column on page 83.
To change the grid style of the watch list
See Changing the Grid Style on page 84.
Customizing Documents, Pop-up Windows and Panes
132
TeleTrader Software GmbH
Marc-Aurel-Straße 10-12, 1010 Vienna, Austria
E-Mail [email protected]
Internet http://professional.teletrader.com
To sort the rows of a watch list
See Sorting the Contents of a Price Page on page 88
Note
There is no automatic sorting for watch lists.
To freeze and unfreeze columns on a watch list
See Freezing a Column on page 89
To select rows and columns from a watch list
See Selecting Rows or Columns of a Price Page on page 89
To link documents to a watch list
See Linking Documents to a Price Page on page 89
Note
There is no row highlight mode in watch lists.
Changing Font and Colors
You can change the font of the watch list texts, the color of the text and the background color of the watch list on the
Font property sheet of the Watch List Properties dialog.
To change font and colors of a watch list
▪
Right-click in the watch list and select Properties.
▪
On the left side of the dialog, select Font.
▪
On the right side of the dialog, adapt the default settings to your needs.
▪
You can see a preview for your settings in the Sample window at the bottom of the dialog.
Control
Description
Customizing Documents, Pop-up Windows and Panes
133
TeleTrader Software GmbH
Marc-Aurel-Straße 10-12, 1010 Vienna, Austria
E-Mail [email protected]
Internet http://professional.teletrader.com
Font
Type of font used for watch list texts
Font Size
Size of the font used for watch list texts
Bold
Check to apply a bold font to all watch list texts
Italic
Check to apply an italic font to all watch list texts
Foreground
Color of the watch list text
Background
Background color of the watch list
Entering Amounts, Buy Dates and Prices in a Watch List
To use the portfolio functionalities of a watch list, you have to enter the purchase data for each security in your
portfolio into the following four columns:
Column
Description
Amount
Quantity of the security you bought (for example 100 shares)
Buy Date
Date when you bought the security
Buy Price
Price that you paid for the security
Multiplier
Multiplier for Forex adjustments or derivative contracts
Based on the current quotes, the following values are calculated for you and are automatically updated whenever new
prices arrive:
Column
Description
Total P/L
Profit or loss for all shares (based on the Amount that you entered)
P/L
Profit or loss for one share
P/L Perc
Profit or loss in percent
Asset Value
Current value of your assets
To enter purchase data for a security (Amount, Buy Price, Multiplier)
▪
In the row of the security, double-click on the column Amount, Buy Price or Multiplier.
Note
▪
You can also right-click on the column and choose Edit.
Enter the data and press the ENTER key.
To enter purchase data for a security (Buy Date)
▪
In the row of the security, double-click on the column Buy Date.
Note
You can also right-click on the column and choose Edit.
Customizing Documents, Pop-up Windows and Panes
134
TeleTrader Software GmbH
Marc-Aurel-Straße 10-12, 1010 Vienna, Austria
E-Mail [email protected]
Internet http://professional.teletrader.com
▪
Click on the arrow next to the date and choose a date from the calendar.
Customizing Web Watch
Web watch windows do not have a properties dialog. You can, however, manage the links that you have visited while
the browser window was open, navigate between visited web pages, and use other basic functions of a web browser.
For more information, see Web Watch on page 62.
Managing Visited Links
While your web watch browser window is open, all links that you visit are automatically stored in its WWW history.
You can navigate directly to an already visited link, remove a link from the list, or add links to the history without
loading them.
When you close a web watch window, its WWW history of visited links is lost. If you want to keep this list to use it
again later with a new window, you can save your web watch window as a template. When you later open a new web
watch window with the saved template, the history is restored automatically.
To manage visited links
▪
Click the Manage Visited Links icon on the navigation bar:
▪
To browse to a link, select the link in WWW History list and click Navigate To.
▪
To remove a link from the history, select the link and click Remove Link.
▪
To add a link to the history, enter the URL into the field at the bottom and click Add Link.
Customizing Documents, Pop-up Windows and Panes
135
TeleTrader Software GmbH
Marc-Aurel-Straße 10-12, 1010 Vienna, Austria
E-Mail [email protected]
Internet http://professional.teletrader.com
To save the history of visited links as a template
▪
On the File menu, click Save as Document Template.
▪
In the Save As dialog, enter a name for the template in the File name field.
▪
Click Save.
Note
For more information about templates, see Saving your Preferences in Templates on page 145.
Navigating Between Web Pages
The web watch window works like a usual web browser. You can navigate to specific pages by typing their address,
jump back to the previously displayed page, reload a page and search inside the text of a page.
To navigate with the web watch navigation bar
▪
Click on the appropriate icon to navigate between web pages.
Back
Jumps back to a previously visited page.
Forward
Jumps forward to a previously visited page.
Stop
Stops loading the current page.
Refresh
Reloads the current page.
Find on this page
Searches for text on the current page.
Search on Internet
Jumps to an Internet search engine.
Manage Visited
Links
Displays the Visited Links dialog.
Navigate
Navigates to the address (URL) entered in the address field on the right.
Customizing Quick Quote
For the quick quote document, you can customize the following settings in the Quick Quote Properties dialog:
Property Sheet
Description
Fields
Add, remove and rearrange the fields of a quick quote document
Update
Assign an update style to specific fields of a quick quote document
Font
Change the font of a quick quote document and its foreground and background color
For more information, see Quick Quote on page 63.
Changing the Fields, Update Style, Font and Colors of Quick Quote
Each quick quote document displays a set of data fields for each symbol, depending on the symbol type (Stock,
Index, Future...). You can change the fields that are shown in the quick quote document, the update style of a field
(the visual effect that is displayed when prices change) and adapt the font and colors used. This is done in the same
way as in a price page or watch list.
When you change the symbol in a quick quote document, an appropriate template for the new symbol type is applied
automatically (see Quick Quote Settings on page 346).
Customizing Documents, Pop-up Windows and Panes
136
TeleTrader Software GmbH
Marc-Aurel-Straße 10-12, 1010 Vienna, Austria
E-Mail [email protected]
Internet http://professional.teletrader.com
To add fields to or remove them from a quick quote document
▪
Right-click in the Quick Quote window and select Properties.
▪
On the left side of the dialog, select Fields.
▪
On the right side of the dialog, add and remove fields like you would in a price page.
For detailed instructions, see Adding and Removing Columns on page 80.
To change the update style for the fields of a quick quote document
▪
Right-click in the Quick Quote window and select Properties.
▪
On the left side of the dialog, select Update.
▪
On the right side of the dialog, change the update styles like you would in a price page.
For detailed instructions, see Changing the Update Style of a Column on page 83.
To change font and colors for a quick quote document
▪
Right-click in the Quick Quote window and select Properties.
▪
On the left side of the dialog, select Font.
▪
On the right side of the dialog, change font and colors like you would in a watch list.
For detailed instructions, see Changing Font and Colors on page 133.
Displaying Market Depth in a Quick Quote document
A quick quote document can displayed first five levels of a market depth.
To show market depth in a a quick quote document
▪
Right-click in the Quick Quote window and select Show Market Depth View.
Note
When the Market Depth is visible in a Quick Quote window, the available command will be Hide
Market Depth View.
Customizing the Ticker Pane
For the Ticker pane, you can customize the following settings in the Properties dialog:
Property Sheet
Description
General
Change the data displayed in the ticker and its scrolling speed
Font
Change the font of the ticker pane and the colors used for its different elements
Filter
Set a volume or change filter for the ticker
You can also change the direction in which the ticker scrolls.
Note
Like all other panes, the Ticker pane can be undocked and moved on the screen. See Undocking,
Moving and Hiding Panes on page 144.
For more information, see Ticker on page 63.
Customizing Documents, Pop-up Windows and Panes
137
TeleTrader Software GmbH
Marc-Aurel-Straße 10-12, 1010 Vienna, Austria
E-Mail [email protected]
Internet http://professional.teletrader.com
Changing the Data Displayed in the Ticker
You can change the data that is displayed for each symbol in the ticker pane on the General property sheet of the
Properties dialog.
To change the data displayed for each symbol in the ticker
▪
Right-click in the ticker pane and select Properties.
▪
On the left side of the dialog, select General.
▪
On the right side of the dialog, select the data that you want to display for each symbol.
▪
Last Price
Price of the last trade for this symbol
Volume
Volume of the last trade for this symbol
Net Change
Difference between the current trade price and the closing price of the last trading session for
this symbol
Choose if you want to display the data in One line or in Two lines.
One line ticker
Two lines ticker
Changing Speed and Direction of the Ticker
The ticker scrolls in one direction at a constant speed. You can change both the speed at which it scrolls and its
direction.
To change the speed of the ticker
▪
Right-click in the ticker pane and select Properties.
▪
On the left side of the dialog, select General.
▪
On the right side of the dialog, drag the Constant speed control to the right to increase the speed, or to the left
to decrease the speed.
Note
If you want the ticker to move only when new ticks arrive for a symbol, clear the Constant speed
checkbox.
To change the direction of the ticker
▪
Place the mouse pointer on the ticker pane. The mouse pointer changes:
▪
Hold the mouse button down and move the mouse in the direction that you want the ticker to scroll.
Customizing Documents, Pop-up Windows and Panes
138
TeleTrader Software GmbH
Marc-Aurel-Straße 10-12, 1010 Vienna, Austria
E-Mail [email protected]
Internet http://professional.teletrader.com
Changing Font and Colors of the Ticker
You can change the font of the ticker pane, its background color and the colors of its elements (symbol ticker, last
price, volume and net change). You can set different colors for rising and falling prices.
To change the font and colors of the ticker pane
▪
Right-click in the ticker pane and select Properties.
▪
On the left side of the dialog, select Font.
▪
On the right side of the dialog, adapt the default settings to your needs.
▪
You can see a preview for your settings in the Sample window at the bottom of the dialog.
Control
Description
Font
Type of font used for all text in the ticker pane
Bold
Check to apply a bold font to all text
Italic
Check to apply an italic font to all text
Fixed font point size
Check to enter a fixed font size between 4 and 12 point
Uncheck to automatically use a font size in proportion to the size of the ticker pane
Rising Price
Color of the last price data when the price is rising
Falling Price
Color of the last price data when the price is falling
Net Change
Color of the net change data
Volume
Color of the volume data
Background
Background color of the ticker pane
Symbol
Color of the symbol's ticker
Filtering Information in the Ticker
You can filter the information that is shown in the ticker pane by the price change or the volume of the last trade.
When you are filtering by price change, new ticks are only shown in the ticker when the change in price compared to
Customizing Documents, Pop-up Windows and Panes
139
TeleTrader Software GmbH
Marc-Aurel-Straße 10-12, 1010 Vienna, Austria
E-Mail [email protected]
Internet http://professional.teletrader.com
the previous trade satisfies the conditions set here. For example, you could show only ticks that change the price by
more than 0,02. When you are filtering by volume, ticks are only shown when their volume satisfies the conditions.
For example, you could show only ticks that exceed a certain volume.
To filter the information shown in the ticker pane
▪
Right-click in the ticker pane and select Properties.
▪
On the left side of the dialog, select Filter.
▪
On the right side of the dialog, select the appropriate filtering option.
Tick Volume
Volume of the last trade
Tick Change
Difference between the current trade price and the previous trade price
▪
Choose your condition, and enter the price change or volume.
=
Only ticks that have a price change or volume equal to the value that is set here are shown in
the ticker
<
Only ticks that have a price change or volume smaller than the value that is set here are shown
in the ticker
>
Only ticks that have a price change or volume greater than the value that is set here are shown
in the ticker
<=
Only ticks that have a price change or volume equal to or smaller than the value that is set here
are shown in the ticker
>=
Only ticks that have a price change or volume equal to or greater than the value that is set here
are shown in the ticker
Customizing the Navigation Pane
The Navigation pane consists of three tabs: QuickBar, DataBar and FastLook. For each tab, you can customize the
font and colors that are used. For FastLook, you can additionally change how symbols stored there are displayed in
the list.
Each tab has its own properties dialog, but there is also a properties dialog for the whole Navigation pane. There, the
dialogs of the QuickBar and FastLook tabs are shown in tree view. This makes it easier for you to do several changes
at once.
You can also change the docking behavior of the complete navigation pane, move it on the screen and automatically
hide the pane to only show it when it is needed.
To access the Navigation pane properties dialog
▪
On the Format menu, choose Navigation Pane.
▪
On the left side of the dialog, choose the tab that you want to customize.
Customizing Documents, Pop-up Windows and Panes
140
TeleTrader Software GmbH
Marc-Aurel-Straße 10-12, 1010 Vienna, Austria
E-Mail [email protected]
Internet http://professional.teletrader.com
▪
On the right side of the dialog, adapt the default settings to your needs.
Customizing the QuickBar
You can change the font and colors that are used to display the QuickBar, but you cannot change the contents of the
QuickBar.
To change the properties of the QuickBar
▪
Right-click the QuickBar and select Properties.
▪
In the QuickBar properties dialog, adapt the default settings to your needs.
▪
You can see a preview for your settings in the Sample window at the bottom of the dialog.
Control
Description
Font
Type of font used for the captions of the QuickBar icons
Font Size
Size of the font used for the captions of the QuickBar icons
Customizing Documents, Pop-up Windows and Panes
141
TeleTrader Software GmbH
Marc-Aurel-Straße 10-12, 1010 Vienna, Austria
E-Mail [email protected]
Internet http://professional.teletrader.com
Foreground
Color of the captions of the QuickBar icons
Background
Background color of the QuickBar
Bold
Check to apply a bold font to the captions
Italic
Check to apply an italic font to the captions
Customizing FastLook
You can change the font and colors used in FastLook and how symbols stored there are displayed in the list.
To change the font and colors of FastLook
▪
Right-click FastLook and select Properties.
▪
On the left side of the dialog, choose Display.
▪
On the right side of the dialog, adapt the default settings to your needs.
▪
You can see a preview for your settings in the Sample window at the bottom of the dialog.
Control
Description
Font
Type of font used in FastLook
Font Size
Size of the font used in FastLook
Foreground
Color of the font used in FastLook
Background
Background color of FastLook
Bold
Check to apply a bold font to the text
Italic
Check to apply an italic font to the text
To change the highlight colors for selected symbols
▪
Right-click FastLook and select Properties.
▪
On the left side of the dialog, choose Display > Selection.
Customizing Documents, Pop-up Windows and Panes
142
TeleTrader Software GmbH
Marc-Aurel-Straße 10-12, 1010 Vienna, Austria
E-Mail [email protected]
Internet http://professional.teletrader.com
▪
On the right side of the dialog, choose a Foreground Color for the text of a selected symbol, and a Background
Color for the background of a selected symbol.
To change the symbol display in FastLook
▪
Right-click FastLook and select Properties.
▪
On the left side of the dialog, choose Names.
▪
On the right side of the dialog, choose what should be displayed for each symbol.
▪
Ticker
Show the ticker of the symbol
Name
Show the name of the symbol
Select Exchange when you want to display the name of the exchange after the ticker or name of a symbol.
Customizing the DataBar
You can change the font and colors that are used to display the DataBar.
To change the properties of the DataBar
▪
Right-click the DataBar and select Properties.
▪
In the Chart DataBar Properties dialog, adapt the default settings to your needs.
Customizing Documents, Pop-up Windows and Panes
143
TeleTrader Software GmbH
Marc-Aurel-Straße 10-12, 1010 Vienna, Austria
E-Mail [email protected]
Internet http://professional.teletrader.com
▪
You can see a preview for your settings in the Sample window at the bottom of the dialog.
Control
Description
Font
Type of font used in the DataBar
Font Size
Size of the font used in the DataBar
Foreground
Color of the font used in the DataBar
Background
Background color of the DataBar
Bold
Check to apply a bold font to the text
Italic
Check to apply an italic font to the text
Undocking, Moving and Hiding Panes
The navigation pane is usually docked at the left side of the Professional main window. You can however undock it,
move it to any position on the screen, or dock it at the other side of the main window. In order to dock the navigation
pane, its Dockable status must be active (it is activated by default).
You can also hide the navigation pane completely, or hide it temporarily and only show it when needed (auto-hide).
Note
The following information also applies to the Ticker pane and the Information pane. Exception: The
Ticker pane cannot be hidden automatically.
To change the Dockable status of the navigation pane
▪
Right-click on the title bar or on the lines at the top of the navigation pane and choose Dockable:
▪
When the Dockable status is activated, you can dock the navigation pane by moving it to the right or left borders
of the Professional main window. When the Dockable status is deactivated, the navigation pane behaves like
any detached window and can be positioned freely on the screen. See Arranging Document Windows on the
Screen on page 162.
Customizing Documents, Pop-up Windows and Panes
144
TeleTrader Software GmbH
Marc-Aurel-Straße 10-12, 1010 Vienna, Austria
E-Mail [email protected]
Internet http://professional.teletrader.com
To undock and move the navigation pane
Note
You can move the navigation pane both when it is docked or undocked.
▪
Click on the title bar or on the lines at the top of the navigation pane and hold the mouse button down.
▪
Drag the navigation pane window to the desired position on the screen.
▪
When the navigation pane is dockable, you can dock the navigation pane again by moving it to the right or left
borders of the Professional main window. To prevent docking, press the CTRL key while moving the pane.
To hide the navigation pane
▪
Right-click on the title bar or on the lines at the top of the navigation pane and choose Hide.
Note
To display the navigation pane again, choose View > Navigation Pane on the menu.
To automatically hide the navigation pane when it is not used
▪
Right-click on the lines at the top of the navigation pane when it is docked and choose Auto hide.
▪
The navigation pane will be hidden at the right or left border of the Professional main window. A vertical tab is
shown instead: Move the mouse pointer over this tab to temporarily display the pane.
Note
You cannot completely hide, move or undock the pane as long as it is automatically hidden. To
deactivate auto-hide, move the mouse pointer over the tab to display the pane, right-click on its title
bar and choose Auto hide again.
Saving your Preferences in Templates
When you change the properties of a document, for example its colors or the columns that are displayed, you might
want to use these exact settings again for other documents. You might even want to use these settings automatically
anytime you open a new document of this type.
To do so, you need to save your document settings as a template (see below). You then can apply this template to
any new document that you open (and, in the case of price pages and watch lists, also to existing documents). You
can also use this template as the default template for all new documents.
To save a document as a template
▪
Adapt the document to your needs.
Customizing Documents, Pop-up Windows and Panes
145
TeleTrader Software GmbH
Marc-Aurel-Straße 10-12, 1010 Vienna, Austria
E-Mail [email protected]
Internet http://professional.teletrader.com
▪
On the File menu, click Save as Document Template.
Note
You can also click on the Save as Template icon in the Main toolbar:
▪
In the Save As dialog, enter a name for the template in the File name field.
▪
Click Save.
What information is saved in a template?
The information that is saved in a template depends on the document type. Generally speaking, all settings that you
can change in the properties dialog of a document are also saved in a template. For some document types, the
following additional settings are saved:
Document Type
Additional Saved Settings
Price Page
Number of sheet tabs – see Adding and Organizing Sheets on page 87
Chart
Chart type, data compression, inserted studies and panes, number of sheet tabs – see
Charting on page 173
News
Displayed columns and view (headlines and/or stories) – see Showing and Hiding News
Headlines and Stories on page 106
Market Depth
Displayed views – see Showing and Hiding Views on page 111
Options Matrix
Displayed views – see Showing, Hiding and Changing Views on page 127
Web Watch
Visited Links – see Managing Visited Links on page 135
Applying Templates to Documents
When you open a new document, you can usually choose which template you want to use (if you don’t choose a
specific template, the default template is used – for changing the default template, see Organizing Templates on page
147). Additionally, for some types of documents you can also change the template that is used even if the documents
are already displayed on the screen.
To apply a different template to a price page, watch list or quick quote document
▪
Right-click anywhere in the document and select Apply Template.
Customizing Documents, Pop-up Windows and Panes
146
TeleTrader Software GmbH
Marc-Aurel-Straße 10-12, 1010 Vienna, Austria
E-Mail [email protected]
Internet http://professional.teletrader.com
▪
In the Templates dialog, select the new template from the pane on the left side. You can see a preview of the
template in the Preview pane on the right side.
▪
Click OK.
Note
When the applied template contains less sheet tabs than the original document, the symbols of the
removed sheets will be moved to the first sheet.
To use a template when opening a symbol in a new document
See Opening Symbols in New Documents on page 64
To use a template when opening symbols for existing documents
See Opening Symbols from Existing Documents on page 66
Note
Choose this procedure if you want to open a chart, market depth, options matrix or news document
with a different template, but containing the same symbol. Just open a chart document with a
different template from the chart document that is displayed on the screen, for example.
Organizing Templates
Apart from creating new templates (see Saving your Preferences in Templates on page 145), you can also organize
the existing templates. You can change the name of a template, specify which template is used by default and define
your favorite templates.
Customizing Documents, Pop-up Windows and Panes
147
TeleTrader Software GmbH
Marc-Aurel-Straße 10-12, 1010 Vienna, Austria
E-Mail [email protected]
Internet http://professional.teletrader.com
When you want to change the formatting of an existing template, you have to apply it to a document first, adapt it, and
save it again under its former name, overwriting the old template.
To rename a template
▪
On the File menu, click New Document.
▪
In the New Document dialog, choose the document type of the template by clicking on the corresponding tab.
▪
In the Template pane on the left side, right-click on the template and choose Rename.
▪
Enter the new name for the template and press the ENTER key.
▪
Click Cancel to close the dialog without creating a new document.
Note
It is strongly recommended not to rename the preconfigured templates, because these are used
when opening documents from the QuickBar.
To set a default template
▪
In a price page, chart, market depth, time and sales, options matrix, quick quote or watch list document, rightclick on a symbol and choose Open.
▪
Right-click the document type of the template (or move the mouse pointer to the document type and wait for a
moment) – an additional menu will appear to the right.
Customizing Documents, Pop-up Windows and Panes
148
TeleTrader Software GmbH
Marc-Aurel-Straße 10-12, 1010 Vienna, Austria
E-Mail [email protected]
Internet http://professional.teletrader.com
▪
Right-click the template – another additional menu appears.
▪
Click Set As Default.
Note
The default template is shown with a red label in the New Document dialog. It is used whenever
you open a new document with the default template, for example when you open a symbol by
double-clicking on it – see Opening Symbols from Existing Documents on page 66.
The only exception are price pages that are opened from the QuickBar: They use an internal
template.
To set a default template for quick quote
For quick quote documents, you can define different default templates for each symbol type (see also Quick Quote
Settings on page 346). Therefore, when setting the default template for quick quote, you can choose whether this
template should be used for just one symbol type, or for all symbol types.
▪
Right-click on a symbol and choose Open.
▪
Right-click Quick Quote – an additional menu will appear to the right.
▪
Right-click the template – another additional menu appears.
▪
Click Set as default for all symbol types to use this template as default for all types of symbols, or click Set as
default for this symbol type only to use this template only for symbols of the same type as the current symbol
(for example, if your current symbol is a stock, the template will only be used for stocks).
To define a favorite template
▪
In a price page, chart, market depth, time and sales, options matrix, quick quote or watch list document, rightclick on a symbol and choose Open.
▪
Right-click the document type that you want to use as a favorite (or move the mouse pointer to the document
type and wait for a moment) – an additional menu will appear to the right.
▪
Right-click the template – another additional menu appears.
▪
Click Add to favorites.
▪
The template is now added to your favorites, which are shown in a separate section beneath the list of document
types when right-clicking a symbol.
Note
To remove a template from your favorite list, follow the steps above but click Remove from
favorites instead.
To change an existing template
▪
Apply the template to a document: See Applying Templates to Documents on page 146
▪
Adapt the document to your needs.
▪
On the File menu, click Save as Document Template.
▪
In the Save As dialog, select the template that you want to change.
▪
Click Save.
▪
In the message box, click Yes to overwrite the existing template.
Customizing Documents, Pop-up Windows and Panes
149
TeleTrader Software GmbH
Marc-Aurel-Straße 10-12, 1010 Vienna, Austria
E-Mail [email protected]
Internet http://professional.teletrader.com
Organizing and Saving Documents
Documents are windows that are shown inside the Professional main window. Most documents show quote data (like
price pages or charts), but some documents also show other data, like news documents and web watch documents.
You have several options to customize the content of your documents (see Customizing Documents, Pop-up
Windows and Panes on page 78), but you can also adapt the document windows themselves, for example by
automatically choosing the appropriate size for them, arranging them on the screen or copying them.
If you display many document windows, your screen may become too crowded. You can then organize those
windows into so-called virtual pages. Virtual pages are collections of documents. Each virtual page takes up one
computer screen, which means that you cannot display multiple virtual pages at once. Much like the pages of a book,
you can only switch between virtual pages, display them one after each other or directly jump to a specific virtual
page. TeleTrader Professional also offers a set of prepared virtual pages, with market overviews, up-to-date index
lists and similar content.
A collection of virtual pages is called a workspace. You can have up to twenty virtual pages in each workspace; the
smallest possible workspace consists of a single virtual page. A workspace can also contain additional Professional
main windows and free floating windows that are needed for multi-monitor systems.
When you want to save your work, we recommend to always save documents inside a workspace. This way, you can
save (and later open) several documents at once, and also save their size, settings and relative position on the
screen. If you save single documents, only their individual settings and symbols are saved. Especially if you use
linked documents, you have to save them in a workspace to be able to use them again in the same constellation.
Only one workspace can be open at the same time. When you want to have access to a list of symbols that you need
across workspaces, independent of the workspace that is open at the moment, you should store them inside
FastLook. FastLook is part of the Navigation pane and, similar to the QuickBar, contains lists of symbols that are
grouped into folders and can be opened in documents at any time. The difference is that the symbols in FastLook are
added and managed by yourself, whereas the QuickBar is maintained by TeleTrader and cannot be changed by you.
Workspaces
A TeleTrader Professional workspace is a collection of several documents, that can also be organized into up to
twenty virtual pages. It is an easy way to save and open your documents. All properties of the document windows are
saved, including their window size and position on the screen. If you work with multiple monitors, the workspace also
remembers on which monitor it was displayed last and will automatically switch to this monitor.
We recommend to always save your documents inside a workspace.
Creating and Saving Workspaces
When you start TeleTrader Professional, the program automatically opens a workspace. If you have selected the
option Reopen last workspace in the login dialog, it will open the last workspace that you have worked with. If you
did not select this option, Professional creates a new, empty workspace when you start the program. You can of
course also create a new workspace yourself and save it on your hard disk.
To create a new workspace
Note
If another workspace is already open when you use this command, it will be closed before the new
workspace is created. If there are unsaved changes to this workspace, you will be asked if you
want to save the changes.
▪
On the File menu, click New Workspace.
▪
A blank workspace is created. You can now add documents and virtual pages to it: See Creating and Saving
Documents on page 159 and Copying and Moving Content Between Virtual Pages on page 156.
Organizing and Saving Documents
150
TeleTrader Software GmbH
Marc-Aurel-Straße 10-12, 1010 Vienna, Austria
E-Mail [email protected]
Internet http://professional.teletrader.com
To save a workspace
▪
On the File menu, click Save Workspace.
Note
▪
In the Save workspace as dialog, enter a name for the workspace in the File name field.
Note
▪
The Save workspace as dialog appears only when you are saving the workspace for the first time.
Choose the location where you want to save your workspace. Professional will suggest to save it into your
Documents folder. You can use a different location, but some shortcuts for opening workspaces might then not
work anymore.
Note
▪
You can also click on the Save Workspace icon in the Workspace toolbar:
If you want to store all your workspaces in a different place than suggested by Professional, you
can change the default path for Documents under Tools > Options > File Locations. See File
Locations Settings on page 349.
Click Save.
To save an existing workspace under a different name
▪
On the File menu, click Save Workspace As.
▪
In the Save workspace as dialog, enter a new name for the workspace in the File name field.
▪
Click Save.
Automatic backup of workspaces
Every time you save a workspace, a backup file is created automatically in the same folder as the original workspace.
The backup file will have the file name extension .bak (for example, MyWorkspace.bak) and contains the workspace
as it was before the changes that you saved last. You can recover the last version of the workspace from the backup
file. Only the last save is backed up – if you save your workspace again, a new backup file is created, and the version
before that is overwritten.
The backup can be useful if you have saved some changes by mistake: For example, you might have a workspace
with several charts, and decide to close one of the charts. You then save the workspace. Some minutes later, you
discover that you indeed still need the chart that you have just closed: You can now recover the last version of the
workspace from the backup file.
Note
If you have not saved your changes yet, you can always revert to the last saved version of your
workspace by simply not saving the changes. The following procedure applies only to changes that
have been saved by mistake.
To recover the last version of a workspace from the backup file
▪
In your file system (for example, Windows Explorer), go to the folder where you have saved your workspace. The
default location under Windows Vista is C:\Users\[user]\Documents.
▪
Find the backup file. It has the same name as your workspace, but a different file name extension, for example
MyWorkspace.bak.
▪
Rename the file to MyWorkspace_recovered.wks (or a similar name). Be sure to change the file name extension
to .wks.
Organizing and Saving Documents
151
TeleTrader Software GmbH
Marc-Aurel-Straße 10-12, 1010 Vienna, Austria
E-Mail [email protected]
Internet http://professional.teletrader.com
Note
▪
You might now see a message from your operating system that asks you if you are sure that you
want to change the file name extension, as the file may become unusable. Click Yes.
Double-click the renamed file. The last version of the workspace should now open in TeleTrader Professional.
Opening Saved Workspaces
When you have saved a workspace, you can later open it again in TeleTrader Professional. All the settings of the
workspace are restored, for example the number of open documents with their symbols, the layout of virtual pages,
the position of the document windows on the screen etc. You can only open one workspace at a time. Whenever you
open a workspace, the workspace that was previously open is automatically closed.
To open a saved workspace
Note
▪
On the File menu, click Open Workspace.
Note
▪
If another workspace is already open when you use this command, it will be closed before the
other workspace is opened. If there are unsaved changes to this workspace, you will be asked if
you want to save the changes.
You can also click on the Open Workspace icon in the Workspace toolbar:
In the Open dialog, select the workspace that you want to open.
Note
Professional will automatically suggest the location that is defined as the default path for
Documents. To change this setting, see File Locations Settings on page 349.
▪
Click Open. For large workspaces, a progress bar is shown while Professional is loading the workspace.
Alternatively, you can also:
▪
Click on the arrow next to the Open Workspace icon in the Workspace toolbar:
▪
All workspaces that are saved in the default location (see File Locations Settings on page 349) are displayed in a
list.
▪
Click on the workspace that you want to open.
Note
Additionally, the four workspaces that were opened last are shown at the bottom of the File menu
for quick access.
Closing Workspaces
When you close a workspace, a new empty workspace is created automatically at the same time. You can save the
changes that you have made to the workspace, or discard them. If you save the changes, a backup file containing the
last version of your workspace is created automatically: See Creating and Saving Workspaces on page 150.
Organizing and Saving Documents
152
TeleTrader Software GmbH
Marc-Aurel-Straße 10-12, 1010 Vienna, Austria
E-Mail [email protected]
Internet http://professional.teletrader.com
Warning
This action cannot be undone. When you close a workspace without saving it first, you cannot
open it again or get it back in another way. Be careful before you close a workspace without
saving. See also Creating and Saving Workspaces on page 150.
To close a workspace
▪
On the File menu, click Close Workspace.
Note
▪
If there are unsaved changes to this workspace, you might be asked if you want to save the changes. Click Yes
to save the changes, or No to discard them.
Note
▪
You can also click on the Close Workspace icon in the Workspace toolbar:
If you hold the CTRL key while clicking the Close Workspace icon, you will not close the
workspace, but delete all documents from the active virtual page instead. See Organizing Virtual
Pages on page 157.
You can also save the answer to this question. For example, if you always want to save all
changes, select the check box Don’t ask this question again and click Yes. Professional will then
automatically save all changes to every workspace when you close it. You can change this setting
later: See Default Responses Settings on page 346.
When the workspace is closed, a new empty workspace is created automatically.
Uploading Workspaces to TeleTrader Mobile
You can upload any saved Professional workspace to the TeleTrader server in order to use it with TeleTrader Mobile.
TeleTrader Mobile is an online financial portal for your mobile phone. It includes real-time quotes for the DAX index
and for major cross rates, delayed data of international stock markets, news and many features such as charts,
customizable price pages and text message notifications. Additional real-time services are available at a fee.
You can access TeleTrader Mobile by entering http://m.teletrader.com in the web browser of your mobile phone. Sign
up for a TeleTrader Mobile account in order to be able to save your settings and use uploaded Professional
workspaces.
Please note that not all features of TeleTrader Professional are available in TeleTrader Mobile.
To upload a workspace to TeleTrader Mobile
▪
Open the Professional workspace that you want to upload. See Opening Saved Workspaces on page 152.
▪
On the File menu, click Upload Workspace to TeleTrader Mobile.
▪
Enter your TeleTrader Mobile login data in the upload dialog. Check the Auto Upload option to update the
workspace automatically whenever changes are saved in TeleTrader Professional.
Organizing and Saving Documents
153
TeleTrader Software GmbH
Marc-Aurel-Straße 10-12, 1010 Vienna, Austria
E-Mail [email protected]
Internet http://professional.teletrader.com
Optimizing the Load Time of Workspaces
In some cases, long load times might occur when opening large workspaces in TeleTrader Professional. In the
following section you will find some tips and tricks to optimize the load time of your workspace.
Check the system requirements
Make sure that your computer meets the minimum requirements for running TeleTrader Professional. We recommend
additional memory (RAM) for workspaces with a high number of charts or large time series.
The current system requirements are available online at http://professional.teletrader.com.
Reduce the number of (chart) documents
The more documents your workspace contains, the longer its load time. In most cases, you can easily reduce the
number of open documents by linking them to a price page or watch list.
▪
Create a price page with all symbols that you want to display as a chart.
▪
Create a chart document for one of these symbols and link it to the price page.
▪
When you now choose a different symbol in the price page, it is automatically shown in the linked chart.
You can also link other documents (for example time and sales, market depth, news) to the same price page - with
one click you can so see the same symbol in all linked documents. See Linking Documents to a Price Page on page
89.
Reduce the number of sheets in charts
A large number of sheets in your charts enlarges the load time of your workspace. Check which of those sheets you
actually use regularly. If you have created similar sheets for several charts (for example with different time
compressions), consider creating one chart with the appropriate sheets and linking it to a price page.
You can also display more than one sheet in a chart at the same time: See Using Sheets in Charts on page 211.
Hibernate inactive charts
With the setting Hibernate inactive chart documents after x seconds under Tools > Options > General, you can
stop all unnecessary calculations for charts that are currently not visible (inactive sheets, other virtual pages) after a
certain number of seconds. Activating this settings can significantly improve the performance for workspaces that
contain a large number of charts. Of course, the hibernated chart documents will be updated as soon as they become
active (visible) again. Charts that contain intersection or study alerts will never be hibernated.
Move rarely used virtual pages out of the workspace
If your workspace contains virtual pages that you rarely use, consider saving them to disk and opening them only if
needed. See Opening and Saving Virtual Pages on page 157.
Close the windows that you don't need anymore
The command Window > More Pages shows an overview of all open windows and documents in your workspace.
Select all document windows that you don't need anymore and click Close Window(s).
Show less historical data in charts and time and sales documents
Professional needs more system resources if you load a lot of historical data in a chart or in time and sales. If you
don't need the long data history on a regular basis, stick to the default time region settings to get a better load time for
your workspace. Especially intraday charts or TickBar compressions enlarge the load time of a workspace
tremendously, when very long time series are used.
▫
Default setting for charts: 510 records
▫
Default setting for time and sales: 50 records
Organizing and Saving Documents
154
TeleTrader Software GmbH
Marc-Aurel-Straße 10-12, 1010 Vienna, Austria
E-Mail [email protected]
Internet http://professional.teletrader.com
See Changing the Amount of Data Displayed in the Chart on page 217 and Changing the Amount of Data Displayed
in Time and Sales on page 122.
Remove old drawing objects from your charts
Old drawing objects remain on your charts, but might not be relevant for your current analysis anymore. The
command Format > Objects shows a current overview about the symbols, drawing objects and studies that are
saved in a chart. Highlight the objects that you don't need anymore and click Delete to remove them.
Check your custom studies
You can create your own custom studies with the TeleTrader Language. If you think that some of your custom studies
might contribute to performance problems, you can find some tips here: Recommended Best Practices on page 478
Virtual Pages
A virtual page is a collection of documents that is displayed on the computer screen. If you have so many documents
that they would take up more place than is available on your screen, you can move some of those documents to
another virtual page. You can switch between the virtual pages with your keyboard or the mouse. Only one virtual
page can be shown on the screen at the same time.
Each workspace contains twenty virtual pages that can be filled with content. You can of course also leave some
virtual pages empty. A virtual page is completely independent of the other virtual pages in a workspace.
Virtual pages are automatically saved with the workspace they belong to. If you want to save a virtual page
independent of a workspace, you have to export it - you can later import it into any other workspace.
TeleTrader Professional also offers a set of prepared virtual pages, with market overviews, up-to-date index lists and
similar content. These pages can be easily added to your existing workspace.
Switching Between Virtual Pages
There are twenty virtual pages available to you. The first virtual page is shown on the screen by default. You can
switch to another virtual page, whether it is filled or not, or cycle trough all virtual pages that already have content.
To cycle through all virtual pages with content
Note
With each of these commands, you cycle through all filled virtual pages. Empty pages are skipped.
▫
On the Workspace toolbar, click the Virtual Page by Virtual Page icon to go to the next virtual page:
▫
Press F12 to go to the next virtual page, or SHIFT + F12 to go to the previous virtual page.
To switch to a virtual page
Note
▫
With each of these commands, you can switch to empty or filled virtual pages. Virtual pages with
content do have a star next to their name, or are shown as with a red number on the icon.
On the Workspace toolbar, click on the arrow next to the Virtual Page by Virtual Page icon and select the
virtual page.
Organizing and Saving Documents
155
TeleTrader Software GmbH
Marc-Aurel-Straße 10-12, 1010 Vienna, Austria
E-Mail [email protected]
Internet http://professional.teletrader.com
▫
On the Window menu, click Go to Virtual Page and select the virtual page.
▫
On the QuickBar, click on the Virtual Pages icon and select the virtual page.
▫
On the status bar, click on the name of the active virtual page and choose the virtual page in the pop-up.
▫
Hold the CTRL key and type the number of the virtual page that you want to switch to on your keyboard.
To switch to the next empty virtual page
▫
Press CTRL + F12 on your keyboard.
Copying and Moving Content Between Virtual Pages
You can copy or move the documents that are shown in a virtual page to another virtual page. If you copy a
document, it is then shown on both virtual pages – if you move a document, it is removed from the original page.
You can also copy or move all documents of a virtual page at once. The position of the windows (virtual page layout)
on the target virtual page will be the same as on the original virtual page.
To copy one document to another virtual page
▪
Click on the document that you want to copy to make it active.
▪
On the Window menu, click Copy Window to Virtual Page and select the target virtual page. This can also be a
previously empty page.
▪
The document is copied to the virtual page that you selected.
To move one document to another virtual page
▪
Click on the document that you want to move to make it active.
▪
On the Window menu, click Move Window to Virtual Page and select the target virtual page. This can also be a
previously empty page.
▪
The document is moved to the virtual page that you selected.
To copy all documents to another virtual page
▪
Switch to the virtual page that you want to be your source page.
▪
On the Window menu, click Copy Virtual Page Layout To and select the target virtual page. This can also be a
previously empty page.
▪
All documents of the source page are copied to the virtual page that you selected. The page layout (position of
the windows) will be the same in the target virtual page. The target virtual page will also receive the name of the
source page.
To move all documents to another virtual page
▪
Switch to the virtual page that you want to be your source page.
Organizing and Saving Documents
156
TeleTrader Software GmbH
Marc-Aurel-Straße 10-12, 1010 Vienna, Austria
E-Mail [email protected]
Internet http://professional.teletrader.com
▪
On the Window menu, click Move Virtual Page Layout To and select the target virtual page. This can also be a
previously empty page.
▪
All documents of the source page are moved to the virtual page that you selected. The page layout (position of
the windows) will be the same in the target virtual page. The target virtual page will also receive the name of the
source page.
Opening and Saving Virtual Pages
You can save a virtual page as a file, and later add it to any Professional workspace. TeleTrader Professional also
offers a set of prepared virtual pages, with market overviews, up-to-date index lists and similar content.
To open a virtual page
▪
On the File menu, click Open Virtual Page.
▪
In the Virtual Pages dialog, select the virtual page that you want to open. There might be several tabs with
different virtual pages. To find virtual pages that you have saved in different locations, click Other Pages.
▪
Click OK. The virtual page is added behind the last filled virtual page (if the workspace was empty, this is the first
page).
Note
If you want to close the currently active virtual page, and replace it with the new virtual page, select
Replace displayed virtual page before clicking OK.
This action cannot be undone – if you select this option, all documents on the active virtual page
will be closed and replaced with the new virtual page.
To save a virtual page
▪
On the File menu, click Save Virtual Page As.
▪
In the Save Virtual Page dialog, enter a name for the virtual page in the File name field.
▪
Choose the location where you want to save the virtual page. Professional will suggest to save it into the Custom
Virtual Pages folder. You can use a different location, or even create an additional folder (the new folder will be
shown as an additional tab in the Virtual Pages dialog, see above).
▪
Click Save.
Organizing Virtual Pages
You can change the name of a virtual page to describe its content more clearly. Professional just assigns numbers to
each virtual page.
If you want to clear a virtual page, you can close all document windows on it at once. If you just want to remove a
single document, just close the document – see Closing Documents on page 164.
To change the name of a virtual page
▪
On the Window menu, click Page Title.
Organizing and Saving Documents
157
TeleTrader Software GmbH
Marc-Aurel-Straße 10-12, 1010 Vienna, Austria
E-Mail [email protected]
Internet http://professional.teletrader.com
▪
In the Virtual Page dialog, edit the name of the virtual page.
▪
Click OK.
To reposition a virtual page
▪
On the Window menu, click Set Virtual Page Layout As and select the position where the current page should
be moved to. This can also be a previously empty page.
▪
The complete virtual page is moved to the new position. If the new position was already filled with another virtual
page, this page is moved to the following page position.
To close all documents on a virtual page
Warning
This action cannot be undone. This will close all documents on this virtual page, including all their
settings. If you want to use one of the windows later on, you have to first save it: See Creating and
Saving Documents on page 159 and Creating and Saving Workspaces on page 150.
▪
On the Window menu, click Close Windows on Current Page.
▪
Click Yes to confirm the warning message.
Note
You can save the answer to this warning by selecting the check box Don’t ask this question
again before clicking Yes or No. To later change this setting, see Default Responses Settings on
page 346.
Documents
Documents are windows that are shown inside the Professional main window. Every time you open a symbol you
create a new document. You can create as many documents as you like.
Every document is part of a workspace by default. You can save individual documents as a single file – however, we
recommend to always save documents inside a workspace. See Creating and Saving Workspaces on page 150.
Document windows can be resized and arranged inside the Professional main window, but you can also detach them
from the main window and position them freely on the screen. You can copy a document window, and of course print
its contents.
Organizing and Saving Documents
158
TeleTrader Software GmbH
Marc-Aurel-Straße 10-12, 1010 Vienna, Austria
E-Mail [email protected]
Internet http://professional.teletrader.com
Creating and Saving Documents
New documents are created every time you open a symbol in a document. You can save individual documents as a
single file – however, we recommend to always save documents inside a workspace. See Creating and Saving
Workspaces on page 150.
Note
Charts can also be saved as a picture file. For more information, see Saving Charts as Picture
Files on page 241.
To create a new document
To create a new document, you open a symbol with this document type. You can do this in several ways:
▫
Use the QuickBar, which holds the most popular symbols: See Opening Symbols from the QuickBar on page 31
▫
Use Symbol Search to find and open a specific symbol: See Opening Symbols from the Search Results on page
38
▫
Create a new empty document and insert one or more symbols there: See Opening Symbols in New Documents
on page 64
▫
Take a symbol that is already displayed in a document and open it in another document: See Opening Symbols
from Existing Documents on page 66
▫
To open a news document, click on the News icon in the QuickBar for general news, or search for news for a
specific symbol: SeeDisplaying News for a Symbol on page 68.
To save a document
▪
On the File menu, click Document > Save.
Note
▪
You can also click on the Save icon in the Main toolbar:
In the Save as dialog, enter a name for the document in the File name field.
Note
The Save as dialog appears only when you are saving the document for the first time.
▪
Choose the location where you want to save your document. Professional will suggest to save it into your
Documents folder. You can also use a different location.
▪
Professional automatically chooses the appropriate document type (file name extension) for the current
document in the Save as type field.
▪
Click Save.
To save an existing document under a different name
▪
On the File menu, click Document > Save as.
▪
In the Save as dialog, enter a new name for the document in the File name field.
▪
Click Save.
Opening Saved Documents
When you have saved an individual document, you can later open it again in TeleTrader Professional. All settings and
customizations of the document are restored. We recommend to save and open documents as a part of a workspace,
though: See Creating and Saving Workspaces on page 150.
Organizing and Saving Documents
159
TeleTrader Software GmbH
Marc-Aurel-Straße 10-12, 1010 Vienna, Austria
E-Mail [email protected]
Internet http://professional.teletrader.com
To open a saved document
▪
On the File menu, click Document > Open.
Note
▪
▪
You can also click on the Open icon in the Main toolbar:
In the Open dialog, select the document that you want to open. You can also choose its document type, if
necessary, to shorten the list of displayed files:
Document Type
File Name Extension
Price Page (Standard)
.tbl
Price Page (Vertical)
.vpp
Price Page (Market Watch)
.bmw
Price Page (My Market
Watch)
.bmm
Price Page (Last Net
Change)
.bln
Chart
.nch
News
.nws
Market Depth
.mdf
Time and Sales
.tnsd
Time and Sales US
.tns
Options Matrix
.omd
Watch List
.wld
Web Watch
.wwl
Quick Quote
.qqd
Text Files
See Importing Security Lists on page 377
Click Open.
Changing the Size of a Document Window
You can change the size of a document window. Each window can be displayed maximized (full screen), minimized
(only an icon is visible), or with a custom size. You can also let Professional choose the appropriate size
automatically.
Note
When you change the size of the Professional main window, all document windows that are shown
within it are resized accordingly to fit the new window size. You can temporarily suppress
automatic resizing by holding the CTRL key while changing the size of the main window. In the
program options you can also permanently deactivate this feature (see General Settings on page
339).
To choose the appropriate size of a document window automatically
▪
In a price page, watch list, market depth, options matrix or time and sales document, right-click on the document
window and choose Auto Size.
Organizing and Saving Documents
160
TeleTrader Software GmbH
Marc-Aurel-Straße 10-12, 1010 Vienna, Austria
E-Mail [email protected]
Internet http://professional.teletrader.com
Note
▪
In a price page or watch list, you have to right-click on the upper left corner of the document to see
this option. In other documents, you can right-click anywhere.
The size of the document is adapted to show all columns, and fit in the Professional main window. Additionally,
the width of all columns is adapted to show the widest entry in this column.
To maximize a document window
▪
In the upper right corner of the document window, click the Maximize button.
Note
You can also press the SHIFT key two times in a row to maximize a window, if it is not maximized
already.
To minimize a document window
▪
In the upper right corner of the document window, click the Minimize button.
To enlarge (reduce) a document window
▪
In the upper right corner of the document window, click the Enlarge (Reduce) button.
▪
If the window was minimized, it will be enlarged. Otherwise, it will be reduced.
Note
You can also press the SHIFT key two times in a row to enlarge or reduce a window: If the window
was maximized, it will be reduced. If the window was minimized, it will be enlarged.
Sticky Keys
When you press the SHIFT key five times in a row (for example, when you first maximize and then reduce a window
with the SHIFT key), Windows might show a message asking you if you want to activate the "Sticky Keys" function.
This is an accessibility feature that allows you to press one key at a time for keyboard shortcuts such as CTRL + C,
instead of pressing them at the same time.
If you want to avoid this pop-up, click on the Settings button (or on the link in the message under Windows Vista).
That sends you to the Accessibility Options (or Ease of Access Center under Windows Vista). There, clear the
check box Use shortcut (or Turn on Sticky Keys when SHIFT is pressed five times under Windows Vista).
Organizing and Saving Documents
161
TeleTrader Software GmbH
Marc-Aurel-Straße 10-12, 1010 Vienna, Austria
E-Mail [email protected]
Internet http://professional.teletrader.com
Changing the Document Window Captions
Each document window has a window caption (title). You can change the title text, or hide the window captions if they
take up too much space on the screen.
To change the title text of a document window
▪
On the Window menu, click Document Title.
▪
In the Set Document Title dialog, enter the new document title.
To show / hide the document window captions
▪
On the View menu, click Window Captions to show or hide them. The option is highlighted with a check mark
when the Window Captions are displayed.
To move a document window without a caption
Normally, you can move a window by clicking on its window caption and dragging it. When the window caption is
hidden, you can do the following:
▪
Right-click anywhere in the document window and choose Move.
▪
The mouse pointer changes:
▪
Hold the mouse button down, drag the window to its new location and release the mouse button to drop it there.
Note
Chart windows can also be moved by clicking on the chart header and dragging them.
Price pages can be moved by clicking in the upper left corner and dragging them.
To close a document window without a caption
▪
Right-click anywhere in the document window and choose Close.
Note
See also Closing Documents on page 164.
Arranging Document Windows on the Screen
If you want to display a great number of documents on one screen (virtual page), you can let Professional
automatically arrange them for you. You can also detach a document window from the Professional main window to
create a free floating window that you can position on the screen independent of the main window.
To cascade document windows
▪
On the Window menu, click Cascade.
To tile document windows horizontally
▪
On the Window menu, click Tile Horizontally.
To tile document windows vertically
▪
On the Window menu, click Tile Vertically.
Organizing and Saving Documents
162
TeleTrader Software GmbH
Marc-Aurel-Straße 10-12, 1010 Vienna, Austria
E-Mail [email protected]
Internet http://professional.teletrader.com
To arrange minimized document window icons
▪
On the Window menu, click Arrange Icons.
To activate a document window (move to the foreground)
There are several ways to move a document window to the foreground, if it is (partially) hidden behind other windows:
▫
Click on any part of the document window that is still visible.
▫
If you cannot see any part of the document: On the Window menu, click on the name of the document window.
▫
If you want to activate a window that is on another virtual page: On the Window menu, click More Pages, select
the virtual page on the left side of the dialog, and select a document window on the in the Select window list.
Then, click Activate.
To copy a document window
▫
On the Window menu, click Copy Window.
▫
A new document is created, which is a copy of the current document window. The documents are not connected
with each other – changes that you make in one document will not affect the other document.
To detach a document window
▪
On the Window menu, click Detach Window.
▪
You can now move the window independently of the Professional main window, and place it anywhere on your
desktop. The document window includes all necessary menu commands and toolbars.
Note
In contrast to other document windows, a detached quick quote document does not show the
menu bar by default. However, you can make the menu bar visible by right-clicking the detached
quick quote document and choosing Show Menu.
To reattach a detached document window
▪
On the Window menu of the detached window, click Attach Window to > TeleTrader Professional.
Note
▪
In detached quick quote documents, where the menu bar is not visible by default, you also can
right-click the detached quick quote document to choose Attach Window to.
The window is now attached to the Professional main window again. You can move it only within the constraints
of the main window.
Note
If you have created additional Professional main windows, you can also attach the document
window to another Professional instance. For more information, see Multi-Monitor Systems on
page 171.
Printing Documents
All documents except market depth, quick quote and options matrix can be printed.
Organizing and Saving Documents
163
TeleTrader Software GmbH
Marc-Aurel-Straße 10-12, 1010 Vienna, Austria
E-Mail [email protected]
Internet http://professional.teletrader.com
To print a document
▪
Click on the document that you want to print. For news documents, click on the news headlines to only print
headlines, or on the news story to only print the active story.
▪
On the File menu, click Print.
Note
If you want to see a preview of your document before printing, choose File > Print Preview.
To change the page setup
▪
On the File menu, click Page Setup.
▪
You can change the paper size, orientation and page margins. Click OK when you are done.
Note
These settings apply to all document types.
To change the print setup for charts
▪
On the File menu, click Chart Print Setup.
▪
Adapt the options to your needs. See Printing Charts on page 240 for details.
Closing Documents
When you close a document, it is removed from the screen. You can only open the same document (with all its
settings) again if you have saved it before closing. If the document is part of a workspace, it is also removed from the
workspace when you close it.
Organizing and Saving Documents
164
TeleTrader Software GmbH
Marc-Aurel-Straße 10-12, 1010 Vienna, Austria
E-Mail [email protected]
Internet http://professional.teletrader.com
Warning
This action cannot be undone. When you close a document window without saving it first, you
cannot open it again or get it back in another way. Be careful before you close a document window
without saving. See also Creating and Saving Documents on page 159 and Creating and Saving
Workspaces on page 150.
To close a document window
▪
On the File menu, click Document > Close.
Note
▪
You can also click on the Close button in the upper right corner of the document window:
If there are unsaved changes to the document, you might be asked if you want to save the changes. Click Yes to
save the changes, or No to discard them.
Note
You can save the answer to this question. For example, if you always want to discard all changes,
select the check box Don’t ask this question again and click No. Professional will then
automatically discard all changes to every document when you close it. This is also the default
setting in Professional. You can change this setting later: See Default Responses Settings on page
346.
We recommend to always save changes in a workspace instead of a single document file.
To close several document windows at once
▪
On the Window menu, click More Pages.
▪
On the left side of the dialog, select the virtual page that contains the document windows.
▪
On the right side of the dialog, select the document windows that you want to close in the Select window list.
▪
Click Close Window(s).
Organizing and Saving Documents
165
TeleTrader Software GmbH
Marc-Aurel-Straße 10-12, 1010 Vienna, Austria
E-Mail [email protected]
Internet http://professional.teletrader.com
To close all documents on a virtual page
▪
On the Window menu, click Close Windows on Current Page.
▪
Click Yes to confirm the warning message.
Note
You can save the answer to this warning by selecting the check box Don’t ask this question
again before clicking Yes or No. To later change this setting, see Default Responses Settings on
page 346.
FastLook
FastLook offers you a way to store symbols that you use frequently independent of a workspace. It is part of the
navigation pane. Similar to the QuickBar, it holds lists of symbols that can be grouped into folders. However, unlike
the QuickBar, you can define and change these lists yourself.
By default, FastLook is empty. If you want to store some symbols there, you first have to add them. You can also
organize them in folders to keep a better overview. Symbols and folders in FastLook are stored independent of every
workspace and can therefore also be accessed from any workspace. You can open any type of document for a
FastLook symbol.
If you want to customize FastLook, you can change the font, colors and symbol display (ticker or name). See
Customizing FastLook on page 142.
FastLook is automatically displayed as a part of the navigation pane when you start TeleTrader Professional. If the
navigation pane is not visible because it was closed manually, or if another view is chosen to be displayed, follow the
steps below to display FastLook.
To display FastLook
▪
On the View menu, click Navigation Pane.
Organizing and Saving Documents
166
TeleTrader Software GmbH
Marc-Aurel-Straße 10-12, 1010 Vienna, Austria
E-Mail [email protected]
Internet http://professional.teletrader.com
▪
In the navigation pane, click on the tab FastLook.
Adding Folders and Symbols to FastLook
All symbols that you add to FastLook are stored there automatically, independent of any workspace. Thus, they are
available in any workspace. Symbols remain in FastLook until they are removed (see Organizing FastLook Items on
page 168).
You can create folders in FastLook to keep a better overview of your symbols. All folders that you create are part of
the root folder My Symbols. This folder cannot be removed, since it holds all other items.
Note
You can also add symbols to FastLook with drag and drop. See Copying Symbols on page 75.
To add a symbol to FastLook
▪
Right-click on the folder where you want to add the symbol and choose Insert Symbols.
▪
In the Symbol Search dialog, enter your search term in the first field on the left side and change the search
settings, if necessary. For more information, see Searching for Securities in the Symbol Search Dialog on page
34.
▪
Click on the green button or press the ENTER key to start the search.
▪
Select the symbol(s) that you want to insert.
▪
Click OK. The symbol is inserted into the selected folder.
To add a folder to FastLook
▪
Right-click on the folder that should be the parent folder and choose Insert Folder.
▪
A new folder is added inside the parent folder.
▪
Right-click on the new folder and choose Rename.
▪
Enter a name for the folder and press the ENTER key.
Opening Symbols from FastLook
You can open every symbol that is stored in FastLook in a document. You can either use the default document and
template, or choose the document type and template that will be used.
To open a symbol from FastLook with the default document type
▪
Double-click on the symbol.
Organizing and Saving Documents
167
TeleTrader Software GmbH
Marc-Aurel-Straße 10-12, 1010 Vienna, Austria
E-Mail [email protected]
Internet http://professional.teletrader.com
▪
A new chart document is opened for the symbol. The document is formatted with the default template.
Note
You can change the default document that is opened. See Double-Click Actions Settings on page
346.
To open a symbol from FastLook with other document types
▪
Right-click on the symbol and choose Open.
▪
Choose the document type from the list.
▪
A new document is opened for the symbol. The document is formatted with the default template.
Note
You can open separate documents for more than one symbol simultaneously. Select the symbols
by clicking on them while keeping the CTRL key pressed, then follow the steps above. If you select
several symbols and open a price page, watch list or time and sales document for them, by default
all symbols will be combined in one document. If you keep the CTRL key pressed while choosing
the document type, each symbol will be opened in a separate document.
If you open a new chart document while selecting several symbols, holding the CTRL key will open
overlaid symbols in one chart pane. To open every symbol in its own chart pane, hold both the
CTRL + SHIFT while choosing the document type Charts.
To open a symbol from FastLook using a template
▪
Right-click on the symbol and choose Open.
▪
Right-click the document type you want to use (or move the mouse pointer to the document type and wait for a
moment) – an additional menu will appear to the right.
▪
Choose a template from the list.
▪
A new document is opened for the symbol. The document is formatted with the chosen template.
To open a list of related symbols from FastLook
▪
Right-click on the symbol and choose Related Symbols.
▪
Choose from the list which symbols should be shown. See also Opening Related Symbols in a Price Page on
page 71.
To open all symbols of a folder from FastLook
▪
Right-click on the folder and choose Open.
▪
Choose the document type from the list.
▪
A new document is opened for every symbol. If you have chosen to open a price page, watch list or time and
sales document, all symbols of the folder will be combined into one document. Otherwise, a separate document
for each symbol is created.
Organizing FastLook Items
You can copy FastLook symbols between the FastLook folders, sort the folder content alphabetically, collapse and
expand folders, print a list of all folders and symbols and of course also remove symbols or folders from FastLook.
To copy a symbol between folders with drag and drop
▪
Click on the symbol that you want to copy.
Organizing and Saving Documents
168
TeleTrader Software GmbH
Marc-Aurel-Straße 10-12, 1010 Vienna, Austria
E-Mail [email protected]
Internet http://professional.teletrader.com
▪
Hold the mouse button down and move the symbol. The mouse pointer changes:
▪
Drag the symbol to another folder and release the mouse button to drop it there. The symbol is inserted at the
end of the folder list.
Note
You can also copy a symbol from FastLook to any Professional document with drag and drop. See
Copying Symbols on page 75.
To sort the content of a folder in FastLook
▪
Right-click on the folder and choose Sort Folder.
To activate / deactivate automatic sorting for FastLook
▪
Right-click anywhere in FastLook and choose Sort.
Note
When automatic sorting is activated, the option is highlighted with a check mark.
To collapse and expand a folder in FastLook
▪
Right-click on the folder and choose Collapse Folder or Expand Folder.
Note
You can also double-click on the folder to collapse or expand it.
To print a list of FastLook folders and symbols
▪
Right-click anywhere in FastLook and choose Print.
To remove symbols or folders from FastLook
Warning
▪
This action cannot be undone. When you remove a folder from FastLook, all symbols that are
contained in this folder will be removed too. You cannot remove the root folder MySymbols.
Right-click on the symbol or folder and choose Delete.
Sending Workspaces, Virtual Pages or Documents via E-Mail
You can share your workspaces, virtual pages or documents with other Professional users via e-mail. You can also
send a chart picture to anyone who does not have access to a TeleTrader Professional installation.
When sending e-mails from within Professional, you have two possibilities: You can use your default e-mail client with
your existing account settings and address book, or you can use the internal e-mail client. The internal e-mail client
must be configured with your account data before it can be used, and it uses an internal address book for your
contacts.
Note
E-mail notifications that are triggered by alerts will always be sent using the internal e-mail client.
See E-Mail Action on page 335.
Organizing and Saving Documents
169
TeleTrader Software GmbH
Marc-Aurel-Straße 10-12, 1010 Vienna, Austria
E-Mail [email protected]
Internet http://professional.teletrader.com
To use your default e-mail client
▪
On the File menu, activate Send E-mail > Use Default E-Mail Client.
▪
The option will be highlighted with a check mark when it is activated.
Note
All e-mails except e-mail notifications triggered by alerts will be sent using your standard e-mail
client.
To configure and use the internal e-mail client
▪
On the File menu, deactivate Send E-mail > Use Default E-Mail Client.
▪
The check mark next to the option should disappear.
▪
On the Tools menu, choose Options and click on the options sheet E-Mail Settings on the left side of the
dialog.
▪
Configure the settings for your internal e-mail account: See E-Mail Settings on page 348.
To send a workspace, virtual page or document as attachment
▪
▪
On the File menu, click Send E-mail, and then choose the appropriate command:
Document as Attachment
Attach the active Professional document to an e-mail message
Virtual Page as Attachment
Attach the active virtual page to an e-mail message
Workspace as Attachment
Attach the open workspace to an e-mail message
Depending on if you are using your default e-mail client or the internal client, proceed as follows:
-
Default e-mail client: A new e-mail message appears. Enter the e-mail address of the recipient(s) and click
Send.
-
Internal e-mail client: Choose a recipient from the menu, or create a new recipient address in the Address
Book (for more information about using the internal address book see Using the Internal Address Book on
page 170).
To send a chart as a picture file via e-mail
▪
On the File menu, choose Send E-mail > Image.
Note
▪
You can also right-click on the chart and select E-Mail Chart.
Depending on if you are using your default e-mail client or the internal client, proceed as shown above for
sending documents as attachment.
Note
The TeleTrader logo is added as a watermark to the chart picture.
Using the Internal Address Book
When you are using the internal e-mail client, you have to add the recipients of your e-mail (contacts) to the internal
address book before you can send a document, virtual page or workspace to them. You can also import external
contacts from a text file or comma separated values file. The internal address book only offers basic functionalities –
for more functionalities, use your default e-mail client.
Organizing and Saving Documents
170
TeleTrader Software GmbH
Marc-Aurel-Straße 10-12, 1010 Vienna, Austria
E-Mail [email protected]
Internet http://professional.teletrader.com
To access the internal address book
▫
When sending workspaces, virtual pages or documents from within Professional (see Sending Workspaces,
Virtual Pages or Documents via E-Mail on page 169) choose the command Address Book.
▫
When configuring e-mail notifications for alerts, click on the labels To, Cc or Bcc in the Alert Action Editor (see
E-Mail Action on page 335).
To create a new contact
▪
In the Send E-mail dialog, click New.
▪
To set the name and address of the new contact, click on the default values First Name, Last Name or E-mail
Address.
▪
Type the name or address and press ENTER.
To choose a contact
▪
In the Contacts list, select the recipient of your e-mail.
▪
Click To, Cc or Bcc to add him / her to the appropriate field.
To delete a contact
▪
In the Contacts list, select the contact.
▪
Click Delete.
To import external contacts
Note
The import file must be a text file or comma separated values file with three columns that contain
the First Name, Last Name and E-Mail Address of your contacts (in this order).
▪
In the Send E-mail dialog, click Import.
▪
In the Import E-mail Addresses dialog, click Browse.
▪
In the Import dialog, select the file that you want to import and click Open.
▪
If the first row of your import file does not contain data, select First row is heading.
▪
You can now see a preview of the contacts that will be imported. If you are satisfied with the results, click Import.
To export your address book
See E-Mail Settings on page 348.
Multi-Monitor Systems
If you are working with more than one monitor, there are several ways to ideally use all the screen space available to
you. You can stretch the Professional main window across multiple monitors, create an additional Professional main
window to position on another screen, or detach some document windows from your main window to position them
freely on the screen(s).
All settings and window positions, including additional main windows and detached windows, can be saved in a
workspace. See Creating and Saving Workspaces on page 150.
Organizing and Saving Documents
171
TeleTrader Software GmbH
Marc-Aurel-Straße 10-12, 1010 Vienna, Austria
E-Mail [email protected]
Internet http://professional.teletrader.com
To stretch the Professional main window across multiple monitors
▪
Make sure that the Professional main window is not maximized or minimized. If it is, click the Enlarge (Reduce)
button in the upper right corner of the main window.
▪
Place the mouse pointer at the border of the main window. The mouse pointer changes:
▪
Hold the mouse button down and move the mouse to widen / shorten the window. You can now stretch the
window across multiple monitors.
Note
If you open a new document inside a Professional window that is stretched across monitors, the
document will be shown on the monitor where the mouse pointer is positioned at the moment of
creation.
To create an additional Professional main window
▪
On the File menu, click New Professional.
▪
An additional Professional main window is created.
Note
You can use this window like any other Professional window to display documents, virtual pages
and so on. The documents and virtual pages of each Professional main window are independent of
each other. However, if you create and save a workspace, all visible main windows are included in
the workspace. You cannot create separate workspaces for additional Professional windows.
To create a free floating document window
A free floating window can be positioned on any screen independent of the Professional main window. To create a
free floating window, you have to detach the document window.
See Arranging Document Windows on the Screen on page 162.
Organizing and Saving Documents
172
TeleTrader Software GmbH
Marc-Aurel-Straße 10-12, 1010 Vienna, Austria
E-Mail [email protected]
Internet http://professional.teletrader.com
Charting
Technical analysis methods are based on evaluating past price movements, patterns and trends to forecast the future
development of a security. To identify and interpret such patterns, charting techniques are used to visualize the
historic data of a symbol on the screen.
TeleTrader Professional offers a lot of tools to work with charts. This section describes mainly how to set up and
customize the chart itself. If you want to learn how to insert and use the different drawing tools and analysis tools
(studies), these are explained in separate sections: Drawing Tools on page 244 and Analysis Tools on page 299.
Elements of a Chart
Each chart document is made up of certain elements. Some of the elements are always present, like price and time
scales, some elements must be added by you, like symbols (time series), studies and drawing objects.
Price and time scales provide the coordinate system for the plotted data
A chart shows the visual representation of a symbol’s historical and current data (time series). For each point in time,
the price(s) of the symbol are plotted on the screen. To see how the data points relate to each other, charts use a
coordinate system of time and prices.
Times are shown on the horizontal scale. Depending on the data compression that you use (for example, daily,
intraday or tick compression), the intervals shown on the time scale will be different. On the time scale, you can find
out for example at which point in time a certain price level was reached.
Charting
173
TeleTrader Software GmbH
Marc-Aurel-Straße 10-12, 1010 Vienna, Austria
E-Mail [email protected]
Internet http://professional.teletrader.com
Prices are shown on the vertical scale. Here, you can find out what the current price for a symbol is and what prices
were reached in the past. The price scale can be adjusted, so that it shows for example percentages or logarithmic
prices.
Chart panes and sheets are used to organize the contents of a chart
When you want to display different symbols in one chart, for example to compare them, or add other chart objects,
such as studies, you can organize the contents of your chart into several chart panes or sheets.
Every chart consists of at least one chart pane. You can add other panes as well. Each pane has a header that shows
which objects are displayed in this pane. The currently active pane is indicated by a colored rectangle at the left edge
of the pane header. The appearance (colors, grid) of every pane and its header can be freely configured.
You can also use sheets to organize the contents of a chart, like in price pages. Each sheet can be customized
differently, including its data compression and chart type. In combination with the chart window split, you can use
sheets to display for example two different data compressions for a symbol at once.
Add chart objects as you need them
In addition to symbols, you can also display other objects necessary for technical analysis on a chart. The most
important examples are drawing objects, like trend lines or Fibonacci Retracements, and studies, like the Moving
Average or different oscillators. You will learn more about these tools in the sections Drawing Tools on page 244 and
Analysis Tools on page 299.
Creating Charts and Opening Documents from a Chart
To display a chart, you have to open a symbol in a new chart document. You can also do this from the QuickBar, from
Symbol Search results, from other documents like price pages or from the symbols you have stored in FastLook. You
can also open other types of documents from a chart – for example time and sales.
To open a chart from the QuickBar
See Opening Symbols from the QuickBar on page 31
To open a chart from search results
See Opening Symbols from the Search Results on page 38
To open a new empty chart document and insert a symbol there
See Opening Symbols in New Documents on page 64
To open a chart from an existing document
See Opening Symbols from Existing Documents on page 66
To open a chart from FastLook
See Opening Symbols from FastLook on page 167
To open other documents from a chart
See Opening Symbols from Existing Documents on page 66
Charting
174
TeleTrader Software GmbH
Marc-Aurel-Straße 10-12, 1010 Vienna, Austria
E-Mail [email protected]
Internet http://professional.teletrader.com
Changing the Data Compression
In a chart, Professional plots many data points on the screen as bars, candlesticks or in some other form of
visualization (see Changing the Chart Type on page 176 for an overview of the available visualizations). For real-time
quotes, data is transmitted internally from the exchanges as tick by tick data – this means, whenever a trade occurs, a
new data point is added. You can of course show the flow of tick by tick data in a chart, but more often you will want
to get an overview over a longer period of time – in this case, the data will be compressed for you.
Compression means that Professional looks at a group of ticks, for example all ticks of a day, but uses only up to four
of these values to draw the next data point (bar, candlestick etc.): The first and last prices of the day (Open and
Close), and the highest and lowest price of the day (High and Low). Some chart types, such as line charts, only use
the Close price – in that case, all the data of a whole day is compressed into a single value.
There are two different types of compression:
▫
Time compression: This form of data compression is used in most charts. Every data point, bar, candlestick etc.
represents a fixed period of time, for example a day, a week or 10 minutes. For every period, the Open, High,
Low and Close prices are determined. With this information, the next data point (bar, candlestick, Point and
Figure box etc.) for this period is drawn on the chart as soon as the period is over. For example, if you use a onehour candlestick chart, at the end of each hour a new candle is added. Time compressions include Intraday,
Daily, Weekly and Monthly compressions. The most common compression is the Daily compression, which is
also used as a default in TeleTrader Professional.
▫
Tick compression: This means that several ticks (trades) are grouped together and compressed to form a data
point (for example, a bar or candlestick). If you use for example a tick compression of 10 ticks, then all ticks are
grouped in sets of ten. The Open price of a 10-tick bar is the first tick, the Close price is the tenth tick. The High
and Low prices are the highest and lowest prices in the set of ten ticks, respectively. Tick compressions do not
have a linear time scale – depending on the frequency of incoming ticks, a 10-tick bar can comprise a period of
seconds, minutes or even days (for infrequently traded securities). Tickbar is the only tick compression available;
the "compression" Tick by Tick in fact shows uncompressed data.
The current data compression is shown in the upper right corner of the chart header.
To change the data compression of a chart
▪
▪
Click on the corresponding icon in the Chart toolbar:
Tick by Tick
Every tick (last price) of the symbol is plotted as a separate data point. Use this setting if
you want to see uncompressed data (for example, real time quotes as they come in).
Tickbar
A number of ticks are compressed to form a bar (or other plotted data point). You can set
the number of ticks that are used for each bar. In the chart header, you can see the
number of remaining ticks until the next bar is drawn.
Intraday
All ticks that occur in an interval of a number of minutes or hours are compressed to form
a bar (or other plotted data point). You can choose the time interval that is used for each
bar. In the chart header, you can see the remaining time until the next bar is drawn.
Daily
All ticks of a day are compressed to form a bar (or other plotted data point).
Weekly
All ticks of a week are compressed to form a bar (or other plotted data point). For
securities that are also traded on weekends (Forex, Futures) the weekly bar starts with
Sunday's Open price.
Monthly
All ticks of a month are compressed to form a bar (or other plotted data point).
Depending on your choice, you will have to add some details about the data compression that you wish to apply
to the chart:
-
If you choose a tick by tick, daily, monthly or weekly compression, the data compression of the chart will
change immediately.
-
If you choose a tickbar compression, you will be asked to enter the number of ticks that are used for each
bar:
Charting
175
TeleTrader Software GmbH
Marc-Aurel-Straße 10-12, 1010 Vienna, Austria
E-Mail [email protected]
Internet http://professional.teletrader.com
-
If you choose an intraday compression, you will be asked to choose the time interval that is used for each
bar. You can also enter an Offset value, which means that the time series will be offset by the number of
hours or minutes that you enter. (For example, if the first 60-minute bar would be at 9:00 to 10:00, and you
offset it by 5 minutes, the first bar would then be at 8:05 to 9:05, the second bar at 9:05 to 10:05 and so on.)
Note
You can also choose the most common tickbar or intraday compressions by clicking on the arrow
next to the Tickbar
or Intraday
icon.
Alternatively, you can also change the data compression of a chart with a menu command or in the properties dialog:
▫
On the Chart menu, click Compression and choose the data compression that you want to use.
▫
In the Chart Properties dialog, choose General > Type. See also Customizing the Chart on page 216.
Changing the Chart Type
There are several ways to plot the price data of a symbol on the screen. Each type of visualization is called a chart
type. Some chart types are fairly common and easy to understand, like line charts, bar charts or candlestick charts,
other visualizations are more complex, like Point and Figure charts or the Japanese variations Three Line Break,
Renko and Kagi. Every chart type has its advantages and disadvantages – it is up to you to decide which type suits
you best for a specific task. By default, Professional uses candlestick charts.
All chart types used in TeleTrader Professional only need the prices of a symbol as an input: Some chart types only
use the Close prices of a period, others also include Open, High and Low prices. Instead of the Close price, you can
also use the Settlement price. If you do not want to use the trade prices on your chart, you can also plot bid or ask
prices for some types of securities.
Bear in mind that a chart is always a combination of its chart type and its data compression. A 10-ticks bar chart will
look differently than a daily bar chart, and is certainly different than a daily Kagi chart. Also see Changing the Data
Compression on page 175.
To change the chart type
▪
Click on the arrow next to the Chart Type icon in the Chart toolbar.
Charting
176
TeleTrader Software GmbH
Marc-Aurel-Straße 10-12, 1010 Vienna, Austria
E-Mail [email protected]
Internet http://professional.teletrader.com
Note
▪
You can also change the chart type with the menu command Chart > Plot Type.
Choose the chart type that you want to use:
Note
Line Chart
The Close prices of the symbol are plotted as a continuous, smoothed line.
This is a Finance chart type.
Bar Chart
The Open, High, Low and Close prices of a symbol are plotted as bars. This is
a Finance chart type.
Candlestick Chart
The Open, High, Low and Close prices of a symbol are plotted as
candlesticks. This is a Finance chart type.
Point Chart
The Close prices of a symbol are plotted as points. This chart type is similar to
the line chart, except that the data points are not connected with a line. This is
a Finance chart type.
Histogram Chart
The Close prices of a symbol are plotted as vertical columns. This is a
Finance chart type.
Stair Step Chart
The Close prices of a symbol are plotted as steps. This chart type is similar to
the line chart, except that the data points are connected with rectangular lines
(steps). This is a Finance chart type.
Point & Figure Chart
The prices of a symbol are plotted independent of time in columns of X’s and
O’s. You can freely configure the box size and reversal amount.
Three Line Break Chart
The prices of a symbol are plotted independent of time in rising or falling
columns (lines). A change in trend (reversal) takes place when the price
breaks the high/low of the three previous columns (lines).
Renko Chart
The prices of a symbol are plotted independent of time with so-called "bricks"
(boxes). A new brick in either direction is drawn when prices exceed the
previous brick by at least the brick size, which can be configured freely.
Kagi Chart
The prices of a symbol are plotted independent of time with vertical lines that
show the direction of a price movement and horizontal lines that show a
reversal. A reversal takes place when the price changes by at least the filter
amount, which can be configured freely.
Heikin Ashi Chart
Heikin Ashi-transformations of the Open, High, Low and Close prices of a
symbol are plotted as candlesticks.
Some chart types are not available for specific data compressions. For example, you cannot show
tick by tick data as a bar or candlestick chart.
To change the chart type configuration
▪
Right-click on the chart and choose Properties.
▪
On the left side of the dialog, select the name of the chart pane, the name of the symbol and then Display. For
example: Pane 1 > DAX > Display.
▪
On the right side of the dialog, select the chart type that you want to use from the Chart mode list.
If you choose the chart mode Finance, you have to select the chart type from the sample pictures (Line, Bar,
Candlestick, Histogram, Points or Stair Step).
Charting
177
TeleTrader Software GmbH
Marc-Aurel-Straße 10-12, 1010 Vienna, Austria
E-Mail [email protected]
Internet http://professional.teletrader.com
▪
▪
Choose what prices should be used for plotting the chart:
Chart Open – High – Low – Close
Open, High, Low and Close prices are used to plot the chart (if
appropriate for the chosen chart type).
Chart Open – High – Low – Settlement
Instead of the Close price, the Settlement price of a symbol is used to
plot the chart.
Chart Bid (OHLC)
Instead of the last prices, the bid prices are used to plot the chart
(Open, High, Low and Close).
Chart Ask (OHLC)
Instead of the last prices, the ask prices are used to plot the chart
(Open, High, Low and Close).
For some chart types (Point & Figure, Renko, Kagi), you can adapt additional settings, like the box size and
reversal amount in Point and Figure charts. For details, see Point and Figure Charts on page 181, Renko Charts
on page 183 or Kagi Charts on page 184.
Finance Charts
The Finance chart types all use a linear time scale. Most plot the Close prices of a symbol; bar charts and candlestick
charts additionally plot the Open, High and Low prices.
Linear time scale means that the every data point that is plotted on the chart can be matched to a specific point in
time, and that those points in time are shown on the horizontal time scale in regular intervals. Some other chart types,
like Point and Figure, Three Line Break, Renko and Kagi charts use a nonlinear representation of time, which is to
say that a data point can typically not be matched exactly to one point in time, and that some periods may pass
without any data being plotted on the screen at all. This will never be the case in Finance charts: For every period
where trading occurred, a data point will be added to the chart. For example, if you use a 10-minute bar chart, a new
bar will be drawn every ten minutes. For details about different data compressions, see Changing the Data
Compression on page 175.
Note
The above is not true when you use a tick-based compression (Tickbar) in your chart, as this kind
of data compression can’t use a linear time scale per definition.
Finance charts do not need specific additional settings; you can however change the colors used in the chart: See
Changing the Line Style on page 219 and Color-Coding Price Relations, Intervals or Trends on page 220.
Line charts
In line charts, only the Close prices of the symbol are shown. Each Close price is plotted as a data point, and the
points are then connected with a continuous, smoothed line.
This is the most basic chart type. It offers a simple, uncluttered view of the price development of a symbol.
Charting
178
TeleTrader Software GmbH
Marc-Aurel-Straße 10-12, 1010 Vienna, Austria
E-Mail [email protected]
Internet http://professional.teletrader.com
Bar charts
In bar charts, the Open, High, Low and Close prices of a symbol are shown. Each data point consists of these four
prices. The High and Low prices are at the upper and lower boundaries of a bar. The Open price is shown at the left
side of the bar, and the Close price at the right side.
This chart type is widely used. It offers more information about the price development of a symbol than the line chart
in a condensed view.
Candlestick charts
Candlestick charts, like bar charts, also show the Open, High, Low and Close prices of a symbol. A candlestick
consists of a body, that is drawn between the Open and Close prices, an upper shadow (High) and a lower shadow
(Low). The body is green if the Close price is higher than the Open price, and red if the Close price is lower than the
Open price. If the Open and Close prices are equal, the candlestick has no body and is shown in a different color.
th
Candlestick charts were originally used in Japan since the 18 century. They have since become very popular. In
essence, the show the same information as a bar chart, but in a different visual format. With candlestick charts, you
can look for chart patterns like the Hammer or the Morning Star (for details about the available studies, consult the
Study Reference).
Point charts
Point charts plot the Close prices of a symbol as points. This chart type is similar to the line chart, in that each Close
price is plotted as a data point. In contrast to line charts, the separate data points are not connected with a line.
Charting
179
TeleTrader Software GmbH
Marc-Aurel-Straße 10-12, 1010 Vienna, Austria
E-Mail [email protected]
Internet http://professional.teletrader.com
This chart type offers the same information as a line chart. It does not add any data to form a line, though.
Histogram charts
Histogram charts show the Close prices of a symbol as vertical columns.
This chart type offers the same information as a line or point chart in a different visualization.
Stair Step charts
In stair step charts, the Close prices of a symbol are plotted as steps. This chart type is similar to the line chart,
except that the data points are connected with rectangular lines (steps) instead of a smoothed line.
This chart type offers the same information as a line, point or histogram chart in a different visualization.
Charting
180
TeleTrader Software GmbH
Marc-Aurel-Straße 10-12, 1010 Vienna, Austria
E-Mail [email protected]
Internet http://professional.teletrader.com
Point and Figure Charts
In Point and Figure charts, the prices of a symbol are plotted in columns of X’s and O’s. Rising prices are plotted as
X’s, whereas falling prices are plotted as O’s.
A new additional "box" (X or O) in an existing column is only plotted when the price moves at least as much as the
box size that can be configured freely for each symbol. Each column can only contain either X’s or O’s. A column
therefore signifies a trend in one direction (X’s show an upwards trend, O’s show a downwards trend).
A new column is always drawn in the opposite direction. For example, if the last column contained only X’s, the next
column will contain O’s. Before a new column can be drawn, a reversal must take place. This means that the price
must move into the opposite direction for at least the reversal amount. The reversal amount is measured in numbers
of boxes, for example a reversal amount of 3 means that the price must drop for at least three times the box size
before a new column of O’s will be established. In other words, until a new column would not hold at least 3 boxes, it
is not drawn in this example.
A Point and Figure chart therefore does not show a linear representation of time. If the price movements are small
and the box size is large, it can take a longer time before a new box in either direction is drawn. A trend reversal takes
even longer, but is therefore also more significant as soon as it shows on the Point and Figure chart.
You can use different data compressions in a Point and Figure chart (daily, intraday, ticks etc.): At the end of each
period, the price change of the previous period is determined, and new boxes or columns are added to the chart only
if the price changes are significant enough to justify this, according to the rules outlined above. For example, if you
use a 5-minute Point and Figure chart, Professional will look at the High and Low prices of the 5-minute interval and
eventually add new boxes to the chart if there have been significant price moves. Therefore, a 5-minute Point and
Figure chart looks differently than a daily Point and Figure chart, for example.
Tip
We recommend to change the chart properties setting under General > Time Region to a fixed
period when using Point and Figure charts. If you use a dynamic time region, for example a fixed
number of records, the Point and Figure chart will be recalculated every time a new record is
added and the oldest record is taken out of the chart. Therefore, the display of historical data in the
chart could vary over time, as it also depends on the initial data in the chart. Use the option Period
(from-to) to avoid this.
To change the box size and reversal amount
▪
Right-click on the Point and Figure chart and choose Properties.
▪
On the left side of the dialog, select the name of the chart pane, the name of the symbol and then Display. For
example: Pane 1 > DAX > Display.
Charting
181
TeleTrader Software GmbH
Marc-Aurel-Straße 10-12, 1010 Vienna, Austria
E-Mail [email protected]
Internet http://professional.teletrader.com
▪
On the right side of the dialog, clear the Auto Box Size check box so that you can enter your own box size.
Note
When the Auto Box Size feature is activated, it always chooses a reasonable box size
automatically, depending on the symbol, the data compression, and the loaded data records.
▪
In the Box Size field, enter the value that the price has to move before a new box is added to the chart.
▪
In the Reversal field, change the reversal amount by clicking the up or down arrows to the number of boxes that
the price has to move into the opposite direction before a reversal takes place.
Note
You can save your settings as default for the current symbol and data compression by clicking the
Set As Default button.
Three Line Break Charts
Three Line Break charts are similar to Point and Figure charts. Like them, they are plotted independent of time, which
is why the time scale on these types of charts is not shown in a linear way. The prices of a symbol are displayed as
rising and falling columns, the so-called lines.
New lines into the same direction are added only if the Close price of the chosen period (for example, the closing
price of the day for daily charts) exceeds the previous high for rising lines, or drops below the previous low for falling
lines. If no new highs or lows are reached, nothing is drawn on the chart for that day (or other chosen period – see
also Changing the Data Compression on page 175).
A reversal into the opposite direction (for example, a new falling line if the previous line was rising) can only take
place when the price for that period exceeds the highs of the three previous lines (reversal from falling to rising lines)
or drops below the lows of the three previous lines (reversal from rising to falling lines). This is the reason why this
type of chart is called "Three Line Break".
In comparison with Point and Figure charts, the Three Line Break chart has the advantage that there is no fixed
reversal amount. Rather, the reversal limit is taken from the past price development dynamically. Like in Point and
Figure charts, new trends reveal themselves late, but the signals generated by a Three Line Break chart can be more
significant than the ones given by a classic bar chart, for example.
Three Line Break charts were originally developed and used in Japan. To find more detailed information about them,
see for example Steve Nison: Beyond Candlesticks. John Wiley & Sons, 1995.
Charting
182
TeleTrader Software GmbH
Marc-Aurel-Straße 10-12, 1010 Vienna, Austria
E-Mail [email protected]
Internet http://professional.teletrader.com
Tip
We recommend to change the chart properties setting under General > Time Region to a fixed
period when using Three Line Break charts. If you use a dynamic time region, for example a fixed
number of records, the Three Line Break chart will be recalculated every time a new record is
added and the oldest record is taken out of the chart. Therefore, the display of historical data in the
chart could vary over time, as it also depends on the initial data in the chart. Use the option Period
(from-to) to avoid this.
Renko Charts
Renko charts are plotted with so-called bricks (rising or falling boxes). They are similar to Point and Figure charts, as
they also do not show a linear representation of time and are used with different (configurable) brick sizes.
Every brick on a Renko chart has the same size, independent of rising or falling prices. A new brick is drawn when the
price of a symbol changes by more than the brick size in the chosen period of time (for example during a day for daily
charts, or 10 minutes for intraday charts – see also Changing the Data Compression on page 175). If prices change
several times the brick size, then as many bricks as needed to show the price movement are plotted on the chart for
this period. If the price change is smaller than the brick size, then nothing is drawn for this period. The appropriate
brick size is initially determined automatically, but can later be changed in the chart properties.
A movement into the opposite direction (reversal) takes place when the price moves one brick down from the
previous (rising) brick. Unlike Point and Figure or Three Line Break charts, the Renko chart does not have additional
reversal conditions. Therefore, a reversal can happen faster than in those chart types, but there can be also more
false signals. Renko charts are primarily used in trending markets.
Renko charts were originally developed and used in Japan. To find more detailed information about them, see for
example Steve Nison: Beyond Candlesticks. John Wiley & Sons, 1995.
To change the brick size
▪
Right-click on the Renko chart and choose Properties.
▪
On the left side of the dialog, select the name of the chart pane, the name of the symbol and then Display. For
example: Pane 1 > DAX > Display.
▪
On the right side of the dialog, choose Price Step to enter the absolute value that the price has to move before a
new brick is added to the chart, or choose Percentage to enter the brick size as a percentage.
Note
Charting
You can save your settings as default for the current symbol and data compression by clicking the
Set As Default button.
183
TeleTrader Software GmbH
Marc-Aurel-Straße 10-12, 1010 Vienna, Austria
E-Mail [email protected]
Internet http://professional.teletrader.com
Kagi Charts
Kagi charts are plotted with vertical and horizontal lines. The vertical lines show the direction of a price movement,
and the horizontal lines show a reversal.
As long as the price does not change direction, the Kagi line is drawn into the same direction (up or down) as new
prices come in. When the price changes direction, a reversal takes place only when the price change exceeds the
filter amount. At each reversal, a horizontal line is added to the chart and the line continues vertically into the new
direction.
In addition, a Kagi line can be thick or thin. If a Kagi line is thin, it will change to a thick line when the price moves
above the previous high (shown by the horizontal line at the reversal). If a thick Kagi line falls below the previous low,
the line turns thin again. The change from a thick to a thin line is generally thought to generate a sell signal, whereas
the change from a thin to a thick line generates a buy signal.
Like Point and Figure charts, as well as Three Line Break and Renko charts, the Kagi charts are plotted independent
of time. If in the chosen period (data compression) the price change is not enough to either continue the current line
or cause a reversal, then nothing will be drawn on the chart. Therefore, it is important what filter amount is chosen for
reversals. Initially, this value is set automatically according to the symbol displayed in the chart document, but you
can of course change it in the chart properties.
Kagi charts were originally developed and used in Japan. To find more detailed information about them, see for
example Steve Nison: Beyond Candlesticks. John Wiley & Sons, 1995.
Tip
We recommend to change the chart properties setting under General > Time Region to a fixed
period when using Kagi charts. If you use a dynamic time region, for example a fixed number of
records, the Kagi chart will be recalculated every time a new record is added and the oldest record
is taken out of the chart. Therefore, the display of historical data in the chart could vary over time,
as it also depends on the initial data in the chart. Use the option Period (from-to) to avoid this.
To change the filter amount
▪
Right-click on the Kagi chart and choose Properties.
▪
On the left side of the dialog, select the name of the chart pane, the name of the symbol and then Display. For
example: Pane 1 > DAX > Display.
▪
On the right side of the dialog, choose Price Step to enter the absolute value that the price has to move into the
opposite direction before a reversal takes place, or choose Percentage to enter the filter amount as a
percentage.
Charting
184
TeleTrader Software GmbH
Marc-Aurel-Straße 10-12, 1010 Vienna, Austria
E-Mail [email protected]
Internet http://professional.teletrader.com
Note
You can save your settings as default for the current symbol and data compression by clicking the
Set As Default button.
Heikin Ashi Charts
Heikin Ashi charts are constructed very similar to candlestick charts. The difference is that instead of the normal
Open, High, Low and Close prices, like in a candlestick chart, the Heikin Ashi chart uses transformations of these
prices. The plotting with this transformed prices is then done in the same way as for normal candlestick charts (see
Finance Charts on page 178).
The Heikin Ashi transformations also use values from the previous candle:
Heikin Ashi Value
Transformation
Description
H-Close
(Open+High+Low+Close)/4
Average price of the current candle
H-Open
(Open[1] + Close[1])/2
Midpoint of the previous candle
H-High
Max(High, H-Open, HClose)
Highest value of the given list
H-Low
Min(Low, H-Open, H-Close)
Lowest value of the given list
Because it also uses past data for calculating the current candle, a Heikin Ashi chart reacts a bit slower as a normal
candlestick chart. On the other hand, it can be read more easily because an uptrend shows only candles with an
unfilled body, and a downtrend only candles with a filled body.
The usual candlestick patterns also apply to Heikin Ashi charts. In addition, it is believed that unfilled candles with no
lower shadow signal a strong uptrend, and filled candles with no upper shadow signal a strong downtrend.
Changing the Type of the Price Scale
You can choose what type of price scale is used in a chart pane: An arithmetic, logarithmic or percentage scale.
Each chart pane can have a different type of price scale.
Note
Charting
You cannot change the type of the second price scale.
185
TeleTrader Software GmbH
Marc-Aurel-Straße 10-12, 1010 Vienna, Austria
E-Mail [email protected]
Internet http://professional.teletrader.com
To change the type of the price scale
▪
Click on the arrow next to the Chart Type icon in the Chart toolbar.
▪
Choose the scale type that you want to use:
Linear Price
Use an arithmetic scale that is divided into units of equal distance. This scale
is useful to represent absolute increments of change.
Logarithm Price
Use a logarithmic (or ratio) scale that is divided into units where the ratio
difference between two numbers is always represented by the same
distance. This scale is useful because equal distances on the scale
represent an equal percentage change.
Linear Percentage
Use a percentage scale that displays the performance of a symbol relative to
a starting point. The first loaded Close price of the symbol represents 0%. All
later price developments are shown as percentages relative to this starting
point. You can set a different starting point.
Note
You can also change the type of the vertical scale in the Chart Properties dialog: Choose the
name of the chart pane, and then V.Scale > Type. For example: Pane 1 > V.Scale > Type.
To set a starting point at a specific date / time for charts with a percentage scale
▪
Click on the Set Vertical Scale Zero Point icon in the Drawing toolbar:
▪
The mouse pointer changes:
▪
Click on the chart at the date / time that you want to use as the starting point for the relative performance of all
inserted symbols. This date / time is now the common zero point for the relative performance of all symbols in
this chart.
To set a starting point at a specific price for charts with a percentage scale
▪
Click on the Set Vertical Scale Zero Point icon in the Drawing toolbar. The mouse pointer changes.
▪
Click on the chart near the position where you want to set the starting point and hold the mouse button down.
▪
While holding the mouse button, use the following keyboard commands to set the starting point at a precise
price:
O
Open price of this bar / column
H
High price of this bar / column
L
Low price of this bar / column
C
Close price of this bar / column
To set a starting point at any price level for charts with a percentage scale
▪
Click on the Set Vertical Scale Zero Point icon in the Drawing toolbar. The mouse pointer changes.
Charting
186
TeleTrader Software GmbH
Marc-Aurel-Straße 10-12, 1010 Vienna, Austria
E-Mail [email protected]
Internet http://professional.teletrader.com
▪
Press and hold the CTRL key.
▪
Click on the chart at the price level where you want to set the starting point.
▪
Release the CTRL key.
Inserting, Overlaying and Changing Symbols in a Chart
A chart can display more than one symbol. You can insert additional symbols into separate chart panes, or overlay
them in the same chart pane. You can also change or replace the symbol that is displayed in a chart.
If you later want to remove one of the additionally inserted symbols, you can do so by removing them from the chart
(see Removing Symbols on page 76), or temporarily hiding them (see Customizing Chart Objects on page 233).
To insert a symbol in an additional chart pane
▪
Right-click in the chart pane below which the symbol should be inserted and choose Insert > Symbol.
▪
In the Symbol Search dialog, enter your search term in the first field on the left side and change the search
settings, if necessary. For more information, see Searching for Securities in the Symbol Search Dialog on page
34.
▪
Click on the green button or press the ENTER key to start the search.
▪
Select the symbol that you want to insert.
▪
Click OK. The symbol is inserted in a new pane below the selected chart pane.
Note
If the chart pane that you have selected in the first step is empty (contains no symbols or other
chart objects), then the new symbol is inserted into the active empty pane instead of into a new
pane.
To overlay an additional symbol in the same chart pane
Note
You can also create a chart with overlaying symbols by for example selecting several symbols in a
price page and holding the CTRL key while opening them: See Opening Symbols from Existing
Documents on page 66 for details.
▪
Right-click in the chart pane into which the additional symbol should be inserted and choose Insert > Overlay.
▪
In the Symbol Search dialog, enter your search term in the first field on the left side and change the search
settings, if necessary. For more information, see Searching for Securities in the Symbol Search Dialog on page
34.
▪
Click on the green button or press the ENTER key to start the search.
▪
Select the symbol that you want to insert.
▪
Click OK. The symbol is inserted in the same chart pane, overlaying with the already displayed symbols. The
overlaid symbols share the vertical price scale.
Note
Charting
If the prices of the overlaying symbols differ too much from each other to be displayed reasonably
on the same price scale, you can connect some of the overlaid symbols to the second price scale,
which will be displayed on the left side of the chart. See Inserting a Second Price Scale on page
228.
187
TeleTrader Software GmbH
Marc-Aurel-Straße 10-12, 1010 Vienna, Austria
E-Mail [email protected]
Internet http://professional.teletrader.com
Note
When the option Activate study color inheritance on overlaid charts is selected under Tools >
Options > Chart, coloring for all symbols in a chart pane will change from Multi Color to Single
Color mode as soon as a chart contains overlaid symbols. This means, that regardless of selected
chart type: e.g. Candlestick, OHLC, Line etc. each data series will be displayed with only one color.
See Chart Settings on page 340.
To change the symbol in a chart
There are several possibilities to change or replace the symbol that is displayed in a chart:
▫
Overwrite the symbol with a new symbol: Just start typing in the chart pane of the symbol. For details, see Calling
Symbol Search from a Document on page 41.
Note
If the chart pane contains more than one symbol, the first symbol will be replaced.
▫
Use the Change Symbol dialog, see Changing Symbols on page 73.
▫
Copy a symbol from another document with drag and drop to replace the current symbol. You have to drop the
new symbol exactly on the existing symbol to replace it – the mouse pointer will lose the plus sign in this case.
For details, see Copying Symbols on page 75.
To copy a symbol to a chart from other documents
See Copying Symbols on page 75. You can of course also copy symbols between charts.
Note
When you drop a symbol on a chart, it will be overlaid if you release the mouse button inside a
chart pane, and inserted when you release the mouse button on a pane header. If you drop it
exactly on an existing symbol, this symbol will be replaced by the new symbol.
Comparing the Performance of Overlaid Symbols
You can easily compare the performance of two or more symbols by using chart overlays and a percentage price
scale.
Charting
188
TeleTrader Software GmbH
Marc-Aurel-Straße 10-12, 1010 Vienna, Austria
E-Mail [email protected]
Internet http://professional.teletrader.com
To compare several overlaid symbols with the percentage price scale
▪
Overlay several symbols in one chart pane with the command Insert > Overlay, for example some stocks and
their index. See Inserting, Overlaying and Changing Symbols in a Chart on page 187 for details.
▪
Click on the arrow next to the Chart Type icon in the Chart toolbar and choose the scale type Linear
Percentage:
▪
Now, set a common starting point for the relative performance of all overlaid symbols. Click on the Set Vertical
Scale Zero Point icon in the Drawing toolbar:
▪
Click on the chart at the date / time that you want to use as the starting point for the relative performance of all
inserted symbols. This date / time is now the common zero point for the comparison, which means that the
relative performance of all overlaid symbols is calculated starting from this date / time.
Inserting a Chartable Expression
A chartable expression is a mathematical calculation that is plotted on the chart as a line, using one or more values
from one or more symbols. You can use chartable expressions to convert the prices of a security to another currency,
transform the prices to another value (for example, multiply them by a fixed value), or even create simple studies (like
a typical price line).
Chartable expressions use symbols that are displayed on the current chart. Additionally, you can use existing studies
and expressions when creating a new expression. Before you insert an expression, make sure that all symbols,
studies and expressions that you want to use are present in the chart (it’s ok if they are hidden, see Customizing
Chart Objects on page 233). When you insert a chartable expression, you can choose operators and symbols from
pop-up lists or add operators and numbers to your expression manually.
As there are many possible uses for expressions, we will introduce them with a simple example. For more details
about the syntax of chartable expressions, see Syntax of Chartable Expressions on page 192.
To insert a chartable expression – an example
This chartable expression divides the Dow Jones Industrial Average index by the EURUSD exchange rate.
▪
Make sure that both the Dow Jones Industrial Average (DJIA) and EURUSD rate are inserted into the chart. See
also Inserting, Overlaying and Changing Symbols in a Chart on page 187.
▪
In the chart pane where you want to insert the expression, type an equal sign = .
▪
In the list that appears, double-click your first symbol, the DJIA.
Charting
189
TeleTrader Software GmbH
Marc-Aurel-Straße 10-12, 1010 Vienna, Austria
E-Mail [email protected]
Internet http://professional.teletrader.com
▪
In the field list, double-click the CLOSE field. You can scroll the list to reveal more fields and basic operators.
▪
Type the / operator.
▪
Double-click your second symbol in the symbol list, the EURUSD rate, and then double-click the CLOSE field in
the field list.
▪
Press the ENTER key. The expression is now added to your chart (shown as a yellow line below). You can change
the appearance of this line: See Changing the Appearance of Chartable Expressions on page 200 for details.
To insert a chartable expression based on a study – an example
This chartable expression shows the difference between the Dow Jones Industrial Average index close price and the
Moving Average Simple study.
▪
Make sure that Dow Jones Industrial Average (DJIA) and Moving Average Simple study are inserted into the
chart.
▪
In the chart pane where you want to insert the expression, type an equal sign = to start the chartable expression.
▪
In the list that appears, double-click the symbol name, Dow Jones Industrial Average (DJIA).
Charting
190
TeleTrader Software GmbH
Marc-Aurel-Straße 10-12, 1010 Vienna, Austria
E-Mail [email protected]
Internet http://professional.teletrader.com
▪
In the field list, double-click the CLOSE field.
▪
Continue creating your expression by selecting the minus operator – and then double-click the MOVS(21,0) field.
▪
After you have finished writing the expression, press the ENTER key. The expression is now added to your chart
(sown as a red line below).
Note
Once you created the expression, you can use it as an input value for other chartable expressions.
To edit a chartable expression
▪
Right-click the chartable expression line and choose Properties.
▪
In the Chart Properties dialog, click the name of the expression.
▪
Edit the calculations in the field Chartable Expression. See also Syntax of Chartable Expressions on page 192.
▪
Click Apply or OK to save your changes.
To delete a chartable expression
▪
Right-click on the line of the expression and choose Delete.
Note
Charting
If you remove one of the symbols that are used in the chartable expression from the chart, the
expression is automatically removed, too.
191
TeleTrader Software GmbH
Marc-Aurel-Straße 10-12, 1010 Vienna, Austria
E-Mail [email protected]
Internet http://professional.teletrader.com
Syntax of Chartable Expressions
A chartable expression can consist of symbols, fields, operators, functions and numbers. The basic steps to insert an
expression are always the same. For more information about the possibilities of chartable expressions, see the
detailed syntax description below.
To insert a chartable expression – basic steps
▪
In the chart pane where you want to insert the expression, type an equal sign = to start the chartable expression.
▪
Do one of the following:
-
In the list that appears, double-click a symbol or a TeleTrader function.
-
Press the ESCAPE or BACKSPACE key to make the list disappear and type parts of the expression manually.
While typing, appropriate functions are recommended automatically. For example, typing an S will show a
list with all functions starting with S.
▪
Continue creating your expression using the syntax described below. Appropriate lists appear after using
symbols, operators or functions.
▪
After you have finished writing the expression, press the ENTER key. The expression is now added to your chart.
Syntax of chartable expressions
Symbols
Symbols are always enclosed in square brackets. To use a symbol in an expression,
type an opening square bracket [ and choose the symbol from the list that appears by
double-clicking it. The symbol list shows the symbols that are already visible in the
chart. The closing square bracket is inserted automatically as soon as you choose the
symbol.
For example:
=[ADIDAS AG O.N. (XETRA)]
You can also manually add symbols that are not yet visible in the chart by typing an
opening square bracket and then the symbol's name. Type a closing square bracket
after the name, and the Symbol Search dialog appears. Choose the appropriate
symbol and click OK. The new symbol is added as a hidden symbol (it is not visible in
the chart), but can be used in the expression.
Fields
For every symbol, you can specify which field should be used for the calculation. A list
with all available fields appears after you enter a symbol – choose the appropriate field
by double-clicking it. The field is added to the symbol using the . (dot) operator (see
below). If you do not specify a field, the CLOSE value is used by default.
For example:
=[ADIDAS AG O.N. (XETRA)].VOLUME
Available fields are:
HIGH
LOW
OPEN
CLOSE
VOLUME
OI (Open Interest)
Operators
Charting
Operators connect symbols with each other or with a constant number. In addition to
the standard mathematical operators, the dot operator is used to specify the field for a
symbol. You can enter operators from the keyboard manually, or choose them from the
operator list when it appears. The operator list always appears directly after you enter a
symbol.
.
Dot operator: Use it directly after a symbol to specify a field value to
use for this symbol.
192
TeleTrader Software GmbH
Marc-Aurel-Straße 10-12, 1010 Vienna, Austria
E-Mail [email protected]
Internet http://professional.teletrader.com
+
Addition
-
Subtraction
/
Division
*
Multiplication
^
Power
()
Round brackets for changing operator precedence of mathematical
operators
Standard operator precedence is the same as for all mathematical calculations:
Brackets – Power – Multiplication and Division – Addition and Subtraction.
TeleTrader Functions
You can use some functions of the TeleTrader Language inside chartable expressions.
The list of available functions is automatically shown at the start of an expression and
after entering a mathematical operator. You can also type the function manually - while
typing, appropriate functions are recommended automatically. For example, typing an S
will show a list with all functions starting with S.
After choosing a function, an opening bracket is inserted and the list of symbols is
shown. You have to close the function brackets manually.
For example:
=MIN([ADIDAS AG O.N. (XETRA)].OPEN,[ ADIDAS AG O.N.
(XETRA)].CLOSE)
For more information about the available functions, see the Function Reference on
page 501.
Numbers
In addition to symbols, you can also use constant numbers in an expression. To use a
number, you have to type it on your keyboard manually. For example, you could
multiply the volume of a symbol by two using the following syntax:
=[ADIDAS AG O.N. (XETRA)].VOLUME*2
You can also create horizontal lines at a certain price level by typing the appropriate
number:
=9500
More examples
=[GOOGLE INC. (NASDAQ)]*3
Multiply the Close price of the Google stock by three.
Note that no field was specified – therefore, the
expression automatically uses the CLOSE field.
=[DAX P-IN. (INDICES XETRA)].CLOSE*
[EUR/USD SPOT (FOREX GTIS BASIC FX
SNAPSHOT)].CLOSE
Multiply the Close price of the DAX symbol with the
EURUSD rate.
=([DOW JONES INDUSTRIAL AVERAGE INDEX
(INDICES DOW JONES)].HIGH+[DOW JONES
INDUSTRIAL AVERAGE INDEX (INDICES DOW
JONES)].LOW+[DOW JONES INDUSTRIAL AVERAGE
INDEX (INDICES DOW JONES)].CLOSE)/3
Add the High, Low and Close for the DJIA and divide it
by three. (This calculation is also called the typical
price, used for example in the Commodity Channel
Index.) Note that you can use the same symbol with
different field values in one expression.
For this rather complex expression, you have to
manually enter round brackets to force the correct
operator precedence.
Besides using the on-the-fly assistant for inserting expressions, you can also insert an expression by manual typing
over the chart area. Typing over the chart area works only if the on-the-fly assistant is disabled. You can enable /
disable the on-the-fly assistant by using the option Turn off automatic display of assistant for chartable
expressions under Tools > Options > Chart > Expressions.
Note
Turn off automatic display of assistant for chartable expressions is activated by default.
By inserting a chartable expression by manual input, it is possible to:
Charting
193
TeleTrader Software GmbH
Marc-Aurel-Straße 10-12, 1010 Vienna, Austria
E-Mail [email protected]
Internet http://professional.teletrader.com
▪
Insert a simple chartable expression (one symbol wih simple numeric operations)
▪
Insert a chartable expression with analysis tools (indicator or study)
▪
Insert a complex chartable expression (using multiple studies with several entities / properties with multiple
numeric operations and with complex tickers)
Chartable expressions entered by manual typing - important characteristics
▪
To insert a chartable expression, enter "=" (equal) sign. This sign is also used to delete a previously typed
expression.
▪
To add an additional expression, without deleting the first one, enter "," (comma) sign, and continue typing an
expression.
▪
To delete existing chartable expression, enter "-" (hyphen) sign, and continue typing an expression.
▪
It is possible to add a new and delete existing chartable expression in a single command.
▪
If a symbol referenced in an expression doesn't exist on a chart, it will be automatically added (and hidden) after
the expression is added by pressing the ENTER key or TAB key. When the symbol is hidden, its name is not visible
in the chart header.
▪
If a symbol ticker (unique symbol name) contains the special character "-", it can be wrongly interpreted as the
mathematical minus operator. Such names must be enclosed with square brackets when entered in an
expression. For instance: Symbol ticker IEC-W1-2, must be entered in expression as [IEC-W1]-2.
▪
If the type of a price (e.g. Open, High, Low or Close) is not defined when the symbol was entered in an
expression, Close price will be automatically used for all symbols referenced in the expression.
▪
If a symbol referenced in an expression cannot be found (i.e. unique name / ticker is not correct), an error
message appears.
Insert simple chartable expression by manual typing
To insert simple chartable expression – an example
▪
Open chart document for PTT symbol
▪
Type =(BBL+SCB+KBANK)/3 and press ENTER key
Charting
194
TeleTrader Software GmbH
Marc-Aurel-Straße 10-12, 1010 Vienna, Austria
E-Mail [email protected]
Internet http://professional.teletrader.com
▪
Expression (BBL+SCB+KBANK)/3 is added to chart and replace PTT symbol, while symbols BBL, SCB and
KBANK are hidden
To insert two simple ratios as chartable expressions – an example
▪
Open chart document for BBL symbol
▪
Type =BBL/SET and press ENTER key
Charting
195
TeleTrader Software GmbH
Marc-Aurel-Straße 10-12, 1010 Vienna, Austria
E-Mail [email protected]
Internet http://professional.teletrader.com
▪
Type ,=SCB/SET and press ENTER key
▪
Both expressions are added to chart
Warning
If you do not enter "," (comma) character before typing second expression, previous expression will
be deleted!
Insert chartable expression with analysis tools by manual typing
Besides using symbols values like Open, High, Low, Close and Volume, you can also use analysis tools (indicators
and studies). As with any manual typing of expressions, this is possible only if On-The-Fly assistant is turned off.
You can insert expression which includes indicator regardless if that indicator is visible or not visible on a chart.
Indicator inserted in expression will be automatically added to chart as hidden object and use compression of the
main chart.
See the syntax for manual typing of expression that include analysis tools (indicators and studies) in the table below:
Function_at(BaseSymbol1UniqueName.FidName,…,BaseSymbolXUniqueName.FidName,Parameter1Value,…,
ParameterXValue).EntityName.PropertyName
Parameter
Description
Function_at
Analysis tool function name (can be found in Study Info / Function field), with
Charting
196
TeleTrader Software GmbH
Marc-Aurel-Straße 10-12, 1010 Vienna, Austria
E-Mail [email protected]
Internet http://professional.teletrader.com
fixed suffix “_at”
BaseSymbolXUniqueName
Unique name(s) of base symbol(s) for the analysis tool
FidName
Open, High, Low or Close. If there is no fid name, Close value is used.
ParameterXValue
Optional value for analysis tool parameters. Parameters should be given in
the order as in Parameters dialog. If trailing parameter(s) are omitted, their
default value(s) are used
EntityName/PropertyName
Entity and property name for analysis tool with several entities, e.g. Bollinger
Bands:
▪
Has two entities: Boll(Area) and Mid(Line).
▪
Each area has two properties: Upper and Lower.
▪
Each line has one property: Value.
▪
Each marker has three properties: Price, Direction and Text.
To insert chartable expression with Moving Average Simple study – an example
▪
Open chart document for any symbol
▪
Type =movs_at(SCB,30,2) and press ENTER key
▪
Moving Average Simple study will be plotted on a chart for SCB symbol, with 30 bar period and 2 bar shift
In the table below, you can see examples for different types of expression formats and studies:
Expression format
Action taken
movs_at(SCB)
Inserts Moving Average Simple for SCB with period=21, shift=0
movs_at(SCB,30)
Unique name(s) of base symbol(s) for the TA
movs_at(SCB,30,2)
Inserts Moving Average Simple for SCB with period=30, shift=2
indCorrelation_at(SCB,PTT,21)
Inserts Correlation for SCB and PTTwith period=21, shift=0
boll_at/(SCB.HIGH,30).Boll.Upper
Inserts Bollinger band TA with SCB base symbol, HIGH fid, period=30, over
Upper value of Boll area of the TA.
Insert chartable expression with analysis tools on overlaid symbols by manual typing
▪
When inserting a study on a chart with overlaid symbols, study will be added for each of available symbols on a
chart. If there is only one symbol with a study on a chart, adding an overlay symbol will automatically add an
additional study based on newly added symbol.
▪
If multiple symbols are displayed on a chart, and each of them has a different study, inserting a new overlay
symbol will automatically add a study like the one applied to the chart main symbol.
▪
If multiple symbols are displayed on a chart, and each of them has a different study, inserting two or more
overlay symbols will automatically add same number of studies like the one applied to the chart main symbol.
To insert chartable expression with Moving Average Simple study on overlaid
symbols
▪
Open chart document with three overlaid symbols: BBL, SCB and KBANK.
▪
Type =movs_at() and press ENTER key.
▪
Moving Average Simple study will be plotted on a chart for all three symbols: BBL, SCB and KBANK, with 30 bar
period and 2 bar shift.
In the table below, you can see examples for different types of expression formats and studies:
Charting
197
TeleTrader Software GmbH
Marc-Aurel-Straße 10-12, 1010 Vienna, Austria
E-Mail [email protected]
Internet http://professional.teletrader.com
Chart setup
Expression format
Action taken
Overlay chart with:
BBL, SCB and
KBANK
,=MOVS_AT()
Inserts Moving Average Simple study for BBL, SCB
and KBANK with period=21, shift=0
Overlay chart with:
BBL, SCB and
KBANK
,=MOVS_AT(,12)
Inserts Moving Average Simple study for BBL, SCB
and KBANK with period=12, shift=0
Overlay chart with:
BBL, SCB and
KBANK
,=MACD_AT(12,15,5)
Inserts MACD study for BBL, SCB and KBANK
with parameters 12, 15, 5
Insert complex chartable expression by manual typing
Besides using simple analysis tools (indicators and studies) with only one entity / property, you can insert expression
based on analysis tools that have two or more entities and properties. As with any manual typing of expressions, this
is possible only if On-The-Fly assistant is turned off.
You can insert expression which include indicator regardless if that indicator is visible or not visible on a chart.
Indicator inserted in expression will be automatically added to chart as hidden object and use compression of the
main chart.
To insert chartable expression with multiple entities / properties – an example
▪
Open chart document for any symbol
▪
Type =move_at(BBL,25)/move_at(SCB,25) and press ENTER key
▪
Ratio of two moving averages based on BBL and SCB symbols will be plotted on a chart
To insert complex chartable expression – an example
▪
Open chart document for any symbol
▪
Type =(SCB.CLOSE+BBL.CLOSE)/(move_at(BBL,25)/move_at(SCB,25)) and press ENTER key
▪
Expression is plotted on a chart based on calculation calculation from expression: (SCB close price + BBL close
price) / (moving average simple with period=25 based on BBL symbol / moving average simple with period=25
based on SCB symbol).
Insert studies by manual typing
Besides inserting expressions based on a study, you can also insert studies by manual typing. This is the same
action, as if you right-click on a chart area and select Insert Study from a contex menu.
To insert study by manual typing – an example
▪
Open chart document for PTT symbol
▪
Type MOVS() or MOVS(PTT) and press ENTER key
▪
Moving Average Symple study for PTT symbol is plotted on a chart
See the syntax for manual typing of analysis tools (indicators and studies) in the table below:
Chart setup
Expression format
Action taken
Overlay chart with:
BBL, SCB and
KBANK
,MOVS()
Inserts Moving Average Simple study for BBL, SCB
and KBANK with period=21, shift=0
Overlay chart with:
BBL, SCB and
,MOVS(BBL)
Inserts Moving Average Simple study for BBL only,
with period=12, shift=0
Charting
198
TeleTrader Software GmbH
Marc-Aurel-Straße 10-12, 1010 Vienna, Austria
E-Mail [email protected]
Internet http://professional.teletrader.com
KBANK
Overlay chart with:
BBL, SCB and
KBANK
,MOVS(BBL,10)
Inserts Moving Average Simple study for BBL only,
with period=10, shift=0
Overlay chart with:
BBL, SCB and
KBANK with SMA
study calculated on
all three symbols
,RSI()
SMA and RSI studies based on BBL, SCB and
KBANK symbols are displayed on a chart.
Note
There are several limitations regarding chartable expression with analysis tools on overlaid
symbols: Multi-base studies (e.g. Correlation) and market breath studies (e.g. Coppock Breadth)
are not currently supported.
Also, inserting the same study on multiple curves (symbols, expressions etc.) is only available by
typing a chartable expression, but not trough Insert Study dialog from a Chart context menu.
Replace existing chartable expression by manual typing
To replace existing chartable expression – an example
▪
Open chart document with three overlaid symbols: PTT, PTTEP and TOP
▪
Add additional symbol by typing BBL,SCB and press ENTER key
▪
BBL and SCB symbols replace PTT, PTTEP and TOP symbols on the chart.
Expression type
Initial Setup
Deletion Typing Command
Outcome
Symbols
PTT, PTTEP, TOP
BBL,SCB
BBL and SCB
BBL,SCB
PTTEP
PTTEP
PTTEP
SET,BBL,PTT
SET, BBL and PTT
Ratios
PTT/SET and
TOP/SET
=BBL/SET,=KBANK/SET
BBL/SET and
KBANK/SET
Studies
First create a study
called MyIndex
BBL/MYINDEX and
SCB/MYINDEX
=KBANK/MYINDEX_AT(SYMBOL),
=BAY/MYINDEX_AT(SYMBOL)
KBANK/MYINDEX and
BAY/MYINDEX
Mix of symbols,
expressions and
studies
ADVANC, SHIN and
INTUCH
=CPN/PROP,=CK/PROP,PROP,SET
CPN/PROP, CK/PROP,
PROP and SET
Add additonal chartable expression by manual typing
To add additional chartable expression – an example
▪
Open chart document with three overlaid symbols: BBL, PTT and SCB
▪
Add additional symbol by typing ,CPF,CPN and press ENTER key
▪
CPF and CPN symbols are added on a chart along with three other symbols: BBL, PTT and SCB.
Expression type
Initial Setup
Deletion Typing Command
Outcome
Symbols
PTT, PTTEP, CPN
,CPF,BBL
PTT, PTTEP, CPN,
Charting
199
TeleTrader Software GmbH
Marc-Aurel-Straße 10-12, 1010 Vienna, Austria
E-Mail [email protected]
Internet http://professional.teletrader.com
CPF and BBL
Ratios
BBL/SET and
CPF/SET
,=PTT/SET,=PTTEP/SET
BBL/SET CPF/SET
PTT/SET PTTEP/SET
Studies
First create a study
called MyIndex
BBL/MYINDEX and
SCB/MYINDEX
,=KBANK/MYINDEX_AT(SYMBOL)
,=BAY/MYINDEX_AT(SYMBOL)
BBL/MYINDEX,
SCB/MYINDEX,
KBANK/MYINDEX,
BAY/MYINDEX
Mix of symbols,
expressions and
studies
BBL/SET, CPF/SET
,=PTT/SET,CPN
BBL/SET, CPF/SET,
PTT/SET and CPN
Delete existing chartable expression by manual typing
To delete existing chartable expression – an example
▪
Open chart document with three overlaid symbols: BBL, PTT and SCB.
▪
Delete two symbols by typing ,-BBL,-PTT and press ENTER key.
▪
Only SCB symbol remains on a chart.
Expression type
Initial Setup
Deletion Typing Command
Outcome
Symbols
PTT PTTEP TOP
,-TOP,-PTTEP
PTT
Ratios
PTTEP/PTT TOP/PTT
PTT/SET KTB/SET
,-=TOP/PTT,-=PTT/SET
PTTEP/PTT and
KTB/SET
Studies
First create a study
called MyIndex
BBL/MYINDEX
,-=BANK/
MYINDEX_AT(SYMBOL),-=BAY/
MYINDEX_AT(SYMBOL)
BBL/MYINDEX and
SCB/MYINDEX
Mix of symbols,
expressions and
studies
PTTEP/PTT KTB/PTT
PTTEP KTB,SET
,-=PTTEP/PTT,-SET
KTB/PTT and KTB
Warning
Symbols that are used for calculating the expressions (such as ratios), are set to hidden mode. If
you execute deletion command which contains a symbol that is used for calculating an expression,
this expression will also be removed, because its base symbol does not exist anymore.
For example, if you have PTT/SET,BBL expression displayed on a chart, and execute deletion
command ,-=SET only BBL symbol will remain on the chart.
Simultaneous adding and deleting a chartable expression by manual typing
To add and delete a chartable expression – an example
▪
Open chart document with three overlaid symbols: BLA, PTT and SCB.
▪
Enter chartable expression command ,-BLA,BBL and press ENTER key.
▪
BLA is removed from a chart while BBL is added on a chart along with two existing symbols: PTT and SCB.
Changing the Appearance of Chartable Expressions
A chartable expression is displayed on the chart as a single line. You can change its display type, width, style and
color.
Charting
200
TeleTrader Software GmbH
Marc-Aurel-Straße 10-12, 1010 Vienna, Austria
E-Mail [email protected]
Internet http://professional.teletrader.com
To change the appearance of a chartable expression
▪
Right-click on the chartable expression line and select Properties.
▪
On the left side of the Chart Properties dialog, select Studies, the name of the Expression and then
Appearance. For example: Studies > Expression1 > Appearance.
▪
On the right side of the dialog, adapt the default settings to your needs.
Control
Description
Pane
Chart pane that the chartable expression is displayed in
Display Type
Display type of the line:
Line
Histogram
Points
Steps
Weight
Width of the line
Style
Style of the line
Color
Color of the line and of the expression name
Automatically use alternate
color for subsequent inserts of
the same study
Check to automatically use a new line color if this expression is later inserted
again into the same chart pane.
Uncheck to use the default line color every time this expression is inserted
into the same chart pane.
Using Keyword Commands in Charts
Keyword commands are typed commands that are entered in the same way as chartable expressions (by just typing
the command into the active chart document). They are used for easier manipulation of charts, for example to change
the chart type, compression and time region. Each keyword command can be entered either as a full keyword, or by
typing the appropriate keyword abbreviations. For example: To reset the chart to default settings, you can type
.RESET or .RE and press the ENTER key.
Note
Charting
When entering keyword commands, you have to enter the minimum number of characters required
for that specific command to be executed. For example, in order to execute the RESET command,
you can type any number of characters from the minimum up to the whole command: .RE, .RES,
.RESE or .RESET.
201
TeleTrader Software GmbH
Marc-Aurel-Straße 10-12, 1010 Vienna, Austria
E-Mail [email protected]
Internet http://professional.teletrader.com
Keyword commands in charts – important characteristics
▪
Keyword commands are not case sensitive. This means that keyword commands can be typed as .RESET or
.reset.
▪
All keyword commands must start with a point. Typing just RESET without the point instead of .RESET will
trigger a smart symbol search instead of resetting the chart.
To enter the RESET keyword command on a chart – an example
▪
Make sure that at least one chart document is open.
▪
In the chart, just type the keyword abbreviation, for example .RE.
▪
Press the ENTER key. The command is executed and the chart resets to its default settings.
List of keyword commands
Keyword command
Minimal command
abbreviation
Action taken
.RESET
.RE
Resets chart to its default settings.
.QQ
.QQ
Opens the Quick Quote document for the main symbol on
the chart using default template.
If there are multiple panes in a chart, Quick Quote
document opens for the main symbol of the pane in which
the typing was performed.
.T&S
.TS
Opens the Time and Sales document for the main symbol
on the chart.
If there are multiple panes in a chart, Time and Sales
document opens for the main symbol of the pane in which
the typing was performed.
.NEWS
.NE
Opens the News document using default template.
.CANDLE
.CA
Changes the chart type to Candlestick
.BAR
.BA
Changes the chart type to Bar
.LINE
.LI
Changes the chart type to Line
.POINT
.PO
Changes the chart type to Point
P&F
.PF
Changes the chart type to Point and Figure
.HISTOGRAM
.HI
Changes the chart type to Histogram
.STAIR
.ST
Changes the chart type to Stair Step
.3LB
.3L
Changes the chart type to Three Line Break
Charting
202
TeleTrader Software GmbH
Marc-Aurel-Straße 10-12, 1010 Vienna, Austria
E-Mail [email protected]
Internet http://professional.teletrader.com
.RENKO
.REN
Changes the chart type to Renko
.KAGI
.KA
Changes the chart type to Kagi
.HEIKIN
.HEI
Changes the chart type to Heikin Ashi
.LOG
.LO
Changes the vertical scale to Logarithm Price mode
.LINEAR
.LIN
Changes the vertical scale to Linear Price mode
.PERCENT
.PE
Changes the vertical scale to Linear Percentage mode
Changing chart compression by manual typing
Typing command
Action taken
.0
.1
.2
Change compression to Tick by Tick
Change compression to 1 Minute
Change compression to 2 Minute
Allowed intraday compressions are 1, 2, 3, 4, 5, 6, 10, 12, 15, 20, 30 and 60
Minutes
.3T
.5T
Change compression to 3 Ticks
Change compression to 5 Ticks
Allowed tickbar compressions are 3, 5, 10, 15, 20, 30, 50 and 100 ticks per
bar
.2H
.3H
Change compression to 2 Hours
Change compression to 3 Hours
Allowed hourly compressions are 2, 3, 4, 6, 8, and 12 hours per bar
.D
Change compression to Daily
.W
Change compression to Weekly
.M
Change compression to Monthly
Defining chart time region by manual typing
Typing command
Action taken
.ALL
Chart download all available data history for symbol(s) on a chart. It is the
same action as if you select All radio button under Chart Properties > Time
region sheet.
.LAST 5M
.LAST 5H
.LAST 5D
.LAST 5W
.LAST 5MON
Chart download the last 5 Minutes of intraday or tick data.
Chart download the last 5 Hours of intraday or tick data.
Chart download the last 5 Days of daily, intraday or tick data.
Chart download the last 5 Weeks of weekly, daily, intraday or tick data.
Chart download the last 5 Months of monthly, weekly, daily, intraday or tick
data.
These are the same action as if you select Last radio button and define time
region under Chart Properties > Time region sheet.
Note: Command will be executed only if chart compression matches the time
period defined by command. For instance: In order to execute .LAST 5D
command, chart compression must be daily, intraday or tick data.
.RECORDS 123 or .RECORD
123
Chart download the last 123 records of data in the current chart
compression.
It is the same action as if you select Records radio button and enter 123
under Chart Properties > Time region sheet.
Charting
203
TeleTrader Software GmbH
Marc-Aurel-Straße 10-12, 1010 Vienna, Austria
E-Mail [email protected]
Internet http://professional.teletrader.com
.FROM 8/8/11 TO 8/8/12
Chart download all the records in the current chart compression from Aug 8
th
2011 till Aug 8 2012.
Supported formats are: MM,DD,YYYY, MM/DD/YY or M/D/YY.
th
It is the same action as if you select Period (from-to) radio button and define
starting and ending dates under Chart Properties > Time region sheet.
.BEFORE 8/8/11
Chart download all the available records in the current chart compression
th
th
before Aug 8 2011. The bar for Aug 8 2011 is the first bar displayed on the
far right of the chart.
It is the same action as if you select Period (from-to) radio button and define
ending date under Chart Properties > Time region sheet.
.AFTER 8/8/11
Chart download all the available records in the current chart compression
th
th
after Aug 8 2011. The bar for Aug 8 2011 is the first bar displayed on the
far left of the chart.
It is the same action as if you select Period (from-to) radio button and define
starting date under Chart Properties > Time region sheet.
Navigating and Organizing a Chart
As most charts with some historical data cannot be reasonably displayed in detail as a whole on the computer screen,
the most current data is shown by default. You can scroll to display older data with the scrollbar at the bottom of the
chart window.
If you want to see more details for a specific section of a chart, you can zoom into a section of a chart, based on a
certain date / time range, a number of bars or manual selection. You can also scale the time series to the screen, so
that you can see a wider or narrower price range (vertical scaling), or expand / compress the time scale (horizontal
scaling).
To quickly jump to certain points in a bigger chart, you can define bookmarks at certain points in time and use them
for chart navigation. To quickly jump to the beginning or end of a chart, click the Data View button
and choose the
option Chart beginning or Chart end. The Data View button is located in the lower right corner of every chart and
offers several useful options to zoom and navigate a chart.
If you have many symbols and/or other chart objects, like drawing objects or studies, that should be displayed in one
chart document, you can organize them into several panes. A chart pane is a section of a chart that holds symbols,
studies and other objects. Every chart consists of at least one chart pane. You can also define several sheets in a
chart to organize its content. Chart sheets can also be used in combination with the chart window split to for example
display several data compressions in one chart at once.
Zooming a Section of a Chart
You can enlarge a section of the chart to see more details of the time series and other chart objects. When you zoom
into a chart, you can either manually choose the section that should be enlarged with the Zoom In tool, or choose a
specific date / time range or number of bars that should be enlarged with the Data View button. You can of course
also zoom out of the chart again or reset the chart to its default settings.
For other ways to expand, compress or vertically scale the time series, see also Scaling the Time Series to the
Screen on page 206.
To zoom into a section of a chart
▪
Click on the Zoom In icon on the Chart toolbar:
▪
The mouse pointer changes:
Charting
204
TeleTrader Software GmbH
Marc-Aurel-Straße 10-12, 1010 Vienna, Austria
E-Mail [email protected]
Internet http://professional.teletrader.com
▪
Click on the chart at the starting point of the section that you want to magnify, and hold the mouse button down.
▪
Move the mouse pointer to the end point of the section and release the mouse button.
Note
The Zoom In tool will stay active as long as you do not use another tool. To deactivate it, click on
the Zoom In icon again, or press the ESC key on your keyboard.
Instead of using the Zoom In tool, you can also click on the time scale of a chart to zoom into it.
To zoom into a date (time) range of a chart
▪
Click the Data View button
▪
In the Zoom dialog, select the start and end dates (or times) of the section that you want to magnify.
▪
To choose a date from the calendar, click on the arrow next to the dates in the From and To fields, or type the
date into the fields.
▪
To choose a time, click on the element of the time field that you want to change (hours, minutes or seconds).
Then, change it with the arrows on the right, or type the new time into the field.
▪
Click OK to magnify the date / time range that you have specified.
Note
Charting
and choose Zoom.
The time field is only available in intraday charts. If you choose a combination of start dates and
end dates (or times) that is not valid (for example because the end date is before the start date),
the specified section will not be magnified.
205
TeleTrader Software GmbH
Marc-Aurel-Straße 10-12, 1010 Vienna, Austria
E-Mail [email protected]
Internet http://professional.teletrader.com
To zoom into a section with a fixed number of bars (candles, columns etc.)
▪
Click the Data View button
▪
A text field is shown. Enter the number of bars (or candles, Point and Figure columns etc.) that you want to see
on your screen.
▪
Press the ENTER key. A section with the specified number of bars is magnified.
and choose Number of bars.
To zoom out of a chart
▪
Click on the Zoom Out icon on the Chart toolbar:
▪
The chart will be scaled down by one step. You can zoom out as often as you have zoomed into a chart.
Note
This tool can only be used when you have magnified (zoomed into) a section of the chart first.
Instead of using the Zoom Out tool, you can also hold the CTRL key and click on the time scale of
the chart.
To reset the chart to its defaults (zooming, scaling and margins)
▪
Click the Data View button
and choose Chart reset.
Scaling the Time Series to the Screen
In addition to zooming (see Zooming a Section of a Chart on page 204), you can also adjust the vertical and
horizontal scaling of a chart.
Vertical scaling
You can set the vertical scaling to dynamically adapt to the section of the time series that is shown on the screen, or
to relate to the fixed maximum and minimum points of the loaded historic data. You can also move the time series
freely on the screen by dragging it up or down.
To vertically scale the time series to the screen
▪
Click on the Adjust Screen Mode icon
on the Chart toolbar to toggle between the two following settings:
Scale visible time series
Only the part of the time series that is visible on the screen is taken into account for
vertical scaling. When you scroll the chart to the left or right with the scrollbar, the
scaling is adjusted dynamically so that the maximum of the visible time series is
always at the top of the chart, and the minimum of the visible time series is at the
bottom of the chart.
This is the default setting.
Scale entire time series
The entire loaded time series is taken into account for vertical scaling, including
historic data that might not be visible at the moment. When you scroll the chart to
the left or right with the scrollbar, the scaling does not change, as the size of the
vertical scale has been determined already by using the maximum and minimum of
the entire time series.
This setting might lead to blank spaces at the top or bottom of the visible part of the
chart, especially when you load a lot of historic data to your chart.
Charting
206
TeleTrader Software GmbH
Marc-Aurel-Straße 10-12, 1010 Vienna, Austria
E-Mail [email protected]
Internet http://professional.teletrader.com
Note
For more information about the vertical scaling of a chart, see Changing the Scaling of the Price
Scale on page 229.
To move the time series on the screen with drag and drop
▪
Click on the Free Hand icon on the Drawing toolbar:
▪
The mouse pointer changes:
▪
Click on the chart, hold the mouse button down and drag the chart into any direction. The time series is
positioned on the screen accordingly.
Note
The Free Hand tool will stay active as long as you do not use another tool. To deactivate it, click
on another tool icon, or press the ESC key on your keyboard. When you save a chart while the
Free Hand tool is active, this setting will be saved as well.
Horizontal scaling
You can adjust the horizontal scaling by expanding or compressing the time series (similar to zooming), or by
adjusting the scale so that all available data is shown on the screen at once.
To expand the time series (show less data points on the screen)
▪
Click on the Expand icon on the Chart toolbar:
Note
You can also press the – MINUS key or DEL key (when no chart object is selected).
This function is similar to the Zoom In tool. See Zooming a Section of a Chart on page 204.
To compress the time series (show more data points on the screen)
▪
Click on the Compress icon on the Chart toolbar:
Note
You can also press the + PLUS key or INS key.
This function is similar to the Zoom Out tool. See Zooming a Section of a Chart on page 204.
To show the entire data series on the screen
▪
Click on the Show All Data icon on the Chart toolbar:
Note
You can also click the Data View button
and choose Show all data instead.
Chart reset
When you have zoomed into the chart, set custom scaling options or pane margins, you can always return the chart
to its default state. Other settings (chart type, data compression, colors etc.) will not be affected by this.
To reset the chart to its defaults (zooming, scaling and margins)
▪
Click the Data View button
Charting
and choose Chart reset.
207
TeleTrader Software GmbH
Marc-Aurel-Straße 10-12, 1010 Vienna, Austria
E-Mail [email protected]
Internet http://professional.teletrader.com
Note
You can also press the HOME key to reset the chart.
Setting, Moving and Editing Bookmarks
You can place bookmarks on a chart at certain points in time. The bookmark is shown on the time scale with an icon,
and on the chart with a vertical line. Each bookmark can have a name and a description. You can later also change
the position of a bookmark with drag and drop.
You can use the bookmarks for chart navigation: With the Data View button, you can jump to a specific bookmark,
browse through bookmarks or go to the first and last bookmark of the chart.
To set a bookmark
▪
Right-click anywhere on the chart and choose Bookmark > Insert bookmark.
▪
The mouse pointer changes:
▪
Click on the chart at the date / time where you want to set the bookmark.
▪
A text field is shown. Enter the name of the bookmark.
▪
Press the ENTER key. The bookmark is added to your chart.
To move a bookmark
▪
Click on the bookmark’s icon on the time scale and drag the bookmark to the left or right.
▪
Drop the bookmark’s icon at the new date / time on the time scale.
To navigate to a bookmark
▪
Click on the Data View button
and select a bookmark navigation option:
Goto first
Jumps to the first (leftmost) bookmark on the chart.
Goto previous
Jumps to the previous bookmark, to the left of your current chart position.
Goto next
Jumps to the next bookmark, to the right your current chart position.
Charting
208
TeleTrader Software GmbH
Marc-Aurel-Straße 10-12, 1010 Vienna, Austria
E-Mail [email protected]
Internet http://professional.teletrader.com
Goto last
Jumps to the last (rightmost) bookmark on the chart.
Goto Bookmark
Lets you choose a specific bookmark to navigate to.
To edit the name of a bookmark and enter a description
▪
Right-click the bookmark’s icon on the time scale and choose Bookmark > Edit bookmark.
Note
You can also use the menu command Format > Bookmarks. Then, you can edit several
bookmarks at once. Choose the bookmark you want to edit from the list.
▪
In the Edit bookmark dialog, edit the name of the bookmark in the Name field, or add a Description.
▪
Click OK to save your changes.
To change the color of bookmarks
▪
Right-click on the chart and select Properties.
▪
On the left side of the dialog, select General > Misc.
▪
On the right side of the dialog, choose a Bookmark color for all bookmarks of the chart.
To delete a bookmark
▪
Right-click the bookmark’s icon on the time scale and choose Bookmark > Delete bookmark.
Note
You can also click on the Data View button
and choose Remove Bookmark.
To delete all bookmarks
▪
Click on the Data View button
and choose Remove all Bookmarks.
Creating and Organizing Chart Panes
Each chart consists of at least one chart pane. A chart pane is a section of a chart that can hold symbols, studies and
other chart objects. Many chart settings apply to a specific chart pane, like the background color, the vertical price
scales and the header, but all chart panes share the same horizontal time scale.
Charting
209
TeleTrader Software GmbH
Marc-Aurel-Straße 10-12, 1010 Vienna, Austria
E-Mail [email protected]
Internet http://professional.teletrader.com
You can use chart panes to display many symbols in one chart without overlaying them (Inserting, Overlaying and
Changing Symbols in a Chart on page 187) or to display certain studies in a separate section of the chart, especially
when they use another scale than the symbol they are based on (for example most oscillators).
When you create new chart panes, every pane is automatically assigned an ascending number. The chart pane
displayed at the top of a chart is always called Pane 1.
To create a new empty chart pane
▪
Place the mouse pointer on the line above the horizontal time scale. The mouse pointer changes.
▪
Hold the mouse button down and drag the line upwards. A new empty chart pane appears.
▪
Release the mouse button when the size of the new pane is big enough.
To create a new chart pane containing a symbol / a study
▫
When you insert a symbol into a chart, it is automatically added in an additional chart pane. You can use the
command Insert > Symbol, or drag and drop a symbol from another document. See Inserting, Overlaying and
Changing Symbols in a Chart on page 187 for details.
▫
When you insert a study into a chart, you can choose in which pane it will appear. If you choose Top or Bottom,
the study is added in an a new chart pane at the top / bottom of the chart. See Defining the Appearance of a
Study on page 305 for details.
Note
If you want to insert the same studies in one pane, instead of multiple panes, select Insert the
same studies in the same pane option under Tools > Options > Chart, For example, if you
insert MACD study (using different parameters) on a chart two times in a row, MACD studies will
be displayed in one pane instead of two. See Chart Settings on page 340.
To resize a chart pane
▪
Place the mouse pointer on the separation line between two chart panes. The mouse pointer changes.
▪
Hold the mouse button down and move the mouse up or down to resize the pane.
To set the height of all chart panes equally
▪
Click the Data View button
and choose Equalize Panes Height.
To change the top and bottom margins of a chart pane
▪
In the Chart Properties dialog, click the name of the chart pane, for example Pane 1.
▪
Under Pane margins (in pixels), enter the size of the Top and Bottom margins. The maximum size is 100
pixels. See also Changing the Background Color of a Pane on page 225.
Note
Charting
If you want to increase the right margin of the chart pane, i.e. add space between the last bar and
the price scale, see Extending the Time Line to the Future on page 224.
210
TeleTrader Software GmbH
Marc-Aurel-Straße 10-12, 1010 Vienna, Austria
E-Mail [email protected]
Internet http://professional.teletrader.com
To close the active chart pane
▪
Right-click the chart pane that you want to close and choose Close Pane.
To close all chart panes except the active pane
▪
Right-click the chart pane that you want to keep and choose Close All Panes Except.
Note
A chart consists of at least one chart pane. Therefore, one pane must remain open.
Using Sheets in Charts
Like a price page, a chart consists of at least one sheet. You can add additional sheets to a chart to organize the
contents of a chart. Each sheet can be customized independently – that means it can use different data
compressions, chart types, panes, studies etc.
Sheets are especially useful in a chart when you use a split chart window, as outlined below in an example. That way,
you can display one symbol in a chart with different data compressions, chart types or studies.
For more information about how to create new sheets, rename or remove a sheet, see the information about sheets in
price pages: Adding and Organizing Sheets on page 87.
Note
You cannot move symbols from one chart sheet to another like you can in price pages. However,
whenever you create a new sheet in a chart, all symbols and studies of the first sheet are
automatically copied to the new sheet. The new sheet will also use the time region set for the first
sheet, except when the first sheet is set to load all historic data. In that case, the new sheet will
only display the last 510 records of a symbol.
After that, the new sheet is completely independent of the first sheet.
To view different sheets in one chart at the same time (chart window split)
▪
Add several sheets to a chart (see Adding and Organizing Sheets on page 87), for example:
▪
Set a different compression for every sheet, for example a daily compression for the first sheet, 60-minute
compression for the second sheet and 5-minute compression for the third sheet. See Changing the Data
Compression on page 175 for details.
▪
Place the mouse pointer on the split handle (the grey vertical bar) in the upper right corner of the chart window.
The pointer changes.
▪
Hold the mouse button down and drag the handle downwards. The chart window is split in two parts. The second
part contains an exact copy of the original chart. Every change that you do in one of the parts is replicated
immediately in the other part.
Charting
211
TeleTrader Software GmbH
Marc-Aurel-Straße 10-12, 1010 Vienna, Austria
E-Mail [email protected]
Internet http://professional.teletrader.com
▪
You can now display different sheets in every split window: Click on the Daily tab in the top part of the chart, and
on the 5min tab in the bottom part of the chart, for example.
To close the split window
▪
Place the mouse pointer on the separation line between the two split parts.
▪
Hold the mouse button down and drag the separation line downwards.
▪
When the mouse pointer is beneath the lower border of the chart window, release the mouse button.
Reading Values from a Chart
Often, you want to read exact values about a time series from a chart. To do this, Professional provides you with two
tools: The Data Info box that displays values interactively on the chart, and the DataBar that constantly displays the
data values of the current mouse position in the Navigation pane.
Both tools show the same information:
▫
For all visible symbols: Date and time of the current data point (bar, candlestick), Open, High, Low and Close
prices of all visible symbols at that point in time, Volume and Open Interest
▫
For studies, chartable expressions or drawing objects, the relevant values are displayed as well.
Charting
212
TeleTrader Software GmbH
Marc-Aurel-Straße 10-12, 1010 Vienna, Austria
E-Mail [email protected]
Internet http://professional.teletrader.com
Data Info box
The Data Info box is a transparent area in a corner of the chart. If a chart has several chart panes, each pane has its
own Data Info box that shows only information about the symbols and other chart objects that are visible in this pane.
You can customize the Data Info box: Choose which drawing objects and time series values (Open, High, Low , Close
etc.) should be shown in the box and decide if study values should be considered as well. For a better overview, all
values for studies and drawing objects can be shown with the same color as the object they refer to. See Data Info
Settings on page 347.
To display values in the Data Info box on demand
▪
Click on the Select icon in the Drawing toolbar:
Note
The Select tool is active by default in any new chart.
▪
Click on the chart and hold the mouse button down.
▪
The values for the date / time of the point where you clicked is displayed in the Data Info box. The box
disappears as soon as you release the mouse button.
Note
If you click directly on a chart object, for example a symbol, drawing object or study, the Data Info
box is not displayed. Instead, the object is selected.
To keep values visible in the Data Info box
▪
Click on the Crosshair or Vertical Line icon in the Drawing toolbar:
▪
The values for the date / time of the point where you clicked is displayed in the Data Info box. The box is visible
until you deactivate the Crosshair or Vertical Line tool.
▪
You can move the crosshair on the chart with the arrow keys on your keyboard.
Note
or
Click on the chart.
The Crosshair or Vertical Line tool will stay active as long as you do not deactivate it by clicking
on the Crosshair or Vertical Line icon again. When you save a chart while the Crosshair or
Vertical Line tool is active, this setting and its exact position on a chart will be saved as well.
You can also use the left and right arrow keys to activate the Vertical Line tool if the option Use
arrow keys (Left or Right) for activating the Vertical Line under Tools > Options > Chart is
activated. See Chart Settings on page 340.
Charting
213
TeleTrader Software GmbH
Marc-Aurel-Straße 10-12, 1010 Vienna, Austria
E-Mail [email protected]
Internet http://professional.teletrader.com
DataBar
The DataBar is a part of the Navigation pane.
If you want to customize the DataBar, you can change its font and colors. See Customizing the DataBar on page 143.
To display values constantly on the DataBar
▪
Click on the tab DataBar in the navigation pane.
▪
When you move the mouse pointer over the chart, the data values for the current position are constantly
displayed in the DataBar.
Displaying the Data Table View
The data table shows the exact values of every data point (bar, candle etc.) in a tabular view. You can either display
the data table in a separate window, or inside a split window on the chart. You can use the data table to verify the
price values of the time series, or to hide specific data points on the chart.
When you display more than one symbol in a chart, the data table view shows several tabs at the bottom that allow
you to switch between the values of the different symbols.
Charting
214
TeleTrader Software GmbH
Marc-Aurel-Straße 10-12, 1010 Vienna, Austria
E-Mail [email protected]
Internet http://professional.teletrader.com
To display the data table in a separate window
▪
Right-click the chart and choose Data Table View.
To display the data table in a split window on the chart
▪
Place the mouse pointer on the split handle (the grey vertical bar) in the upper right corner of the chart window.
The pointer changes:
▪
Right-click the split handle, hold the right mouse button down and drag the handle downwards. The chart window
is split in two parts. The second part shows the data table view.
Note
If you use the left mouse button instead of the right mouse button, the second part of the chart
window shows an exact copy of the chart, including all sheets. See Using Sheets in Charts on
page 211.
To close the split window
▪
Double-click the separation line between the two split parts.
To hide data points (bars, candles etc.) in a chart
▪
In the data table, highlight the row(s) that contain the data that you want to hide in the chart.
Note
You can select several rows at once with the CTRL or SHIFT key, in the same way as you would in a
price page. See Selecting Rows or Columns of a Price Page on page 89.
▪
Right-click on a highlighted row and choose Mark bar(s) as hidden.
▪
The chosen data points (bars, candles etc.) are not displayed anymore on the chart. They are still visible in the
data table, but marked in a different color.
Note
Hidden bars remain hidden in this chart even if you close the data table or split window. You can
only display them again by changing their status in the data table view (see below).
To show hidden data bars again
▪
In the data table, highlight the hidden row(s) that contain the data you want to show on the chart again.
▪
Right-click on a highlighted row and choose Hidden Bars > Unmark bar(s).
▪
The data points (bars, candles etc.) are now visible on the chart again.
Note
To show all hidden bars at once, choose Hidden bars > Unmark all bars.
To change the appearance of the data table
▪
Right-click the data table and choose Properties.
▪
On the left side of the Options dialog, select Chart > Data Table, if it is not selected already.
Charting
215
TeleTrader Software GmbH
Marc-Aurel-Straße 10-12, 1010 Vienna, Austria
E-Mail [email protected]
Internet http://professional.teletrader.com
▪
On the right side of the dialog, adapt the settings to your needs. See Data Table Settings on page 341 for details
about the possible settings.
Customizing the Chart
When you create a chart, default settings are used for the chart panes, price and time scales, the time series and
other chart objects. You can change how the chart looks like, how much historic data is loaded and plotted for a
symbol, what type of price scale is used and so on.
Most settings can be adapted in the Chart Properties dialog. Some are accessed by right-clicking on the chart and
choosing a command from the context menu, or by using the Data View button
or a specific tool from the Chart
or Drawing toolbars.
Note
To save and re-use the settings that you make for a chart, you can use templates. See Saving your
Preferences in Templates on page 145.
Chart Properties dialog
The Chart Properties dialog lets you adapt the default chart settings to your needs. To display the dialog, right-click
in the chart that you want to customize and select Properties. You can also hold the SHIFT key and double-click on
the chart to open the dialog.
The dialog is made up of several property sheets. These sheets are arranged hierarchically into groups, that are
displayed on the left side of the dialog as a tree view. The top group of property sheets is called General and contains
the settings that apply to the whole chart, such as the appearance of the time scale or the data compression of the
chart.
The other property sheets are grouped into panes, for example Pane 1, Pane 2 etc. Many settings only apply to a
specific chart pane, or an object inside a chart pane. Depending on what objects and panes you use in your chart,
different property sheets will be available. Chart objects, such as symbols and drawing objects, can be customized
per pane. This means that you could have for example two chart panes with the same symbol, but using different
colors or a different price scale.
The group Studies contains the properties and settings of all studies that are currently visible on the chart. See
Changing the Properties of Inserted Studies on page 309.
If you want to go directly to the settings for a specific chart object (for example, a trend line or the price scale), you
can right-click on the object and choose Properties to go directly to the property sheet that controls the settings of
this particular object.
You can find an overview of the possible property sheets in the section Customizing Charts on page 103.
If you want to change several chart property settings at once, and immediately see the effects that these changes will
have on the chart, you can click Apply in the Chart Properties dialog. This will apply the new settings to the chart,
but keep the Chart Properties dialog open so that you can make additional changes. To apply the settings and close
the dialog in one step, click OK (like in other properties dialogs).
Customizing the Time Series
The time series is the visualization of a symbol with its current and historic data. For each point in time, the Open,
Close, High and Low prices are plotted on the chart. You can change how the data is compressed (end of day,
intraday or tick data – see Changing the Data Compression on page 175) and how the data is plotted on the screen
(for example, as a line chart, bar chart, point and figure chart or else – see Changing the Chart Type on page 176).
Additionally, you can control how much historic data is displayed in the chart and what trading sessions are used in
intraday charts, what styles and colors are used in the chart, and if you want to extend the time line to the future (that
means, show an empty area at the right side of the chart to make room for trend lines or similar objects that extend
into the future).
Charting
216
TeleTrader Software GmbH
Marc-Aurel-Straße 10-12, 1010 Vienna, Austria
E-Mail [email protected]
Internet http://professional.teletrader.com
Changing the Amount of Data Displayed in the Chart
You can control how much historical data is loaded into a chart. By default, the last 510 records are shown. This
means for example that in daily charts the last 510 days are plotted, in tick by tick charts the last 510 ticks. If you want
to extend the historical data, you have to change the time region for the chart.
When using intraday charts, you can also define trading sessions to choose when the trading session of the
exchange starts. The default settings (based on the trading hours of the exchanges) are automatically loaded from
the Market Data Server. You can also define more than one trading session, and assign different colors to them.
If you want to show less data on a chart, you can either cut the data history with the Data Cut tool, or hide specific
data points (bars, candles etc.) on the chart in the data table view.
To change the time region of the chart
Note
Be aware that Professional needs more system resources the more data you load in a chart. Keep
the default setting unless you need older data or want to set the time region to a fixed period.
▪
Click on the arrow next to the Time Region icon on the Chart toolbar:
▪
Choose the time region that you want to use (default: 510 records).
▪
If you want to use a custom time region, choose Custom. The Chart Properties dialog is shown.
▪
On the left side of the dialog, select General > Time Region.
▪
On the right side of the dialog, choose the appropriate setting:
All
All available historical data of the symbol is loaded and displayed in the chart.
Last x …
All historical data for the last x minutes, hours, days, weeks, months or years is displayed.
Enter the number and choose which period (minutes, days etc.) you want to use.
Records
The last x records (data points, bars, candles etc.) are displayed. Enter the number of
records.
The default setting is 510 records.
Period (from-to)
The historical data for a specific time period is loaded and displayed in the chart. Choose
the begin and end date and time of the period.
Check the Begin box to load all available data from the beginning of the time series up to
the point in time that is set in the to field.
Check the Now box to load all available data from the point in time that is set in the from
field up to the most current record.
The Begin and Now settings are dynamic and are updated constantly.
Note
You can also extend the time line of a chart to the future with the Extended Time Region settings
on this option sheet. See Extending the Time Line to the Future on page 224.
To adapt the trading sessions of a time series
All data for a symbol that does not fit into one of the trading sessions defined here is not displayed in the chart.
Trading sessions are especially useful in intraday charts.
▪
Right-click on the chart and select Properties.
▪
On the left side of the dialog, select the name of the chart pane, the name of the symbol and then Trading
Sessions. For example: Pane 1 > EURUSD > Trading Sessions.
▪
On the right side of the dialog, select the Use custom settings box.
Charting
217
TeleTrader Software GmbH
Marc-Aurel-Straße 10-12, 1010 Vienna, Austria
E-Mail [email protected]
Internet http://professional.teletrader.com
Note
▪
▪
As long as the Use custom settings box is deactivated, the default trading sessions for the
exchange that the symbol is traded on are used. These settings are derived from the Market Data
Server. You can go back to the default settings later by clearing the check box again.
You can now define up to four different trading sessions. Each trading session has the following properties:
Start
Start time of the trading session
End
End time of the trading session
Days of the Week
Days of the week that the trading session applies to: Sunday through Saturday
Color
Color used in trading session coloring (see Color-Coding Price Relations, Intervals or
Trends on page 220)
Choose whether your custom settings should only apply to this chart (Apply trading session for this time
series only), or if they should be used for all charts with this symbol (Apply trading session for this symbol in
all documents).
Note
The trading sessions are always set in exchange time. However, you might have your time zone
(see Time Zone Settings on page 348) set to something other than exchange time (for example
local time). Thus, the time values that are displayed on the chart might appear different from the
settings for the trading session.
For example, if your time zone is set to local time, and you are located in the Central European
time zone, a trading session for the New York Stock Exchange that starts at 9:30 exchange time
(Eastern Standard Time) will show on your chart as starting at 15:30 local time (Central European
Time).
To cut the data history of a chart
▪
Click on the Data Cut icon in the Drawing toolbar:
▪
Click on the chart at the date / time that should be the beginning of the chart. All older data to the left of this point
will be removed from the chart.
Note
To undo this action, adapt the time region of the chart (see above).
To hide data points (bars, candles etc.) in a chart
You can hide specific data points in the data table view, so that they will not be displayed on the chart. For details,
see Displaying the Data Table View on page 214.
Changing the Number of Decimal Places in Charts
You can change the number of decimal places that is used for a specific pane in charts.
You can change the number of decimal places that is used for both the underlying symbol and its options.
To change the number of decimal places for a chart pane
▪
Right-click the chart pane and choose Set decimal places.
▪
In the Set decimal places dialog, enter the number of decimal places that you want to apply to that chart pane.
Note
Charting
The custom decimal places set for the chart pane will be applied to drawing tools, expressions,
studies and all values in data info box except to Volume and Open Interest. You can also change
this setting under Tools > Options > General > Subscription (see Subscription Settings on page
339).
218
TeleTrader Software GmbH
Marc-Aurel-Straße 10-12, 1010 Vienna, Austria
E-Mail [email protected]
Internet http://professional.teletrader.com
The decimal places set in the chart will only be used within that chart document and data table
view.
Changing the Line Style
You can change the line style of a chart. These settings do also apply to other chart types besides Line charts and
Kagi charts, because the line style also affects the bars in bar charts, empty candles in Candlestick and Heikin Ashi
charts, the boxes of Point and Figure charts, etc.
The colors used for the time series in a chart are also defined here. For chart types that use more than one color, you
can find more information in the next section, Color-Coding Price Relations on page 220.
Some of the line style settings are only available for certain chart types and compressions.
To change the line style of a time series
▪
Right-click on the chart and select Properties.
▪
On the left side of the dialog, select the name of the chart pane, the name of the symbol and then Line Style. For
example: Pane 1 > EURUSD > Line Style.
▪
On the right side of the dialog, adapt the default settings to your needs. Some settings are only available for
certain chart types and compressions.
Control
Description
Color
Color of the time series.
This setting is visible in Line, Stair Step and Kagi charts in all compressions.
Style
Line style of visible lines. The line style applies for example to Line and Kagi
charts, the bars in Bar charts or empty candles in Candlestick and Heikin
Ashi charts.
This setting is visible in Line, Bar, Candlestick, Histogram, Points, Stair
Step, Kagi and Heikin Ashi charts in all compressions.
Weight
Weight of all visible lines in points.
This setting is visible in Line, Bar, Candlestick, Histogram, Points, Stair
Step, Kagi and Heikin Ashi charts in all compressions.
Use interval
Used for color-coding time intervals in end of day trading sessions. See ColorCoding Price Relations on page 220.
This setting is visible in Bar, Candlestick, Histogram and Points charts with
the compressions Daily, Weekly or Monthly.
Use price relation
Used for color-coding price relations for rising, falling and equal prices. See
Color-Coding Price Relations on page 220.
This setting is visible in Bar, Candlestick, Histogram and Points charts in all
compressions.
Use trading session coloring
Used for color-coding intraday trading sessions. See Color-Coding Price
Relations on page 220.
This setting is visible in Bar, Candlestick, Histogram and Points charts with
Intraday or TickBar compressions.
Trend coloring
Used for trend coloring. See Color-Coding Price Relations on page 220.
This setting is visible in Point and Figure, Three Line Break and Renko
charts in all compressions.
Use last bar color
Check to use different colors for the last bar, candlestick or data point,
depending on rising or falling prices. See Color-Coding Price Relations on
page 220.
This setting is visible in Bar, Candlestick, Histogram and Points charts in all
compressions.
Rollover Bar
Set the color for the rollover bar in continuation charts. See Continuous
Charting
219
TeleTrader Software GmbH
Marc-Aurel-Straße 10-12, 1010 Vienna, Austria
E-Mail [email protected]
Internet http://professional.teletrader.com
Contracts / Continuation Charts on page 234.
Set a custom color for the chart’s header.
Header color
Color-Coding Price Relations, Intervals or Trends
Most chart types use more than one color to display the time series. Depending on the chart type, you have several
options to color-code the bars, candlesticks, columns etc. of a time series:
Price relations
Rising, falling and equal bars, candlesticks etc. are
colored differently. This setting can only be used in
Bar, Candlestick , Histogram and Points charts.
End of day intervals
Time intervals are colored alternately. For daily
charts, the color changes every month, for weekly
and monthly charts, the color changes every year.
This setting can only be used in Bar, Candlestick,
Histogram and Points charts with the compressions
Daily, Weekly or Monthly.
Intraday trading
sessions
Different trading sessions can have different colors.
If you for example set up four equal-length trading
sessions, the color of the time series will change
every six hours. This setting can only be used in Bar,
Candlestick, Histogram and Points charts with
Intraday or TickBar compressions.
Trends
Rising columns and falling columns are colored
differently. These settings can only be used in Point
and Figure, Three Line Break and Renko charts.
In Bar, Candlestick, Histogram and Points charts, you can also color the last bar or candlestick differently,
depending on the last tick (rising or falling prices).
Note
In Line and Stair Step charts you can also color-code price relations, intervals and trading
sessions when you clear the option Use only one color for Line charts under Tools > Options >
Chart. In Kagi charts, you can then color-code trends.
To color-code price relations
Note
Price relations can only be color-coded in Finance charts, with the exception of Line and Stair
Step charts.
▪
Right-click on the chart and select Properties.
▪
On the left side of the dialog, select the name of the chart pane, the name of the symbol and then Line Style. For
example: Pane 1 > EURUSD > Line Style.
▪
On the right side of the dialog, select the option Use price relation in the section Type of security coloring.
▪
In the section Border color, select one of the following options:
Traditional Candlestick
Charting
Only available for Candlestick charts. Traditional candlesticks use only a single color
for both candle bodies and borders. If the Last price is higher than the Open price of
the candle, it is shown as an empty candle (transparent fill); else, it is shown as a full
candle of the chosen color.
220
TeleTrader Software GmbH
Marc-Aurel-Straße 10-12, 1010 Vienna, Austria
E-Mail [email protected]
Internet http://professional.teletrader.com
▪
Open/Last
The border colors depend on the relationship between the Open and Last prices of
the data point: Choose a Rising color (Last > Open), Falling color (Last < Open) and
Equal color (Last = Open).
Close/Last
The border colors depend on the relationship between the previous data point’s Close
and current data point’s Last prices: Choose a Rising color (Last > previous Close),
Falling color (Last < previous Close) and Equal color (Last = previous Close).
In the section Fill color (only available for Candlestick charts), select the option Open/Last or Close/Last (see
above) and choose the appropriate colors for the bodies of the candles.
To color-code time intervals in end of day compressions
Note
Intervals can only be color-coded in Finance charts with the compressions Daily, Weekly or
Monthly. In Line and Stair Step charts you cannot use interval coloring.
▪
Right-click on the chart and select Properties.
▪
On the left side of the dialog, select the name of the chart pane, the name of the symbol and then Line Style. For
example: Pane 1 > EURUSD > Line Style.
▪
On the right side of the dialog, select the option Use interval in the section Type of security coloring.
▪
Select a color for the first time interval (Color #1) and a color for the second interval (Color #2).
Note
The color used for the first time interval (Color #1) is also used for the text in the pane header. If
you want to define a custom color for the header, check the option Custom header color at the
bottom of the dialog. See also Changing the Font, Colors and Data of Headers on page 227.
To color-code intraday trading sessions
Note
Trading sessions can only be color-coded in Finance charts with Intraday or TickBar
compressions. In Line and Stair Step charts you cannot use trade session coloring.
▪
Right-click on the chart and select Properties.
▪
On the left side of the dialog, select the name of the chart pane, the name of the symbol and then Line Style. For
example: Pane 1 > EURUSD > Line Style.
▪
On the right side of the dialog, select the option Use trading session coloring in the section Type of security
coloring.
▪
The settings and colors for trading sessions must be set on the property sheet Trading Sessions. See Changing
the Amount of Data Displayed in the Chart on page 217 for details.
To color-code trends
Note
Trend coloring can only be used in Point and Figure, Three Line Break and Renko charts.
▪
Right-click on the chart and select Properties.
▪
On the left side of the dialog, select the name of the chart pane, the name of the symbol and then Line Style. For
example: Pane 1 > EURUSD > Line Style.
▪
On the right side of the dialog, select the colors for Rising and Falling trends in the section Trend coloring.
Charting
221
TeleTrader Software GmbH
Marc-Aurel-Straße 10-12, 1010 Vienna, Austria
E-Mail [email protected]
Internet http://professional.teletrader.com
To change the color of the last bar, candlestick or data point
Note
You can only use the Last bar color in Finance charts, with the exception of Line and Stair Step
charts.
▪
Right-click on the chart and select Properties.
▪
On the left side of the dialog, select the name of the chart pane, the name of the symbol and then Line Style. For
example: Pane 1 > EURUSD > Line Style.
▪
On the right side of the dialog, select the options Border and/or Fill in the section Last Bar Color.
▪
Select the colors used for Rising, Falling and Equal prices.
To change the color of the rollover bar
Note
The Rollover Bar is only available in continuation charts. See Continuous Contracts / Continuation
Charts on page 234.
▪
Right-click on the chart and select Properties.
▪
On the left side of the dialog, select the name of the chart pane, the name of the symbol and then Line Style. For
example: Pane 1 > FDAX 2009H,CC > Line Style.
▪
On the right side of the dialog, select a color used for the Rollover Bar.
Showing Price Lines at the Level of Current Prices
You can show the current value of certain prices as a horizontal line on the chart that dynamically changes its level
each time new price information arrives. For these so-called price lines, you can choose the line style and show / hide
labels, prices and field names. When you display more than one price line on a chart, you can also use a color
gradient between two price lines.
The price line is always based on the current daily data. This means you can change the data compression of a chart
(for example to an intraday compression) and still display the day’s Open, High, Low, Last etc. on the chart.
Charting
222
TeleTrader Software GmbH
Marc-Aurel-Straße 10-12, 1010 Vienna, Austria
E-Mail [email protected]
Internet http://professional.teletrader.com
To show a price line at the level of current prices
▪
Right-click on the chart and select Properties.
▪
On the left side of the dialog, select the name of the chart pane, the name of the symbol and then Price Display.
For example: Pane 1 > ANDR > Price Display.
▪
On the right side of the dialog, select the check boxes next to the prices for which you want to show a price line.
To change the line style of the price lines
▪
Right-click on the chart and select Properties.
▪
On the left side of the dialog, select the name of the chart pane, the name of the symbol and then Price Display.
For example: Pane 1 > ANDR > Price Display.
▪
On the right side of the dialog, adapt the Line settings to your needs.
Control
Description
Color
Color of the price lines
Style
Line style of the price lines
Weight
Width of the price lines
Apply to all levels
Check to use the same line style for all price lines.
Clear to use individual line styles for each price line. You can then click on each price to
see / change the line style settings of this line.
To show a color gradient between two price lines
▪
Right-click on the chart and select Properties.
▪
On the left side of the dialog, select the name of the chart pane, the name of the symbol and then Price Display.
For example: Pane 1 > ANDR > Price Display.
▪
On the right side of the dialog, select Show color gradient.
▪
In the Color Gradient section, choose the Zone (between two visible price lines) for which you want to set a
gradient.
▪
Adapt the rest of the settings to your needs.
Control
Description
Start Color
First color that is used for the gradient
End Color
Second color that is used for the gradient
Transparency
Transparency of the shaded area in percent (0% = solid)
To display price labels on the vertical scale
▪
Right-click on the chart and select Properties.
▪
On the left side of the dialog, select the name of the chart pane, the name of the symbol and then Price Display.
For example: Pane 1 > ANDR > Price Display.
▪
On the right side of the dialog, choose the label that you want to use to mark the prices on the price scale in the
Scale Labels section:
No Label
No label is shown to mark the chosen price
Price
A rectangular marker with the chosen price is displayed
Left Arrow
An arrow showing to the left is displayed at the position of the chosen price
Right Arrow
An arrow showing to the right is displayed at the position of the chosen price
Charting
223
TeleTrader Software GmbH
Marc-Aurel-Straße 10-12, 1010 Vienna, Austria
E-Mail [email protected]
Internet http://professional.teletrader.com
To display prices and field names for the price lines
▪
Right-click on the chart and select Properties.
▪
On the left side of the dialog, select the name of the chart pane, the name of the symbol and then Price Display.
For example: Pane 1 > ANDR > Price Display.
▪
On the right side of the dialog, select Show values to show the price next to the price line.
▪
Select Show field names to also show the field (for example Last).
To choose the area of the chart where the price lines are shown
▪
Right-click on the chart and select Properties.
▪
On the left side of the dialog, select the name of the chart pane, the name of the symbol and then Price Display.
For example: Pane 1 > ANDR > Price Display.
▪
On the right side of the dialog, select Show line in Chart area to show the price lines in the chart area where the
time series is plotted.
▪
Select Show line in extended time area to also show the price lines in the area to the right of the last bar.
To consider price lines in automatic scaling
▪
Right-click on the chart and select Properties.
▪
On the left side of the dialog, select the name of the chart pane, the name of the symbol and then Price Display.
For example: Pane 1 > ANDR > Price Display.
▪
On the right side of the dialog, select Consider Price Lines in automatic scaling.
Extending the Time Line to the Future
You can add blank space to the right of the last plotted bar, for example to make room for drawing objects that extend
into the future. You can either choose a number of "future bars" or extend the time scale until a certain date.
If you want to also adapt the blank space between the time series and the top and bottom of a chart pane, you have
to set the pane margins. See Creating and Organizing Chart Panes on page 209 for details.
To extend the time line to the future by a number of bars
▪
Right-click on the chart and select Extend time line > Set extend time.
▪
In the Extend time dialog, select the option Number of bars.
▪
Enter the number of (empty) bars that you want to add to the right of the last bar.
▪
Click OK. The time scale of the chart will be extended to the future to accommodate for the number of bars that
you have entered. For example, if you choose 10 future bars in a daily chart, the time line is extended for ten
days into the future.
Note
You can also extend the time line of a chart by changing the Extended Time Region settings on
the option sheet Time Region in the Chart Properties dialog. See also Changing the Amount of
Data Displayed in the Chart on page 217.
To extend the time line to the future until a certain date / time
▪
Right-click on the chart and select Extend time line > Set extend time.
▪
In the Extend time dialog, select the option Extend to time.
▪
To choose a date from the calendar, click on the arrow next to the date, or type the date into the fields.
Charting
224
TeleTrader Software GmbH
Marc-Aurel-Straße 10-12, 1010 Vienna, Austria
E-Mail [email protected]
Internet http://professional.teletrader.com
▪
To choose a time, click on the element of the time field that you want to change (hours, minutes or seconds).
Then, change it with the arrows on the right, or type the new time into the field.
Note
▪
The time field is only available in intraday charts.
Click OK. The time scale of the chart will be extended to the future until the date / time that you have entered.
To extend the time line to the future with drag and drop
▪
Click on the Free Hand icon on the Drawing toolbar:
▪
The mouse pointer changes:
▪
Click on the chart, hold the mouse button down and drag the chart to the left. The time line is extended to the
future according to the amount that you have dragged the chart.
Note
The Free Hand tool will stay active as long as you do not use another tool. To deactivate it, click
on another tool icon, or press the ESC key on your keyboard. When you save a chart while the
Free Hand tool is active, this setting will be saved as well.
To remove the extended time line
▪
Right-click on the chart and select Extend time line > Remove extend time.
To reset the chart to its defaults (zooming, scaling and margins)
▪
Click the Data View button
and choose Chart reset.
Customizing the Chart Background and Headers
You can customize the color of the chart background and the appearance of the chart grid (vertical and horizontal
lines). Every chart pane can have different settings here.
As every chart pane also has a header, you can also choose the font, colors and data shown in the header of every
chart pane.
Changing the Background Color of a Pane
Each chart pane can have individual background colors. The background can be single-colored, alternately colored
based on time intervals, or filled with a two-color gradient. You can also choose the size of the margins at the top and
bottom of the chart pane and set the header transparency here.
For more information about chart panes, see Creating and Organizing Chart Panes on page 209.
To change the background color and the pane margins
▪
Right-click in the chart pane and choose Properties.
▪
In the Chart Properties dialog, click the name of the chart pane, for example Pane 1.
▪
Adapt the following options to your needs:
Background color
Base color
Choose the primary background color for this chart pane.
Secondary color
Choose the secondary background color for this chart pane. This color is only
Charting
225
TeleTrader Software GmbH
Marc-Aurel-Straße 10-12, 1010 Vienna, Austria
E-Mail [email protected]
Internet http://professional.teletrader.com
used for gradients or alternating fills.
Fill type
Choose the fill type for this chart pane:
Solid
The chart pane is colored with the Base color.
Vertical gradient The chart pane is colored using a vertical gradient starting with
the Base color and ending with the Secondary color.
Horizontal
The chart pane is colored using a horizontal gradient starting
gradient
with the Base color and ending with the Secondary color.
Alternating
The Base color and the Secondary Color are used on the
chart background in turns, depending on the chosen Interval.
Interval
Choose the time period that is used for alternating the background colors when
using the fill type Alternating.
Active pane indicator color
Choose the color of the active pane indicator (the rectangle shown at the left
edge of the pane header when the chart pane is selected / active).
Pane margins
Top
Enter the size of the top margin in pixels. The maximum size is 100 pixels.
Bottom
Enter the size of the bottom margin in pixels. The maximum size is 100 pixels.
Transparent header
Use Transparent Header
If selected, the pane header is transparent. The time series and other chart
objects may overlap with the header.
You can set the header transparency under General > Misc. See Changing the
Font, Colors and Data of Headers on page 227.
Changing the Style and Colors of the Grid
You can change the appearance and color of the grid for each chart pane. The grid consists of horizontal and vertical
lines that show the different price levels and time intervals.
To change the grid style of a pane
▪
Right-click on the chart pane and select Properties.
▪
On the left side of the dialog, select the name of the chart pane, and then Grid. For example: Pane 1 > Grid.
▪
On the right side of the dialog, adapt the default settings to your needs.
▪
You can see a preview of your settings in the Sample window at the bottom of the dialog.
Charting
226
TeleTrader Software GmbH
Marc-Aurel-Straße 10-12, 1010 Vienna, Austria
E-Mail [email protected]
Internet http://professional.teletrader.com
Control
Description
Horizontal
Check to display horizontal grid lines at price levels
Vertical
Check to display vertical grid lines at time intervals
Style
Line style of all visible grid lines
Color
Color of all visible grid lines
Changing the Font, Colors and Data of Headers
You can change the font of the pane header and its background. The background of a header can not only have a
single color, but can also display a gradient between two colors. You can also use a transparent header. If you want
to display additional data in the header, for example Close values or Volume, you can select what data should be
displayed in every pane header.
Each chart pane can have a different font and color for its header.
To change the font used in a header
▪
Right-click on the chart pane and select Properties.
▪
On the left side of the dialog, select the name of the chart pane, and then Header. For example: Pane 1 >
Header.
▪
On the right side of the dialog, adapt the default settings to your needs.
▪
You can see a preview of your settings in the Sample window at the bottom of the dialog.
Control
Description
Font
Type of font used for the header
Font Size
Size of the font used for the header
Foreground
Color of the header text
This setting only applies to study names in the header of a chart. The color of time series data in
the header is determined by the first interval color for the time series, used also for color-coding
time intervals. If you want to define a custom color for the time series data of the header, check
the option Custom header color at the bottom of the option sheet Line Style. See Color-Coding
Price Relations, Intervals or Trends on page 220.
Bold
Check to use a bold style for the header
Italic
Check to use an italic style for the header
To change the background colors of a header
▪
Right-click on the chart pane and select Properties.
▪
On the left side of the dialog, select the name of the chart pane, and then Header > Fill Type. For example:
Pane 1 > Header > Fill Type.
▪
On the right side of the dialog, choose the colors and fill type for the header:
Solid fill
The header is thoroughly colored with a single Color.
Vertical fill
The header is colored using a vertical gradient starting with the First color (this is equal to the
Color on solid fills) and ending with the Second color.
Horizontal fill
The header is colored using a horizontal gradient starting with the First color (this is equal to
the Color on solid fills) and ending with the Second color.
Note
Charting
Vertical and horizontal fills cannot be applied to transparent headers (see below).
227
TeleTrader Software GmbH
Marc-Aurel-Straße 10-12, 1010 Vienna, Austria
E-Mail [email protected]
Internet http://professional.teletrader.com
To make the header transparent
▪
In the Chart Properties dialog, click the name of the chart pane, for example Pane 1.
▪
Select the option Use Transparent Header. See Changing the Background Color of a Pane on page 225.
To set the header transparency
Note
This setting applies to transparent headers in all chart panes.
▪
Right-click on the chart pane and select Properties.
▪
On the left side of the dialog, select General > Misc.
▪
On the right side of the dialog, drag the Headers transparency control to the right to increase transparency, or
to the left to decrease transparency.
To change the data displayed in the header
▪
Right-click on the chart pane and select Properties.
▪
On the left side of the dialog, select the name of the chart pane, and then Header > Data. For example: Pane 1 >
Header > Data.
▪
On the right side of the dialog, select all data fields that you want to display in the header. You can use the
buttons Select All or Unselect All to select or unselect all data fields at once.
Customizing Price and Time Scales
The price and time scales of a chart can be adapted in their functionality (scaling) and appearance.
Price scales can be scaled differently, which can also affect how much of the time series is shown on the screen and
if the scaling is dynamically adapted when scrolling to the left or right. You can also choose a different type of scale
(arithmetic, logarithmic or percentage), change the marker that shows the last price of a symbol, and adapt fonts and
colors of the scale. Each chart pane can have its own price scale settings, and you can also choose a different
appearance for a second price scale inside the same pane.
For the time scale you can change the font and colors used. As there is only one horizontal scale per chart, you
cannot have different time scales in the different chart panes.
Inserting a Second Price Scale
In addition to the main price scale (usually shown on the right side of the chart), you can also add a second price
scale to the chart (on the left side) and attach symbols to it. This is useful when you have overlaid several symbols in
a chart whose prices differ a lot from each other, so that they cannot be reasonably displayed on the same price
scale.
Charting
228
TeleTrader Software GmbH
Marc-Aurel-Straße 10-12, 1010 Vienna, Austria
E-Mail [email protected]
Internet http://professional.teletrader.com
You can only connect overlaid symbols to the second price scale.
To show the second price scale
▪
Right-click on the chart and select Show Second Scale.
To connect a symbol to the second price scale
▪
Right-click on the symbol that you want to connect to the second price scale and select Connect to Second
Scale.
Note
In order to use this command, more than one symbol must be overlaid in the chart.
To disconnect a symbol from the second price scale
▪
Right-click on the symbol that you want to disconnect from the second price scale and select Disconnect from
Second Scale.
To hide the second price scale
▪
Right-click on the chart and select Hide Second Scale.
Changing the Scaling of the Price Scale
You can change the scaling of the price scale to dynamically adapt to the section of the time series that is shown on
the screen, or to relate to the fixed maximum and minimum points of the loaded historic data.
See also Scaling the Time Series to the Screen on page 206.
To change the vertical scaling of a chart pane
▪
Right-click on the chart pane and select Properties.
▪
On the left side of the dialog, select the name of the chart pane, and then V.Scale > Scale. For example: Pane 1
> V.Scale > Scale.
▪
On the right side of the dialog, choose between the following settings:
Screen
Only the part of the time series that is visible on the screen is taken into account for
vertical scaling. When you scroll the chart to the left or right with the scrollbar, the
scaling is adjusted dynamically so that the maximum of the visible time series is always
at the top of the chart, and the minimum of the visible time series is at the bottom of the
chart.
This is the default setting.
Entire data series
The entire loaded time series is taken into account for vertical scaling, including historic
data that might not be visible at the moment. When you scroll the chart to the left or
right with the scrollbar, the scaling does not change, as the size of the vertical scale has
been determined already by using the maximum and minimum of the entire time series.
This setting might lead to blank spaces at the top or bottom of the visible part of the
chart, especially when you load a lot of historic data to your chart.
User defined
Enter a Maximum and Minimum value for the price scale. All parts of the time series
that would be plotted above or below these prices are cut off.
Note
Charting
When you use the Screen or Entire data series options, all reference points of drawing objects
(text, arrows, lines etc.) are also taken into account when calculating the maximum and minimum
of the time series, so that drawing objects always remain visible on the chart.
229
TeleTrader Software GmbH
Marc-Aurel-Straße 10-12, 1010 Vienna, Austria
E-Mail [email protected]
Internet http://professional.teletrader.com
Changing the Price Display of the Price Scale
You can change the way that the prices are displayed on the vertical price scale. In addition to using a different type
of price scale (arithmetic, logarithmic or percentage scale), you can also use letters to abbreviate long numbers (1K
instead of 1000), and remove unnecessary trailing zeros (for example unnecessary decimal places) from the display.
To change the type of the price scale
▪
Right-click on the chart pane and select Properties.
▪
On the left side of the dialog, select the name of the chart pane, and then V.Scale > Type. For example: Pane 1
> V.Scale > Type.
▪
On the right side of the dialog, select the scale type that you want to use:
Linear Price
Use an arithmetic scale that is divided into units of equal distance. This scale is useful to
represent absolute increments of change.
Logarithm Price
Use a logarithmic (or ratio) scale that is divided into units where the ratio difference
between two numbers is always represented by the same distance. This scale is useful
because equal distances on the scale represent an equal percentage change.
Linear Percentage
Use a percentage scale that displays the performance of a symbol relative to a starting
point. The first loaded Close price of the symbol represents 0%. All later price
developments are shown as percentages relative to this starting point. You can set a
different starting point.
Note
You can also change the type of the vertical scale with the Chart Type icon in the Chart toolbar.
For details, see Changing the Type of the Price Scale on page 185.
To use letters for an abbreviated display of prices (1000 = 1K)
▪
Right-click on the chart pane and select Properties.
▪
On the left side of the dialog, select the name of the chart pane, and then V.Scale > Scale. For example: Pane 1
> V.Scale > Scale.
▪
On the right side of the dialog, select the option Use letters for number presentation.
To calculate chartable expressions relative to their own start point on percentage
scales
▪
Right-click on the chart pane and select Properties.
▪
On the left side of the dialog, select the name of the chart pane, and then V.Scale > Scale. For example: Pane 1
> V.Scale > Scale.
▪
On the right side of the dialog, select the option Chartable Expressions calculate relative to their own start
point when scale is set to Linear Percentage.
To remove trailing zeros on the price scale
Note
Trailing zeros are removed only when they hold no information. This setting applies to all chart
panes.
▪
Right-click on the chart pane and select Properties.
▪
On the left side of the dialog, select General > Misc.
Charting
230
TeleTrader Software GmbH
Marc-Aurel-Straße 10-12, 1010 Vienna, Austria
E-Mail [email protected]
Internet http://professional.teletrader.com
▪
On the right side of the dialog, select the option Remove unnecessary trailing zeros on Vertical Scale.
Changing the Labels on Price Scales
On the price scale, markers or labels show the current values of the displayed symbols or studies. You can change
these labels or remove them altogether.
Each chart pane can have different labels.
To display price labels on the vertical scale
▪
Right-click on the chart pane and select Properties.
▪
On the left side of the dialog, select the name of the chart pane, the name of the symbol and then Price Display.
For example: Pane 1 > ANDR > Price Display.
▪
On the right side of the dialog, choose the label that you want to use to mark the prices on the price scale in the
Scale Labels section:
No Label
No label is shown to mark the chosen price
Price
A rectangular marker with the chosen price is displayed
Left Arrow
An arrow showing to the left is displayed at the position of the chosen price
Right Arrow
An arrow showing to the right is displayed at the position of the chosen price
Note
See also Showing Price Lines at the Level of Current Prices on page 222.
To display labels for studies on the vertical scale
▪
Right-click on the chart and select Properties.
▪
On the left side of the dialog, select the name of the chart pane, and then V.Scale > Label (or Second V.Scale >
Label for the additional price scale). For example: Pane 1 > V.Scale > Label.
▪
On the right side of the dialog, choose the label that you want to use to mark the last value of the displayed study
on the price scale.
No Marker
No label is shown to mark the last value of the study
Marker
A rectangular marker with the last value of the study is displayed
Left Arrow
An arrow showing to the left is displayed at the position of the last value of the study
Right Arrow
An arrow showing to the right is displayed at the position of the last value of the study
Changing the Font and Colors of Price Scales
You can change the font of the prices that are displayed on the price scale, the color of the text and the background
color of the price scale. The background of a price scale can not only have a single color, but can also display a
gradient between two colors.
Each chart pane can have a different font and color on its price scales.
Charting
231
TeleTrader Software GmbH
Marc-Aurel-Straße 10-12, 1010 Vienna, Austria
E-Mail [email protected]
Internet http://professional.teletrader.com
To change the font used in a price scale
▪
Right-click on the chart pane and select Properties.
▪
On the left side of the dialog, select the name of the chart pane, and then V.Scale (or Second V.Scale for the
additional price scale). For example: Pane 1 > V.Scale.
▪
On the right side of the dialog, adapt the default settings to your needs.
▪
You can see a preview of your settings in the Sample window at the bottom of the dialog.
Control
Description
Font
Type of font used for the price scale
Font Size
Size of the font used for the price scale
Foreground
Color of the text used in the price scale
Bold
Check to use a bold style for the price scale
Italic
Check to use an italic style for the price scale
To change the colors of a price scale
▪
Right-click on the chart pane and select Properties.
▪
On the left side of the dialog, select the name of the chart pane, and then V.Scale > Fill Type (or Second
V.Scale > Fill Type for the additional price scale). For example: Pane 1 > V.Scale > Fill Type.
▪
On the right side of the dialog, choose the colors and fill type for the price scale:
Solid fill
The price scale is thoroughly colored with a single Color.
Vertical fill
The price scale is colored using a vertical gradient starting with the First color (this is equal to
the Color on solid fills) and ending with the Second color.
Horizontal fill
The price scale is colored using a horizontal gradient starting with the First color (this is equal
to the Color on solid fills) and ending with the Second color.
Changing the Font and Colors of the Time Scale
You can change the font of the dates and times that are displayed on the time scale, the color of the text and the
background color of the time scale. The background of a time scale can not only have a single color, but can also
display a gradient between two colors.
To change the font used in the time scale
▪
Right-click on the chart and select Properties.
▪
On the left side of the dialog, select General > H.Scale.
▪
On the right side of the dialog, adapt the default settings to your needs.
▪
You can see a preview of your settings in the Sample window at the bottom of the dialog.
Control
Description
Font
Type of font used for the time scale
Font Size
Size of the font used for the time scale
Foreground
Color of the text used in the time scale
Bold
Check to use a bold style for the time scale
Italic
Check to use an italic style for the time scale
Charting
232
TeleTrader Software GmbH
Marc-Aurel-Straße 10-12, 1010 Vienna, Austria
E-Mail [email protected]
Internet http://professional.teletrader.com
To change the colors of the time scale
▪
Right-click on the chart and select Properties.
▪
On the left side of the dialog, select General > H.Scale > Fill Type.
▪
On the right side of the dialog, choose the colors and fill type for the time scale:
Solid fill
The time scale is thoroughly colored with a single Color.
Vertical fill
The time scale is colored using a vertical gradient starting with the First color (this is equal to
the Color on solid fills) and ending with the Second color.
Horizontal fill
The time scale is colored using a horizontal gradient starting with the First color (this is equal
to the Color on solid fills) and ending with the Second color.
Customizing Chart Objects
A chart can hold several chart objects: Symbols (time series), chartable expressions (see Inserting a Chartable
Expression on page 189), drawing objects such as trend lines (see Drawing Tools on page 244) and studies
(indicators or signals, see Analysis Tools on page 299). You can change the properties of each of these objects, for
example its color or line style.
The Format Objects dialog offers you an easy way to get an overview about all objects that are present in a chart,
gives you easy direct access to the properties of each object and lets you temporarily hide or permanently delete
objects from your chart.
To change the properties of chart objects
▪
On the Format menu, click Objects.
Note
You can also click on the Chart Objects icon in the Chart toolbar:
▪
In the Format Objects dialog, choose the object that you want to change.
▪
Click Format. The Chart Properties dialog is opened with the correct object already pre-selected.
▪
For more information about the different settings available, see:
-
Symbol / time series: Customizing the Time Series on page 216
-
Drawing objects: Customizing Drawing Objects on page 270
-
Studies: Setting the Parameters of a Study on page 302 and Defining the Appearance of a Study on page
305
To delete chart objects
Note
This action cannot be undone. This will delete the selected chart object with all its settings.
▪
On the Format menu, click Objects.
▪
In the Format Objects dialog, choose the object that you want to delete.
▪
Click Delete.
▪
If you want to automatically close all chart panes that are now empty because no objects are present there
anymore, select Close empty panes.
▪
Click OK. The object is removed from the chart.
Charting
233
TeleTrader Software GmbH
Marc-Aurel-Straße 10-12, 1010 Vienna, Austria
E-Mail [email protected]
Internet http://professional.teletrader.com
To hide (show) chart objects in all chart types and data compressions
Note
Visible chart objects are displayed with a blue check mark on the left in the Format Objects dialog.
▪
On the Format menu, click Objects.
▪
In the Format Objects dialog, choose the object that you want to hide (or show).
▪
Click Hide to hide a chart object, or Show to display a hidden chart object again.
To add (remove) drawing objects for certain chart types and data compressions
You can automatically show or hide drawing objects in certain chart types or data compressions. To do this, you have
to add drawing objects to (or remove them from) certain chart types or data compressions. This function should be
used in combination with the Hide property of drawing objects. For more information, see Hiding Drawing Objects on
page 294.
▪
On the Format menu, click Objects.
▪
In the Format Objects dialog, choose the drawing object that you want to add to (or remove from) the current
chart type and data compression.
▪
Click Add to add the drawing object to the current chart type and data compression, or Remove to remove it
from the current chart type and data compression.
Note
Removing a drawing object from a chart type and data compression is not the same as deleting a
drawing object. The drawing object remains in the chart, it is only not visible (hidden) in the current
chart type and data compression.
Continuous Contracts / Continuation Charts
All futures contracts have a limited lifetime. After a certain date (the expiration date), they are not traded anymore. If
you want to chart a longer history of a data for technical analysis, you have to find a way to combine several futures
contracts together. This can be done with continuation charts.
Continuation charts use virtual futures contracts, so-called continuous contracts, and plot them on the chart. A
continuous contract is constructed with data from several normal futures contracts. In the easiest construction
method, whenever one contract expires, you continue with the data of the next contract. However, this simple method
often leads to price gaps in the chart, and can be misleading, because usually a contract has lower trading volume
and open interest already for some time before its expiration date. Therefore, more sophisticated methods to merge
the different contracts together have been developed. Many of them are available in TeleTrader Professional.
When you create a continuation chart, you define some initial settings (you can later change these settings of course).
With these settings, you can control what futures contracts (expiration months) are used for constructing the
continuation chart, when the switch (rollover) between two contracts will take place, and if and how the prices of older
contracts are adjusted to avoid gaps in the chart on rollover.
Continuation charts look like normal charts, except that they have an additional marker to show you when the rollover
from one contract into the next took place. This rollover bar, candle or data point is shown in a different color than
other bars on Financial charts (with the exception of Line and Stair Step charts).
To change the color of the rollover bar
▪
Right-click on the chart and select Properties.
▪
On the left side of the dialog, select the name of the chart pane, the name of the symbol and then Line Style. For
example: Pane 1 > FDAX 2009H,CC > Line Style.
▪
On the right side of the dialog, select a color used for the Rollover Bar.
Charting
234
TeleTrader Software GmbH
Marc-Aurel-Straße 10-12, 1010 Vienna, Austria
E-Mail [email protected]
Internet http://professional.teletrader.com
Creating a Continuation Chart
You can create a continuation chart only for futures. The document type Continuation Chart is only available when
the symbol that you want to open is a futures contract.
A continuation chart is created in the same way as all other documents, which means that you can for example open
it from the QuickBar, from the Symbol Search results, from other documents like price pages or from the symbols that
you have stored in FastLook. For more information, see Creating Charts and Opening Documents from a Chart on
page 174.
If you want to use a chart template for your continuation chart, the same templates are available like for the normal
chart documents.
When you open a continuation chart from the Symbol Search results, you can already adapt the continuation settings
before opening the continuation chart document. You can of course later change theses settings at any time (see
Changing Continuation Settings on page 235).
To open a futures contract in a chart with custom continuation settings
▪
On the File menu, click New Document.
▪
In the New Document dialog, click on the Chart tab.
▪
In the Template pane on the left side, click on the template that you want to use. You can see a preview of the
template in the Preview pane on the right side.
▪
Click OK. The Symbol Search dialog is displayed.
▪
Enter your search term in the first field on the left side and change the search settings, if necessary. For more
information, see Searching for Securities in the Symbol Search Dialog on page 34.
▪
Click on the green button or press the ENTER key to start the search.
▪
Select the symbol that you want to open as a continuation chart.
▪
Click on the Continuation tab and change the continuation settings to your needs. See Changing Continuation
Settings on page 235 for details.
▪
Click OK on the Continuation tab. The new continuation chart is formatted with the chosen template.
Note
If you click OK on the Symbol Search tab instead of on the Continuation tab, a normal chart
document will be opened.
Changing Continuation Settings
Continuation charts can be constructed in different ways. Data from several futures contracts has to be used,
because every futures contract expires at a certain date and cannot be traded afterwards.
With the continuation settings, you can control what futures contracts (expiration months) are used for constructing
the continuation chart, when the switch (rollover) between two contracts will take place, and if and how the prices of
older contracts are adjusted to avoid gaps in the chart on rollover.
To change the continuation settings
▪
Right-click on the chart and select Properties.
▪
On the left side of the dialog, select the name of the chart pane, the name of the symbol and then Continuation.
For example: Pane 1 > FDAX 2009H,CC > Continuation.
▪
On the right side of the dialog, adapt the default settings to your needs.
Charting
235
TeleTrader Software GmbH
Marc-Aurel-Straße 10-12, 1010 Vienna, Austria
E-Mail [email protected]
Internet http://professional.teletrader.com
Symbol settings
With these settings, you can control what contract is used as the current contract with real prices in the continuation
chart and what expiration months are used to construct the continuous contract.
Control
Description
Symbol
Unique identification of the used symbol. You can replace it with the ID of
another symbol to change the symbol used in the chart, but we recommend
to use the Change Symbol dialog instead. See Changing Symbols on page
73.
Forward contract
Forward contract that is used as the current contract in the continuation
chart, that means the contract that all other prices are back-adjusted to. The
default setting is 1, which means that the current contract is the front month.
This setting is not connected to the rollover date in any way.
Control months
Contract expiration months that are used for creating the continuous
contract. By default, all available months are included.
Time Frame
Data compression used for the continuation chart - Daily or intraday
(Minutes).
This setting is only available on the Continuation tab in the Symbol Search
dialog. For changing the data compression later, see Changing the Data
Compression on page 175.
Rollover settings
These settings control when to switch (roll over) from one contract to the next. You can either roll based on the
expiration date / month of a contract, or based on its open interest / volume.
For details about rollover and the different options, see Rollover of Continuous Contracts on page 237.
Control
Description
Trigger
Condition that is used to trigger the rollover into the next contract. This can
be a specific date, open interest, volume or a combination.
Number of days … from …
Months prior
Details for the date rollover condition.
These settings are only visible when Trigger is set to Date.
Confirmation
Details for the open interest or volume rollover conditions.
This setting is only visible when Trigger is set to Open Interest, Volume or
a combination of both.
Timing
Determines when the rollover takes place as soon as the trigger condition is
met.
This setting is only available when Trigger is set to Open Interest, Volume
or a combination of both.
Adjustment settings
When splicing the different contracts together, you can let Professional adjust the prices of older contracts to avoid
gaps in the chart. These settings control if and how the older prices are adjusted. The current contract is always
shown with its real prices.
For details about price adjustment and the different options, see Back Adjustment of Continuous Contracts on page
239.
Note
Control
Charting
The adjustment settings are not used for continuation charts with weekly or monthly compression.
Description
236
TeleTrader Software GmbH
Marc-Aurel-Straße 10-12, 1010 Vienna, Austria
E-Mail [email protected]
Internet http://professional.teletrader.com
Pricing
Determines how the price difference between the old and the new contract is
calculated to splice the contracts together.
Accumulation
Determines if the prices of older contracts are adjusted to the current
contract, and in what way.
Rollover of Continuous Contracts
As futures contracts expire at a certain date, a continuation chart has to be constructed with data from several futures
contracts. The so-called rollover (switch) between one contract and the next can be triggered by different conditions.
TeleTrader Professional supports both rolling on a fixed date, or rolling based on a rise of open interest and/or volume
in the next contract.
Rollovers are always calculated using daily data (end of day data), even when you are using an intraday continuation
chart. This means that a rollover will never occur intraday, but always between trading sessions (days).
Rollover triggered by date
You can roll to the next contract on a certain date, often based on the expiration date of the front month contract (the
contract that will expire next).
The rollover date must always be a trading day. When the date that you specify (for example, two days before the
expiration date), is a non-trading day, such as a holiday or weekend, the rollover will occur on the next trading day
after this date.
Note
The front month contract is not the same as the current contract. If you choose to display a later
contract as the current contract (Forward contract setting is greater than 1), the rollover date will
still be calculated based on the expiration date / month of the front month contract.
To trigger rollover on a certain date
▪
Right-click on the chart and select Properties.
▪
On the left side of the dialog, select the name of the chart pane, the name of the symbol and then Continuation.
For example: Pane 1 > FDAX 2009H,CC > Continuation.
▪
On the right side of the dialog, choose the option Date from the Trigger list.
▪
In the From list, choose whether you want to calculate the rollover date based on the expiration date of the
contract, or based on the start or end of the month.
▪
Expiration date
Rollover will occur on or several days before the expiration date of the front month contract.
Start of month
Rollover will occur several days after the start of the month in which the front month contract
expires.
End of month
Rollover will occur several days before the end of the month in which the front month
contract expires.
In the Number of days field, enter the number of days that should be between the expiration date or start / end
of the month and the rollover date. For example, if you want a rollover on the tenth day after the start of the
expiration month, enter 10.
Note
Charting
If the rollover date is calculated based on the expiration date of the contract, the numbers shown
will be negative, which means that rollover will occur the specified number of days before the
expiration date. If you enter 0, rollover will occur exactly on the expiration date. If you use a later
contract as the current contract (Forward contract setting is greater than 1), you can also enter
positive numbers, which means that rollover can also occur after the expiration date of the front
month contract.
237
TeleTrader Software GmbH
Marc-Aurel-Straße 10-12, 1010 Vienna, Austria
E-Mail [email protected]
Internet http://professional.teletrader.com
▪
If the rollover date is calculated based on the start or end of the expiration month, you can additionally specify
that the rollover will occur one or several months before the expiration month. Enter the number of months in the
Months prior field. The default setting is 0, which means that the rollover will occur on the specified date in the
expiration month.
Rollover triggered by open interest and/or volume
You can roll to the next contract when the open interest / volume of the next contract after the front month contract
exceeds the open interest / volume of the front month contract.
As the rollover date is calculated using daily (end of day) open interest / volume data, the rollover will occur one or
two days after the rollover trigger. You can influence the timing of the rollover with the Timing setting (see below).
Note
The front month contract is not the same as the current contract. If you choose to display a later
contract as the current contract (Forward contract setting is greater than 1), the rollover date will
still be based on the open interest / volume of the front month contract (the contract that expires
next).
To trigger rollover based on open interest and/or volume
▪
Right-click on the chart and select Properties.
▪
On the left side of the dialog, select the name of the chart pane, the name of the symbol and then Continuation.
For example: Pane 1 > FDAX 2009H,CC > Continuation.
▪
On the right side of the dialog, choose an open interest or volume option from the Trigger list:
▪
Open Interest
Rollover will be triggered when the open interest of the next contract is higher
than the open interest of the front month contract.
Volume
Rollover will be triggered when the volume of the next contract is higher than the
volume of the front month contract.
Open interest and volume
Rollover will be triggered when both open interest and volume of the next
contract are higher than the open interest and volume of the front month
contract.
Open interest or volume
Rollover will be triggered when either open interest or volume of the next
contract are higher than the open interest or volume of the front month contract.
From the Confirmation list, choose whether one trigger is enough to roll the contract, or if Professional should
wait for more triggers before rolling to the next contract.
Roll on first trigger
Rollover will occur when the trigger condition is met for the first time.
Roll on second consecutive
trigger
Rollover will occur when the trigger condition is met two times in a row.
Roll on third consecutive
trigger
Rollover will occur when the trigger condition is met three times in a row.
Roll on fourth consecutive
trigger
Rollover will occur when the trigger condition is met four times in a row.
Timing after the rollover has been triggered
When the rollover is triggered by open interest or volume, the fact that the chart should be rolled into the next contract
is only known at the end of the day, because daily (end of day) open interest / volume data is used to calculate the
trigger. This means that the rollover can occur the next trading day at the earliest. When the rollover is done, a
rollover bar will be shown on the chart in a different color. The prices of this rollover bar are already the prices of the
new contract.
Charting
238
TeleTrader Software GmbH
Marc-Aurel-Straße 10-12, 1010 Vienna, Austria
E-Mail [email protected]
Internet http://professional.teletrader.com
To change the timing settings
▪
Right-click on the chart and select Properties.
▪
On the left side of the dialog, select the name of the chart pane, the name of the symbol and then Continuation.
For example: Pane 1 > FDAX 2009H,CC > Continuation.
▪
On the right side of the dialog, choose an option from the Timing list:
Align with price data
Rollover will occur on the day after the rollover was triggered with an open interest
or volume trigger. The day after the trigger will already start with the Open price of
the new contract.
When known
Rollover will occur two days after the rollover was triggered with an open interest or
volume trigger. The day after the trigger will still show the prices of the old contract,
the Open price of the new contract will start the following day.
When you use a Date trigger, rollover will always occur on the exact date that you specify in the trigger settings,
therefore the option Timing is not available. The chosen day will already start with the Open price of the new
contract.
Date trigger
Back Adjustment of Continuous Contracts
A continuation chart is constructed from several futures contracts. The prices for different contracts are usually not
equal, even on the same day. Therefore, when rolling from one contract to the next, price gaps would appear on the
chart on rollover day. When you use technical analysis tools (such as indicators or signals) on a continuation chart,
these gaps can hinder the correct interpretation of the price movement. To eliminate the gaps, the prices of all older
contracts can be back-adjusted.
Charting
239
TeleTrader Software GmbH
Marc-Aurel-Straße 10-12, 1010 Vienna, Austria
E-Mail [email protected]
Internet http://professional.teletrader.com
When you use adjusted prices, only the current contract is shown with its real prices. For all older contracts, adjusted
(synthetic) prices are used. This means that the prices you can read from the chart for older contracts are not equal to
the actual prices of these contracts at the shown date.
Back adjustment of prices is done by calculating a price difference between the old contract and the new contract on
rollover day. All older contracts are then adjusted by this difference. Only new data is added to the chart with its actual
prices.
You can determine if the historic prices should be adjusted at all, and if yes, by which method (absolute adjustment or
percentage adjustment). If the prices should be adjusted, you can choose how the price difference between the old
and new contract is calculated. The price difference is always calculated with daily (end of day) prices, even if you
use an intraday continuation chart.
Note
The adjustment settings are not used for continuation charts with weekly or monthly compression.
To adjust the prices of older contracts to the price of the current contract
▪
Right-click on the chart and select Properties.
▪
On the left side of the dialog, select the name of the chart pane, the name of the symbol and then Continuation.
For example: Pane 1 > FDAX 2009H,CC > Continuation.
▪
On the right side of the dialog, choose an option from the Accumulation list:
▪
Back adjust
The absolute price difference between the current contract and the previous
contract is added to or subtracted from all older contracts.
Percentage adjust
The price difference between the current contract and previous contract is
calculated as a percentage. The prices of older contracts are adjusted by this
percentage.
No adjustment
The prices of older contracts are not adjusted to the price of the current contract.
Gaps may be visible in the chart on rollover.
Choose a Pricing option from the list to determine how the price difference between the current contract and the
previous contract will be calculated:
Close old contract, close
new contract
The Close price of the current contract is compared with the Close price of the
previous contract on the same day.
Open old contract, open
new contract
The Open price of the current contract is compared with the Open price of the
previous contract on the same day.
Close old contract, open
new contract
The Open price of the current contract is compared with the Close price of the
previous contract from the previous day.
Sharing and Printing Charts
You can share the charts that you have worked on with other people, or create a printout of your chart documents.
To share a chart, you can either save the chart as a picture file or copy it directly to another program via the Windows
clipboard. You can also attach the chart as a picture or as a Professional document to an e-mail: See Sending
Workspaces, Virtual Pages or Documents via E-Mail on page 169.
Printing Charts
Like other documents, charts can be printed. In the Chart Print Setup dialog, you can choose which part of the chart
should be printed, if the data should be printed on one page or multiple pages, how the data should be scaled if
printed on multiple pages, etc.
Charting
240
TeleTrader Software GmbH
Marc-Aurel-Straße 10-12, 1010 Vienna, Austria
E-Mail [email protected]
Internet http://professional.teletrader.com
To print a chart
▪
On the File menu, click Print.
Note
If you want to see a preview of the chart before printing, choose File > Print Preview.
To change the print setup for charts
▪
On the File menu, click Chart Print Setup.
▪
Adapt the default settings to your needs.
Control
Description
Current visible records
Print only the section of the chart that is currently visible on the screen.
All records
Print the whole chart, independent of the data that is visible on the screen.
Per page
The vertical scaling of the time series is determined per page. That means that the
vertical scale of each page is related to the maximum and minimum points of the part
of the time series that is visible on that page
Entire data series
The vertical scaling of the time series is determined once for the whole time series
based on the maximum and minimum points of all loaded data. The vertical scale is
the same on each page.
Color settings
Select to choose from different printing color setups:
Full Color
Print the chart in color.
Grayscale
Print the chart data in black and white, with price and time scales
in gray color.
Monochrome
Print the whole chart in black and white.
Partial Color
Print the chart data in color, with white background.
This setting is also applied when Use same color settings for "Copy Chart" and / or
Use same color settings for "E-mail Chart" are selected.
Use same color
settings for "Copy
Chart"
Check to also apply printing color settings when copying a chart to another program
via the Windows clipboard.
Use same color
settings for "E-Mail
Chart"
Check to also apply printing color settings when sending a chart by email.
Print on one page
Compress the chart to fit on a single sheet of paper.
Keep display ratio
Print the chart with the same display ratio as it appears on the screen.
To change the page setup
See Printing Documents on page 163.
Saving Charts as Picture Files
In addition to saving a chart as a normal Professional document, you can also save a chart as a picture file. Picture
files can be used with many image processing programs.
You can also copy a chart as a picture to the Windows clipboard, and then paste it to other programs.
To save a chart as a picture file
▪
On the File menu, click Document > Save as Picture File.
▪
In the Save As dialog, enter a name for the file in the File name field.
Charting
241
TeleTrader Software GmbH
Marc-Aurel-Straße 10-12, 1010 Vienna, Austria
E-Mail [email protected]
Internet http://professional.teletrader.com
▪
In the Save as type field, choose the picture file format that you want to use: BMP, JPEG, GIF, TIFF or PNG.
▪
Choose the location where you want to save the picture file. Professional will suggest to save it to your
Documents folder. You can also use a different location.
▪
Click Save.
Note
The TeleTrader logo is added as a watermark to the chart picture.
To copy a chart to other applications as a picture
▪
Right-click on the chart and select Copy Chart. The chart is copied to the Windows clipboard.
▪
Paste the chart into another application, for example a desktop publishing program or a image processing
program.
Note
The TeleTrader logo is added as a watermark to the chart picture.
To save a chart as a Professional document
See Creating and Saving Documents on page 159.
Using Charts Offline
If you want to work with some symbols in a chart without a permanent Internet connection, you can export the time
series that you need to the local database of TeleTrader Professional. You can work with all symbols that are
available in your local database even if you do not have a live connection to the Internet. To do this, you have to
switch to offline mode before disconnecting from the Internet.
You can also export the time series of a symbol to a text file. The exported data includes the date/time, Open, High,
Low and Close prices, as well as Volume and Open Interest, if available. To copy time series data to the clipboard
instead, see also Copy Data to the Clipboard as Text on page 378.
To export a time series to the local database
▪
Right-click the time series and choose Export Security > Export to local database.
▪
In the Export to local data base dialog, enter a local symbol ID with at most 14 characters into the field Choose
symbol ID.
▪
Enter a symbol description (name) with at most 16 characters into the field Choose description.
▪
Choose how many decimals you want to export from the list. If you choose Auto, Professional will automatically
determine the number of decimals to export based on the symbol data.
▪
Click Export and wait for the export to finish. You can see the progress in the blue progress bar.
▪
Click Finish. You can now find the exported symbol with Symbol Search under the ID and name that you have
chosen for it. The symbol is automatically added to the exchange <Local>.
Note
You cannot export a time series to the local database if you are using a tick by tick or tickbar
compression. You can however export tick data to a text file.
To switch to offline mode
▪
On the Tools menu, choose Options.
▪
On the left side of the dialog, select General.
Charting
242
TeleTrader Software GmbH
Marc-Aurel-Straße 10-12, 1010 Vienna, Austria
E-Mail [email protected]
Internet http://professional.teletrader.com
▪
On the right side of the dialog, clear the checkbox Use this data feed on next login.
▪
Click OK. If you want to switch to offline mode immediately, close TeleTrader Professional now.
▪
On the next start of TeleTrader Professional, you will see the dialog More than one data feed available.
▪
Select Work Offline and click OK.
▪
You can now only work with the symbols that you have exported to your local database. To find them, use
Symbol Search.
Note
To switch back to the online mode, close Professional. On the next start, select TeleTrader MDS
in the dialog More than one data feed available. If you want to keep using the online mode, also
check the option Use this data feed on next login.
To export a time series to a text file
▪
Right-click the time series and choose Export Security > Export to text document.
▪
In the Save as dialog, enter a name for the document in the File name field.
▪
Choose the location where you want to save your document. Professional will suggest to save it into your
Documents folder. You can also use a different location.
▪
Click Save. A message will inform you once the security data has been successfully exported.
Note
Charting
The export of tick and intraday data is limited to a maximum of seven days of data. For tick data,
there is an additional limit of 10,000 records. For fast-ticking symbols, one whole day of tick data
can be exported, even when the number of ticks exceeds the limit. When the export limit is
reached, only the newest records up to the limit are exported and you will be notified by a system
message.
243
TeleTrader Software GmbH
Marc-Aurel-Straße 10-12, 1010 Vienna, Austria
E-Mail [email protected]
Internet http://professional.teletrader.com
Drawing Tools
Drawing tools use graphical techniques, like trend lines, trend channels, support and resistance levels, Fibonacci
retracements, Pivot Points and many more, to interpret the price development of a security. You can only use drawing
tools in charts.
All drawing tools are available from the Drawing toolbar:
With these tools you can add different drawing objects to a chart. You can also customize their appearance, and in
some cases the underlying calculation methods (for example for Pivot Points).
If you want to get a notification (sound, message or e-mail) when the time series or a study cross a drawing object,
you can use intersection alerts: See Intersection Alerts on page 326.
Note
TeleTrader Software GmbH wants to point out explicitly that all examples in this manual were
made up in retrospect and show an idealized situation. Interpretations of drawing tools are
intended as a thought-provoking impulse and should in no way be understood as a
recommendation to buy or sell a security.
Adding Drawing Objects to a Chart
To add drawing objects to a chart, you have to use drawing tools. All drawing tools are available from the Drawing
toolbar and from the Insert menu. Just click on the corresponding icon of the drawing tool to make it active:
Free Line
Trend Channel
Linked Parallel Lines
Horizontal Line
Regression Line
Regression Channel
Rectangle
Ellipse
Fibonacci Fan
Fibonacci Trend Line
Fibonacci Retracements
Fibonacci Expansions
Fibonacci Arc
Speed Resistance Line
Gann Square
Drawing Tools
244
TeleTrader Software GmbH
Marc-Aurel-Straße 10-12, 1010 Vienna, Austria
E-Mail [email protected]
Internet http://professional.teletrader.com
Gann Fan
Andrews Pitchfork
Wave and Harmonics
Pivot Points
Text
Vertical Lines
Fibonacci Vertical Lines
Cycle Lines
Price Change
Arrow Up
Arrow Down
As long as a tool is active, you can use it to draw the object on the chart. For most drawing tools, you have to define
one or more reference points that indicate where the drawing object should be placed on the chart. You can later
move these reference points by dragging them with the mouse.
After you have inserted a drawing object, it will usually also stay visible if you change the data compression of the
chart (for example switching from a daily to an intraday chart). See Hiding Drawing Objects on page 294 for details.
Keyboard positioning of reference points
In addition to using the mouse to position a reference point, you can also use the keyboard for a more precise
positioning:
▪
Click on the icon of the drawing tool on the Drawing toolbar.
▪
Move the mouse pointer near the position on the chart where you want to enter the reference point.
▪
Use the following keyboard commands to set the reference point at a precise price:
O
Open price of this bar / column
H
High price of this bar / column
L
Low price of this bar / column
C
Close price of this bar / column
Drawing Tools
245
TeleTrader Software GmbH
Marc-Aurel-Straße 10-12, 1010 Vienna, Austria
E-Mail [email protected]
Internet http://professional.teletrader.com
Note
When you are drawing on a chart with overlaid symbols (see Inserting, Overlaying and Changing
Symbols in a Chart on page 187), and the bars overlap, the reference point is always positioned at
the highest / lowest or first / last of the available prices.
Keep drawing tools active
After you have finished drawing, the drawing tool will become inactive again by default. If you want to keep the tool
active for a longer time, for example to draw several trend lines after each other, you can activate a setting under
Tools > Options > Chart that will keep the tool active until you press the ESC key or select another drawing tool. See
Chart Settings on page 340.
Snapping to the Nearest Price with the Magnet
When you add a drawing object to the chart by setting its reference points, you can use the Snap tool (Magnet) to
automatically position the reference point at the nearest price of a bar / data point. This means that when you activate
the Snap tool, the reference points are automatically pulled to the nearest price. You can choose the strength of the
"magnet".
Note
The Snap tool can be used in combination with all drawing tools except shapes, text, arrows, Pivot
Points and vertical / cycle lines. The tool Wave and Harmonics snaps automatically to the most
logical prices.
To activate the Snap tool
▪
Click on the Snap icon on the Drawing toolbar:
▪
The Snap tool will stay active until you click on the Snap icon again.
Note
If you only want to use the Snap tool temporarily, hold the CTRL key while drawing on the chart.
To set the strength of the Snap tool
▪
Click on the arrow next to the Snap icon on the Drawing toolbar.
▪
Select the strength of the magnet from the list that appears. The currently used strength is highlighted with a
check mark.
▪
Select Custom to manually enter the strength of the magnet in the Snap Percentage dialog.
To use the Snap tool with the Select and Crosshair tool
You can also use the Snap tool in combination with the Select and Crosshair tool. The crosshair will snap to the
nearest price automatically. Activate this feature under Tools > Options > Chart: See Chart Settings on page 340 for
details.
Lines and Trend Channels
The line drawing tools can be used to draw trend lines, other (free) lines, trend channels or horizontal lines. Trend
lines, trend channels and horizontal lines are all used as support or resistance lines.
To draw a trend line, you need two reference points (A and B). The reference points are positioned at pivots, for
example at two highs (uptrend) or two lows (downtrend).
To draw a trend channel, you need a third reference point (C) that defines the distance of the second line from the
first trend line. A trend channel essentially consists of two parallel trend lines that surround the trending time series.
Drawing Tools
246
TeleTrader Software GmbH
Marc-Aurel-Straße 10-12, 1010 Vienna, Austria
E-Mail [email protected]
Internet http://professional.teletrader.com
You can convert a trend line to a trend channel by setting the third reference point, and add action / reaction lines
above or below the channel.
To draw a horizontal line, you only need one reference point that is positioned at the price level where you want the
line to appear.
Free lines can be used for example to highlight significant chart formations that signify a trend reversal or continuation
of the trend.
▪
You can change the color and style of the line(s), show the prices at the reference points or position horizontal
lines at a specific level: See Customizing Lines and Trend Channels on page 274.
To draw a trend line or free line
▪
Click on the Free Line icon on the Drawing toolbar:
▪
Click on the chart at the first reference point of your line (A) and hold the mouse button down. To draw the line at
an exact angle of 45°, 90°, 180° etc., press and hold the SHIFT key while drawing.
▪
Move the mouse pointer to the second reference point of your line (B) and release the mouse button.
Note
While you are drawing the line, you can move the whole line vertically without changing its
direction: Press the ALT key after defining the second reference point of your line and keep holding
the mouse button, then move the line to its final position.
To draw a trend channel
▪
Click on the arrow next to the Free Line icon on the Drawing toolbar, and then click on the Trend Channel icon:
▪
Click on the chart at the first reference point of your line (A) and hold the mouse button down.
▪
Move the mouse pointer to the second reference point of your line (B) and release the mouse button.
▪
Move the mouse pointer away from the trend line and click on the third reference point (C) at the distance where
you want to position the second line of the trend channel.
Drawing Tools
247
TeleTrader Software GmbH
Marc-Aurel-Straße 10-12, 1010 Vienna, Austria
E-Mail [email protected]
Internet http://professional.teletrader.com
To draw a horizontal line (support / resistance line)
▪
Click on the arrow next to the Free Line icon on the Drawing toolbar, and then click on the Horizontal Line icon:
▪
Click on the chart at the level where you want the horizontal line to appear.
To change the breadth of a trend channel
▪
Click on the trend channel to select it.
▪
Click on any reference point and hold the mouse button down.
▪
Press and hold the ALT key.
▪
Drag the reference point upwards or downwards to change the breadth of the channel.
▪
Release the mouse button to fix the new breadth. The direction of the channel will not be changed.
Note
You can also change the breadth of a trend channel with action / reaction lines (see below). The
distance of all other lines is then automatically adjusted to the new breadth.
To convert a trend line to a trend channel
▪
Click on the trend line to select it.
▪
Click on the visibility point of the line and hold the mouse button down.
▪
Drag the visibility point upwards or downwards until a white preview line appears above or below the trend line.
▪
Release the mouse button to drop the line and create the trend channel.
Note
Drawing Tools
You can remove the second line to convert the trend channel back to a trend line by doubleclicking the visibility point of either line. This only works as long as you have not added any action /
reaction lines (see below).
248
TeleTrader Software GmbH
Marc-Aurel-Straße 10-12, 1010 Vienna, Austria
E-Mail [email protected]
Internet http://professional.teletrader.com
Action / reaction lines
When you have drawn a trend channel, you can add action / reaction lines above or below the channel as additional
support / resistance levels. These lines are drawn parallel to the trend channel at an equal distance.
Action / reaction lines have been introduced by Roger Babson in the early 90s. At the heart of the method is Newton’s
physical sciences law that every action has an equal and opposite reaction. In its simplest form, the action / reaction
method shows a trader when and where to add on positions if a market is in a strong trend.
To draw action / reaction lines
▪
Click on the trend channel to select it.
▪
Click on any visibility point of the channel and hold the mouse button down.
▪
Drag the visibility point upwards or downwards until a white preview line appears on the above or below the
channel.
▪
You can drag the visibility point further to create more action / reaction lines.
▪
Release the mouse button to add the action / reaction lines to the chart.
Note
To remove (hide) action / reaction lines again, see Hiding and Showing Lines / Levels with Visibility
Points on page 296.
Linked Parallel Lines
The new Linked Parallel Lines drawing tool is very similar tool to Trand Channel. It allows you to draw multiple
parallel lines, but at customizable distances relative to the main line.
Linked Parallel Lines are drawn like normal trend line by connecting two spots (A and B). Then, you need to click on
the third point (C) to draw linked parallel line. You can add more parallel lines at a customized distance relative to the
main line.
Drawing Tools
249
TeleTrader Software GmbH
Marc-Aurel-Straße 10-12, 1010 Vienna, Austria
E-Mail [email protected]
Internet http://professional.teletrader.com
You can show / hide labels and prices and change the color and style of the Linked Parallel Lines: See Customizing
Linked Parallel Lines on page 274.
To draw Linked Parallel Lines
▪
Click on the Linked Parallel Lines icon on the Drawing toolbar:
▪
Click on the chart at the first reference point (A - starting point) of the line and hold the mouse button down.
▪
Move the mouse pointer to the second reference point of the line (B - end point) and release the mouse button.
▪
Move the mouse pointer away from the main line and click on the third reference point (C – parallel line) at the
distance where you want to position the parallel line.
You can extend the Linked Parallel Lines to to the left / right by using extension points: See Extending and Shortening
Lines with Extension Points on page 271.
To draw additional channel lines
▪
Click on the Linked Parallel Lines to select it.
▪
Click on any visibility point of the lines and hold the mouse button down.
▪
Drag the visibility point upwards or downwards until white preview lines appear above and below the line.
▪
Release the mouse button to add the additional line to the chart.
Note
Drawing Tools
To remove (hide) additional parallel lines again, see Hiding and Showing Lines / Levels with
Visibility Points on page 296.
250
TeleTrader Software GmbH
Marc-Aurel-Straße 10-12, 1010 Vienna, Austria
E-Mail [email protected]
Internet http://professional.teletrader.com
Regression Lines and Regression Channels
Regression lines and channels are based on the best fit of all prices between a starting point and an end point. The
best fit is determined by calculating the least amount of space between the price points and the linear regression line,
using the method of least squares. The regression line thus represents the median line of the changing price. It can
be considered as an equilibrium price line – any deflection up or down indicates super-activity of buyers or sellers.
To draw a regression line, you need two reference points (A and B). The reference points define the period of time for
which the linear regression trend is shown on the chart.
The regression channel lines are automatically added at a distance of one standard deviation above and below the
regression line. The channel borders serve as support / resistance lines. You can add more channel lines at a
distance of two, three or more standard deviations from the regression line above and below the channel.
You can change the color and style of the regression line or channel: SeeCustomizing Regression Lines and
Regression Channels on page 275.
To draw a regression line
▪
Click on the Regression Line icon on the Drawing toolbar:
▪
Click on the chart at the first reference point of your line (A) and hold the mouse button down.
▪
Move the mouse pointer to the second reference point of your line (B) and release the mouse button.
To draw a regression channel
▪
Click on the arrow next to the Regression Line icon on the Drawing toolbar, and then click on the Regression
Channel icon:
▪
Click on the chart at the first reference point of your line (A) and hold the mouse button down.
▪
Move the mouse pointer to the second reference point of your line (B) and release the mouse button.
To draw additional channel lines
▪
Click on the regression channel to select it.
▪
Click on any visibility point of the channel and hold the mouse button down.
▪
Drag the visibility point upwards or downwards until white preview lines appear above and below the channel.
Drawing Tools
251
TeleTrader Software GmbH
Marc-Aurel-Straße 10-12, 1010 Vienna, Austria
E-Mail [email protected]
Internet http://professional.teletrader.com
▪
You can drag the visibility point further to create more channel lines at a distance of two, three or more standard
deviations from the regression line.
▪
Release the mouse button to add the additional lines to the chart.
Note
To remove (hide) additional lines again, see Hiding and Showing Lines / Levels with Visibility
Points on page 296.
Shapes
TeleTrader Professional provides you with two shape tools to mark significant areas on a chart: The rectangle and the
ellipse tool. Both tools show transparent shapes on the chart.
You can change the colors, borders and transparency settings for a shape object: See Customizing Shapes on page
275. Shapes are automatically drawn behind other chart objects (in the background of the chart). See also Moving
and Copying Drawing Objects on page 273.
To draw a rectangle
▪
Click on the Rectangle icon on the Drawing toolbar:
▪
Click on the chart at the top-left corner of your rectangle and hold the mouse button down.
▪
Move the mouse pointer to the bottom-right corner of your rectangle and release the mouse button.
To draw an ellipse
▪
Click on the Ellipse icon on the Drawing toolbar:
▪
Click on the chart at the midpoint of your ellipse and hold the mouse button down.
▪
Move the mouse pointer to choose the size of your ellipse and release the mouse button.
Fibonacci Fans
The Fibonacci Fan starts with a trend line (base line) and creates support / resistance lines at the so-called Fibonacci
levels of 38,2%, 50% and 61,8%.
Drawing Tools
252
TeleTrader Software GmbH
Marc-Aurel-Straße 10-12, 1010 Vienna, Austria
E-Mail [email protected]
Internet http://professional.teletrader.com
To draw a Fibonacci Fan, you need two reference points (A and B) that define the base line. Both reference points
are positioned at recent consecutive pivots (for example, a high and the following low). The vertical distance between
the two reference points (shown as the auxiliary blue dotted line on the picture below) is divided into the Fibonacci
levels. The fan lines are drawn from point A through the Fibonacci levels.
All Fibonacci drawing tools are based on the belief that the price development of securities is related to the numbers
of the Fibonacci sequence, a mathematical series of numbers that was discovered in the twelfth century, and the socalled Fibonacci levels, which are derived from the ratios of consecutive Fibonacci numbers. Fibonacci numbers and
Fibonacci ratios also appear in nature, for example in the arrangement of leaves in a sunflower, and in the golden
ratio, which is used for example in architecture and paintings.
The base line (reference line) of the fan is hidden by default, but you can also display it on the chart. Additionally, you
can choose which levels of the fan are displayed, customize the ratios used to calculate the levels, change the line
style for the fan lines, and show / hide the labels for each level: See Customizing Fibonacci Fans on page 276.
To draw a Fibonacci Fan
▪
Click on the Fibonacci Fan icon on the Drawing toolbar:
▪
Click on the chart at the first reference point of your base line (A) and hold the mouse button down.
▪
Move the mouse pointer to the second reference point of your base line (B) and release the mouse button.
You can extend the fan lines to the right by using extension points: See Extending and Shortening Lines with
Extension Points on page 271. To hide some of the lines, see Hiding and Showing Lines / Levels with Visibility Points
on page 296.
Fibonacci Trend Line
Fibonacci Trend Lines start with a trend line (base line, 0% line). The two reference points (A and B) are positioned at
pivots, for example at two highs (uptrend) or two lows (downtrend). Then, you need a third reference point (C) that
defines the distance from the first trend line to the second line (100% line). The trend channel is divided into the socalled Fibonacci levels. The channel (border) lines are forming the 0% and 100% lines of a diagonal Fibonacci
channel. The parallel 38,2%, 50% and 61,8% lines will be added automatically in between the border lines.
Drawing Tools
253
TeleTrader Software GmbH
Marc-Aurel-Straße 10-12, 1010 Vienna, Austria
E-Mail [email protected]
Internet http://professional.teletrader.com
All Fibonacci drawing tools are based on the belief that the price development of securities is related to the numbers
of the Fibonacci sequence, a mathematical series of numbers that was discovered in the twelfth century, and the socalled Fibonacci levels, which are derived from the ratios of consecutive Fibonacci numbers. Fibonacci numbers and
Fibonacci ratios also appear in nature, for example in the arrangement of leaves in a sunflower, and in the golden
ratio, which is used for example in architecture and paintings.
The connecting line between the first and third reference point is hidden per default, but you can choose to display it
on the chart. You can also use a color gradient across all or selected Fibonacci levels. Additionally, you can choose
which levels are displayed, customize the ratios used to calculate the levels, change the line style for the level lines,
and show / hide the labels for each level: See Customizing Fibonacci Trend Line on page 277. Fibonacci Trend Lines
are automatically drawn behind other chart objects (in the background of the chart). See also Moving and Copying
Drawing Objects on page 273.
To draw Fibonacci Trend Line
▪
Click on the Fibonacci Trend Line icon on the Drawing toolbar:
▪
Click on the chart at the first reference point of your line (A) and hold the mouse button down.
▪
Move the mouse pointer to the second reference point of your line (B) and release the mouse button.
▪
Move the mouse pointer away from the trend line and click on the third reference point (C) at the distance where
you want to position the second line (100% line).
You can extend the Fibonacci levels to the right by using extension points: See Extending and Shortening Lines with
Extension Points on page 271. To hide some of the levels, see Hiding and Showing Lines / Levels with Visibility
Points on page 296.
Fibonacci Retracements and Expansions
Fibonacci Retracements and Expansions both start with a trend line (base line) and divide it into the so-called
Fibonacci levels.
When using Fibonacci Retracements, the horizontal lines at those levels are believed to provide support / resistance
when the price moves into the opposite direction of the current trend (retracements). To draw Fibonacci
Retracements, you need two reference points (A and B) that define the base line. Both reference points are
positioned at recent consecutive pivots (for example, a high and the following low). The vertical distance between the
two reference points is divided into the Fibonacci levels.
When using Fibonacci Expansions, the horizontal lines at those levels are believed to provide support / resistance
when the price starts to move into the opposite direction of the current trend, but later reverses into the original
Drawing Tools
254
TeleTrader Software GmbH
Marc-Aurel-Straße 10-12, 1010 Vienna, Austria
E-Mail [email protected]
Internet http://professional.teletrader.com
direction. Fibonacci Expansions therefore need a third reference point (C) in addition to the two reference points of
Fibonacci Retracements. This reference point is positioned at a potential pivot. You can convert Fibonacci
Retracements to Fibonacci Expansions, and vice versa, by setting the third reference point.
All Fibonacci drawing tools are based on the belief that the price development of securities is related to the numbers
of the Fibonacci sequence, a mathematical series of numbers that was discovered in the twelfth century, and the socalled Fibonacci levels, which are derived from the ratios of consecutive Fibonacci numbers. Fibonacci numbers and
Fibonacci ratios also appear in nature, for example in the arrangement of leaves in a sunflower, and in the golden
ratio, which is used for example in architecture and paintings.
The base line (reference line) is hidden per default, but you can choose to display it on the chart. You can also use a
color gradient across all or selected Fibonacci levels. Additionally, you can choose which levels are displayed,
customize the ratios used to calculate the levels, change the line style for the level lines, and show / hide the labels
and prices for each level: SeeCustomizing Fibonacci Retracements and Expansions on page 279. Fibonacci
Retracements and Expansions are automatically drawn behind other chart objects (in the background of the chart).
See also Moving and Copying Drawing Objects on page 273.
To draw Fibonacci Retracements
▪
Click on the Fibonacci Retracements icon on the Drawing toolbar:
▪
Click on the chart at the first reference point of your base line (A) and hold the mouse button down.
▪
Move the mouse pointer to the second reference point of your base line (B) and release the mouse button.
To draw Fibonacci Expansions
▪
Click on the arrow next to the Fibonacci Retracements icon on the Drawing toolbar, and then click on the
Fibonacci Expansions icon:
▪
Click on the chart at the first reference point of your base line (A) and hold the mouse button down.
▪
Move the mouse pointer to the second reference point of your base line (B) and release the mouse button.
▪
Click on the third reference point (C).
To convert Fibonacci Retracements to Fibonacci Expansions
▪
Click on the drawing object to select it.
▪
Click on the third reference point that is positioned to the right of the second reference point and drag it to the
next pivot.
Drawing Tools
255
TeleTrader Software GmbH
Marc-Aurel-Straße 10-12, 1010 Vienna, Austria
E-Mail [email protected]
Internet http://professional.teletrader.com
▪
The Fibonacci Retracements are automatically converted to Fibonacci Expansions.
To convert Fibonacci Expansions to Fibonacci Retracements
▪
Click on the drawing object to select it.
▪
Click on the third reference point and drag it near the second reference point.
▪
The Fibonacci Expansions are automatically converted to Fibonacci Retracements.
You can extend the Fibonacci levels to the right by using extension points: See Extending and Shortening Lines with
Extension Points on page 271. To hide some of the levels, see Hiding and Showing Lines / Levels with Visibility
Points on page 296.
Fibonacci Arcs
With Fibonacci Arcs, you can try to identify support and resistance levels at the so-called Fibonacci levels of 38,2%,
50% and 61,8%. The arc lines can be shown as a half circle or full circle.
To draw Fibonacci Arcs, you need two reference points (A and B) that define the base line. Both reference points are
positioned at recent consecutive pivots (for example, a high and the following low). The vertical distance between the
two reference points (shown as an auxiliary blue dotted line on the picture below) is divided into the Fibonacci levels.
The arc lines are then drawn from point B with the radii of the resulting distances.
All Fibonacci drawing tools are based on the belief that the price development of securities is related to the numbers
of the Fibonacci sequence, a mathematical series of numbers that was discovered in the twelfth century, and the so-
Drawing Tools
256
TeleTrader Software GmbH
Marc-Aurel-Straße 10-12, 1010 Vienna, Austria
E-Mail [email protected]
Internet http://professional.teletrader.com
called Fibonacci levels, which are derived from the ratios of consecutive Fibonacci numbers. Fibonacci numbers and
Fibonacci ratios also appear in nature, for example in the arrangement of leaves in a sunflower, and in the golden
ratio, which is used for example in architecture and paintings.
You can show the arc lines as a full circle rather than as a half circle. Additionally, you can choose which levels are
displayed, customize the ratios used to calculate the levels, change the line style for the arc lines, and show / hide the
labels for each level: See Customizing Fibonacci Arcs on page 281.
To draw Fibonacci Arcs
▪
Click on the Fibonacci Arc icon on the Drawing toolbar:
▪
Click on the chart at the first reference point of your base line (A) and hold the mouse button down.
▪
Move the mouse pointer to the second reference point of your base line (B) and release the mouse button.
You can hide some of the arc lines: See Hiding and Showing Lines / Levels with Visibility Points on page 296.
Speed Resistance Lines
Speed Resistance Lines divide a trend into thirds, and create support / resistance lines for the following price
movements.
You need two reference points (A and B) to draw the base line. Both reference points are positioned at recent
consecutive pivots (for example, a high and the following low). The vertical distance between the two reference points
(shown as an auxiliary blue dotted line on the picture below) is divided into thirds. Two additional lines are drawn from
point A through the 1/3 level and the 2/3 level.
You can change the color and style of the Speed Resistance Lines: See Customizing Speed Resistance Lines on
page 283.
To draw Speed Resistance Lines
▪
Click on the Speed Resistance Line icon on the Drawing toolbar:
▪
Click on the chart at the first reference point of your base line (A) and hold the mouse button down.
▪
Move the mouse pointer to the second reference point of your base line (B) and release the mouse button.
Drawing Tools
257
TeleTrader Software GmbH
Marc-Aurel-Straße 10-12, 1010 Vienna, Austria
E-Mail [email protected]
Internet http://professional.teletrader.com
You can extend the Speed Resistance Lines to the right by using extension points: See Extending and Shortening
Lines with Extension Points on page 271. To hide some of the lines, see Hiding and Showing Lines / Levels with
Visibility Points on page 296.
Gann Square
The Gann Square drawing tool can be used for forecasting future support or resistance levels by combining time and
price by counting forward from important highs and lows. The starting point is generally an important High or Low on
the chart. The start and end points will be the diagonal corners of the square. The end reference point is often the last
bar on the chart.
Gann Square is available in two modes: Single square mode and Multi square mode.
▪
In Single square mode, only one Gann Square is plotted on the chart with four Gann Fans
▪
in Multi square mode (used as default settings), there is endless number of squares.
Gann Square paramenters:
Price unit: used for defining square height
Time unit: used for defining square width
There are two ways of drawing a Gann Square on the chart: One-click option and Click-hold-release option.
To draw a Gann Square using One-click option
▪
Click on the Gann Square icon on the Drawing toolbar:
▪
Click on the chart at the first reference point (A) to define lower left corner of a square
To draw a Gann Square using Click-hold-release option
▪
Click on the Gann Square icon on the Drawing toolbar:
▪
Click on the chart at the first reference point (A) and hold the mouse button down to define the two diagonal
corners.
▪
Move the mouse pointer to the second reference point (B) and release the mouse button.
To resize and reshape existing Gann Square:
▪
Click on any corner of the square on the chart and all four initial reference points will become white colored
▪
Click on one of them, hold the mouse button down, and readjust square size/shape
Drawing Tools
258
TeleTrader Software GmbH
Marc-Aurel-Straße 10-12, 1010 Vienna, Austria
E-Mail [email protected]
Internet http://professional.teletrader.com
Note
You can also change size/shape of a Gann Square by manually adjusting Price and Time units on
Properties sheet in Chart Properties dialog. See Customizing Gann Square on page 283.
Gann Fans
The Gann Fan uses lines that are drawn at specific geometric angels, starting from a significant high or low. The
geometric angles signify the relationship between price moves over time. For example, the base line (1x1 line) is
drawn so that the price moves one unit for every time unit. You can choose the size of the price and time units when
drawing the Gann Fan. All fan lines serve as support / resistance lines. If a line is broken, it is believed that the price
will move further towards the next fan line.
For drawing the fan, you need two reference points. The first reference point (A) sets the beginning of all Gann Fan
lines. The second reference point (B) defines the base line (1x1 line), and therefore also defines the size of the basic
price and time unit. You can for example draw the base line so that every five days (time unit), the price would have to
move 10 points (price unit) to follow the line. If the price and time unit have the same size on the chart, the base line
is drawn at an angle of 45°.
The other fan lines are added automatically. Three lines below the base line: 1x2 line (63,43°), 1x4 line (75,96°) and
1x8 line (82,87°); and three lines above the base line: 2x1 line (26,57°), 4x1 line (14,04°) and 8x1 line (7,13°). The
angles of the lines are adjusted relative to the position of the base line or 1x1 line (45°). These lines show for example
a move in every time unit of two price units (1x2 line), or a move in every four time units of one price unit (4x1 line).
You can change the color and style of all fan lines: See Customizing Gann Fans on page 285.
To draw a Gann Fan
▪
Click on the Gann Fan icon on the Drawing toolbar:
▪
Click on the chart at the first reference point of your base line (A) and hold the mouse button down.
▪
Move the mouse pointer to the second reference point of your base line (B) and release the mouse button.
You can extend the lines of the fan to the right by using extension points: See Extending and Shortening Lines with
Extension Points on page 271. To hide some of the fan lines, see Hiding and Showing Lines / Levels with Visibility
Points on page 296.
Drawing Tools
259
TeleTrader Software GmbH
Marc-Aurel-Straße 10-12, 1010 Vienna, Austria
E-Mail [email protected]
Internet http://professional.teletrader.com
Pivot Points
Pivot Points were originally developed and used by floor traders in order to define support and resistance levels
based on the prices of the preceding time period.
The levels are usually calculated by using the High, Low and Close price of the preceding time period. The middle line
(Pivot Point) is calculated by summing up these there values and dividing them by three. The other levels are
calculated based on the Pivot Point. Other methods for calculation besides the Classic Pivot Points include Floor
Pivot Points, Fibonacci Pivot Points etc.
Pivot Points do not need or have any reference points. They are drawn on the chart according to the chosen settings:
▫
Basis Date: The date that is used to define the first day of the calculation period. The Pivot Points object will be
inserted on the chart starting with this date.
▫
Starting Time: The starting time for the calculation period. This is especially important for intraday (hourly) Pivot
Points.
▫
Calculation Period: The time period that is used to retrieve the base values for the calculations. This can be set in
hours, days, weeks or months. The Pivot Points are automatically moved to the start of next time period when
one period ends. If you use 1-hour Pivot Points for example, they will be recalculated every hour.
You can also move a Pivot Points object on the chart by dragging it with the mouse. The basis date and starting time
will then be adjusted accordingly.
You can change the calculation period and calculation method for the Pivot Points on its property sheet. In addition,
you can choose which support / resistance levels are displayed, change the line style for the level lines, extend the
lines to the right border of the chart and show / hide the labels and prices for each level. You can also use colored
zones for each Pivot Points level. See Customizing Pivot Points on page 285. Pivot Points are automatically drawn
behind other chart objects (in the background of the chart). See also Moving and Copying Drawing Objects on page
273.
Drawing Tools
260
TeleTrader Software GmbH
Marc-Aurel-Straße 10-12, 1010 Vienna, Austria
E-Mail [email protected]
Internet http://professional.teletrader.com
To insert predefined Pivot Points
▪
Click on the arrow next to the Pivot Points icon on the Drawing toolbar:
▪
Choose a calculation period for the Pivot Points:
▪
Hourly
Sets the calculation period to 4 hours
Daily
Sets the calculation period to 1 day
Weekly
Sets the calculation period to 1 week
Monthly
Sets the calculation period to 1 month
Custom
Opens the Insert Pivot Points dialog and lets you define custom settings
The Pivot Points are drawn with the chosen calculation period. The basis date and starting time of the current
period are determined automatically. The Pivot Points are calculated with the classic method.
To insert custom Pivot Points
▪
Click on the Pivot Points icon on the Drawing toolbar:
▪
In the Insert Pivot Points dialog, choose the Basis Date and Starting Time for the calculation.
▪
Choose the Calculation Period.
▪
Choose the Calculation Type.
▪
Click OK.
You can hide some of the Pivot Point levels, see Hiding and Showing Lines / Levels with Visibility Points on page 296.
Different Calculation Types
TeleTrader Professional offers the following calculation types for Pivot Points:
Classic Pivot Points
Drawing Tools
Resistance3 =
High + 2 x (Pivot - Low)
261
TeleTrader Software GmbH
Marc-Aurel-Straße 10-12, 1010 Vienna, Austria
E-Mail [email protected]
Internet http://professional.teletrader.com
Resistance2 =
Middle4 =
Resistance1 =
Middle3 =
Pivot Point =
Middle2 =
Support1 =
Middle1 =
Support2 =
Support3 =
Pivot - Support1 + Resistance1
(Resistance1 + Resistance2) / 2
2 x Pivot - Low
(Pivot + Resistance1) / 2
(High + Low + Close) / 3
(Support1 + Pivot) / 2
2 x Pivot - High
(Support1 + Support2) / 2
Pivot - Resistance1 + Support1
Low - 2 x (High - Pivot)
Floor Pivot Points
Resistance3 =
Resistance2 =
Resistance1 =
Pivot Point =
Support1 =
Support2 =
Support3 =
High + 2 x (Pivot - Low)
Pivot + High - Low
2 x Pivot - Low
(High + Low + Close) / 3
2 x Pivot - High
Pivot - High + Low
Low - 2 x (High - Pivot)
Woodie’s Pivot Points
Resistance2 =
Resistance1 =
Pivot Point =
Support1 =
Support2 =
Pivot + High - Low
2 x Pivot - Low
(High + Low + 2 x Close) / 4
2 x Pivot - High
Pivot - High + Low
Camarilla Pivot Points
Resistance4 =
Resistance3 =
Resistance2 =
Resistance1 =
Support1 =
Support2 =
Support3 =
Support4 =
(High - Low) x 1,1 / 2 + Close
(High - Low) x 1,1 / 4 + Close
(High - Low) x 1,1 / 6 + Close
(High - Low) x 1,1 / 12 + Close
Close - (High - Low) x 1,1 / 12
Close - (High - Low) x 1,1 / 6
Close - (High - Low) x 1,1 / 4
Close - (High - Low) x 1,1 / 2
Fibonacci Pivot Points
Resistance4 =
Resistance3 =
Resistance2 =
Resistance1 =
Pivot Point =
Support1 =
Support2 =
Support3 =
Support4 =
Pivot + 1,000 x (High - Low)
Pivot + 0,764 x (High - Low)
Pivot + 0,618 x (High - Low)
Pivot + 0,382 x (High - Low)
(High + Low + Close) / 3
Pivot - 0,382 x (High - Low)
Pivot - 0,618 x (High - Low)
Pivot - 0,764 x (High - Low)
Pivot - 1,000 x (High - Low)
Andrews Pitchfork
The Andrews Pitchfork (also called Median Lines) can be used to draw a channel of support and resistance lines,
along with a middle line. You can also add warning lines above or below the pitchfork.
The pitchfork needs three reference points that are drawn from a sequence of three consecutive pivots (for example,
Low – High – Low, or High – Low – High). The first reference point (A) is set at the latest pivot, the second reference
point (B) at the preceding pivot, and the third reference point (C) at the pivot before that. Thus, you draw the pitchfork
starting from the present and going into the past.
The two most recent reference points (A and B) are then connected with a line, and the median line of the pitchfork is
drawn from the reference point C to the midpoint of this line, dividing it into two equal parts. Two more lines are then
Drawing Tools
262
TeleTrader Software GmbH
Marc-Aurel-Straße 10-12, 1010 Vienna, Austria
E-Mail [email protected]
Internet http://professional.teletrader.com
added, starting from points A and B and running parallel to the median line. Those lines are believed to act as support
and resistance for the following price movements.
The reference line (between points A and B) is not shown on the chart by default. You can display it, and also change
the color and style of all lines: See Customizing Andrews Pitchfork on page 288.
To draw an Andrews Pitchfork
▪
Click on the Andrews Pitchfork icon on the Drawing toolbar:
▪
Click on the chart at the first reference point (A).
▪
Click on the chart at the second reference point (B).
▪
Click on the chart at the third reference point (C).
You can extend the lines of the pitchfork to the right or left by using extension points: See Extending and Shortening
Lines with Extension Points on page 271.
Drawing Tools
263
TeleTrader Software GmbH
Marc-Aurel-Straße 10-12, 1010 Vienna, Austria
E-Mail [email protected]
Internet http://professional.teletrader.com
Warning lines
As additional support / resistance levels, you can add warning lines above or below the pitchfork. These lines are
drawn parallel to the pitchfork lines at an equal distance.
To draw warning lines
▪
Click on the pitchfork to select it.
▪
Click on any visibility point of the pitchfork and hold the mouse button down.
▪
Drag the visibility point upwards or downwards until a white preview line appears above or below the pitchfork.
▪
You can drag the visibility point further to create more warning lines.
▪
Release the mouse button to add the warning lines to the pitchfork.
Note
To remove (hide) warning lines again, see Hiding and Showing Lines / Levels with Visibility Points
on page 296.
Wave and Harmonics
The Wave and Harmonics drawing tool can be used to visualize (Elliott) waves in trends and corrections, count and
plot turning points of those waves and display various related data, such as:
▫
Number of bars between two turning points
▫
Amount of time between two turning points
▫
Absolute change or percentage change between two turning points
▫
Percentage retracement of a correction in relation to the preceding wave
In addition, the last possible Gartley Pattern and other Harmonics can be shown for the most recent reference points
of the wave. The Gartley Pattern was introduced by H.M.Gartley in his book Profits in the Stock Market and measures
Fibonacci relations between five turning points of a wave.
The reference points of a wave are positioned at alternating pivots (High – Low – High – …). A new High must always
be drawn higher than the last Low, a new Low must be drawn lower than the last High. You can draw any number of
reference (turning) points for a wave. When drawing Harmonics or a Gartley Pattern, you must define at least five
turning points. As the price develops on the chart, you can manually add reference points to the wave.
Drawing Tools
264
TeleTrader Software GmbH
Marc-Aurel-Straße 10-12, 1010 Vienna, Austria
E-Mail [email protected]
Internet http://professional.teletrader.com
The first reference point is labeled with 0 by default, all following reference points are either labeled numerically (1, 2,
3…) or alphabetically (A, B, C…). The usual convention is to label long-term trends with numbers and short-term
corrections with characters. You can easily switch between numerical and alphabetical labeling while drawing.
You can change the color and style of all lines, adapt the labeling of turning points (including the start value) and
display of relative values, and show / hide the Harmonics for the last five reference points of a wave: See Customizing
Wave and Harmonics on page 288.
To draw waves
▪
Click on the Wave and Harmonics icon on the Drawing toolbar:
▪
Click on the chart at the starting point of the wave (zero point).
▪
Click on the chart to add reference points (turning points).
Note
The reference points will automatically snap to the nearest adequate price on the chart (Low when
drawing a low pivot, High when drawing a high pivot). To deactivate snapping temporarily, hold the
CTRL key while drawing. See also Snapping to the Nearest Price with the Magnet on page 246.
▪
To switch between numeric and alphabetic labeling, press the SHIFT key. The automatic counting will be reset to
zero automatically on every switch. To restart the counting at zero manually, press the 0 key.
▪
Press the ESC or ENTER key to finish drawing.
To draw Harmonics
▪
Draw a wave with at least five turning points (as described above).
▪
By default, the possible Harmonic Pattern and its relative values should now be shown automatically.
If the Harmonic Pattern is not visible on the chart:
▪
Right-click on the wave and select Properties.
▪
On the left side of the dialog, select the name of the drawing object, and then Harmonics. For example: Wave
and Harmonics1 > Harmonics.
▪
On the right side of the dialog, select Show Lines and / or Show Fill to show the Harmonic Pattern with its
reference and relation lines.
Drawing Tools
265
TeleTrader Software GmbH
Marc-Aurel-Straße 10-12, 1010 Vienna, Austria
E-Mail [email protected]
Internet http://professional.teletrader.com
To add turning points to a wave
▪
Click on the drawing object to select it.
▪
Click on the right-most reference point that is positioned next to the last turning point of the wave and drag it to
the next pivot.
▪
Click on the chart to add more reference points (turning points) if desired.
▪
Press the ESC or ENTER key to finish drawing.
Note
If a Harmonic Pattern is shown on the chart, the pattern will take into account the new turning
points and move to the right.
To remove turning points from a wave
▪
Click on the drawing object to select it.
▪
Press the BACKSPACE key to remove the last (right-most) turning point of the wave.
▪
To remove several turning points at once, double-click the first (left-most) reference point that you want to
remove. This turning point and all turning points to the right will be deleted.
Note
Drawing Tools
If a Harmonic Pattern is shown on the chart, the pattern will take into account the new turning
points and move to the left.
266
TeleTrader Software GmbH
Marc-Aurel-Straße 10-12, 1010 Vienna, Austria
E-Mail [email protected]
Internet http://professional.teletrader.com
Text
With the Text tool, you can label other objects on the chart, add descriptions etc.
You can also show a rectangle around the text, and add one or more arrows that point from the text to other chart
objects. In addition, you can change the font and color of the text: See Customizing Text on page 290.
To add text
▪
Click on the Text icon on the Drawing toolbar:
▪
Click on the chart at the position where you want the text to appear.
▪
Type your text. Press the ENTER key when you are finished.
Note
To insert a line break in the text, use CTRL + ENTER.
To edit inserted text
▪
Click on the Select icon on the Drawing toolbar:
▪
Double-click the text object.
▪
Edit the text. Press the ENTER key when you are finished.
Vertical, Fibonacci and Cycle Lines
Vertical lines, Fibonacci vertical lines and cycle lines are all used to project a certain base period of time, which is set
by you, into the future. By this, you can try to interpret the price development of a symbol based on time intervals, or
cycles, to predict when for example the next significant move will take place.
These drawing tools need two reference points to define the first (base) interval. All other intervals are then calculated
based on this reference interval.
▫
With the vertical lines tool (shown in red on the picture below), the distance between the reference points A and
B is used to plot intervals with equal size as vertical lines on the chart. The lines are drawn all over the chart (to
the right and left of the reference interval).
Drawing Tools
267
TeleTrader Software GmbH
Marc-Aurel-Straße 10-12, 1010 Vienna, Austria
E-Mail [email protected]
Internet http://professional.teletrader.com
▫
With the Fibonacci vertical lines tool (shown in blue on the picture below), the distance between the reference
points A and B is used to plot intervals that are placed at the numbers of the Fibonacci sequence (1, 1, 2, 3, 5, 8,
13, 21, 34… times the base interval). This means that the first two intervals will have the same size, the third
interval will be double size, the fourth interval three times as big, etc. The lines are only drawn to the right of the
reference interval.
▫
With the cycle lines tool (shown in green in the picture below), the distance between the reference points A and B
is used to plot arcs of equal size on the chart. The arcs are drawn all over the chart (to the right and left of the
reference interval).
Vertical lines and Fibonacci vertical lines use either the number of bars inside the reference interval to calculate its
size, or the difference between the start date/time and the end date/time. All other intervals are then set accordingly
based on the calculated size of the first interval. You can change the calculation method, and also adapt the color and
style of the drawn lines: See Customizing Vertical, Fibonacci and Cycle Lines on page 290.
Cycle lines always use the number of bars to determine the size of the reference interval.
To draw vertical lines
▪
Click on the Vertical Lines icon on the Drawing toolbar:
▪
Click on the chart at the first reference point (A) and hold the mouse button down.
▪
Move the mouse pointer to the second reference point (B) and release the mouse button.
To draw Fibonacci vertical lines
▪
Click on the arrow next to the Vertical Lines icon on the Drawing toolbar, and then click on the Fibonacci
Vertical Lines icon:
▪
Click on the chart at the first reference point (A) and hold the mouse button down.
▪
Move the mouse pointer to the second reference point (B) and release the mouse button.
To draw cycle lines
▪
Click on the arrow next to the Vertical Lines icon on the Drawing toolbar, and then click on the Cycle Lines
icon:
▪
Click on the chart at the first reference point (A) and hold the mouse button down.
▪
Move the mouse pointer to the second reference point (B) and release the mouse button.
Drawing Tools
268
TeleTrader Software GmbH
Marc-Aurel-Straße 10-12, 1010 Vienna, Austria
E-Mail [email protected]
Internet http://professional.teletrader.com
Price Change
With the price change tool, you can measure the price difference between two points in a chart. The difference can be
displayed both as an absolute value or as a percentage.
The price change tool needs two reference points, that will be compared with each other. The start point (A) is used
as the reference point or base value, the end point (B) is used as the target point to calculate the difference.
You can choose which of the calculated values are displayed on the chart, move the reference point of the price
change object to a selected value, and change the line style of the object: See Customizing Price Change on page
293.
To draw a price change object
▪
Click on the Price Change icon on the Drawing toolbar:
▪
Click on the chart at the first reference point (start point) and hold the mouse button down.
▪
Move the mouse pointer to the second reference point (end point) and release the mouse button.
Drawing Tools
269
TeleTrader Software GmbH
Marc-Aurel-Straße 10-12, 1010 Vienna, Austria
E-Mail [email protected]
Internet http://professional.teletrader.com
Arrows
With the arrow tools, you can draw two types of arrows on a chart, pointing up or down.
You choose the orientation of the arrow when you draw it. Later, you can change the orientation as well as its colors,
borders and transparency: See Customizing Arrows on page 294. Arrows are automatically drawn behind other chart
objects (in the background of the chart). See also Moving and Copying Drawing Objects on page 273.
Note
The arrows look similar to the markers that are inserted by some studies. See Marker Settings on
page 308.
To draw an arrow
▪
Click on the Arrow Up or Arrow Down icon on the Drawing toolbar:
▪
Click on the chart at the position where you want the arrow to appear.
or
Customizing Drawing Objects
When you add a drawing object to your chart, it is shown with its default settings. All drawing objects can be
customized, for example regarding their color and line style, levels that are shown, calculation of the different levels,
and so on.
Most settings can be adapted in the Chart Properties dialog. Some can also be adapted by clicking or dragging the
reference points, extension points and visibility points of the object, or by using specific tools from the Drawing
toolbar.
Chart Properties dialog
The Chart Properties dialog lets you adapt the default settings of a drawing object to your needs. To display the
dialog, right-click on the object that you want to customize and select Properties to go directly to the property sheet
that controls the settings of this particular object. You can also double-click the drawing object to open the properties
dialog.
For more information about the Chart Properties dialog, see also Customizing the Chart on page 216.
Drawing Tools
270
TeleTrader Software GmbH
Marc-Aurel-Straße 10-12, 1010 Vienna, Austria
E-Mail [email protected]
Internet http://professional.teletrader.com
As an alternative, you can use the Format Objects dialog to display and change the properties of a drawing object:
▪
On the Format menu, click Objects.
Note
You can also click on the Chart Objects icon in the Chart toolbar:
▪
In the Format Objects dialog, choose the object that you want to change.
▪
Click Format. The Chart Properties dialog is opened with the correct object already pre-selected.
Using your settings as default settings for this drawing tool
After you have changed the properties of a specific drawing object, you can save these settings. They will then be
used for every new object that is created with this drawing tool.
To save your settings as default for this drawing tool
▪
Right-click on the drawing object and select Properties.
▪
On the left side of the dialog, select the name of the drawing object.
▪
On the right side of the dialog, adapt the default settings to your needs.
▪
Click Set As Default.
Note
For Pivot Points, you can also save your default settings by clicking on Set As Default in the
dialog Insert Pivot Points.
Extending and Shortening Lines with Extension Points
You can use extension points to change the length of the line(s) of a drawing object. In addition, you can also doubleclick on the reference points of an object to extend a line to the borders of a chart, or shorten it to the reference point.
Drawing Tools
271
TeleTrader Software GmbH
Marc-Aurel-Straße 10-12, 1010 Vienna, Austria
E-Mail [email protected]
Internet http://professional.teletrader.com
When a drawing object consists of more than one line, any extension point controls the length of all lines at once. For
example, when you change the length of one line in a trend channel object, all lines are adjusted to the same length
automatically.
Extension points are available for all drawing objects except shapes, arrows, texts, Wave and Harmonics, Fibonacci
Arcs, Pivot Points and vertical lines.
Tip
To automatically use the new length of the line as a default for every object that will be created with
this drawing tool in the future, open the Chart Properties dialog and click Set As Default.
Extension points
To manually extend / shorten a line with extension points
▪
Click on the drawing object to select it.
▪
Click on an extension point and hold the mouse button down.
▪
Drag the extension point to extend / shorten the line.
▪
Release the mouse button to set the new line length.
To extend / shorten a line with extension points
▪
Click on the drawing object to select it.
▪
Double-click on an extension point.
-
If the line ended at a manually set extension point, it will be extended to the borders of the chart on this side.
-
If the line ended at the borders of the chart, it will either be shortened to the position of the last manually set
extension point, or to the position of the reference point on this side.
Reference points
To extend / shorten a line with reference points
▪
Click on the drawing object to select it.
▪
Double-click on a reference point.
-
If the line ended at the reference point, it will be extended to the borders of the chart on this side.
-
If the line did not end at the reference point, it will be shortened to the position of the reference point on this
side.
Warning
For Wave and Harmonics objects, double-clicking a reference point will remove all other
reference points to the right of it.
Changing the Title, Color and Line Style
You can change the title (name), basic color and line style for all drawing objects in the same way.
Advanced color and style settings are discussed in the respective sections for each drawing object.
To change the title (name) of a drawing object
▪
Right-click on the drawing object and select Properties.
▪
On the left side of the dialog, select the name of the drawing object, for example Line 1.
Drawing Tools
272
TeleTrader Software GmbH
Marc-Aurel-Straße 10-12, 1010 Vienna, Austria
E-Mail [email protected]
Internet http://professional.teletrader.com
▪
On the right side of the dialog, edit the text in the Title field.
Note
If you want to return to the previous title of the drawing object, click Reset.
To change the color of a drawing object
▪
Click on the drawing object to select it.
▪
Click on the Color icon on the Drawing toolbar and select a new color for the object:
To change the line style of a drawing object
▪
Click on the drawing object to select it.
▪
Click on the Next Line Style icon on the Drawing toolbar to switch to the next line style:
Moving and Copying Drawing Objects
You can change the position of a drawing object in several ways:
▫
You can move the whole drawing object with drag and drop.
▫
You can create an exact copy of the drawing object at a new location by holding the CTRL key while moving it.
▫
You can change the shape of a drawing object by moving its reference points.
▫
You can move a drawing object to the foreground or to the background of the chart, relative to all other visible
chart objects.
To move a drawing object on the chart
▪
Click on the drawing object to select it.
▪
Hold the mouse button down and move the drawing object.
▪
Drag it to its new location and release the mouse button to drop it there.
To copy a drawing object
▪
Click on the drawing object to select it.
▪
Press and hold the CTRL key.
▪
Hold the mouse button down and move the drawing object.
▪
Drag it to its new location and release the mouse button to drop it there.
▪
Release the CTRL key.
Note
You cannot copy a Pivot Points object.
To move the reference point of a drawing object
▪
Click on the drawing object to select it.
▪
Click on the reference point that you want to move and hold the mouse button down.
▪
Drag the reference point to its new location and release the mouse button to drop it there.
Drawing Tools
273
TeleTrader Software GmbH
Marc-Aurel-Straße 10-12, 1010 Vienna, Austria
E-Mail [email protected]
Internet http://professional.teletrader.com
To move a drawing object to the foreground
▪
Click on the drawing object to select it.
▪
Click on the To Foreground icon on the Drawing toolbar:
Note
Because of their filled body, Shapes, Arrows, Pivot Points and Fibonacci Retracements,
Expansions and Trend Lines are automatically drawn in the background of the chart. If they are
moved to the foreground, the filled area of those drawing objects will never cover the time series or
line drawing objects (such as trend lines or fans).
To move a drawing object to the background
▪
Click on the drawing object to select it.
▪
Click on the To Background icon on the Drawing toolbar:
Customizing Lines and Trend Channels
You can change the color and style of a trend line, trend channel or horizontal line, show the prices at the reference
points or position horizontal lines at a specific level.
To change the line style of a trend line, trend channel or horizontal line
▪
Right-click on the drawing object and select Properties.
▪
On the left side of the dialog, select the name of the drawing object, and then Line Style. For example: Line 1 >
Line Style.
▪
On the right side of the dialog, adapt the default settings to your needs.
Control
Description
Line Color
Color of the line(s)
Style
Line style of all visible lines
Weight
Width of the line(s)
To show the prices at the reference points on the chart
▪
Right-click on the drawing object and select Properties.
▪
On the left side of the dialog, select the name of the drawing object, and then Parameter. For example: Line 1 >
Parameter.
▪
On the right side of the dialog, select Show Prices.
To position a horizontal line at a specific price level
▪
Right-click on the drawing object and select Properties.
▪
On the left side of the dialog, select the name of the drawing object, and then Parameter. For example:
Horizontal Line 1 > Parameter.
▪
On the right side of the dialog, edit the price level at which the horizontal line is shown in the Price field.
Customizing Linked Parallel Lines
You can change the color and style of a Linked Parallel Lines and show the prices and line numbers at the reference
points.
Drawing Tools
274
TeleTrader Software GmbH
Marc-Aurel-Straße 10-12, 1010 Vienna, Austria
E-Mail [email protected]
Internet http://professional.teletrader.com
To change the line style of a linked parallel lines
▪
Right-click on the drawing object and select Properties.
▪
On the left side of the dialog, select the name of the drawing object, and then Line Style. For example: Linked
Parallel Lines 1 > Line Style.
▪
On the right side of the dialog, adapt the default settings to your needs.
Control
Description
Line Color
Color of the line(s)
Style
Line style of all visible lines
Weight
Width of the line(s)
To show the prices at the reference points on the chart
▪
Right-click on the drawing object and select Properties.
▪
On the left side of the dialog, select the name of the drawing object, and then Parameter. For example: Linked
Parallel Lines 1 > Parameter.
▪
On the right side of the dialog, select Show Prices.
To show the line number at the reference points on the chart
▪
Right-click on the drawing object and select Properties.
▪
On the left side of the dialog, select the name of the drawing object, and then Parameter. For example: Linked
Parallel Lines 1 > Parameter.
▪
On the right side of the dialog, select Show Labels.
Customizing Regression Lines and Regression Channels
You can change the color and style of a regression line or channel.
To change the line style of a regression line or channel
▪
Right-click the drawing object and select Properties.
▪
In the Chart Properties dialog, click Line Style.
▪
Adapt the following options to your needs:
Line Style
Line Color
Choose the color of the lines.
Style
Choose the line style.
Weight
Choose the line width.
Customizing Shapes
You can change the colors, borders and transparency settings of a shape object. You can also move a shape object
to the background of a chart: See Moving and Copying Drawing Objects on page 273.
To change the colors, borders and transparency settings of a shape object
▪
Right-click on the drawing object and select Properties.
Drawing Tools
275
TeleTrader Software GmbH
Marc-Aurel-Straße 10-12, 1010 Vienna, Austria
E-Mail [email protected]
Internet http://professional.teletrader.com
▪
On the left side of the dialog, select the name of the drawing object, and then Line Style. For example:
Rectangle 1 > Line Style.
▪
On the right side of the dialog, adapt the default settings to your needs.
Control
Description
Line Color
Color of the border lines
Style
Line style of the border lines
Weight
Width of the border lines
Fill Color
Fill color of the body of the shape
Show Line
Check to show the border lines
Show Fill
Check to show the body
Transparency
Transparency of the shaded area in percent (0% = solid)
Customizing Fibonacci Fans
You can choose which levels of the Fibonacci Fan are displayed, customize the ratios used to calculate the levels,
change the line style for the fan lines, and show / hide the labels for each level. You can also show the base line
(reference line) on the chart, which is hidden by default.
Fibonacci levels and fan lines
To show / hide individual levels of the fan
▪
Right-click on the drawing object and select Properties.
▪
On the left side of the dialog, select the name of the drawing object, and then Levels. For example: Fibonacci
Fan 1 > Levels.
▪
On the right side of the dialog, select the check boxes next to the levels that should be visible, or clear the check
boxes next to the levels that should be hidden.
To show the reference line
▪
Right-click on the drawing object and select Properties.
▪
On the left side of the dialog, select the name of the drawing object, and then Levels. For example: Fibonacci
Fan 1 > Levels.
▪
On the right side of the dialog, select Show reference line.
To use custom levels for the fan lines
▪
Right-click on the drawing object and select Properties.
▪
On the left side of the dialog, select the name of the drawing object, and then Levels. For example: Fibonacci
Fan 1 > Levels.
▪
On the right side of the dialog, select Use custom values.
▪
In the Custom column of each level, click on the value for this level to edit the value.
To change the line style of the fan lines
▪
Right-click on the drawing object and select Properties.
▪
On the left side of the dialog, select the name of the drawing object, and then Levels. For example: Fibonacci
Fan 1 > Levels.
Drawing Tools
276
TeleTrader Software GmbH
Marc-Aurel-Straße 10-12, 1010 Vienna, Austria
E-Mail [email protected]
Internet http://professional.teletrader.com
▪
On the right side of the dialog, adapt the Line settings to your needs.
Control
Description
Color
Color of the fan lines
Style
Line style of the fan lines
Weight
Width of the fan lines
Apply to all levels
Check to use the same line style for all levels of the fan.
Clear to use individual line styles for each level. You can then click on each level to see /
change the line style settings of this level.
Labels for each level
To show the level labels
▪
Right-click on the drawing object and select Properties.
▪
On the left side of the dialog, select the name of the drawing object, and then Levels. For example: Fibonacci
Fan 1 > Levels.
▪
On the right side of the dialog, select Show levels.
To change the font of the level labels
▪
Right-click on the drawing object and select Properties.
▪
On the left side of the dialog, select the name of the drawing object, and then Levels. For example: Fibonacci
Fan 1 > Levels.
▪
On the right side of the dialog, adapt the Font settings to your needs.
Control
Description
Font
Type of font used for the labels of each level
Bold
Check to use a bold style for the labels
Italic
Check to use an italic style for the labels
Size
Size of the font used for the labels
Apply to all levels
Check to use the same font settings for the labels of all levels of the fan.
Clear to use individual font settings for each level. You can then click on each level to
see / change the font settings of this level.
Customizing Fibonacci Trend Line
You can choose which Fibonacci levels are displayed, customize the ratios used to calculate the levels, change the
line style for the level lines, and show / hide the labels for each level. You can also use a color gradient across all or
selected Fibonacci levels. The connecting line between the first and third reference point, which is hidden by default,
can be displayed on the chart.
Fibonacci levels and level lines
To show / hide individual levels
▪
Right-click on the drawing object and select Properties.
▪
On the left side of the dialog, select the name of the drawing object, and then Levels. For example: Fibonacci
Trend Line 1 > Levels.
▪
On the right side of the dialog, select the check boxes next to the levels that should be visible, or clear the check
boxes next to the levels that should be hidden.
Drawing Tools
277
TeleTrader Software GmbH
Marc-Aurel-Straße 10-12, 1010 Vienna, Austria
E-Mail [email protected]
Internet http://professional.teletrader.com
To show the reference line (connecting line)
▪
Right-click on the drawing object and select Properties.
▪
On the left side of the dialog, select the name of the drawing object, and then Levels. For example: Fibonacci
Trend Line 1 > Levels.
▪
On the right side of the dialog, select Show reference line.
To use custom levels for the Fibonacci Trend Line
▪
Right-click on the drawing object and select Properties.
▪
On the left side of the dialog, select the name of the drawing object, and then Levels. For example: Fibonacci
Trend Line 1 > Levels.
▪
On the right side of the dialog, select Use custom values.
▪
In the Custom column of each level, click on the value for this level to edit the value.
To change the line style of the level lines
▪
Right-click on the drawing object and select Properties.
▪
On the left side of the dialog, select the name of the drawing object, and then Levels. For example: Fibonacci
Trend Line 1 > Levels.
▪
On the right side of the dialog, adapt the Line settings to your needs.
Control
Description
Color
Color of the level lines
Style
Line style of the level lines
Weight
Width of the level lines
Apply to all levels
Check to use the same line style for all levels.
Clear to use individual line styles for each level. You can then click on each level to see /
change the line style settings of this level.
Color gradient across levels
To show a color gradient
▪
Right-click on the drawing object and select Properties.
▪
On the left side of the dialog, select the name of the drawing object, and then Levels. For example: Fibonacci
Trend Line 1 > Levels.
▪
On the right side of the dialog, select Show color gradient.
To change the colors and transparency of the gradient
▪
Right-click on the drawing object and select Properties.
▪
On the left side of the dialog, select the name of the drawing object, and then Levels. For example: Fibonacci
Trend Line 1 > Levels.
▪
On the right side of the dialog, adapt the Color Gradient settings to your needs.
Control
Description
Start Color
First color that is used for the gradient
End Color
Second color that is used for the gradient
Start Level
Level at which the gradient starts with the start color
Drawing Tools
278
TeleTrader Software GmbH
Marc-Aurel-Straße 10-12, 1010 Vienna, Austria
E-Mail [email protected]
Internet http://professional.teletrader.com
End Level
Level at which the gradient ends with the end color
Transparency
Transparency of the shaded area in percent (0% = solid)
Labels for each level
To show the level labels
▪
Right-click on the drawing object and select Properties.
▪
On the left side of the dialog, select the name of the drawing object, and then Levels. For example: Fibonacci
Trend Line 1 > Levels.
▪
On the right side of the dialog, select Show levels.
To change the font of the level labels
▪
Right-click on the drawing object and select Properties.
▪
On the left side of the dialog, select the name of the drawing object, and then Levels. For example: Fibonacci
Trend Line 1 > Levels.
▪
On the right side of the dialog, adapt the Font settings to your needs.
Control
Description
Font
Type of font used for the labels of each level
Bold
Check to use a bold style for the labels
Italic
Check to use an italic style for the labels
Size
Size of the font used for the labels
Apply to all levels
Check to use the same font settings for the labels of all levels.
Clear to use individual font settings for each level. You can then click on each level to
see / change the font settings of this level.
Customizing Fibonacci Retracements and Expansions
You can choose which Fibonacci levels are displayed, customize the ratios used to calculate the levels, change the
line style for the level lines, show / hide the labels and prices for each level, and show the label group number next to
each level. You can also use a color gradient across all or selected Fibonacci levels. The base line (reference line),
which is hidden by default, can be displayed on the chart. In addition, you can modify how prices should be displayed
on logarithmic price scale.
Fibonacci levels and level lines
To show / hide individual levels
▪
Right-click on the drawing object and select Properties.
▪
On the left side of the dialog, select the name of the drawing object, and then Levels. For example: Fibonacci
Retracement 1 > Levels.
▪
On the right side of the dialog, select the check boxes next to the levels that should be visible, or clear the check
boxes next to the levels that should be hidden.
To show the reference line
▪
Right-click on the drawing object and select Properties.
▪
On the left side of the dialog, select the name of the drawing object, and then Levels. For example: Fibonacci
Retracement 1 > Levels.
Drawing Tools
279
TeleTrader Software GmbH
Marc-Aurel-Straße 10-12, 1010 Vienna, Austria
E-Mail [email protected]
Internet http://professional.teletrader.com
▪
On the right side of the dialog, select Show reference line.
To use custom levels for the Fibonacci Retracements / Expansions
▪
Right-click on the drawing object and select Properties.
▪
On the left side of the dialog, select the name of the drawing object, and then Levels. For example: Fibonacci
Retracement 1 > Levels.
▪
On the right side of the dialog, select Use custom values.
▪
In the Custom column of each level, click on the value for this level to edit the value.
To change the line style of the level lines
▪
Right-click on the drawing object and select Properties.
▪
On the left side of the dialog, select the name of the drawing object, and then Levels. For example: Fibonacci
Retracement 1 > Levels.
▪
On the right side of the dialog, adapt the Line settings to your needs.
Control
Description
Color
Color of the level lines
Style
Line style of the level lines
Weight
Width of the level lines
Apply to all levels
Check to use the same line style for all levels.
Clear to use individual line styles for each level. You can then click on each level to see /
change the line style settings of this level.
Color gradient across levels
To show a color gradient
▪
Right-click on the drawing object and select Properties.
▪
On the left side of the dialog, select the name of the drawing object, and then Levels. For example: Fibonacci
Retracement 1 > Levels.
▪
On the right side of the dialog, select Show color gradient.
To change the colors and transparency of the gradient
▪
Right-click on the drawing object and select Properties.
▪
On the left side of the dialog, select the name of the drawing object, and then Levels. For example: Fibonacci
Retracement 1 > Levels.
▪
On the right side of the dialog, adapt the Color Gradient settings to your needs.
Control
Description
Start Color
First color that is used for the gradient
End Color
Second color that is used for the gradient
Start Level
Level at which the gradient starts with the start color
End Level
Level at which the gradient ends with the end color
Transparency
Transparency of the shaded area in percent (0% = solid)
Drawing Tools
280
TeleTrader Software GmbH
Marc-Aurel-Straße 10-12, 1010 Vienna, Austria
E-Mail [email protected]
Internet http://professional.teletrader.com
Labels and prices for each level
To show the level labels
▪
Right-click on the drawing object and select Properties.
▪
On the left side of the dialog, select the name of the drawing object, and then Levels. For example: Fibonacci
Retracement 1 > Levels.
▪
On the right side of the dialog, select Show levels.
To show the prices for each level
▪
Right-click on the drawing object and select Properties.
▪
On the left side of the dialog, select the name of the drawing object, and then Levels. For example: Fibonacci
Retracement 1 > Levels.
▪
On the right side of the dialog, select Show prices.
To change the font of the level labels and prices
▪
Right-click on the drawing object and select Properties.
▪
On the left side of the dialog, select the name of the drawing object, and then Levels. For example: Fibonacci
Retracement 1 > Levels.
▪
On the right side of the dialog, adapt the Font settings to your needs.
Control
Description
Font
Type of font used for the labels and prices of each level
Bold
Check to use a bold style for the labels and prices
Italic
Check to use an italic style for the labels and prices
Size
Size of the font used for the labels and prices
Apply to all levels
Check to use the same font settings for the labels and prices of all levels.
Clear to use individual font settings for each level. You can then click on each level to
see / change the font settings of this level.
To show the group number next to each level label
▪
Right-click on the drawing object and select Properties.
▪
On the left side of the dialog, select the name of the drawing object, and then Levels. For example: Fibonacci
Retracement 1 > Levels.
▪
On the right side of the dialog, select Show group number.
To modify prices on Logarithmic scale
▪
Right-click on the drawing object and select Properties.
▪
On the left side of the dialog, select the name of the drawing object, and then Levels. For example: Fibonacci
Retracement 1 > Levels.
▪
On the right side of the dialog, select Modify prices on Log scale.
Customizing Fibonacci Arcs
You can show the Fibonacci Arc lines as a full circle rather than as a half circle. Additionally, you can choose which
levels are displayed, customize the ratios used to calculate the levels, change the line style for the arc lines, and
show / hide the labels for each level.
Drawing Tools
281
TeleTrader Software GmbH
Marc-Aurel-Straße 10-12, 1010 Vienna, Austria
E-Mail [email protected]
Internet http://professional.teletrader.com
Fibonacci levels and arc lines
To show full circles instead of arcs
▪
Right-click on the drawing object and select Properties.
▪
On the left side of the dialog, select the name of the drawing object, and then Levels. For example: Fibonacci
Arc 1 > Levels.
▪
On the right side of the dialog, select Show full circle.
To show / hide individual levels of the arc
▪
Right-click on the drawing object and select Properties.
▪
On the left side of the dialog, select the name of the drawing object, and then Levels. For example: Fibonacci
Arc 1 > Levels.
▪
On the right side of the dialog, select the check boxes next to the levels that should be visible, or clear the check
boxes next to the levels that should be hidden.
To use custom levels for the arc lines
▪
Right-click on the drawing object and select Properties.
▪
On the left side of the dialog, select the name of the drawing object, and then Levels. For example: Fibonacci
Arc 1 > Levels.
▪
On the right side of the dialog, select Use custom values.
▪
In the Custom column of each level, click on the value for this level to edit the value.
To change the line style of the arc lines
▪
Right-click on the drawing object and select Properties.
▪
On the left side of the dialog, select the name of the drawing object, and then Levels. For example: Fibonacci
Arc 1 > Levels.
▪
On the right side of the dialog, adapt the Line settings to your needs.
Control
Description
Color
Color of the arc lines
Style
Line style of the arc lines
Weight
Width of the arc lines
Apply to all levels
Check to use the same line style for all levels of the arc.
Clear to use individual line styles for each level. You can then click on each level to see /
change the line style settings of this level.
Labels for each level
To show the level labels
▪
Right-click on the drawing object and select Properties.
▪
On the left side of the dialog, select the name of the drawing object, and then Levels. For example: Fibonacci
Arc 1 > Levels.
Drawing Tools
282
TeleTrader Software GmbH
Marc-Aurel-Straße 10-12, 1010 Vienna, Austria
E-Mail [email protected]
Internet http://professional.teletrader.com
▪
On the right side of the dialog, select Show levels.
To change the font of the level labels
▪
Right-click on the drawing object and select Properties.
▪
On the left side of the dialog, select the name of the drawing object, and then Levels. For example: Fibonacci
Arc 1 > Levels.
▪
On the right side of the dialog, adapt the Font settings to your needs.
Control
Description
Font
Type of font used for the labels of each level
Bold
Check to use a bold style for the labels
Italic
Check to use an italic style for the labels
Size
Size of the font used for the labels
Apply to all levels
Check to use the same font settings for the labels of all levels of the arc.
Clear to use individual font settings for each level. You can then click on each level to
see / change the font settings of this level.
Customizing Speed Resistance Lines
You can change the color and style of Speed Resistance Lines.
To change the line style of the Speed Resistance Lines
▪
Right-click on the drawing object and select Properties.
▪
On the left side of the dialog, select the name of the drawing object, and then Line Style. For example: Speed
Resistance 1 > Line Style.
▪
On the right side of the dialog, adapt the default settings to your needs.
Control
Description
Line Color
Color of the lines
Style
Line style of the lines
Weight
Width of the lines
Customizing Gann Square
You can choose which lines / Fans / grid line are displayed, change the line style for the lines and grid lines, switch
between Single square mode and Multi Square mode and adjust the time and price unit .
Gann Square lines
To show / hide individual lines
▪
Right-click on the drawing object and select Properties.
▪
On the left side of the dialog, select the name of the drawing object, and then Lines. For example: Gann Square
1 > Lines.
▪
On the right side of the dialog, select the check boxes next to the lines that should be visible, or clear the check
boxes next to the lines that should be hidden.
To change the line style of the lines
▪
Right-click on the drawing object and select Properties.
Drawing Tools
283
TeleTrader Software GmbH
Marc-Aurel-Straße 10-12, 1010 Vienna, Austria
E-Mail [email protected]
Internet http://professional.teletrader.com
▪
On the left side of the dialog, select the name of the drawing object, and then Lines. For example: Gann Square
1 > Lines.
▪
On the right side of the dialog, adapt the Line settings to your needs.
Control
Description
Color
Color of the lines
Style
Line style of the lines
Weight
Width of the lines
Apply to all lines
Check to use the same line style for all line.
Uncheck to use individual line style for each line.
Grid lines
To change the line style of the grid lines
▪
Right-click on the drawing object and select Properties.
▪
On the left side of the dialog, select the name of the drawing object, and then Lines. For example: Gann Square
1 > Lines.
▪
On the right side of the dialog, adapt the default settings to your needs.
Control
Description
Line Color
Color of the lines
Style
Line style of the lines
Weight
Width of the lines
Fan and Grid lines view
To show / hide individual fan and grid lines
▪
Right-click on the drawing object and select Properties.
▪
On the left side of the dialog, select the name of the drawing object, and then Lines. For example: Gann Square
1 > Lines.
▪
On the right side of the dialog, under View settings, select the check boxes next to the Fans and grids that
should be visible, or clear the check boxes next to the Fans and grids that should be hidden.
Control
Description
Upper left Fan
Show / hide Gann Fan starting from the upper left corner of a square
Upper right
Fan
Show / hide Gann Fan starting from the upper right corner of a square
Lower left Fan
Show / hide Gann Fan starting from the lower left corner of a square
Lower right
Fan
Show / hide Gann Fan starting from the lower right corner of a square
1 point grid
Show / hide 1 point grid used in a Gann Square
1x1 grid
Show / hide 1x1 grid used in a Gann Square
3x3 grid
Show / hide 3x3 grid used in a Gann Square
8x8 grid
Show / hide 8x8 grid used in a Gann Square
Drawing Tools
284
TeleTrader Software GmbH
Marc-Aurel-Straße 10-12, 1010 Vienna, Austria
E-Mail [email protected]
Internet http://professional.teletrader.com
Gann Square Parameters
To change between single and multi square mode
▪
Right-click on the drawing object and select Properties.
▪
On the left side of the dialog, select the name of the drawing object, and then Parameters. For example: Gann
Square 1 > Parameters.
▪
On the right side of the dialog, switch between single quare mode and multi square mode.
Control
Description
Display Gann
Square in
Switch between single square mode and multi square mode of a Gann Square
To adjust time and price units
▪
Right-click on the drawing object and select Properties.
▪
On the left side of the dialog, select the name of the drawing object, and then Parameters. For example: Gann
Square 1 > Parameters.
▪
On the right side of the dialog, adjust time and price units of Gann Square.
Control
Description
Time unit
Number of bars that makes up the width of the square
Price unit
Absolute price value that makes up height of the square
Customizing Gann Fans
You can change the color and style of all fan lines.
To change the line style of the fan lines
▪
Right-click on the drawing object and select Properties.
▪
On the left side of the dialog, select the name of the drawing object, and then Line Style. For example: Gann
Fan 1 > Line Style.
▪
On the right side of the dialog, adapt the default settings to your needs.
Control
Description
Line Color
Color of the lines
Style
Line style of the lines
Weight
Width of the lines
Customizing Pivot Points
You can change the calculation period and calculation method for the Pivot Points. In addition, you can choose which
support / resistance levels are displayed, change the line style for the level lines, extend the lines to the right border of
the chart and show / hide the labels and prices for each level. You can also use colored zones for each Pivot Points
level.
Calculation method and basis date / time parameters
To change the Pivot Points parameters
▪
Right-click on the drawing object and select Properties.
Drawing Tools
285
TeleTrader Software GmbH
Marc-Aurel-Straße 10-12, 1010 Vienna, Austria
E-Mail [email protected]
Internet http://professional.teletrader.com
▪
On the left side of the dialog, select the name of the drawing object, and then Parameter. For example: Pivot
Points 1 > Parameter.
▪
On the right side of the dialog, adapt the parameters to your needs.
Control
Description
Basis Date
Date that is used to define the first day of the calculation period. The Pivot Points object
is positioned on the chart starting with this date.
Starting Time
Starting time for the calculation period. This is especially important for intraday (hourly)
Pivot Points.
Calculation Period
Time period that is used to retrieve the Basis Values for the calculations. This can be
set in hours, days, weeks or months.
Calculation Type
Method of calculation to determine the Pivot Points levels.
You can see how each level is calculated on the Levels property sheet, below the level
list. See also the overview in Pivot Points on page 260.
Basis Symbol
Symbol that is used to calculate the Pivot Points levels. This is especially important
when several symbols are overlaid in a chart.
Basis Values
Choose if Close, Bid, Ask or Settlement prices are used to calculate the Pivot Points.
The according values are retrieved automatically for the chosen calculation period.
If you want to use different prices, select the User defined option and manually edit the
values.
Support / resistance levels and level lines
To show / hide individual levels
▪
Right-click on the drawing object and select Properties.
▪
On the left side of the dialog, select the name of the drawing object, and then Levels. For example: Pivot Points
1 > Levels.
▪
On the right side of the dialog, select the check boxes next to the levels that should be visible, or clear the check
boxes next to the levels that should be hidden.
To extend the level lines to the right chart border
▪
Right-click on the drawing object and select Properties.
▪
On the left side of the dialog, select the name of the drawing object, and then Levels. For example: Pivot Points
1 > Levels.
▪
On the right side of the dialog, select Extend to the right.
To change the line style of the level lines
▪
Right-click on the drawing object and select Properties.
▪
On the left side of the dialog, select the name of the drawing object, and then Levels. For example: Pivot Points
1 > Levels.
▪
On the right side of the dialog, adapt the Line settings to your needs.
Control
Description
Color
Color of the level lines
Style
Line style of the level lines
Weight
Width of the level lines
Apply to all levels
Check to use the same line style for all levels.
Clear to use individual line styles for each level. You can then click on each level to see /
Drawing Tools
286
TeleTrader Software GmbH
Marc-Aurel-Straße 10-12, 1010 Vienna, Austria
E-Mail [email protected]
Internet http://professional.teletrader.com
change the line style settings of this level.
Color zones for each level
To show color zones
▪
Right-click on the drawing object and select Properties.
▪
On the left side of the dialog, select the name of the drawing object, and then Levels. For example: Pivot Points
1 > Levels.
▪
On the right side of the dialog, select Show Zones.
To change the colors and transparency of the zones
▪
Right-click on the drawing object and select Properties.
▪
On the left side of the dialog, select the name of the drawing object, and then Levels. For example: Pivot Points
1 > Levels.
▪
On the right side of the dialog, adapt the Zone settings to your needs.
Control
Description
Color
Color that is used for the zone
Transparency
Transparency of the zone in percent (0% = solid)
Apply to all levels
Check to use the same color and transparency settings for all levels.
Clear to use individual colors and transparency settings for each level. You can then click
on each level to see / change the settings of this level.
Labels and prices for each level
To show the level labels
▪
Right-click on the drawing object and select Properties.
▪
On the left side of the dialog, select the name of the drawing object, and then Levels. For example: Pivot Points
1 > Levels.
▪
On the right side of the dialog, select Show Levels.
To show the prices for each level
▪
Right-click on the drawing object and select Properties.
▪
On the left side of the dialog, select the name of the drawing object, and then Levels. For example: Pivot Points
1 > Levels.
▪
On the right side of the dialog, select Show Prices.
To show the chosen calculation period next to the Pivot Points object
▪
Right-click on the drawing object and select Properties.
▪
On the left side of the dialog, select the name of the drawing object, and then Levels. For example: Pivot Points
1 > Levels.
▪
On the right side of the dialog, select Show Label.
To change the font of the level labels and prices
▪
Right-click on the drawing object and select Properties.
Drawing Tools
287
TeleTrader Software GmbH
Marc-Aurel-Straße 10-12, 1010 Vienna, Austria
E-Mail [email protected]
Internet http://professional.teletrader.com
▪
On the left side of the dialog, select the name of the drawing object, and then Levels. For example: Pivot Points
1 > Levels.
▪
On the right side of the dialog, adapt the Font settings to your needs.
Control
Description
Font
Type of font used for the labels and prices of each level
Bold
Check to use a bold style for the labels and prices
Italic
Check to use an italic style for the labels and prices
Size
Size of the font used for the labels and prices
Apply to all levels
Check to use the same font settings for the labels and prices of all levels.
Clear to use individual font settings for each level. You can then click on each level to
see / change the font settings of this level.
Customizing Andrews Pitchfork
You can change the color and style of all lines of the pitchfork. The reference line, which is hidden by default, can be
displayed on the chart.
To change the line style of the pitchfork lines
▪
Right-click on the drawing object and select Properties.
▪
On the left side of the dialog, select the name of the drawing object, and then Line Style. For example: Andrews
Pitchfork 1 > Line Style.
▪
On the right side of the dialog, adapt the default settings to your needs.
Control
Description
Line Color
Color of the lines
Style
Line style of the lines
Weight
Width of the lines
To show the reference line
▪
Right-click on the drawing object and select Properties.
▪
On the left side of the dialog, select the name of the drawing object, and then Options. For example: Andrews
Pitchfork 1 > Options.
▪
On the right side of the dialog, select Show Reference Line.
Customizing Wave and Harmonics
You can change the color and style of all lines, adapt the labeling of turning points and relative values, and show /
hide the Harmonic Pattern for the last five reference points of a wave.
To customize Wave and Harmonics objects
▪
Right-click on the drawing object and select Properties.
▪
On the left side of the Chart Properties dialog, you will see the name of the chart pane and of the drawing
object. For example: Pane 1 > Wave and Harmonics1.
▪
Adapt the settings on the property sheets of this drawing object as shown below.
Drawing Tools
288
TeleTrader Software GmbH
Marc-Aurel-Straße 10-12, 1010 Vienna, Austria
E-Mail [email protected]
Internet http://professional.teletrader.com
To change the line style of the wave lines
▪
On the left side of the dialog, select Line Style.
▪
On the right side of the dialog, adapt the default settings to your needs.
Show Lines
Check to show the wave lines on the chart
Color
Color of the wave lines
Style
Line style of the wave lines
Weight
Width of the wave lines
Show Marker
Check to show the numeric or alphabetic label of each turning point
Color
Color of the label
Font
Type of font used for the label
Size
Size of the font used for the label
Bold
Check to use a bold style for the label
Italic
Check to use an italic style for the label
First Reference Point
Enter the numeric value for the label of the first reference point of the wave (0 by default)
To change the display options for the wave labels
▪
On the left side of the dialog, select Labels.
▪
On the right side of the dialog, choose a font, color, size and style (bold / italic) for the labels in the section
Font/Color.
▪
Check Alternate Font and choose a color for it to show every second value in another color.
▪
Check Show Background and choose a background color and transparency setting to show all labels in a
transparent box.
▪
Check all options in the section Display that should be shown on the chart.
Show reference point values
Show absolute change
Show percentage change
Show number of bars between reference points
Show time between reference points
Show percentage retracement of preceding wave
To change the line style of the Harmonics reference and relations lines
▪
On the left side of the dialog, select Harmonics.
▪
Adapt the settings for the Reference Lines (connecting the turning points) to your needs:
▪
Show Lines
Check to display the reference lines of the Harmonic Pattern in another color than
the other wave lines.
Choose a Color, Style and Weight for the reference lines.
Show Fill
Check to display a shaded area inside the Harmonic Pattern.
Choose a Color and Transparency (0% = solid) for this area.
Adapt the settings for the Relation Lines (connecting highs with highs and lows with lows) to your needs:
Show Lines
Check to display the relation lines of the Harmonic Pattern.
Choose a Color, Style and Weight for the relation lines.
Show Fibonacci relations
Check to show the percentage relations between the connected highs / lows.
Drawing Tools
289
TeleTrader Software GmbH
Marc-Aurel-Straße 10-12, 1010 Vienna, Austria
E-Mail [email protected]
Internet http://professional.teletrader.com
Show absolute changes
Check to show the absolute changes between the connected highs / lows.
Show percentage changes
Check to show the percentage changes between the connected highs / lows.
Show number of bars
between reference points
Check to show the number of bars between the connected highs / lows.
Show time between
reference points
Check to show the amount of time between the connected highs / lows.
Customizing Text
You can show a rectangle around the text object, and add one or more arrows that point from the text to other chart
objects. In addition, you can change the font and color of the text.
To show one or more arrows pointing from the text outwards
▪
Right-click on the drawing object and select Properties.
▪
On the left side of the dialog, select the name of the text object (the name is equal to the text that is displayed on
the chart).
▪
On the right side of the dialog, select Show Arrow.
▪
Next to the Show Arrow label, choose the number of arrows that should be displayed.
Note
Each arrow has a reference point at its tip. You can drag and drop it to make the arrow point at
other chart objects.
To show a rounded rectangle around the text
▪
Right-click on the drawing object and select Properties.
▪
On the left side of the dialog, select the name of the text object (the name is equal to the text that is displayed on
the chart).
▪
On the right side of the dialog, select Show rectangle around text.
To change the font and color of the text
▪
Right-click on the drawing object and select Properties.
▪
On the left side of the dialog, select the name of the text object (the name is equal to the text that is displayed on
the chart), and then Font.
▪
On the right side of the dialog, adapt the default settings to your needs.
Control
Description
Font
Type of font used for the text
Font Size
Size of the font used for the text
Foreground
Color of the text
Bold
Check to use a bold style for the text
Italic
Check to use an italic style for the text
Customizing Vertical, Fibonacci and Cycle Lines
You can customize the color and style of all lines, and change the calculation method (timing) for the reference
interval.
Drawing Tools
290
TeleTrader Software GmbH
Marc-Aurel-Straße 10-12, 1010 Vienna, Austria
E-Mail [email protected]
Internet http://professional.teletrader.com
Vertical, Fibonacci and Cycle Lines
To change the line style of vertical or cycle lines
▪
Right-click on the drawing object and select Properties.
▪
On the left side of the dialog, select the name of the drawing object, and then Line Style. For example: Vertical
lines 1 > Line Style.
▪
On the right side of the dialog, adapt the default settings to your needs.
Control
Description
Line Color
Color of the lines
Style
Line style of the lines
Weight
Width of the lines
To change the timing of vertical lines
▪
Right-click on the drawing object and select Properties.
▪
On the left side of the dialog, select the name of the drawing object, and then Timing. For example: Vertical
lines 1 > Timing.
▪
On the right side of the dialog, choose a timing setting:
Use number of bars
The reference interval is calculated in bars, all other intervals are set accordingly.
This means, for example, that if you use a daily compression, trading days (bars) will be
used to calculate the interval.
Use date and time
The reference interval is calculated in days (or according to the used compression), all
other intervals are set accordingly.
This means, for example, that if you use a daily compression, calendar days will be used
to calculate the interval. This include weekends and exchange holidays.
Note
Cycle lines always use trading days (bars) for calculating the intervals.
Fibonacci vertical lines
To show / hide individual levels
▪
Right-click on the drawing object and select Properties.
▪
On the left side of the dialog, select the name of the drawing object, and then Levels. For example: Fibonacci
vertical lines1 > Levels.
▪
On the right side of the dialog, select the check boxes next to the levels that should be visible, or clear the check
boxes next to the levels that should be hidden.
To use custom levels for the Fibonacci vertical lines
▪
Right-click on the drawing object and select Properties.
▪
On the left side of the dialog, select the name of the drawing object, and then Levels. For example: Fibonacci
vertical lines 1 > Levels.
▪
On the right side of the dialog, select Use custom values.
▪
In the Custom column of each level, click on the value for this level to edit the value.
Drawing Tools
291
TeleTrader Software GmbH
Marc-Aurel-Straße 10-12, 1010 Vienna, Austria
E-Mail [email protected]
Internet http://professional.teletrader.com
To change the line style of the level lines
▪
Right-click on the drawing object and select Properties.
▪
On the left side of the dialog, select the name of the drawing object, and then Levels. For example: Fibonacci
vertical lines 1 > Levels.
▪
On the right side of the dialog, adapt the Line settings to your needs.
Control
Description
Color
Color of the level lines
Style
Line style of the level lines
Weight
Width of the level lines
Apply to all levels
Check to use the same line style for all levels.
Clear to use individual line styles for each level. You can then click on each level to see /
change the line style settings of this level.
To show the group number next to each level label
▪
Right-click on the drawing object and select Properties.
▪
On the left side of the dialog, select the name of the drawing object, and then Levels. For example: Fibonacci
vertical lines1 > Levels.
▪
On the right side of the dialog, select Show group number.
To show the line number
▪
Right-click on the drawing object and select Properties.
▪
On the left side of the dialog, select the name of the drawing object, and then Levels. For example: Fibonacci
vertical lines1 > Levels.
▪
On the right side of the dialog, select Show line number.
To show the date for each level
▪
Right-click on the drawing object and select Properties.
▪
On the left side of the dialog, select the name of the drawing object, and then Levels. For example: Fibonacci
vertical lines1 > Levels.
▪
On the right side of the dialog, select Show date.
To show the period for each level
▪
Right-click on the drawing object and select Properties.
▪
On the left side of the dialog, select the name of the drawing object, and then Levels. For example: Fibonacci
vertical lines1 > Levels.
▪
On the right side of the dialog, select Show period.
To change the font of the level labels and prices
▪
Right-click on the drawing object and select Properties.
▪
On the left side of the dialog, select the name of the drawing object, and then Levels. For example: Fibonacci
vertical lines1 > Levels.
▪
On the right side of the dialog, adapt the Font settings to your needs.
Control
Drawing Tools
Description
292
TeleTrader Software GmbH
Marc-Aurel-Straße 10-12, 1010 Vienna, Austria
E-Mail [email protected]
Internet http://professional.teletrader.com
Font
Type of font used for the labels and prices of each level
Bold
Check to use a bold style for the labels and prices
Italic
Check to use an italic style for the labels and prices
Size
Size of the font used for the labels and prices
Apply to all levels
Check to use the same font settings for the labels and prices of all levels.
Clear to use individual font settings for each level. You can then click on each level to
see / change the font settings of this level.
Customizing Price Change
You can choose which of the calculated values are displayed on the chart, move the reference point of the price
change object to a selected value, and change the line style of the object.
To change the line style of the price change lines
▪
Right-click on the drawing object and select Properties.
▪
On the left side of the dialog, select the name of the drawing object, and then Line Style. For example: Price
Change 1 > Line Style.
▪
On the right side of the dialog, adapt the default settings to your needs.
Control
Description
Line Color
Color of the lines
Style
Line style of the lines
Weight
Width of the lines
To change the display options for the price change object
▪
Right-click on the drawing object and select Properties.
▪
On the left side of the dialog, select the name of the drawing object, and then Options. For example: Price
Change 1 > Options.
▪
On the right side of the dialog, adapt the default Display settings to your needs.
Control
Description
Reference point value
Check to show the price at the reference point
Target point value
Check to show the price at the target point
Target point % change
Check to show the difference between the two points as a percentage
Target point absolute price
change
Check to show the difference between the two points as an absolute value
Line between reference and
target point
Check to show a line connecting the reference and the target point
To move the reference point
▪
Right-click on the drawing object and select Properties.
▪
On the left side of the dialog, select the name of the drawing object, and then Options. For example: Price
Change 1 > Options.
▪
On the right side of the dialog, select an option in the section Move Reference Point to:
Target point
Check to move the reference point to the target point
Last bar close value
Check to move the reference point to the Close price of the last (current)
Drawing Tools
293
TeleTrader Software GmbH
Marc-Aurel-Straße 10-12, 1010 Vienna, Austria
E-Mail [email protected]
Internet http://professional.teletrader.com
bar
Last visible bar close value
Check to move the reference point to the Close price of the last visible bar
on the screen
Customizing Arrows
You can change the orientation of the arrow, as well as its colors, borders and transparency. These settings depend
on the orientation of the arrow.
To change the orientation of an arrow
▪
Right-click on the drawing object and select Properties.
▪
On the left side of the dialog, select the name of the drawing object, and then Orientation. For example: Arrow
tool 1 > Orientation.
▪
On the right side of the dialog, select the orientation Up or Down.
To change the colors, borders and transparency settings of an arrow
Note
These settings depend on the orientation of the arrow.
▪
Right-click on the drawing object and select Properties.
▪
On the left side of the dialog, select the name of the drawing object, and then Up Style or Down Style. For
example: Arrow tool 1 > Up Style.
▪
On the right side of the dialog, adapt the default settings to your needs.
Control
Description
Line Color
Color of the border lines
Style
Line style of the border lines
Weight
Width of the border lines
Fill Color
Fill color of the body of the arrow
Show Line
Check to show the border lines
Show Fill
Check to show the body
Transparency
Transparency of the shaded area in percent (0% = solid)
Hiding and Deleting Drawing Objects
When you have added drawing objects to a chart, you can later either hide them temporarily, so that they are not
visible anymore, or remove them completely from the chart (delete them).
You can hide the complete drawing object, including all lines and levels, or hide individual lines or levels of a drawing
object using visibility points (for example, certain levels of a Fibonacci object). When you change the chart type or
data compression of a chart, you can choose to keep drawing objects visible, or automatically hide them.When you
delete a drawing object, it is removed from the chart completely, including all its settings. You can also delete all
drawing objects (visible or invisible) at once.
Hiding Drawing Objects
You can temporarily hide a drawing object from the chart and data table view, without removing it from the chart
completely (for deleting drawing objects, see Deleting Drawing Objects on page 297).
Drawing Tools
294
TeleTrader Software GmbH
Marc-Aurel-Straße 10-12, 1010 Vienna, Austria
E-Mail [email protected]
Internet http://professional.teletrader.com
In some cases, for example when you change the chart type from a bar chart to a Point and Figure chart, drawing
objects are automatically hidden. When you change the data compression of a chart, for example from a daily chart to
an intraday chart, drawing objects still remain visible by default. You can adapt the automatic hiding settings, so that
for example drawing objects remain visible when changing the chart type.
Note
When changing the data compression from a higher to a lower compression, for example from a
daily chart to a 5-minute chart, some drawing objects might not be visible anymore because there
is not enough data loaded in the chart, or because the lines of the object are too far away from the
price. When the starting point for a trend line is for example three months in the past, it might not
show up in a 5-minute chart.
To hide a drawing object
▪
Right-click on the drawing object and choose Hide.
Alternatively, you can also use the Format Objects dialog to hide a drawing object:
▪
On the Format menu, click Objects.
Note
You can also click on the Chart Objects icon in the Chart toolbar:
▪
In the Format Objects dialog, click on the drawing object to select it.
▪
Click Hide. The blue check mark next to the drawing object will disappear.
Note
Once an object is hidden from a chart, it's corresponding columns in the data table view will be
hidden automatically as well.
To show a hidden drawing object in the chart
▪
On the Format menu, click on Objects.
▪
In the Format Objects dialog, click on the drawing object to select it.
▪
Click Show. A blue check mark next to the drawing object will appear.
Note
You can also right-click on the chart and select Show Hidden Objects to display a hidden object.
To automatically hide a drawing object when changing the chart type or
compression
▪
Right-click on the drawing object and select Properties.
▪
On the left side of the dialog, select the name of the drawing object, and then Hide. For example: Line 1 > Hide.
▪
On the right side of the dialog, select all hiding options that you want use, and clear the settings you don’t want to
use:
Hide automatically when chart mode
(Financial, Renko etc.) is changed
Check to automatically hide the drawing object when the chart
type is changed.
Exception: Changing between different Finance chart types (for
example, a bar chart and a candlestick chart) will not hide the
object.
Hide automatically when chart type (Tick
by Tick, Daily etc.) is changed
Check to automatically hide the drawing object when the main
data compression of the chart is changed.
Drawing Tools
295
TeleTrader Software GmbH
Marc-Aurel-Straße 10-12, 1010 Vienna, Austria
E-Mail [email protected]
Internet http://professional.teletrader.com
Explanation: This means that the object will be hidden when
changing for example from a daily compression to any intraday
compression, but not when changing from one intraday
compression to another (for example, switching from a 1-minute
chart to a 1-hour chart).
Hide automatically when time compression
(1 Minute, 2 Minutes etc.) is changed
Check to automatically hide the drawing object when the data
compression of the chart is changed in any way.
Explanation: This means that the object will also be hidden when
changing from one intraday compression to another, or from one
TickBar compression to another.
To add (remove) drawing objects for certain chart types and data compressions
When you automatically show or hide drawing objects when switching chart types or data compressions (Hide
property of drawing objects), you can later add drawing objects to (or remove them from) certain chart types or data
compressions again. You can for example show a trend line in weekly and daily charts, but automatically hide it when
changing to a monthly, intraday or tick compression.
▪
Add the drawing object to the chart (for example in a weekly compression).
▪
Adapt the automatic hide settings so that the drawing object is hidden when you change the main data
compression of the chart (see Hide property above).
▪
Change the data compression of the chart (for example to a daily compression). The drawing object is hidden
automatically.
▪
On the Format menu, click Objects.
▪
In the Format Objects dialog, choose the drawing object that you want to add to (or remove from) the current
chart type and data compression.
▪
Click Add to add the drawing object to the current chart type and data compression. It will now be shown in both
the original compression and the current compression, but hidden in all other compressions.
Note
To remove the drawing object again from the current chart type and data compression, click
Remove instead of Add.
Hiding and Showing Lines / Levels with Visibility Points
With visibility points you can easily hide individual lines (or levels) of many drawing objects, or reveal hidden lines
(levels). For some drawing objects (trend lines / channels and Andrews Pitchfork), you can also add equidistant lines
– so-called action/reaction or warning lines.
Visibility points are available for all drawing objects except shapes, arrows, texts, vertical lines and price change
objects.
Drawing Tools
296
TeleTrader Software GmbH
Marc-Aurel-Straße 10-12, 1010 Vienna, Austria
E-Mail [email protected]
Internet http://professional.teletrader.com
To hide a line / level of a drawing object
▪
Click on the drawing object to select it.
▪
Double-click on the visibility point of the line / level that you want to hide.
To show a hidden line / level of a drawing object
▪
Click on the drawing object to select it.
▪
Click on the visibility point of a line / level near the line / level that you want to show and hold the mouse button
down.
▪
Drag the visibility point over the area where the hidden line / level would be shown. A white preview line will
appear at this level.
▪
You can drag the visibility point further to reveal more hidden lines / levels.
▪
Release the mouse button to show all revealed lines in the chart.
Additional uses of visibility points
▫
Lines and trend channels: Convert a trend line to a trend channel by dragging the visibility point to define a third
reference point, and add equidistant action/reaction lines to the channel by dragging the visibility point above or
below the channel. See Lines and Trend Channels on page 246.
▫
Regression lines and channels: Draw additional channel lines at a distance of two, three or more standard
deviations from the regression line by dragging the visibility point above or below the regression line / channel.
See Regression Lines and Regression Channels on page 251.
▫
Andrews Pitchfork: Draw equidistant warning lines by dragging the visibility point above or below the pitchfork.
See Andrews Pitchfork on page 262.
Deleting Drawing Objects
You can delete drawing objects from a chart. They will be removed including all their settings.
To delete a drawing object
Note
▪
This action cannot be undone. This will delete the selected drawing object with all its settings.
Right-click on the drawing object and choose Delete.
Alternatively, you can also use the Format Objects dialog to delete a drawing object:
▪
On the Format menu, click Objects.
Drawing Tools
297
TeleTrader Software GmbH
Marc-Aurel-Straße 10-12, 1010 Vienna, Austria
E-Mail [email protected]
Internet http://professional.teletrader.com
Note
You can also click on the Chart Objects icon in the Chart toolbar:
▪
In the Format Objects dialog, click on the drawing object to select it.
▪
Click Delete. The drawing object will disappear from the object list.
To delete all drawing objects of a chart at once
Note
▪
This action cannot be undone. This will delete all drawing objects of the chart, visible or hidden,
with all their settings. When you are using linked documents (see Linking Documents to a Price
Page on page 89), this will only apply to the symbol that is currently active.
On the Format menu, click Delete all Drawing Tools.
Note
Drawing Tools
You can also click on the Delete all Drawing Tools icon in the Drawing toolbar:
298
TeleTrader Software GmbH
Marc-Aurel-Straße 10-12, 1010 Vienna, Austria
E-Mail [email protected]
Internet http://professional.teletrader.com
Analysis Tools
TeleTrader Professional offers a wide range of tools for technical analysis that you can apply to your charts. Many of
those tools can be customized to fit your needs. You can even create new analysis tools with the simple, yet powerful
TeleTrader Language.
The analysis tools in TeleTrader Professional use mathematical techniques, like calculations, statistics, pattern
recognition techniques and many more, to calculate indicators and signals and display them on the screen. Most socalled indicators and signals are displayed on the chart as a visual interpretation of market activity.
Note
All indicators and signals, including custom studies, can also be added as study columns to a price
page. See Adding, Removing and Customizing Study Columns on page 91 for details.
Indicators and signals
The analysis tools (studies) in TeleTrader Professional are divided into two main categories:
▫
Indicators are calculations that are applied to the price and volume data that you can see in a chart. Indicators
visualize the available data in a different way so that you can interpret it more easily. A typical example of an
indicator is the Moving Average.
▫
Signals also use calculations on price and volume data, but typically generate signals that help the trader to
decide when to buy or sell. Signals often use indicators for their calculations. Typical examples of signals are
crossovers (intersection of two indicators). Signals may also include various pattern recognition techniques, that
help the trader find typical constellations that have been significant in the past. These constellations are used for
example to identify possible turning points in a trend. Many pattern recognition systems are based on the
traditional Japanese candlestick formations. A typical example of pattern recognition is the Hammer or the
Morning Star.
Indicators and signals can inform you about various aspects of the market, such as its trend, volatility, momentum,
market strength, cycle, and so on. Technical studies are used to help traders identify, analyze, and assess market
opportunities and risks, determine and forecast market direction, and establish long or short positions. It is always an
individual decision which analysis techniques you want to apply to a certain security for interpreting price movements
and market trends.
To help you choose between the available studies, several groups have been defined, such as:
▫
Trend: A trend is the direction of a price movement over a longer period of time.
▫
Momentum: Momentum is the speed at which the price moves in a trend.
▫
Volatility: Volatility is the price fluctuation of a security.
▫
There are also spread, cycle, market breadth, volume and other studies.
If you want to get a notification (sound, message or e-mail) when a study crosses the time series or a drawing object,
you can use intersection alerts: See Intersection Alerts on page 326.
To get notified whenever a new signal marker appears on the chart, use study alerts: See Study Alerts on page 328.
The analysis tools (studies) available in TeleTrader Professional are listed in the Study Reference. In-depth
information about creating your own analysis tools can be found in a separate section about the syntax of the
TeleTrader Language on page 459.
Note
Analysis Tools
TeleTrader Software GmbH wants to point out explicitly that all examples in this manual were
made up in retrospect and show an idealized situation. Interpretations of indicators and signals are
intended as a thought-provoking impulse and should in no way be understood as a
recommendation to buy or sell a security.
299
TeleTrader Software GmbH
Marc-Aurel-Straße 10-12, 1010 Vienna, Austria
E-Mail [email protected]
Internet http://professional.teletrader.com
Inserting Studies
The analysis tools in TeleTrader Professional are generally called studies. They are divided into two main categories:
Indicators and signals. All of them can help you to identify and analyze market opportunities and risks. An indicator
visualizes the data in a different way to help you interpret it more easily; a signal also gives you indications to
establish long or short positions.
The basic steps to insert an indicator or signal into a chart (or a price page, see Adding, Removing and Customizing
Study Columns on page 91) are relatively easy and are described below. However, there are many ways to
customize the study before or after you insert it – for details about the various settings, follow the links that are
provided at the end of each step.
You can find an overview of the studies that are available in TeleTrader Professional in the Study Reference.
To insert a study into a chart
▪
Right-click on the chart and choose Insert Study.
Note
▪
You can also click on the Insert Study icon in the Chart toolbar:
All available studies are shown on the left side. Click on the study that you want to insert.
-
To restrict the study list to Indicators or Signals, click the corresponding tabs. If you want to see all studies
regardless of their type, stay on the All tab.
-
To group studies by their first letter (A…Z), Category or assigned Tag, click on the corresponding button.
The button Favorite shows only the studies that you have defined as favorites. See Editing Study
Descriptions, Categories and Tags on page 314.
-
To search for a study, type its name, category or tag into the search field at the bottom of the dialog.
Note
Analysis Tools
Studies that you have used before are shown at the top of the list in the Recently used group.
300
TeleTrader Software GmbH
Marc-Aurel-Straße 10-12, 1010 Vienna, Austria
E-Mail [email protected]
Internet http://professional.teletrader.com
▪
On the Parameters tab on the right side, adapt the bases and parameters of your study to your needs. For
details about the possible settings, see Setting the Parameters of a Study on page 302.
Analysis Tools
301
TeleTrader Software GmbH
Marc-Aurel-Straße 10-12, 1010 Vienna, Austria
E-Mail [email protected]
Internet http://professional.teletrader.com
▪
On the Appearance tab, choose into which pane you want to insert the study, and adapt colors, fonts and styles.
For details about the possible settings, see Defining the Appearance of a Study on page 305.
▪
Click Insert to insert the study into the chart.
▪
You can now insert more studies like shown above, or close the Insert Study dialog by clicking Close.
Setting the Parameters of a Study
On the Parameters tab of the Insert Study dialog, you can set the bases and input parameters for a study before
you insert it. You can also choose whether the study will be updated (recalculated) on each tick or only after a bar has
been completed. After you have inserted a study, you can still change these parameters in the Chart Properties
dialog. You can also save your settings as default for this study by clicking the Set As Default button.
Note
Analysis Tools
When inserting study columns into price pages, some more settings are available on the
Parameters tab. You can for example choose the data compression that should be used, and
define the number of records that should be downloaded for each symbol (time region). For details,
see Adding, Removing and Customizing Study Columns on page 91.
302
TeleTrader Software GmbH
Marc-Aurel-Straße 10-12, 1010 Vienna, Austria
E-Mail [email protected]
Internet http://professional.teletrader.com
Bases
The base is the symbol (security, future, index or else) or other study that the inserted study is calculated for. By
default, Professional uses the symbol displayed on the chart as the base (in price pages, the current row symbol is
used). You can change the base – the study is then re-calculated for the new base. Some studies need more than
one base, for example Bearish or Bullish Divergence.
For calculating the study, not all elements of a base are needed in most cases. For example, the Moving Average
Simple uses only the Close prices of a security. You can change the element that is used in the calculation, so you
can for example calculate the Moving Average with the Open prices of a security.
Note
When the FID column of the base displays All, more than one element of the base is needed for
the calculation. In this case you can change the elements that are used only in the source code of
the study.
To change the bases of your study
▪
In the Data Object column of the base, click on the name of the symbol.
▪
From the list that appears, choose a symbol or study that is visible on your chart as your base. In price pages,
the current row symbol will be used by default.
If you want to choose a symbol for your base that is not visible on the chart:
▪
Choose Other from the list. The Symbol Search dialog is displayed.
▪
Enter your search term in the first field on the left side and change the search settings, if necessary.
▪
Click on the green button or press the ENTER key to start the search.
▪
Click on the symbol that you want to use as a base for your study.
▪
Click OK.
To change the base element (price) used for calculation
▪
In the FID column of the base, click on the base element that is currently used for calculation.
▪
From the list that appears, choose a different element for calculation.
To change the data type used for calculation
▪
In the Data column of the base, click on the current entry.
▪
From the list that appears, choose Original if you want to use the original data transmitted from the exchange, or
choose Display if you want to use the data as it is currently displayed in the chart.
Note
Analysis Tools
For example, when you are using a Heikin Ashi chart, the setting Original will use the prices
transmitted from the exchange in all study calculations, and the setting Display will use the Heikin
Ashi transformations of those prices for all calculations.
At the moment, the setting Display has no effect when used for study columns in price pages.
303
TeleTrader Software GmbH
Marc-Aurel-Straße 10-12, 1010 Vienna, Austria
E-Mail [email protected]
Internet http://professional.teletrader.com
Parameters
Parameters are used as input values for the calculation of a study. For example, the Moving Average Simple has two
parameters: period and shift. The parameter period controls the number of bars (time period) that is used for
calculating the average; the parameter shift controls the vertical displacement of the Moving Average line in relation to
the symbol.
You can change the way that a study is calculated by setting its parameters to different values. Each parameter
includes a short description of what it does in the Description column.
To change a parameter value
▪
In the Value column of the parameter, click on the current value to make it editable.
▪
Enter the new value.
Note
The new value must be set between the values of the Minimum and Maximum columns.
Calculation settings
In the bottom part of the Parameters tab, you can choose whether the study should be recalculated on each new tick
or on each new bar. By default, this option is set to Calculate on each new Tick. If you are experiencing
performance problems on fast-ticking charts with many inserted studies, you can also change this setting to
Calculate on each new Bar – the study will then only be updated when a bar is completed (depending on the data
compression of the chart).
Note
For the following studies, this option is set to Calculate on each new Bar by default. It is
recommended to keep this setting due to technical reasons:
Candlestick Pattern Recognition
Dark Cloud
Doji
Evening Star
Engulfing Pattern
Hammer
Hanging Man
Morning Star
Piercing Pattern
Sanku
Shooting Star
Spinning Top
Analysis Tools
304
TeleTrader Software GmbH
Marc-Aurel-Straße 10-12, 1010 Vienna, Austria
E-Mail [email protected]
Internet http://professional.teletrader.com
Defining the Appearance of a Study
On the Appearance tab of the Insert Study dialog, you can change how the study is displayed on the chart (for
example its colors and styles) before you insert it. After you have inserted a study, you can still change its
appearance in the Chart Properties dialog. You can also save your settings as default for this study by clicking the
Set As Default button.
Note
When inserting study columns into price pages, only a few color settings are available on the
Appearance tab. For details, see Adding, Removing and Customizing Study Columns on page 91.
Note
If you select Activate study color inheritance on overlaid charts option under Tools > Options
> Chart, color of the study will be based on color of the base symbol on a chart. See Chart
Settings on page 340.
Study objects
Every study consists of one or more so-called study objects. A study object is a visible object that is drawn on the
chart, such as a line, a shaded area or a marker. Each study object has a unique set of properties that define how
they are displayed on the chart, such as colors, line widths, line styles, fonts, transparency settings and many more.
As some studies have more than one study object, you first have to choose for which study object you want to define
its appearance on the screen. For example, the Bollinger Bands indicator consists of a line study object and an area
study object.
To choose a study object
▪
Click on the Study Objects arrow.
▪
Choose the study object that you want to change.
▪
Adapt the settings to your needs.
Settings for different study object types
Depending on the type of the study object you choose, different settings are available.
Line
Change the display type, width, style and color of a line study object. See Line Settings on page
306.
Area
Change the type, line colors, width and style, the fill colors and the transparency of an area study
object. See Area Settings on page 307.
Marker
Change the border colors, width, the fill colors, the transparency, the shape size and the font of a
marker study object. See Marker Settings on page 308.
Note
Analysis Tools
You cannot change the type of a study object in this dialog (for example, use a line instead of an
area). This would have to be done by editing the source code of a study.
305
TeleTrader Software GmbH
Marc-Aurel-Straße 10-12, 1010 Vienna, Austria
E-Mail [email protected]
Internet http://professional.teletrader.com
Line Settings
A line study object is displayed on the chart as a single line. You can change its display type, width, style and color.
Note
When inserting study columns into price pages, only a few color settings are available on the
Appearance tab. For details, see Adding, Removing and Customizing Study Columns on page 91.
Line settings dialog
Control
Description
Pane
Chart pane that the study object is displayed in
Top
Display the study object in a new pane at the top
of the chart window
Pane x
Display the study object in the specified pane
Bottom
Display the study object in a new pane at the
bottom of the chart window
Display Type
Display type of the line:
Line
Histogram
Points
Steps
Weight
Width of the line
Style
Style of the line
Color
Color of the line
Automatically use alternate color for
subsequent inserts of the same study
Check to automatically use a new line color if this study is later
inserted again into the same chart pane.
Uncheck to use the default line color every time this study is inserted
into the same chart pane.
Analysis Tools
306
TeleTrader Software GmbH
Marc-Aurel-Straße 10-12, 1010 Vienna, Austria
E-Mail [email protected]
Internet http://professional.teletrader.com
Area Settings
An area study object is displayed on the chart as a shaded, transparent area with two lines at the borders. You can
change the type of the area object, the colors, width and style of the border lines, and the fill colors and transparency
of the shaded area.
Note
When inserting study columns into price pages, only a few color settings are available on the
Appearance tab. For details, see Adding, Removing and Customizing Study Columns on page 91.
Area settings dialog
Control
Description
Pane
Chart pane that the study object is displayed in
Top
Display the study object in a new pane at the top of the chart
window
Pane x
Display the study object in the specified pane
Bottom
Display the study object in a new pane at the bottom of the
chart window
Type
Choose which type of area is used:
Continuous
Connects all parts of an area with continuous border lines /
shadings
Segmented
Displays all parts of an area as independent segments
(relevant for areas that have many different segments, for
example the signal A Kamu Elder Ray Digital).
Brick
Draws transparent rectangles around each bar between the
upper and lower borders of the area
Line
Define the appearance of the border lines in this section
Line #1
Color of the first border line, usually the top line
Check the box next to the color selection to display this border line on the chart
Line #2
Color of the second border line, usually the bottom line
Check the box next to the color selection to display this border line on the chart
Weight
Width of both border lines
Style
Style of both border lines
Fill
Define the appearance of the shaded area between the top and bottom lines in
this section
#1 above #2
Color of the shaded area when the first border line is above the second border line
Check the box next to the color selection to show this shaded area on the chart
#2 above #1
Color of the shaded area when the first border line is below the second border line
Analysis Tools
307
TeleTrader Software GmbH
Marc-Aurel-Straße 10-12, 1010 Vienna, Austria
E-Mail [email protected]
Internet http://professional.teletrader.com
Check the box next to the color selection to show this shaded area on the chart
Transparency
Transparency of the shaded area in percent (0% = solid)
Marker Settings
A marker study object is displayed on the chart as a combination of two arrows and some marker text.
The up or down arrow is displayed below or above the marked bar and points either upwards or downwards. You can
change the colors and width of the border lines, the fill colors and transparency of the arrow, and its size.
The price arrow is displayed at a certain price level of the marked bar, usually the Close price. You can change its
outline and fill color, transparency and size.
The marker text is displayed below or above the up / down arrows. You can change its font and style.
Note
When inserting study columns into price pages, only a few color settings are available on the
Appearance tab. For details, see Adding, Removing and Customizing Study Columns on page 91.
Marker settings dialog
Control
Description
Pane
Chart pane that the study object is displayed in
Top
Display the study object in a new pane at the top
of the chart window
Pane x
Display the study object in the specified pane.
Bottom
Display the study object in a new pane at the
bottom of the chart window
Up / Down Arrow
Define the appearance of the upwards or downwards oriented arrows
in this section
Up Fill
Color of the body for upwards arrows
Check to show the body of the up arrows
Up Border
Color of the borders for upwards arrows
Check to show the borders of the up arrows
Down Fill
Color of the body for downwards arrows
Check to show the body of the down arrows
Down Border
Color of the borders for downwards arrows
Check to show the borders of the down arrows
Weight
Width of the border lines
Transparency
Transparency of the body in percent (0% = solid)
Shape Size
Size of the up / down arrows
Analysis Tools
308
TeleTrader Software GmbH
Marc-Aurel-Straße 10-12, 1010 Vienna, Austria
E-Mail [email protected]
Internet http://professional.teletrader.com
Price Arrow
Define the appearance of the vertical price arrows in this section
Fill
Color of the body of the price arrows
Check to show the body of the price arrows
Border
Color of the borders of the price arrows
Check to show the borders of the price arrows
Weight
Width of the border lines
Transparency
Transparency of the body in percent (100% = solid)
Shape Size
Size of the price arrows
Font
Define the type of font used for the marker text in this section
Bold
Check to apply a bold font to the text
Italic
Check to apply an italic font to the text
Size
Size of the font used for the marker text
Viewing the Source Code & Study Info
When browsing through studies in the Insert Study dialog, you might want to see more detailed information about a
study, for example how it is calculated or what it is supposed to indicate on the chart.
To display the source code of a study
▪
Click on the Source Code tab.
Note
You cannot change the source code here. To do this, you have to use the Study Editor (see
Editing and Managing Studies on page 312). Click on the button Study Editor to automatically
switch to the editor.
To display basic information for a study
▪
Click on the Study Info tab.
Note
You cannot change the description, categories and tags here. To do this, you have to use the
Study Editor (see Editing and Managing Studies on page 312). You can also see this information
in the Chart Properties dialog.
Changing the Properties of Inserted Studies
When you insert a study into a chart (or a price page), you can adapt its parameter settings and its appearance in the
Insert Study dialog. Once it is visible in the document, you can of course change these properties at any time.
To change the properties of an inserted study
▪
Click on the study to select it.
▪
Right-click the study and choose Properties.
▪
In the Chart Properties dialog, your study should already be selected in the tree on the left side.
Note
▪
If the study is not selected, click on Studies, and then click on the name of the study.
Click on the entry Parameters or Appearance to adapt the settings to your needs. For details about the possible
settings, see:
Analysis Tools
309
TeleTrader Software GmbH
Marc-Aurel-Straße 10-12, 1010 Vienna, Austria
E-Mail [email protected]
Internet http://professional.teletrader.com
-
Setting the Parameters on page 302
-
Defining the Appearance of a Study on page 305
Hiding and Deleting Inserted Studies
You can hide or delete studies that you have inserted in a chart. If you hide a study, it is not visible in the chart
anymore, but you can show it again with exactly the same settings that it had before. If you delete a study, it is
removed from the chart completely.
Some studies consist of more than one study object - for example, the Bollinger Bands indicator consists of a line
study object and an area study object. In these cases, you can also hide single study objects instead of the whole
study.
Note
In price pages, study columns can be removed like all other price pages columns. See also
Adding, Removing and Customizing Study Columns on page 91.
To hide a study object in the chart
▪
Click on the study object, for example the line, to select it.
▪
Right-click the study object and choose Hide.
Alternatively, you can also use the Format Objects dialog to hide a study object:
▪
On the Format menu, click Objects.
Note
You can also click on the Chart Objects icon in the Chart toolbar:
▪
In the Format Objects dialog, click on the study object to select it.
▪
Click Hide. The blue check mark next to the study name will disappear.
▪
Click OK to return to the chart window.
To show a hidden study object in the chart
▪
On the Format menu, click Objects.
▪
In the Format Objects dialog, click on the study object to select it.
Analysis Tools
310
TeleTrader Software GmbH
Marc-Aurel-Straße 10-12, 1010 Vienna, Austria
E-Mail [email protected]
Internet http://professional.teletrader.com
▪
Click Show. A blue check mark next to the study name will appear.
▪
Click OK to return to the chart window.
To delete an entire study from the chart
▪
Click on the study, for example the line, to select it.
▪
Right-click the study and choose Delete.
Alternatively, you can also use the Format Objects dialog to delete a study:
▪
On the Format menu, click on Objects.
▪
In the Format Objects dialog, click on the study to select it.
▪
Click Delete. The study will disappear from the object list.
▪
Click OK to return to the chart window.
Note
If a study consists of more than one study object, deleting one object of the study will also remove
the other study objects. For example, when you remove the middle line study object of a Bollinger
Bands study, the area study object will be deleted as well.
Moving and Copying Inserted Studies
You can move study objects that you have inserted to another chart pane, or copy them to another chart window.
To move a study to another chart pane
▪
Click on the study to select it.
Note
To select more than one study object of the same study at once, hold the SHIFT key down and click
on each study object that you want to add to the selection. This only works as long as the study
objects are visible in the same chart pane.
▪
Hold the mouse button down and drag the study to another pane.
▪
Release the mouse button to move the study to the other pane.
Note
To only move one study object to another chart pane (for example, only the middle line of the
Bollinger Bands), hold the ALT key while moving the study object. You can also change the chart
pane that the study is displayed in the Chart Properties dialog.
To copy a study to another chart window
▪
Click on the study to select it.
▪
Hold the mouse button down and drag the study to another chart window.
▪
Release the mouse button to copy the study to the other chart window.
Basing Studies on Other Studies
You can base a study on another study. This way, you can for example show the Momentum of a Moving Average, or
similar scenarios.
Analysis Tools
311
TeleTrader Software GmbH
Marc-Aurel-Straße 10-12, 1010 Vienna, Austria
E-Mail [email protected]
Internet http://professional.teletrader.com
Note
At the moment, this is only possible in charts, not in price page study columns.
To base a study on another study
▪
Right-click on the chart and choose Insert Study.
▪
In the study list on the left side, click on the first study (for example Moving Average Simple) that you want to
insert.
▪
Adapt the settings on the Parameters and Appearance tabs to your needs, if necessary.
▪
Click Insert to insert the first study into the chart.
▪
In the study list on the left side, now click on the second study (for example Momentum) that you want to insert.
▪
On the Parameters tab, click in the Data Object column of the base for your second study.
▪
From the list that appears, choose the first study that you inserted as your base (for example MovS1 for your
Moving Average Simple indicator).
▪
Adapt the other settings on the Parameters and Appearance tabs to your needs, if necessary.
Note
▪
On the Appearance tab, be sure to choose the correct pane for the second study.
Click Insert to insert the second study into the chart.
Editing and Managing Studies
Each study is delivered to you with the most commonly used settings, including a short description for the study, and
one or more assigned categories. You can change the default settings, description and categorization with the Study
Editor. In contrast to the settings in the Insert Study and Chart Properties dialogs, all changes done with the study
editor will be the new default settings for this study, and will be used any time you insert the study.
If you want to make bigger changes to a study, you can also edit its source code. The source code is the
programming code used to calculate a study and draw it on the screen – it is written in the TeleTrader Language,
which is an easy programming language designed especially for this purpose.
Analysis Tools
312
TeleTrader Software GmbH
Marc-Aurel-Straße 10-12, 1010 Vienna, Austria
E-Mail [email protected]
Internet http://professional.teletrader.com
In the Study Editor dialog, you can also create new studies (or delete custom studies). You can share studies with
others by exporting them or sending them by e-mail. If you want to protect the source code of studies that you have
created yourself, you can do so by setting a password.
Changing the Default Settings for Studies
When you insert a study into a chart (or a price page), you can adapt its parameter settings and its appearance in the
Insert Study dialog. These changes only apply for this one instance of the study. If you want to use the same settings
any time you insert this study, you have to change its default settings. You can do this by clicking the Set As Default
button in the Insert Study dialog or the Chart Properties dialog, or by adapting the settings in the Study Editor.
To change the default settings for a study in the Study Editor
▪
On the Tools menu, click Study Editor.
▪
In the study list on the left side, click on the study.
▪
-
To restrict the study list to Indicators or Signals, click the corresponding tabs. If you want to see all studies
regardless of their type, stay on the All tab.
-
To group studies by their first letter (A…Z), Category or assigned Tag, click on the corresponding button.
The button Favorite shows only the studies that you have defined as favorites. See Editing Study
Descriptions, Categories and Tags on page 314.
-
To search for a study, type its name, category or tag into the search field at the bottom of the dialog.
On the Parameters tab, adapt the bases and parameters of your study to your needs. For details about the
possible settings, see Setting the Parameters of a Study on page 302.
Analysis Tools
313
TeleTrader Software GmbH
Marc-Aurel-Straße 10-12, 1010 Vienna, Austria
E-Mail [email protected]
Internet http://professional.teletrader.com
Note
In the Study Editor, you can also change the Minimum and Maximum values for each parameter
and edit its Description. Click on the value of a column to make it editable.
If you want to use your custom studies in price pages, you should define a value for the Time
region for price pages (bottom right of the dialog). In this field, you can either enter a constant
value (number of bars), or an expression that is derived from the study's parameters. For example,
for the Moving Average Displaced, the appropriate expression is period+period_dis. If you
don't define a value here, the default value of 100 bars will be used in price pages.
▪
On the Appearance tab, choose into which pane you want to insert the study, and adapt colors, fonts and styles.
For details about the possible settings, see Defining the Appearance of a Study on page 305.
Note
▪
In the Study Editor, one additional setting is available for areas, called Percentage Mode: This
mode can be used to display an area with percentage values instead of absolute values, e.g. with
the top border of an area at 75% and the bottom border at 25%. The border lines of areas in
percentage mode are not influenced by changes in the vertical price scale, they will always cover
the set percentage of the chart pane, regardless of the settings of the vertical price scale.
Click Save All to save all changes.
Note
If you want to only save the changes that you did to this study, without saving the changes that you
did to other studies, click Save on the File menu of the Study Editor.
Editing Study Descriptions, Categories and Tags
For each study, TeleTrader provides a short description, groups it in one or more categories, and assigns tags. You
can change the description to make your own notes about the study, add categories to a study or remove them from
it, and assign your own tags to a study. The name of a study and its type (indicator, signal or function) can also be
adapted.
You can mark a study as your favorite. Those studies will show up when you click the button Favorites in the Insert
Study dialog.
All this is done in the Study Editor. On the Tools menu, click on Study Editor to display it.
To edit the description of a study
▪
In the study list on the left side, click on the study.
Analysis Tools
314
TeleTrader Software GmbH
Marc-Aurel-Straße 10-12, 1010 Vienna, Austria
E-Mail [email protected]
Internet http://professional.teletrader.com
▪
On the Study Info tab, edit the content of the Description field.
To add a category to a study
▪
In the study list on the left side, click on the study.
▪
On the Study Info tab, click on the Categories button and select the category that you want to add.
Note
All selected categories are highlighted with a check mark. Custom studies are automatically added
to the category Custom.
To remove a category from a study
▪
In the study list on the left side, click on the study.
▪
On the Study Info tab, click on the Categories button and click on the category that you want to remove.
To edit the tags of a study
▪
In the study list on the left side, click on the study.
Analysis Tools
315
TeleTrader Software GmbH
Marc-Aurel-Straße 10-12, 1010 Vienna, Austria
E-Mail [email protected]
Internet http://professional.teletrader.com
▪
On the Study Info tab, type additional tags in the Tags field. You can use free text for your tags. Separate each
tag with a comma ( , ) or semicolon ( ; ).
To mark a study as a favorite
▪
In the study list on the left side, right-click on the study and choose Add to Favorites.
To remove a study from your favorites
▪
In the study list on the left side, right-click on the study and choose Remove from Favorites.
To change the study type
Note
The study type can only be changed for custom studies that you have created yourself.
▪
In the study list on the left side, click on the study.
▪
On the Study Info tab, choose a different Study Type from the list:
Function
Internal function, which cannot be inserted on a chart or price page. This study type is only
displayed on the Functions tab of the dialog.
Indicator
This study type is only displayed on the Indicators tab of the dialog.
Signal
This study type is only displayed on the Signals tab of the dialog.
To rename a study
Note
You can only rename custom studies that you have created yourself.
▪
In the study list on the left side, click on the study.
▪
On the File menu of the Study Editor, click on Rename.
▪
Enter a new name for the study and press the ENTER key.
To save your changes
▪
Click Save All to save all changes.
Note
A backup file of your custom studies named UserStudies.bak is created automatically as soon as
you click Save All. If you want to only save the changes that you did to one study, without saving
the changes that you did to other studies, click File > Save on the menu of the Study Editor.
Editing the Source Code of Studies
Note
You can only edit the source code of custom studies that you have created yourself. To change an
original study, you can save a copy of the study under a different name (see below) and then adapt
the source code of the copied study to your needs.
Some changes to a study can only be done by changing its source code on the Source Code tab of the Study
Editor.
Analysis Tools
316
TeleTrader Software GmbH
Marc-Aurel-Straße 10-12, 1010 Vienna, Austria
E-Mail [email protected]
Internet http://professional.teletrader.com
In this section, you will only learn here how to use the Study Editor to edit a study. For more information about the
TeleTrader Language, you can find in-depth explanations in different sections:
▫
If you are new to editing source code, we provide several examples with step-by-step instructions in the section
Creating Custom Studies on page 460.
▫
If you are already familiar with
the TeleTrader Language, you might still want to look up specific commands in the Language Reference on page
472.
To edit the source code of a study
▪
On the Tools menu, click Study Editor.
▪
In the study list on the left side, click on the study.
▪
On the Source Code tab, change the code of the study. For step-by-step examples, see Creating Custom
Studies on page 460.
▪
Click Check Syntax to check if the changes to the code are in compliance with the TeleTrader Language syntax.
Note
If the syntax is not correct, you can still save the study to finish working on it later. It is not
recommended to try to use it in a chart or price page, though. For an overview of possible error
messages, see Error Messages on page 531.
To save the copy of a study under a different name as a new study
▪
In the study list on the left side, click on the study.
▪
On the File menu of the Study Editor dialog, click Save a Copy.
▪
In the Name field, enter the name of the study as it should appear in the study list (for example in the Insert
Study dialog).
▪
In the Function Name field, enter the name of the function used to calculate the study. Pay attention to the
Naming Conventions on page 486.
To save all edited studies
▪
In the Study Editor, click Save All.
Note
Analysis Tools
A backup file of your custom studies named UserStudies.bak is created automatically as soon as
you click Save All. If you want to only save the changes that you did to one study, without saving
the changes that you did to other studies, click Save on the File menu of the Study Editor.
317
TeleTrader Software GmbH
Marc-Aurel-Straße 10-12, 1010 Vienna, Austria
E-Mail [email protected]
Internet http://professional.teletrader.com
Creating New Studies
You can create your own studies using the TeleTrader Language, which is an easy programming language designed
especially for this purpose. When creating a new study, you have to enter the complete program code used for the
calculation and drawing of your study.
You can find in-depth explanations about the TeleTrader Language in the following sections:
▫
If you are new to writing custom studies, we provide several examples with step-by-step instructions in the
section Creating Custom Studies on page 460.
▫
If you are already familiar with
the TeleTrader Language, you might still want to look up specific commands in the Language Reference on page
472.
To create a new study
▪
On the Tools menu, click on Study Editor.
▪
On the File menu of the Study Editor, click New.
▪
In the Name field, enter the name of the study as it should appear in the study list (for example in the Insert
Study dialog).
▪
In the Function Name field, enter the name of the function that you will write to calculate the study. Pay attention
to the Naming Conventions on page 486.
▪
Click OK. The Source Code tab of the new study is shown.
▪
Enter the source code for the new study. Refer to the Language Reference on page 472 for details.
To save the new study
▪
On the File menu of the Study Editor, click Save.
Note
All custom studies are saved in the file UserStudies.xml. This file is saved in the folder that is
specified for User Data under Tools > Options > File Locations.
Deleting Custom Studies
You can of course delete a study that you have created yourself. The studies that are provided with Professional
cannot be deleted – they can only be reverted (reset) to their original settings.
To delete (or revert) a study
▪
On the Tools menu, click on Study Editor.
▪
In the study list on the left side, click on the study that you want to delete.
▪
On the File menu of the dialog, click Delete for custom studies, or Revert to Default for studies provided by
TeleTrader that have been changed.
Importing, Exporting and Sharing Studies
You can export studies and later import them into another TeleTrader Professional installation. This way, you can
share your studies with other Professional users.
If you have created your own study, you might have invested a lot of time and research into writing the source code of
this study. Perhaps you want to let others use the study that you created, but you do not want to let everyone see (or
edit) the source code of your study. To prevent others from accessing the source code of your study, you have two
possibilities:
Analysis Tools
318
TeleTrader Software GmbH
Marc-Aurel-Straße 10-12, 1010 Vienna, Austria
E-Mail [email protected]
Internet http://professional.teletrader.com
▫
You can restrict the use of the study to certain Professional users and additionally set a time limit. The chosen
user can use the study for the time that you specify during export, but cannot see its source code.
▫
You can protect it with a password. Everyone who does not know the password can still use the study in a chart
or price page and change its parameter values or appearance, but will be prompted to enter the password if he
tries to access the source code.
You can also send a study per e-mail to other Professional users from within the program. When sending e-mails
from within Professional, you have to use your default e-mail client. To activate the default e-mail client in
Professional, use the menu command File > Send E-mail > Use Default E-Mail Client. For details on sending emails with Professional, see Sending Workspaces, Virtual Pages or Documents via E-Mail on page 169.
To export a study
▪
On the Tools menu, click on Study Editor.
▪
In the study list on the left side, click on the study that you want to export.
▪
On the File menu of the Study Editor, click Export.
▪
In the Export Study dialog, click Browse to choose the destination folder for your study.
▪
If you want to restrict the use of the study to a certain Professional user for a chosen time period, select Time
limit. Enter the MDS user name (this is identical to the Professional user name) that is allowed to use the study,
and the Time limit in days that the user is allowed to do so.
▪
If you want to protect your study with a password instead, select Password protection and enter the password
twice.
▪
Click OK to export the study.
Analysis Tools
319
TeleTrader Software GmbH
Marc-Aurel-Straße 10-12, 1010 Vienna, Austria
E-Mail [email protected]
Internet http://professional.teletrader.com
To import a study
Note
You can also import studies that where created with previous versions of TeleTrader Professional.
Their source code will automatically be converted to the new syntax of the TeleTrader Language
during the import process.
▪
On the Tools menu, click on Study Editor.
▪
On the File menu of the Study Editor, click Import.
▪
In the Import Analysis Tools File dialog, select the Professional study that you want to import.
▪
Click Open.
To send a study via e-mail
▪
On the Tools menu, click on Study Editor.
▪
In the study list on the left side, click on the study that you want to send via e-mail.
▪
On the File menu of the Study Editor, click E-Mail Study.
▪
A new e-mail message appears. Enter the e-mail address of the recipient(s) and click Send.
Analysis Tools
320
TeleTrader Software GmbH
Marc-Aurel-Straße 10-12, 1010 Vienna, Austria
E-Mail [email protected]
Internet http://professional.teletrader.com
Alerts (Notifications)
When you are monitoring a market, or the development of a security, you often look out for certain events, like a
relevant news story, the breaking of a specific price level, a buy / sell signal or the intersection of the time series with
a study or drawing object. With alerts, TeleTrader Professional can automatically notify you when certain events take
place, and you can define the actions that are then automatically carried out by Professional (for example a sound
signal, or the sending of an e-mail).
Alert types
There are five different types of alerts that you can use:
Price alerts
Notify you when the price of a symbol reaches a certain level. See Price Alerts on page
321.
News alerts
Notify you whenever a certain keyword or phrase shows up in an incoming news story. See
News Alerts on page 325.
Time alerts
Notify you when a certain time is reached. See Time Alerts on page 326.
Intersection alerts
Notify you when two chart objects (for example time series, study, drawing object) cross.
See Intersection Alerts on page 326.
Study alerts
Notify you when a new signal marker (for example a Buy or Sell signal or Candlestick
pattern) appears on a chart. See Study Alerts on page 328.
For every alert, different settings can be made to define when it will be triggered. In addition, you can define which
actions will be carried out once the trigger condition has been met.
Action types
After an alert has been triggered, at least one of these actions can be carried out:
Notification
Displays the Alert Event Notification window with a text message. See Notification Action
on page 334.
E-mail
Sends an e-mail to the specified recipient(s). See E-Mail Action on page 335.
Sound
Plays a sound file or system speaker signal. See Sound Action on page 336.
(News) Display
Shows one or more documents on the screen. See Display Action on page 336.
This action type is only available for price and news alerts.
Print
Prints one or more documents. See Print Action on page 337.
This action type is only available for time alerts.
You can adapt every action type to your needs, for example choose what sound is played, or what document should
be displayed.
Price Alerts
Price alerts can notify you when the price of a specific symbol reaches a certain level. You can insert a price alert
directly in the Alerts window, or from a price page, chart or options matrix.
You can define the kind of price that triggers the alert (Last, Open, High, Low, Close, Bid, Ask etc.), the price level at
which the alert will be triggered, and if the price should rise above or drop below this level to trigger the alert.
Additionally, you can choose between three types of price alerts:
Alerts (Notifications)
321
TeleTrader Software GmbH
Marc-Aurel-Straße 10-12, 1010 Vienna, Austria
E-Mail [email protected]
Internet http://professional.teletrader.com
▫
Price: This is the "normal" price alert and the default setting. You will be notified when the current price reaches
the trigger price that you defined, and the alert will be automatically deactivated after it has been triggered.
▫
Trailing Stop: The trigger price will follow the price movement at a pre-set distance (for example 2 points), as
long as the price moves away from the price level defined in the alert. Once the symbol's price changes direction,
the trigger price level will hold and the alert will be triggered and deactivated once it is hit.
▫
Adjust when triggered: Similar to normal price alerts, you will be notified when the current price reaches the
defined trigger price. Then, the trigger price will be recalculated at a new level defined by a pre-set distance (for
example 5% above the current price) and the alert will be active again.
Once a normal or trailing stop price alert has been triggered, it is automatically deactivated. The columns => or =< of
the price alert will then be shaded by default (you can also choose a custom color for triggered alerts):
The column Time shows the last date and time that a price alert has been triggered. You can also sort by that
column, so that recently triggered alerts are displayed on top. To enable a deactivated price alert again, see Enabling,
Disabling and Deleting Alerts on page 331.
To customize the visible columns, fonts, colors and update styles used for price alerts, see Customizing the Alerts
Window for Price Alerts on page 329.
To insert a price alert in the Alerts window
▪
On the View menu, click Alerts.
▪
In the Alerts window, click on the Price tab.
▪
Right-click on the last (empty) row of the alerts list and choose Insert Symbols.
▪
The Symbol Search dialog is displayed.
▪
Enter your search term in the first field on the left side and change the search settings, if necessary. For more
information, see Searching for Securities in the Symbol Search Dialog on page 34.
▪
Click on the green button or press the ENTER key to start the search.
▪
Select the symbol for which you want to get a price alert.
▪
Click OK. The symbol is inserted into the Alerts window.
▪
In the column Field, choose the price field on which the alert should be triggered. By default, the Last price is
used. The column Current Price will automatically display the updated value for this field.
▪
In the columns => or =<, enter the trigger price for the alert:
▪
=>
When the price for the chosen field of the symbol is equal or greater than this value, the alert will be
triggered and the action(s) defined under => Action(s) will be carried out.
=<
When the price for the chosen field of the symbol is equal or smaller than this value, the alert will be
triggered and the action(s) defined under =< Action(s) will be carried out.
To enter a trigger price, you can either:
-
Right-click in the column => or =< and choose Today’s High/Low, Today’s Open, Yesterday’s High/Low
or Yesterday’s Close as the trigger price.
Alerts (Notifications)
322
TeleTrader Software GmbH
Marc-Aurel-Straße 10-12, 1010 Vienna, Austria
E-Mail [email protected]
Internet http://professional.teletrader.com
-
Double-click in the column => or =< and type a custom price.
-
Click in the column => or =<, type a percent sign % and enter the desired percentage that should be added
to or subtracted from the current price level. The percentage will automatically be converted into a price. For
example, if you enter 10% in the column => and the current price is at 10, the => trigger price will be set to
11.
Note
To remove a set trigger price, right-click and choose Clear.
▪
In the columns => Action(s) or =< Action(s), define which action(s) will be carried out when the price alert is
triggered. See Setting the Action on Triggering an Alert on page 332.
▪
In the column Mode, choose the type of price alert you want to create (for examples, see comparison below):
▪
Price
Default setting. You will be notified when the current price reaches the trigger price
that you defined. The alert will be automatically deactivated after it has been triggered.
Trailing Stop
The trigger price will follow the price movement at a pre-set distance as long as the
price moves away from it. When the symbol's price changes direction, the trigger price
level will hold. You will be notified when the current price reaches the trigger price.
The alert will be automatically deactivated after it has been triggered.
Adjust when triggered
You will be notified when the current price reaches the trigger price that you defined.
The trigger price will then be recalculated at a new level defined by a pre-set distance
above/below the current price and the alert will be active again.
For the types Trailing Stop and Adjust when triggered, enter the distance to the current price in the column
Distance:
-
Double-click in the column Distance and type a custom value.
-
Right-click in the column Distance and choose Use distance to upper trigger or Use distance to lower
trigger to automatically calculate the difference between the current price and the trigger price (upper
trigger: column =>, lower trigger: column =<) and use this value as distance.
▪
In the column Abs./Perc., choose whether the distance value should be interpreted as an absolute value (Abs.)
or as a percentage (Perc.).
▪
In the columns => Note or =< Note, add a note for this price alert. This text will also be used in notifications (see
Notification Action on page 334).
To insert a price alert for a symbol in a price page
▪
Right-click on the symbol in the price page and choose Insert Alert > Price Alert.
▪
In the Alerts window, complete the price alert settings for this symbol (see above). If you have entered text in the
column Text of the price page, it will be automatically copied to the columns => Note and =< Note of the alert.
Note
In the same way, you can also insert a price alert from the price page view of a time and sales
document.
To insert a price alert for a symbol in a chart
▪
Position the mouse pointer on the chart at the price level where the price alert should be triggered.
▪
Right-click on the chart and choose Insert > Price Alert.
▪
In the Alerts window, complete the price alert settings for this symbol (see above).
To insert a price alert for a symbol in an options matrix
▪
Right-click on the symbol in the options matrix and choose Insert Price Alert.
▪
In the Alerts window, complete the price alert settings for this symbol (see above).
Alerts (Notifications)
323
TeleTrader Software GmbH
Marc-Aurel-Straße 10-12, 1010 Vienna, Austria
E-Mail [email protected]
Internet http://professional.teletrader.com
Comparison of the different types of price alerts
To better understand the differences between normal Price alerts, Trailing Stop alerts and Adjust when triggered,
the following table shows a comparison of their behavior regarding the trigger price and of what happens after they
have been triggered.
Type of alert
Trigger price
After alert was triggered
Price
Never changes
Automatically deactivated
Trailing Stop
Follows the price when price moves away from
the trigger price, not changed when price moves
towards the trigger price
Automatically deactivated
Adjust when triggered
Does not change while alert is active, but is
adjusted every time the alert is triggered
Trigger price is adjusted, and alert
is activated again
The example below illustrates this different behavior. For this example, assume that the current price of the symbol
for which you create the alert stands at 12 and the initial upper trigger in the column => is set to 14 for all three alert
types. For the Trailing Stop and Adjust when triggered alerts, the distance is set to 2 points.
Behavior of Price alerts:
▫
The trigger price will not change, no matter in which direction the price moves.
▫
When the current price rises to 14, the alert will be triggered and you will be notified.
▫
The upper trigger price will now be deactivated.
Behavior of Trailing Stop alerts:
▫
When the current price falls, the upper trigger price will follow the price movement at a distance of 2 points. For
example, when the price falls to 10, the upper trigger price will be changed to 12.
▫
When the current price rises, the upper trigger price will hold. For example, when the price first falls to 10 and
then rises to 11, the upper trigger price will stay at 12.
▫
When the current price continues to rise to 12, the alert will be triggered and you will be notified.
▫
The upper trigger price will now be deactivated.
Behavior of Adjust when triggered alerts:
▫
The trigger price will not change, no matter in which direction the price moves.
▫
When the current price rises to 14, the alert will be triggered and you will be notified.
▫
The upper trigger price will now be changed to 16, which is 2 points higher than the current price of 14, and the
alert will be activated again.
▫
When the current price continues to rise to 16, the alert will be triggered again, and the trigger price will be
adjusted once more.
▫
This type of alert is never deactivated, unless you disable it manually (see Enabling, Disabling and Deleting
Alerts on page 331).
Alerts (Notifications)
324
TeleTrader Software GmbH
Marc-Aurel-Straße 10-12, 1010 Vienna, Austria
E-Mail [email protected]
Internet http://professional.teletrader.com
News Alerts
News alerts notify you whenever a specified keyword or phrase shows up in an incoming news story (either in the
headline or in the text). You can insert a news alert directly in the Alerts window, from a price page or from a news
document.
A news alert stays active also after it has been triggered, unless you define this otherwise in the display action
settings (see Display Action on page 336).
To insert a news alert in the Alerts window
▪
On the View menu, click Alerts.
▪
In the Alerts window, click on the News tab.
▪
Double-click on the field Keywords.
▪
Enter a keyword or a phrase that will trigger the news alert. When you want to use more than one keyword,
separate them with a semicolon ( ; ) or an ampersand ( & ). When you want to search for breaking news, enter *
as the keyword.
▪
Press the ENTER key.
▪
In the column Whole Words Only, choose whether the alert should only be triggered for an exact match (Yes),
or also if parts of the keyword are included in the news story (No).
Note
▪
If you for example use the keyword "Profit", and the news story includes the word "Profits", the
alert will not be triggered with the setting Yes. If you had used the setting No, the alert would also
have been triggered for "Profits".
In the column Match Case, choose whether the keyword is case-sensitive (Yes) or not (No).
Note
If you for example use the keyword "profit", and the news story includes the word "Profit", the alert
will not be triggered with the setting Yes. If you had used the setting No, the alert would also have
been triggered for "Profit".
▪
In the column Actions, define which action(s) will be carried out when the news alert is triggered. See Setting the
Action on Triggering an Alert on page 332.
▪
In the column Note, add a note for this news alert. This text will also be used in notifications (see Notification
Action on page 334).
To insert a news alert from a price page
▪
Right-click in the price page and choose Insert Alert > News Alert.
▪
In the Alerts window, complete the news alert settings (see above).
Alerts (Notifications)
325
TeleTrader Software GmbH
Marc-Aurel-Straße 10-12, 1010 Vienna, Austria
E-Mail [email protected]
Internet http://professional.teletrader.com
To insert a news alert from a news document
▪
Right-click on the news document and choose Insert Alert.
▪
In the Alerts window, complete the news alert settings (see above).
Time Alerts
Time alerts are triggered at a certain date and time. You can use them to notify you at the same time every day (or
every weekday), or only use it once at a specific date. A time alert can also initiate a printout of certain documents at
a specific time.
Time alerts stay active only if they are set to be triggered every day or weekday.
To insert a time alert in the Alerts window
▪
On the View menu, click Alerts.
▪
In the Alerts window, click on the Time tab.
▪
Double-click on the field Time. The current time is inserted by default.
▪
Enter the time at which the alert will be triggered in the format hh:mm.
▪
Press the ENTER key.
▪
In the column Day, choose when the alert should be active:
Today
Alert will be triggered today and become inactive afterwards
Tomorrow
Alert will be triggered tomorrow and become inactive afterwards
Weekdays
Alert will be triggered every weekday (Monday through Friday)
Every Day
Alert will be triggered every day
▪
Alternatively, choose a date at which the alert should be triggered in the column Date.
▪
In the column Actions, define which action(s) will be carried out when the time alert is triggered. See Setting the
Action on Triggering an Alert on page 332.
▪
In the column Note, add a note for this time alert. This text will also be used in notifications (see Notification
Action on page 334).
Intersection Alerts
Intersection alerts will notify you when two chart objects that are in the same chart pane cross (intersect). You can for
example define an intersection alert for the crossover of the time series with a trend line or with a study line, or when
the trigger line of a study crosses its main line (for example MACD).
Alerts (Notifications)
326
TeleTrader Software GmbH
Marc-Aurel-Straße 10-12, 1010 Vienna, Austria
E-Mail [email protected]
Internet http://professional.teletrader.com
To create an intersection alert, a chart document with at least two chart objects must be open. You can insert an
intersection alert directly in the Alerts window, or from the chart. An intersection alert is always connected with a
specific chart document.
Intersection alerts stay active as long as the connected chart document stays open. When you close the chart
document, or remove one of the chart objects that are used for the alert, the alert is automatically deleted.
Note
You can however hide the chart by right-clicking on the alert and choosing Hide Chart. This will
keep the chart window open in the background, but makes it invisible on the screen. Use Show
Chart to make it visible again.
To insert an intersection alert in the Alerts window
▪
On the View menu, click Alerts.
▪
In the Alerts window, click on the Intersection tab.
▪
Click in the column Description1 and hold the mouse button down. The mouse pointer changes:
▪
While holding the mouse button down, move the pointer to the chart for which you want to insert the intersection
alert. A floating information box is displayed on the chart.
▪
Move the mouse pointer to the first chart object that should trigger the intersection alert. The floating information
box shows the name of this chart object, and the mouse pointer changes to a magnifying glass:
▪
Release the mouse button. The first chart object is added to the intersection alert.
▪
In the column Property1, choose the value of the chart object that should trigger the intersection alert.
Depending on the type of chart object, the list will be different. For symbols, you can for example choose
between the Open, High, Low and Close prices of the security, as well as the volume and open interest.
▪
Click in the column Description2, hold the mouse button down and choose the second chart object in the same
way as described above.
▪
In the column Property2, choose the value of the second chart object that should trigger the alert.
▪
In the column Type, choose at which sort of intersection of the two chart objects the alert should be triggered:
Any Intersection
Alert is triggered at any intersection of the two chart objects
First > Second
Alert is triggered when the first object crosses the second object from below
First < Second
Alert is triggered when the first object crosses the second object from above
Alerts (Notifications)
327
TeleTrader Software GmbH
Marc-Aurel-Straße 10-12, 1010 Vienna, Austria
E-Mail [email protected]
Internet http://professional.teletrader.com
▪
In the column Evaluation, choose when the trigger conditions should be checked:
after tick
Trigger conditions will be evaluated after each tick
after bar
Trigger conditions will be evaluated when a bar is complete (depending on the data
compression of the chart)
▪
In the column Actions, define which action(s) will be carried out when the intersection alert is triggered. See
Setting the Action on Triggering an Alert on page 332.
▪
In the column Note, add a note for this intersection alert. This text will also be used in notifications (see
Notification Action on page 334).
To insert an intersection alert from a chart
▪
Right-click on the chart and choose Insert > Intersection Alert.
▪
In the Insert Intersection Alert dialog, choose the first and second chart object from the list.
This equals the settings Description1 and Description2 in the Alerts window.
▪
For each chart object, choose the Field (value) that should trigger the intersection alert.
This equals the settings Property1 and Property2 in the Alerts window.
▪
Choose the Type and Evaluation options like described above.
▪
Click OK.
▪
The Alerts window appears. You can change the intersection alert settings if necessary (see above).
Study Alerts
Study alerts will notify you when a new signal marker (up / down arrow, for example Buy or Sell signal) appears on a
chart. To create a study alert, a chart document with a study of the type Signal must be open. A study alert is always
connected with a specific chart document.
Alerts (Notifications)
328
TeleTrader Software GmbH
Marc-Aurel-Straße 10-12, 1010 Vienna, Austria
E-Mail [email protected]
Internet http://professional.teletrader.com
Study alerts stay active as long as the connected chart document stays open. When you close the chart document, or
remove one of the chart objects that are used for the alert, the alert is automatically deleted.
Note
You can however hide the chart by right-clicking on the alert and choosing Hide Chart. This will
keep the chart window open in the background, but makes it invisible on the screen. Use Show
Chart to make it visible again.
To insert a study alert from a chart
▪
Right-click on the chart and choose Insert > Study Alert.
▪
The Alerts window with the new study alert appears. You can adapt the parameters of the study on which the
alert is based by clicking Change Parameters.
▪
In the column Actions, define which action(s) will be carried out when the study alert is triggered. See Setting the
Action on Triggering an Alert on page 332.
▪
In the column Note, add a note for this study alert. This text will also be used in notifications (see Notification
Action on page 334).
To change the parameters of a study alert
▪
On the View menu, click Alerts.
▪
In the Alerts window, click Change Parameters for the study alert that you want to adapt.
▪
In the Chart Properties dialog, adapt the parameter values of the connected study to your needs.
Note
The changed settings are also applied to the visible study on the chart.
Customizing the Alerts Window for Price Alerts
In the Alert Properties dialog, you can add and remove columns for price alerts, customize the font and colors of the
Price tab, the appearance and color of the grid, and the update style of the Current Price column. You can also group
price alerts by symbol.
Note
These settings currently apply only to the Price tab – other tabs (News, Time, Intersection, Study
and History) are currently not affected by these settings.
To open the Alerts Properties dialog
▪
In the Alerts window, click on the Price tab.
▪
Right-click in on any price alert and select Properties.
To add columns to and remove them from the Price tab
▪
In the Alert Properties dialog, select Columns.
▪
Add and remove columns like you would in a price page. For details, see Adding and Removing Columns on
page 80.
▪
You can also rearrange the columns by selecting a column in the Displayed Columns list and clicking Move Up
or Move Down.
Alerts (Notifications)
329
TeleTrader Software GmbH
Marc-Aurel-Straße 10-12, 1010 Vienna, Austria
E-Mail [email protected]
Internet http://professional.teletrader.com
To change the update style for the Current Price column
▪
In the Alert Properties dialog, select Update.
▪
In the Update Notify and Movement sections, select the desired update style. For details, see Changing the
Update Style of a Column on page 83.
To change the grid style on the Price tab
▪
In the Alert Properties dialog, select Grid.
▪
Adapt the default settings to you needs. For details, see Changing the Grid Style on page 84.
To change font and colors on the Price tab
▪
In the Alert Properties dialog, select Font.
▪
Adapt the default settings to your needs:
Control
Description
Font
Type of font used for text on the Price tab
Font Style
Font style of the text (Regular, Italic, Bold, Italic + Bold)
Font Size
Size of the font used on the Price tab
Foreground
Basic color of the text
Background
Background color of the text
Triggered Alert Color
Foreground and Background colors of the cells in columns => or =< after a nomal or
trailing stop price alert has been triggered.
To sort the alerts on the Price tab
▪
Double-click the column header by which you want to sort. You can sort by any column except the =< / =>
Action(s) columns.
To group price alerts by symbol
▪
Right-click on any price alert and choose Show groups.
▪
If there are more than one price alerts for one symbol, those will now be grouped under a collapsible heading. All
other symbols will be grouped under the heading Other.
▪
To collapse a group, click on the minus sign in the row header; to expand a group, click on the plus sign.
▪
To return to the normal view of price alerts, right-click on any price alert and choose Hide groups.
Opening Documents from the Alerts Window
Every alert (except time alerts) is either connected to a symbol or to a news story. You can open the connected
symbol or news story from the Alerts window, or also from the Alert Event Notification windows (see Notification
Action on page 334).
To open a document from the Alerts window
▪
On the View menu, click Alerts.
▪
In the Alerts window, right-click on the alert for which you want to open a document.
Alerts (Notifications)
330
TeleTrader Software GmbH
Marc-Aurel-Straße 10-12, 1010 Vienna, Austria
E-Mail [email protected]
Internet http://professional.teletrader.com
▪
Depending on the type of alert, you can open different document types:
Open >
Available for price alerts, intersection alerts and study alerts
Choose the desired document type from the list. You can also use templates. See Opening
Symbols from Existing Documents on page 66 for details.
Open News
Available for news alerts
Go To Chart
Available for intersection alerts and study alerts
This command does not open a new chart, but only shows the connected chart window.
Note
For intersection alerts, you can also choose Hide Chart, which will keep the chart window open in
the background, but makes it invisible on the screen. Use Show Chart to make it visible again.
Enabling, Disabling and Deleting Alerts
You can temporarily disable alerts (deactivate them), enable them again or delete them. Alerts that are disabled will
not be triggered, even if their condition is met.
News alerts and some time alerts are disabled automatically after they have been triggered for the first time. You can
enable them if you want to use them again. For price alerts, only the price that has triggered the alert is disabled
automatically (except when the mode of the price alert is set to Adjust when triggered, see Price Alerts on page
321). The other price (when set) still stays active. You can enable / disable the two trigger prices (=> and =<)
separately.
To disable an alert
▪
On the View menu, click Alerts.
▪
In the Alerts window, remove the checkmark in the column On of the alert that you want to disable.
To enable an alert
▪
On the View menu, click Alerts.
▪
In the Alerts window, place a checkmark in the column On of the alert that you want to enable.
To disable / enable trigger prices for price alerts
▪
On the View menu, click Alerts.
▪
In the Alerts window, right-click on the column => or =< and choose Disable (or Enable).
Note
If you disable one trigger price (for example the => trigger), the other trigger price (for example =<)
will stay active as long as you do not disable the whole price alert.
To delete an alert
▪
On the View menu, click Alerts.
▪
In the Alerts window, right-click on the alert and choose Delete Alert.
Alerts (Notifications)
331
TeleTrader Software GmbH
Marc-Aurel-Straße 10-12, 1010 Vienna, Austria
E-Mail [email protected]
Internet http://professional.teletrader.com
Viewing the Alerts History
The alerts history shows a list of all alerts that have been triggered in the past, regardless of which action was carried
out after the trigger. The history is kept until you manually clear it.
To view the alerts history
▪
On the View menu, click Alerts.
▪
In the Alerts window, click on the History tab.
To clear the alerts history
Note
This action cannot be undone. This will delete the entire alerts history.
▪
On the View menu, click Alerts.
▪
In the Alerts window, click on the History tab.
▪
Right-click on the history list and choose Delete All.
Note
To clear individual events from the alerts history, right-click on the event and choose Delete.
Setting the Action on Triggering an Alert
You can define which action or actions will be carried out when an alert is triggered. By default, some actions are
already connected with every alert type: For a example, a price alert could always be created with a notification and
sound action, whereas an intersection alert could always be created with an e-mail action, etc.
For every alert on the list, you can define individual actions that only apply to this alert. You can also change the
default actions that are associated with every new alert of this type (for example, for all newly created time alerts or
intersection alerts).
To set the action(s) used when an alert is triggered
▪
On the View menu, click Alerts.
▪
In the Alerts window, right-click on the alert for which you want to define the action(s) that will be carried out
when the alert is triggered, and choose Set Alert Actions. (For price alerts, choose Set => Actions or Set =<
Actions.) The Alert Action Editor appears.
Alerts (Notifications)
332
TeleTrader Software GmbH
Marc-Aurel-Straße 10-12, 1010 Vienna, Austria
E-Mail [email protected]
Internet http://professional.teletrader.com
Note
▪
▪
You can also double-click in the Actions column to open the Alert Action Editor.
In the Alert Action Editor, select the action(s) that you want to use on the left side of the dialog by placing a
check mark in front of every action that should be included.
Notification
Displays the Alert Event Notification window with a text message. See Notification Action on
page 334
E-mail
Sends an e-mail to the specified recipient(s). See E-Mail Action on page 335
Sound
Plays a sound file or system speaker signal. See Sound Action on page 336
(News) Display
Shows one or more documents on the screen. See Display Action on page 336
This action type is only available for price, study and news alerts.
Print
Prints one or more documents. See Print Action on page 337
This action type is only available for time alerts.
On the right side of the dialog, adapt the settings for this action to your needs.
To set the default action(s) for certain alert types
▪
On the View menu, click Alerts.
▪
In the Alerts window, click on the tab of the alert type for which you want to define the default action(s).
▪
Right-click on the alert list and choose Set Default Actions. (For price alerts, choose Set => Default Actions or
Set =< Default Actions.)
▪
In the Alert Action Editor, adapt the default settings to your needs:
-
Select the default action(s) on the left side of the dialog by placing a check mark in front of every action that
should be included by default.
-
Adapt the settings of each action to your needs.
Actions column
The actions that are currently associated with an alert are shown in the Actions column. For price alerts, there are
two actions columns called => Action(s) and =< Action(s), which correspond to the => and =< triggers respectively.
Alerts (Notifications)
333
TeleTrader Software GmbH
Marc-Aurel-Straße 10-12, 1010 Vienna, Austria
E-Mail [email protected]
Internet http://professional.teletrader.com
You can assign the default actions to an alert (if they are not included already), or completely hide the Actions
column in the alerts list.
All associated actions are displayed with their abbreviations:
Abbreviation
Action type
Ntf
Notification
Eml
E-Mail
Snd
Sound
Dsp
Display
NwsDsp
News Display
Prn
Print
To hide the Actions column
▪
In the Alerts window, right-click on the alert list and choose Hide Alert Actions Columns.
Note
If you later want to show the Actions column again, right-click and choose Show Alert Actions
Columns.
To use the default actions for an alert
▪
In the Alerts window, right-click on the Actions column and choose Insert Default Action.
Notification Action
The notification action automatically displays the Alert Event Notification window when the alert is triggered. This
windows is always shown on top of all other windows, even when TeleTrader Professional is minimized. It includes
the time and date when the alert has been triggered, an icon to show the alert type, a description of the trigger events
that led to the alert, and a pre-defined note that can be customized.
Note
The text that is entered in the column Note of any alert is automatically used as notification text.
This works in both directions: Text that is entered for the notification action in the Alert Action
Editor is automatically displayed in the column Note.
To customize the notification window
▫
To change the background color of the notifications, right-click anywhere in the window and choose Background
color.
▫
To change the text color of the notifications, right-click anywhere in the window and choose Text color.
Alerts (Notifications)
334
TeleTrader Software GmbH
Marc-Aurel-Straße 10-12, 1010 Vienna, Austria
E-Mail [email protected]
Internet http://professional.teletrader.com
▫
To delete a notification from the window, right-click on the notification and choose Delete. The alert will still be
visible in the alerts history.
▫
To open a document containing the symbol, double-click on the notification. The document type that is opened
depends on the type of alert:
Price alert
Opens a price page
News alert
Opens a news document
Intersection alert
Opens the connected chart
Study alert
Opens the connected chart
To customize the notification action
▪
Open the Alert Action Editor, for example by double-clicking in the Actions column.
▪
On the left side of the dialog, select Notification.
▪
On the right side of the dialog, type additional text that should appear when the alert is triggered into the field
Note.
E-Mail Action
The e-mail action automatically sends an e-mail message with a pre-defined text to the chosen recipient(s).
Note
The e-mail settings must be configured in order to use this type of action. See E-Mail Settings on
page 348.
To customize the e-mail action
▪
Open the Alert Action Editor, for example by double-clicking in the Actions column.
▪
On the left side of the dialog, select E-mail.
▪
On the right side of the dialog, enter the recipient(s) of the e-mail message into the fields To, Cc (carbon copy) or
Bcc (blind carbon copy).
Note
If you have defined an internal address book, click on the labels To, Cc or Bcc to access it. See
also Using the Internal Address Book on page 170.
Alerts (Notifications)
335
TeleTrader Software GmbH
Marc-Aurel-Straße 10-12, 1010 Vienna, Austria
E-Mail [email protected]
Internet http://professional.teletrader.com
▪
Enter the Subject and the body text of the e-mail message.
Sound Action
The sound action plays a sound file or a signal from the computer’s system speaker when the alert has been
triggered.
To customize the sound action
▪
Open the Alert Action Editor, for example by double-clicking in the Actions column.
▪
On the left side of the dialog, select Sound.
▪
On the right side of the dialog, choose whether you want to use the internal system speaker of your computer for
the alert (Speaker), or play a sound file when the alert is triggered (File).
▪
If you chose File, click on Browse to find the sound file (.wav file) that should be played.
▪
Enter the number of times that the sound file will be played when the alert is triggered (the maximum is 20 times).
▪
You can test the sound action by clicking on the play button.
Display Action
The display action shows one or more documents when the alert is triggered. This action type is only available for
price, study and news alerts.
Alerts (Notifications)
336
TeleTrader Software GmbH
Marc-Aurel-Straße 10-12, 1010 Vienna, Austria
E-Mail [email protected]
Internet http://professional.teletrader.com
To customize the display action
▪
Open the Alert Action Editor, for example by double-clicking in the Actions column.
▪
On the left side of the dialog, select Display (or News Display).
▪
On the right side of the dialog, select the document that should be opened when the alert is triggered. Depending
on the alert type, different options are available:
Alert type
Options
Description
Price alerts
Chart
Opens a new chart document containing the symbol
Time & Sales
Opens a new time and sales document containing the
symbol
Price Page
Opens a new price page document containing the symbol
Study alerts
(No options available)
Shows the existing chart document that triggered the alert
News alerts
Open news after triggering
alert
Opens the news document that triggered the alert
Disable alert after triggering
Disables the alert after it has been triggered
Print Action
The print action automatically prints out one or more documents at a certain time. This action type is only available for
time alerts.
To customize the print action
▪
Open the Alert Action Editor, for example by double-clicking in the Actions column.
▪
On the left side of the dialog, select Print.
▪
On the right side of the dialog, select the documents that should be printed when the alert is triggered from the
Available documents list.
▪
You can use the buttons Select All, Unselect All or Inverse Select to select / deselect several documents at
once.
Alerts (Notifications)
337
TeleTrader Software GmbH
Marc-Aurel-Straße 10-12, 1010 Vienna, Austria
E-Mail [email protected]
Internet http://professional.teletrader.com
Global Settings and Options
You can change the general behavior of TeleTrader Professional for many features. As these settings apply to the
whole program, and not just to one workspace or document, they are concentrated in one Options dialog.
In this section, you will also find an overview about the command elements that are used in TeleTrader Professional,
namely keyboard shortcuts, toolbars and the status bar.
To display the Options dialog
▪
On the Tools menu, click Options.
▪
On the left side of the dialog, choose the appropriate options sheet. The option sheets are arranged hierarchically
and displayed in several groups as a tree view.
▪
On the right side of the dialog, adapt the default settings to your needs.
Global Settings and Options
338
TeleTrader Software GmbH
Marc-Aurel-Straße 10-12, 1010 Vienna, Austria
E-Mail [email protected]
Internet http://professional.teletrader.com
General Settings
On the General options sheet, you can find settings related to the start-up of TeleTrader Professional and
miscellaneous other settings.
Setting
Description
On start-up, always open the default
workspace
Check to open the default workspace on every start of
Professional.
On start-up, automatically reopen the last
workspace you were working on
Check to automatically open the workspace that you worked
with last on every start of Professional.
Show Welcome dialog at startup
Check to automatically display the Welcome dialog on every
start of Professional.
Show Workspace Information dialog if load
time exceeds 30 seconds
Check to display the Workspace Information dialog with
details about the contents of your workspace and optimizing
tips whenever the load time for a workspace exceeds 30
seconds.
Display templates when a new workspace is
created
Check to automatically display the New Document dialog
whenever you create a new workspace.
Autosave workspace every x minutes
Check to automatically save all changes in the current
workspace every few minutes. Enter the number of minutes (1
to 9999) between saves.
Use this data feed on next login
Clear to choose between working online and offline on the
next start of Professional.
Always show sheets
Check to enable sheets in charts, price pages and time and
sales documents.
Automatically display system news
Check to display system messages (recommended).
Automatically resize documents
Check to resize all documents in a Professional main window
to an appropriate size when the main window is resized
manually. See also Changing the Size of a Document
Window on page 160.
Hibernate inactive chart documents after x
seconds
Check to automatically hibernate chart documents that are
not visible (inactive sheets, other virtual pages) after a
number of seconds. Activating this settings can significantly
improve the performance of TeleTrader Professional for
workspaces that contain a large number of charts.
Use custom interest rate for calculating
Greeks: x %
Check to use a custom interest rate for all options matrix
documents (except for options matrix documents where an
individual interest rate has been set in the Options Matrix
Properties dialog). See also Customizing the Greeks View on
page 130.
Use thousands separator
Check to show a thousands separator for large numbers
(such as volume data).
Language
Choose the language for the Professional interface.
When you change the language, you will be asked to restart
the application so that the change can take effect.
Subscription Settings
On the Subscription options sheet, you can see which symbols you are subscribed to at the moment, and can add or
remove symbols. Only subscribed symbols are updated automatically in your documents when new ticks arrive. You
can also change the number of decimal places that are shown for a symbol in Professional documents.
If the maximum number of subscribed symbols is exceeded, all further symbols will be displayed on the screen, but
you will receive no new data for them (they will show up as unsubscribed symbols).
Global Settings and Options
339
TeleTrader Software GmbH
Marc-Aurel-Straße 10-12, 1010 Vienna, Austria
E-Mail [email protected]
Internet http://professional.teletrader.com
You can see how many symbols you are subscribed to at the moment in the subscription section of the status bar.
The number will turn red when you have exceeded the maximum number of subscribed symbols: Double-click on the
number to directly access this options sheet. See also Status Bar on page 361.
Note
You are automatically subscribed to every symbol that you open in a document. Close some
Professional documents (for example price pages) to automatically unsubscribe the symbols
contained in these documents, or use the procedure described below to manually choose which
symbols you want to unsubscribe.
To unsubscribe a symbol
▪
In the Subscribed symbols list, select the symbol that you want to unsubscribe.
▪
Click Remove. The symbol is moved to the Unsubscribed symbols list. It will still be displayed in your
documents, but will not receive new data.
To re-subscribe to an unsubscribed symbol
▪
In the Unsubscribed symbols list, select the symbol that you want to subscribe to.
▪
Click Add. The symbol is moved to the Subscribed symbols list. It will now be updated again when new data
arrives.
Note
The button Add is only available when the number of simultaneously subscribed symbols (500 by
default) has not been reached yet. Otherwise, you have to remove (unsubscribe) a symbol first,
before you can subscribe to a new one.
To change the number of decimal places for a symbol
▪
In the symbols list, select the symbol for which you want to change the number of decimal places.
▪
Select Use custom decimals.
▪
Enter the number of decimal places that should be used for this symbol in all Professional documents.
Note
To use the default number of decimal places for a symbol, clear the Use custom decimals check
box.
Chart Settings
On the Chart options sheet, you can find settings related to chart documents and related tools (for example drawing
tools).
Setting
Description
Use magnet function on Select and Crosshair
Check to use the Snap tool in combination with the Select
and Crosshair tool. The crosshair will snap to the nearest
price automatically.
Keep drawing tools active until the ESC key
is pressed
Check to keep a drawing tool active after you have used it
until you press the ESC key or select another drawing tool.
Clear to deactivate the drawing tool automatically after it has
been used.
This setting does not apply to the Pivot Points, Vertical
Lines and Data Cut tools.
Show tooltips on chart
Check to display the Close price of a bar or candle as a tooltip
when positioning the mouse pointer over the bar.
Global Settings and Options
340
TeleTrader Software GmbH
Marc-Aurel-Straße 10-12, 1010 Vienna, Austria
E-Mail [email protected]
Internet http://professional.teletrader.com
Use mouse wheel for changing vertical scale
range
Check to activate expanding and compressing the time series
(show less / more data points on the screen) by turning the
mouse wheel.
Use auto enlarge for bars in zoom in/out
operation
Check to automatically adjust the width of the bars when
zooming in and out of a selection.
Use middle button to close pane
Check to activate closing a chart pane by clicking on it with
the middle button (or wheel) of your mouse.
Use only one Color for charts
Check to use only one color for all chart types.
Clear to color-code price relations, intervals or trends in most
chart types.
Use only one Color for Line charts
Check to use only one color for Line and Stair Step charts.
Clear to color-code price relations, intervals or trends in these
chart types.
Activate study color inheritance on overlaid
charts
Check to use color of the base symbol for inserted studies.
Insert the same studies in the same pane
Check to plot the same study in the same pane with previous
study.
Automatically detect best line type for
symbol. Check last x bars
Check to let Professional automatically determine which
Financial chart type to use for a symbol, depending on the
data of the last several bars (data points). Enter the number
of bars that should be checked.
Line charts will be used automatically when the last bars of
the symbol have equal Open, High, Low and Close prices (for
example only updated once per day).
Default picture format
Choose the default file format when sending a chart via e-mail
as a picture file.
Use arrow keys (Up and Down) for navigating
through linked charts
Check to use the Up and Down keys for navigating through
linked charts.
Clear to use the Up and Down keys for expanding and
compressing the time series (show less / more data points on
the screen).
Use Page Up and Page Down keys for
scrolling the chart horizontally
Check to use the Page Up / Down keys to move the chart
content horizontally.
Clear to use the Page Up / Down keys to move the chart
content vertically.
Use arrow keys (Left or Right) for activating
the Vertical Line
Check to use the Left and Right keys for activating the
Vertical Line tool.
Clear to use the Left and Right keys for moving the chart
content horizontally without activating the Vertical Line tool.
Data Table Settings
On the Data Table options sheet, you can change the appearance of the data table. See also Displaying the Data
Table View on page 214.
Control
Description
Visible bars
This section contains the settings for visible data rows, that
are also displayed in the chart. By default, all data rows are
visible.
Background
Background color of visible data rows
Foreground
Color of the text in visible data rows
Font
Type of font used for visible data rows
Global Settings and Options
341
TeleTrader Software GmbH
Marc-Aurel-Straße 10-12, 1010 Vienna, Austria
E-Mail [email protected]
Internet http://professional.teletrader.com
Font size
Size of the font used for visible data rows
Bold
Check to use a bold style for the text in visible data rows
Italic
Check to use an italic style for the text in visible data rows
Hidden bars
This section contains the settings for hidden data rows (data
that has been marked as hidden and will not be displayed in
the chart).
Background
Background color of hidden data rows
Foreground
Color of the text in hidden data rows
Font
Type of font used for hidden data rows
Font size
Size of the font used for hidden data rows
Bold
Check to use a bold style for the text in hidden data rows
Italic
Check to use an italic style for the text in hidden data rows
Display Grid
Check to display vertical and horizontal lines to separate data
rows and columns. The grid lines will have the same color as
the text of visible data rows.
Synchronize with Crosshair
Check to automatically jump to the corresponding row in the
data table when clicking on a data point in the chart.
Cross Scale Marker Settings
On the Cross Scale Markers options sheet, you can change the appearance of the markers that are shown on the
time and price scales of charts when using the Select or Crosshair tool. See also Reading Values from a Chart on
page 212.
Control
Description
Show Marker on Vertical Scale
Check to display a rectangular marker showing the price on
the price scale
Transparency level
Transparency of the price marker in percent (0% = solid)
Show Marker on Horizontal Scale
Check to display a rectangular marker showing the date/time
on the time scale
Transparency level
Transparency of the time marker in percent (0% = solid)
Document Defaults Settings
On the Document Defaults options sheet, you can define a default size for new chart documents, and either use this
size for all new chart documents, or apply the settings to all currently open chart documents.
Control
Description
Change the color of the last bar as new ticks
come in
Check to change the color of the last bar, candlestick or data
point, depending on the last tick (rising or falling prices).
Manually define chart size
Check to always use the default chart size defined below
when opening a new chart document
Width
Enter the default width for chart windows in pixel
Height
Enter the default height for chart windows in pixel
Reset All
Click to reset all open chart documents to the size defined
above
Global Settings and Options
342
TeleTrader Software GmbH
Marc-Aurel-Straße 10-12, 1010 Vienna, Austria
E-Mail [email protected]
Internet http://professional.teletrader.com
Point Style Settings
On the Point Style options sheet, you can define the colors used for reference points, extension points and visibility
points. You can either use the same colors as are used for the corresponding drawing tool, or define a default color
for each point.
For more information about reference points, extensions points and visibility points, see Adding Drawing Objects to a
Chart on page 244, Extending and Shortening Lines with Extension Points on page 271 and Hiding and Showing
Lines / Levels with Visibility Points on page 296.
Control
Description
Reference points
In this section, you can define the colors that are used for all
reference points
Outline color
Color of the borders of all reference points
Fill color
Color of the body of all reference points
Extension points
In this section, you can define the colors that are used for all
extension points
Outline color
Color of the borders of all extension points
Fill color
Color of the body of all extension points
Transparent
Check to use a transparent body for extension points (no
color)
Visibility points
In this section, you can define the colors that are used for all
visibility points
Outline color
Color of the borders of all visibility points
Fill color
Color of the body of all visibility points
Use line color from chart properties
Check to always use the line color of the corresponding
drawing tool instead of the color defined here
Saving Settings
On the Saving options sheet, you can enable the Save all Charts command to simultaneously save all open chart
documents as picture files and/or Professional chart documents. You have to enter a path where the files should be
saved, and define a default file name.
Control
Description
Enable ‘Save all Charts’ function
Check to enable the command Save all Charts on the File
menu
Save as Picture file
Check to automatically save all charts as picture files when
using File > Document > Save all Charts.
Choose the picture file format that you want to use.
Path
Enter the file location (path) where the picture files should be
saved automatically.
Save as chart document
Check to automatically save all charts as Professional
documents when using File > Document > Save all Charts.
Path
Enter the file location (path) where the chart documents
should be saved automatically.
Filename
Enter the filename that should be used for both the chart
picture files and chart documents. You have to use the
placeholders that are shown below the field.
For example: MyChart_%T_%YYYY will save a file as
MyChart_FLU_2009.nch and/or MyChart_FLU_2009.gif
Global Settings and Options
343
TeleTrader Software GmbH
Marc-Aurel-Straße 10-12, 1010 Vienna, Austria
E-Mail [email protected]
Internet http://professional.teletrader.com
Watermark Settings
On the Watermark options sheet, you can define a custom watermark that will be used on all charts that you save as
a picture file, copy to the clipboard or send via e-mail. By default, the TeleTrader logo is used as a watermark.
Control
Description
Show watermark
Check to show a custom watermark on all charts that are
saved as picture files.
Clear to use the TeleTrader logo as a watermark.
File name
Enter the file location and name of the picture file that should
be used as watermark.
Position X
Enter the horizontal position of the watermark on the chart
picture in pixels measured from the left border.
Position Y
Enter the vertical position of the watermark on the chart
picture in pixels measured from the top border.
Opacity
Opacity of the watermark (left position = transparent, right
position = solid)
Price Page Settings
On the Price Page options sheet, you can find general settings related to price page documents.
Price Page Options
Show number of advancing/declining
symbols in captions and headers
Check to display the total number of advancing (+), declining
(-) and unchanged (=) symbols for a header group and for the
current sheet.
Copy header automatically
Check to include the column headings when copying data
from a price page to a spreadsheet software (e.g. Microsoft
Excel).
Hide Price Page Notify after x seconds
Check to fade out the update style Color background after a
few seconds (flash effect). Enter the number of seconds that
the effect should be visible.
Insert existing studies when opening chart
from price page
Check to include all studies already visible in a price page,
when opening a new chart
DDE/RTD format
Choose if you want to use Microsoft Office RTD, Microsoft
Office DDE or OpenOffice.org DDE to connect to your
spreadsheet software. See also RTD – Retrieving Real-Time
Data with Excel on page 364.
News Flash Settings
On the News Flash options sheet, you can configure how long a news flash is active on a price page, specify the
colors used and choose whether to color the entire row of a symbol for a few seconds whenever a news story arrives.
News Flash Button Coloring
The News Flash button is colored differently according to the age of the related news stories for a symbol. Every
color is used for a certain time period after a news story arrives.
New
If selected, this color is used for recent news stories (for example 1 minute old).
Choose a color and how long it will be valid after a news story has arrived.
Active
If selected, this color is used for active news stories (for example 1 hour old).
Choose a color and how long it will be valid after a news story has arrived.
Old
If selected, this color is used for old news stories (for example 1 day old).
Global Settings and Options
344
TeleTrader Software GmbH
Marc-Aurel-Straße 10-12, 1010 Vienna, Austria
E-Mail [email protected]
Internet http://professional.teletrader.com
Choose a color and how long it will be valid after a news story has arrived.
News Flash Options
Color row background
for x seconds
If selected, the entire row of a symbol is colored for a few seconds whenever a news
story arrives.
Choose the number of seconds that the news flash will be active and the color used.
Use News Flash
properties for Headline
column
If selected, the color settings for the News Flash button are also used for the News
Headline column.
Aribtrage List Settings
On the Arbitrage List options sheet, you can configure which exchanges are visible when opening a new arbitrage
list and in what order they are shown. See also Opening Related Symbols in a Price Page on page 71.
To add an exchange to favorite exchanges
▪
Select the exchange that you want to add in the Available Exchanges list.
▪
Click the >> button. The chosen exchange is now moved to the Favorite Exchanges list.
To remove an exchange from favorite exchanges
▪
Select the exchange you want to remove in the Favorite Exchanges list.
▪
Click the << button. The chosen exchange is now moved to the Available Exchanges list.
To change the order of favorite exchanges
▪
Select an exchange in the Favorite Exchanges list.
▪
Click Move Up or Move Down to change the exchange's place in the list.
To show only favorite exchanges in arbitrage lists
▪
Select the option Show only favorite exchanges in arbitrage lists. When opening a new arbitrage list (see
Opening Related Symbols in a Price Page on page 71), only exchanges that are on your Favorite Exchanges
list will be shown in the newly opened arbitrage list.
VWAP Settings
On the VWAP options sheet, you can set the default type of VWAP columns when inserting them into a price page
and choose the status colors for the V-Button. See also Adding, Removing and Customizing the VWAP Columns on
page 98.
Control
Description
Active Row
Color of the V-Button if VWAP values are active. The values
are updated constantly as new ticks come in.
Period <> Current Date
Color of the V-Button if the entire time period chosen for
VWAP is before or after the current date. The values will not
be updated.
Frozen Row
Color of the V-Button if the calculation of VWAP values is
temporarily frozen for this row.
Show
Check the VWAP type(s) that you want to use as the default
type when inserting the VWAP columns on a price page.
You can choose more than one type – the symbols (rows) of
Global Settings and Options
345
TeleTrader Software GmbH
Marc-Aurel-Straße 10-12, 1010 Vienna, Austria
E-Mail [email protected]
Internet http://professional.teletrader.com
a price page will then be duplicated for each type on inserting
VWAP columns. Change the order of multiple VWAP types by
using the Move Up / Move Down buttons.
Quick Quote Settings
On the Quick Quote options sheet, you can define what template is used for the different symbol types (Stock, Index,
Future...). You have to first choose the symbol type from the list above, and then select the template that should be
used for this symbol type. For example, you could show different fields for a stock symbol than you would for a futures
symbol.
Control
Description
Security
Choose the symbol type for which you want to view / change
the template settings.
Use
Select the quick quote template that should be used for the
chosen symbol type.
You can of course use the same template for different symbol
types if you want.
Default Responses Settings
On the Default Responses options sheet, you can:
▫
Reset the saved default responses to questions such as automatically saving a workspace when closing it. For
example, when you close a workspace for the first time, Professional will ask you if you want to save the changes
made to it. If you always want to save all changes, select the check box Don’t ask this question again and click
Yes. If you always want to discard all changes, click No. Professional won’t ask again and simply save (or
discard) all changes to a workspace when you close it. If you later want to change this setting, you can reset this
question so that it will appear again the next time you close a workspace and give you the opportunity to make a
new decision.
▫
Change which default document is used when opening single symbols from the QuickBar. See Opening Symbols
from the QuickBar on page 31.
Control
Description
Prompt
Clear the check box in front of the appropriate prompt to reset
this default response. The associated question dialog will
appear again the next time this action is carried out.
QuickBar
Choose the document type that should be opened when you
open a single symbol from the QuickBar.
Double-Click Actions Settings
On the Double-Click Actions options sheet, you can define what document is opened when you double-click on a
symbol. You have to first choose the document where you perform the double-click in on the left, and then select the
document that should be opened on the right. For example, you could always open a company profile when doubleclicking on a symbol in a price page.
Control
Description
Double-click in document
Choose the document where you want to view / change the
double-click settings (source of the double-click).
Open Document
Select the document or action that should be opened when
you double-click a symbol in the document chosen on the left
Global Settings and Options
346
TeleTrader Software GmbH
Marc-Aurel-Straße 10-12, 1010 Vienna, Austria
E-Mail [email protected]
Internet http://professional.teletrader.com
(target of the double-click).
The entry Link that is additionally available for price pages
and watch lists means that when double-clicking a symbol in
the price page / watch list, the symbol will be displayed in
already linked documents (instead of opening a new
document).
Data Info Settings
On the Data Info options sheet, you can change the appearance of the Data Info box. See also Reading Values from
a Chart on page 212.
Control
Description
Background Color
Choose the background color settings for the Data Info box.
Same as Chart
Select to use the background color of the chart pane.
Use this color
Select to choose a custom color as background color.
Transparency
Transparency of the Data Info box background.
Foreground Color
Choose the foreground color (text color) settings for the Data
Info box.
Use symbol header color for symbol name
Check to use the color of the symbol header for the symbol
name displayed in Data Info box.
Same as Chart
Select to use white (color of the chart crosshair) as the text
color.
Use this color
Select to choose a custom color as foreground color.
Show Drawing Tools
Check to show values for drawing objects in the Data Info
box. From the list below, choose the elements (drawing tools)
which should be shown.
Show Time Series
Check to show values for the time series (symbols) in the
Data Info box. From the list below, choose the elements
which should be shown.
Show Studies
Check to show values for studies in the Data Info box.
Show values for hidden objects
Check to also show the values of hidden objects in the Data
Info box.
Use line color in Data Info Window
Check to show all values for studies and drawing objects in
the Data Info box with the same color as the object they refer
to.
Only show "Close" when Line Chart or Stair
Step Chart or Point Chart is selected
Check to show only Close price in the Data Info box when
Line Chart, Stair Step Chart or Point Chart is selected
(instead of displaying Open, High, Low, Close and Volume).
Font and Names Settings
On the Font and Name options sheet, you can change the appearance of the text inside the Data Info box. See also
Reading Values from a Chart on page 212.
Control
Description
Font
Type of font used for the text of the Data Info box.
Font size
Size of the font used for the text.
Use object’s short name
Check to use a shortened version of the names of all drawing
objects in the Data Info box.
Clear to use the full name of all drawing objects in the Data
Global Settings and Options
347
TeleTrader Software GmbH
Marc-Aurel-Straße 10-12, 1010 Vienna, Austria
E-Mail [email protected]
Internet http://professional.teletrader.com
Info box.
Auto Size
Select to automatically shorten the names of all drawing
objects.
Number of character(s)
Select to enter a maximum number of characters that should
be used for the names of all drawing objects (excess
characters are cut).
Time Zone Settings
On the Time Zone options sheet, you can choose which time zone should be used for all time values that are
displayed in charts, price pages, news documents, etc.
Note
Trading sessions for a time series in charts are always defined in exchange time, but displayed
with the time zone settings that you choose here. See also Changing the Amount of Data
Displayed in the Chart on page 217.
Control
Description
Local Time
Select to use the local time of your computer for all time
values.
GMT
Select to use Greenwich Mean Time for all time values.
Exchange Time
Select to use the local time of the exchange for all documents
except news. For news, the local time of your computer is
used.
Custom Time
Select to use a custom time in increments or decrements of
30 minutes from GMT for all time values.
Note
You can also configure this setting by clicking on the time zone section of the status bar and
choosing the time zone. See also Status Bar on page 361.
E-Mail Settings
On the E-Mail Settings options sheet, you can configure the built-in e-mail client with an existing e-mail account. You
can use these settings to send chart pictures, Professional documents, virtual pages, workspaces and alert
notifications from within Professional. Except for alert notifications, you can also use your default e-mail client instead
(see Sending Workspaces, Virtual Pages or Documents via E-Mail on page 169).
The internal e-mail client uses an internal address book. You can export this address book as a file to use it in other
programs. For further information about using the address book, see Using the Internal Address Book on page 170.
Note
You can also open this options sheet by clicking on the e-mail section of the status bar and
choosing Configure mail. See also Status Bar on page 361.
To configure the internal e-mail account
▪
Choose your E-Mail Service Provider from the list on top, or choose User Defined Provider if you do not find
your provider in the list.
▪
Complete the e-mail settings as shown below:
Field
Global Settings and Options
Description
348
TeleTrader Software GmbH
Marc-Aurel-Straße 10-12, 1010 Vienna, Austria
E-Mail [email protected]
Internet http://professional.teletrader.com
Your Name
Enter your name as you want it to show up in the sender
information.
E-mail Address
Enter your full e-mail address.
Outgoing mail Server (SMTP)
Enter the address of the outgoing mail server.
Port
Enter the port of the outgoing mail server (default: 25).
This server requires an encrypted connection
(SSL)
Check to establish the connection to the mail server using an
encrypted connection.
Log on to SMTP server
Check to remember the user name and password and send
new e-mail automatically.
User Name
Enter the user name for your mail account.
Password
Enter the password for your mail account.
Note
If you do not know your SMTP settings, please contact your network administrator or your Internet
Service Provider (ISP). The support team will not know your SMTP settings.
To export the internal e-mail address book
▪
Click Export address book.
▪
In the Export TeleTrader Professional Address Book dialog, enter a name for the export file in the File name
field.
▪
In the Save as type field, choose Comma separated values (*.csv) or Text files (*.txt).
▪
Click Save.
File Locations Settings
On the File Locations options sheet, you can change the default file locations for different files (for example
workspaces or log files).
Warning
It is strongly recommended to keep the pre-defined file locations.
To change a default file location
▪
▪
Select the file location that you want to change and click Modify.
Local Base
Default location for all external data.
Documents
Default location of all saved documents and workspaces. See
also Creating and Saving Documents on page 159.
Templates
Default location of all saved templates. See also Saving your
Preferences in Templates on page 145.
User Data
Default location for all user-specific data, including custom
studies that are saved in the file UserStudies.xml.
Log Files
Default location for all log files. See also Logging Settings on
page 351.
When you change this file location, you will be asked to
restart the application so that the change can take effect.
Virtual Pages
Default location for all virtual pages files. See Opening and
Saving Virtual Pages on page 157.
In the Browse for Folder dialog, choose the new file location and click OK.
Global Settings and Options
349
TeleTrader Software GmbH
Marc-Aurel-Straße 10-12, 1010 Vienna, Austria
E-Mail [email protected]
Internet http://professional.teletrader.com
To change back to the pre-defined file locations
▪
Click Reset to default.
Symbol Search Settings
On the Symbol Search options sheet, you can find settings related to the behavior of symbol search. See also
Symbol Search on page 32.
You can also open the Symbol Search settings by right-clicking in the search results and choosing Properties, or by
clicking Open > Settings in the Symbol Search dialog.
Control
Description
Open Price Page after Toolbar search
Check to open the search results in a price page when
starting a search from the Symbol Search toolbar
Clear to open the search results in the Symbol Search dialog
when starting a search from the toolbar
Open document for single results after
Toolbar search
Check to open a single search result in a specific document
type when starting a search from the Symbol Search toolbar
(This means that you can for example open multiple search
results in a price page – see above setting – , but single
search results in a chart)
Clear to open the search result in the Symbol Search dialog
when starting a search from the toolbar
Close Symbol Search window after opening a
document
Check to close the Symbol Search dialog after opening a
document from it
Smart Symbol Search separator
Customize the Smart Symbol Search separators: See Smart
Symbol Search on page 42
Show Search Term, Exchange, Type and
Field selection
Select to show the fields Search Term, Exchanges, Types
and Fields on the Symbol Search toolbar
Show Search Term and predefined Search
Settings
Select to show the fields Search Term and Search Settings
on the Symbol Search toolbar
Show results using different colors per
security
Check to choose a different color for every symbol type: Click
on the symbol type on the left, and then choose the color for
this symbol type on the right.
Font Settings
On the Font options sheet, you can change the appearance and color of the text inside the Symbol Search results.
See also Symbol Search on page 32.
Control
Description
Font
Type of font used for the text in search results
Font size
Size of the font used for the text in search results
Foreground
Color of the text in search results
Background
Basic background color of the search results – this color is
only used when the Symbol Search setting Show results
using different colors per security is disabled
Bold
Check to apply a bold font to all text in search results
Italic
Check to apply an italic font to all text in search results
Global Settings and Options
350
TeleTrader Software GmbH
Marc-Aurel-Straße 10-12, 1010 Vienna, Austria
E-Mail [email protected]
Internet http://professional.teletrader.com
Grid Settings
On the Grid options sheet, you can change the appearance and color of the grid inside the Symbol Search results.
The grid consists of horizontal and vertical lines that show the borders between rows and columns. See also Symbol
Search on page 32.
Control
Description
Horizontal
Check to display horizontal grid lines between rows
Vertical
Check to display vertical grid lines between columns
Style
Line style of all visible grid lines
Color
Color of all visible grid lines
Logging Settings
On the Logging options sheet, you can adjust the logging level for individual TeleTrader Professional components.
The log files are stored in their default file location: See File Locations Settings on page 349.
Warning
It is strongly recommended to keep the default logging settings.
To adjust the logging level for Professional components
▪
Choose the component that you want to adjust from the Component list.
▪
Adjust the logging settings for this component to your needs:
Setting
Description
Enable logging
Check to enable logging for this component
Level
Choose the logging level for this component
Number of logfiles to keep
Enter the number of old log files that should be kept
New file per day
Select to create a new log file each day
New file when size is reached (KB)
Select to create a new log file as soon as the size of the old
log file exceeds the size set here (in KB)
To use the default logging settings for all levels
▪
Click Reset to default.
Detach Settings
On the Detach options sheet, you can control the behavior of detached windows. Detached or free floating windows
can be positioned on the screen independent of the Professional main window. See also Arranging Document
Windows on the Screen on page 162 and Multi-Monitor Systems on page 171.
Setting
Description
Display Portfolio and OrderBook always
detached
Check to always display the Portfolio and OrderBook
windows as detached windows.
This setting is only used in combination with the trading
integration.
Create all new documents as detached
windows
Check to create all new Professional documents as detached
windows.
Create new Quick Quote documents as
Check to create only new quick quote documents as
Global Settings and Options
351
TeleTrader Software GmbH
Marc-Aurel-Straße 10-12, 1010 Vienna, Austria
E-Mail [email protected]
Internet http://professional.teletrader.com
detached
detached windows.
Show toolbars when creating detached
windows
Check to show all appropriate toolbars in detached document
windows.
Hide Navigation Pane when opening a new
TeleTrader Professional
Check to automatically hide the navigation pane when
creating a new Professional main window.
Updater Settings
On the Updater options sheet, you can change the update interval that Professional uses to automatically check for
updates. See also Updates on page 453.
Control
Description
On each start
Select to check for updates on every start of the program.
Weekly
Select to check for updates every week.
Monthly
Select to check for updates every month.
Every 3 months
Select to check for updates every quarter year.
Shortcuts
Many commands in TeleTrader Professional can also be called up with a keyboard shortcut.
Shortcut
Description
F1
Opens the TeleTrader Professional User Guide.
F2
Shows the ID of a symbol in a price page.
Lets you edit the editable columns of a price page (e.g. column Text).
F3
Shows / hides the ticker.
See Ticker on page 63
F4
Shows / hides the Navigation pane.
F5
Reloads the data in the chart.
F6
Shows / hides the Alerts window.
See Alerts (Notifications) on page 321
F7
Shows / hides the Symbol Search dialog.
See Searching for Securities in the Symbol Search Dialog on page 34
F8
Shows the Change Symbol dialog.
See Changing Symbols on page 73
F9
Opens a new quick quote document.
See Quick Quote on page 63
F10
Closes the active document window.
F11
Shows / hides the Information pane.
See Connection Log in the Information Pane on page 443
F12
Jumps to the next virtual page.
See Switching Between Virtual Pages on page 155
ALT
(while drawing a
trend line)
Moves the line vertically without changing its direction.
See Lines and Trend Channels on page 246
ALT + F1
Places a buy order for the selected symbol (when using the trading integration)
Global Settings and Options
352
TeleTrader Software GmbH
Marc-Aurel-Straße 10-12, 1010 Vienna, Austria
E-Mail [email protected]
Internet http://professional.teletrader.com
ALT + F2
Places a sell order for the selected symbol (when using the trading integration)
ALT + F4
Closes TeleTrader Professional.
SHIFT
(while starting
Professional)
Forces the login dialog before starting TeleTrader Professional.
SHIFT
(while doubleclicking on a chart)
Opens the Chart Properties dialog.
SHIFT
(while drawing a
trend line)
Draws the line at fixed angles of 45°, 90°, 180° etc.
See Lines and Trend Channels on page 246
SHIFT
(while opening an
options matrix)
Forces the Choose Product dialog (if applicable for this underlying).
See Options Matrix on page 59
SHIFT + F4
Tiles document windows horizontally.
See Arranging Document Windows on the Screen on page 162
SHIFT + F5
Cascades document windows.
See Arranging Document Windows on the Screen on page 162
SHIFT + F12
Jumps to the previous virtual page.
See Switching Between Virtual Pages on page 155
CTRL
(while dragging a
drawing object)
Copies a drawing object.
See Moving and Copying Drawing Objects on page 273
CTRL
(while dragging the
Navigation pane)
Prevents docking of the Navigation pane.
See Undocking, Moving and Hiding Panes on page 144
CTRL
(while drawing with
a drawing tool)
Activates the Snap tool temporarily.
See Snapping to the Nearest Price with the Magnet on page 246
CTRL
(while clicking on the
time scale)
Activates the Zoom Out tool.
See Zooming a Section of a Chart on page 204
CTRL
(while opening
several symbols at
once)
Opens each symbol in a separate document (price page, watch list, market depth or time
and sales) or overlays all symbols in one chart pane.
See Opening Symbols from Existing Documents on page 66
CTRL + F6
Cycles through the document windows within a virtual page.
CTRL + F7
Inserts a symbol in a document.
See Inserting Symbols on page 74
CTRL + F8
Overlays a symbol in a chart.
See Inserting, Overlaying and Changing Symbols in a Chart on page 187
CTRL + F9
Exports a symbol from the chart to the local database.
See Using Charts Offline on page 242
CTRL + F12
Jumps to the next empty virtual page.
See Switching Between Virtual Pages on page 155
CTRL + A
Selects all content of a document (for example a price page).
See Selecting Rows or Columns of a Price Page on page 89
CTRL + B
Opens the order book (when using a trading integration)
Global Settings and Options
353
TeleTrader Software GmbH
Marc-Aurel-Straße 10-12, 1010 Vienna, Austria
E-Mail [email protected]
Internet http://professional.teletrader.com
CTRL + C
Copies the highlighted content.
CTRL + D
Detaches / reattaches a document window from the Professional main window.
See Arranging Document Windows on the Screen on page 162
CTRL + E
Opens the properties dialog for a document.
See Customizing Documents, Pop-up Windows and Panes on page 78
CTRL + F
Searches for a word in a news story or in news headlines.
See Searching for Keywords in News on page 108
CTRL + G
Used from a chart document: Saves the current chart as picture file.
See Saving Charts as Picture Files on page 241
Used from a price page document: Inserts the VWAP columns.
See Adding, Removing and Customizing the VWAP Columns on page 98
CTRL + H
Opens the transaction history (when using a trading integration)
CTRL + K
Inserts a study alert.
See Study Alerts on page 328
CTRL + L
Used from a chart document: Inserts an intersection alert.
See Intersection Alerts on page 326
Used from a price page document: Inserts a price alert.
See Price Alerts on page 321
Used from a news document: Inserts a news alert
See News Alerts on page 325
CTRL + N
Creates a new empty document.
See Opening Symbols in New Documents on page 64
CTRL + O
Opens a workspace.
See Opening Saved Workspaces on page 152
CTRL + P
Prints the current document.
See Printing Documents on page 163
CTRL + R
Inserts an empty row in a price page.
See Rearranging and Resizing Rows and Columns on page 81
CTRL + S
Saves the current workspace.
See Creating and Saving Workspaces on page 150
CTRL + T
Opens the Insert Study dialog.
See Inserting Studies on page 300
CTRL + V
Pastes content from the clipboard.
CTRL + W
Shows / hides the document window captions.
See Changing the Document Window Captions on page 162
CTRL + X
Cuts the highlighted content.
CTRL + Y
Saves all charts as picture files or chart documents.
See Saving Settings on page 343
CTRL + [NUMBER]
Switches to the virtual page with the chosen number.
See Switching Between Virtual Pages on page 155
CTRL +
Closes all document window on the current virtual page.
See Closing Documents on page 164
CTRL + SHIFT
(while opening
several symbols in a
chart)
Opens every symbol in a separate chart pane.
See Opening Symbols from Existing Documents on page 66
CTRL + SHIFT + N
Opens the New Document list in the Main toolbar.
Global Settings and Options
354
TeleTrader Software GmbH
Marc-Aurel-Straße 10-12, 1010 Vienna, Austria
E-Mail [email protected]
Internet http://professional.teletrader.com
See Opening Symbols in New Documents on page 64
CTRL + SHIFT + S
Highlights the first symbol in the chart.
CTRL + SHIFT + F9
Exports a symbol from the chart to a text file.
See Using Charts Offline on page 242
CTRL + ALT + B
Opens the Format Objects dialog.
See Customizing Chart Objects on page 233
CTRL + ALT + C
Copies a document window.
See Arranging Document Windows on the Screen on page 162
CTRL + ALT + F
Opens the Navigation pane properties dialog.
See Customizing the Navigation Pane on page 140
CTRL + ALT + S
Opens the Trading Settings dialog.
See Changing the Trading Settings on page 433
CTRL + ALT + W
Opens the Windows dialog with which you can activate or close document windows.
See Arranging Document Windows on the Screen on page 162
CTRL + ALT + X
Cuts the data history of a chart.
See Changing the Amount of Data Displayed in the Chart on page 217
CTRL + ALT + Z
Sets a starting point for charts with a percentage scale.
See Changing the Type of the Price Scale on page 185
ALT + SHIFT + B
Moves a drawing object to the background.
See Moving and Copying Drawing Objects on page 273
ALT + SHIFT + D
Deletes all drawing objects of a chart.
See Deleting Drawing Objects on page 297
ALT + SHIFT + F
Moves a drawing object to the foreground.
See Moving and Copying Drawing Objects on page 273
ALT + SHIFT + M
Opens the Edit bookmark dialog.
See Setting, Moving and Editing Bookmarks on page 208
INS
Expands the time series (same as + PLUS key).
See Scaling the Time Series to the Screen on page 206
DEL
(when no chart
object is selected)
Compresses the time series (same as – MINUS key).
See Scaling the Time Series to the Screen on page 206
DEL
(when a chart object
or row is selected)
Deletes the selected row or the selected chart object.
ESC
Stops the download of data in the current chart.
HOME
(in news documents)
Removes search term from keyword search, and resets the news document.
See Quick Keyword Search in News on page 110
HOME
(in charts)
Resets the chart to its default settings (for example zooming, scaling and margins) and
jumps to the beginning (newest data) of the chart.
END
(in charts)
Jumps to the end (oldest data) of a chart (without resetting the chart).
PAGE UP / DOWN
Browses page by page through long documents (price pages, news stories, charts etc.).
In charts, the time series will be moved horizontally by default – to reverse this, deactivate
the option Use Page Up and Page Down keys for scrolling the chart horizontally
under Tools > Options > Charts (see Chart Settings on page 340).
CTRL + PAGE UP /
DOWN
In charts, moves the time series vertically by default – to reverse this, deactivate the
option Use Page Up and Page Down keys for scrolling the chart horizontally under
Tools > Options > Charts (see Chart Settings on page 340).
Global Settings and Options
355
TeleTrader Software GmbH
Marc-Aurel-Straße 10-12, 1010 Vienna, Austria
E-Mail [email protected]
Internet http://professional.teletrader.com
LEFT / RIGHT
(arrow keys in
charts)
In normal chart mode: Moves the time series in charts left and right bar by bar.
When the Crosshair or Vertical Line tools are active: Moves the vertical line on the chart
left and right.
When the option Use arrow keys (Left or Right) for activating the Vertical Line under
Tools > Options > Chart is activated: On first keystroke, activates the Vertical Line tool
and positions the line at the left or right edge of the visible chart area. As soon as the
Vertical Line tool is active, each keystroke moves the vertical line left and right.
UP / DOWN
(arrow keys in
charts)
In normal charts (not linked to another document): Changes the vertical scaling of the
chart (compress and expand).
When the Crosshair tool is active: Moves the horizontal line on the chart up and down.
In linked charts: Navigates through the linked list of symbols. This behavior can be
deactivated with the option Use arrow keys (Up and Down) for navigating through
linked charts under Tools > Options > Chart. You can then use CTRL + UP / DOWN
instead to navigate through linked symbols.
CTRL + UP / DOWN
(in linked charts)
Changes the vertical scaling of the chart (compress and expand). This allows you to use
this feature also in linked charts, where UP and DOWN keys are normally used for browsing
the linked list of symbols (see above).
If you deactivate the option Use arrow keys (Up and Down) for navigating through
linked charts under Tools > Options > Chart, this shortcut will instead navigate through
the linked list of symbols.
+ (PLUS)
Expands the time series (same as INS key).
See Scaling the Time Series to the Screen on page 206
- (MINUS)
Compresses the time series (same as DEL key).
See Scaling the Time Series to the Screen on page 206
Toolbars
TeleTrader Professional offers several toolbars for quicker access to important commands.
To hide or show a toolbar
▪
In the View menu, choose Toolbars.
▪
Select the name of the toolbar that you want to show or hide. Visible toolbars are shown with a check mark.
Note
Alternatively, right-click on any toolbar and select all toolbars that should be visible.
Main toolbar
Icon
Name
Description
New Document
Creates a new empty document.
See Opening Symbols in New Documents on page 64
Open
Opens a saved document.
See Opening Saved Documents on page 159
Save
Saves the current document.
See Creating and Saving Documents on page 159
Save as Template
Saves the current settings of a document in a template.
See Saving your Preferences in Templates on page 145
Global Settings and Options
356
TeleTrader Software GmbH
Marc-Aurel-Straße 10-12, 1010 Vienna, Austria
E-Mail [email protected]
Internet http://professional.teletrader.com
Cut
Cuts the highlighted content.
Copy
Copies the highlighted content.
Paste
Pastes content from the clipboard.
Print
Prints the current document.
See Printing Documents on page 163
Print Preview
Shows a preview of the current document before printing.
See Printing Documents on page 163
Properties
Opens the properties dialog for a document.
See Customizing Documents, Pop-up Windows and Panes on page 78
News toolbar
Icon
Name
Description
Last Story Received
Jumps to the latest news story.
See Showing and Hiding News Headlines and Stories on page 106
Previous Story
Jumps to the previous news story.
See Showing and Hiding News Headlines and Stories on page 106
Next Story
Jumps to the next news story.
See Showing and Hiding News Headlines and Stories on page 106
Find
Searches for a word in a news story or in news headlines.
See Searching for Keywords in News on page 108
Headlines Only
Shows only the news headlines.
See Showing and Hiding News Headlines and Stories on page 106
Headlines and Story
Shows both news headlines and stories.
See Showing and Hiding News Headlines and Stories on page 106
Story Only
Shows only the news story.
See Showing and Hiding News Headlines and Stories on page 106
Display Source
Shows / hides the Services column of a headline.
See Changing Font, Colors and Headline Data of News on page 107
Display Date
Shows / hides the Date column of a headline.
See Changing Font, Colors and Headline Data of News on page 107
Display Time
Shows / hides the Time column of a headline.
See Changing Font, Colors and Headline Data of News on page 107
Display Key
Shows / hides the Story no. column of a headline.
See Changing Font, Colors and Headline Data of News on page 107
Clear news search
Removes search term from keyword search, and resets the news document.
See Quick Keyword Search in News on page 110
Chart toolbar
Icon
Name
Description
Zoom In
Zooms into a section of a chart.
Global Settings and Options
357
TeleTrader Software GmbH
Marc-Aurel-Straße 10-12, 1010 Vienna, Austria
E-Mail [email protected]
Internet http://professional.teletrader.com
See Zooming a Section of a Chart on page 204
Zoom Out
Zooms out of a chart.
See Zooming a Section of a Chart on page 204
Compress
Compresses the time series.
See Scaling the Time Series to the Screen on page 206
Expand
Expands the time series.
See Scaling the Time Series to the Screen on page 206
Adjust Screen Mode
Scales the time series to the screen vertically.
See Scaling the Time Series to the Screen on page 206
Show All Data
Shows the entire data series on the screen.
See Scaling the Time Series to the Screen on page 206
Reload
Reloads the data in the chart.
Tick by Tick
Changes to a tick by tick compression.
See Changing the Data Compression on page 175
TickBar
Changes to a TickBar compression.
See Changing the Data Compression on page 175
Intraday
Changes to an intraday compression.
See Changing the Data Compression on page 175
Daily
Changes to a daily compression.
See Changing the Data Compression on page 175
Weekly
Changes to a weekly compression.
See Changing the Data Compression on page 175
Monthly
Changes to a monthly compression.
See Changing the Data Compression on page 175
Time Region
Changes the time region of the chart.
See Changing the Amount of Data Displayed in the Chart on page
217
Chart Types
Changes the current chart type.
See Changing the Chart Type on page 176
Chart Scales
Changes the type of the vertical price scale.
See Changing the Type of the Price Scale on page 185
Chart Objects
Opens the Format Objects dialog.
See Customizing Chart Objects on page 233
Insert Study
Opens the Insert Study dialog.
See Inserting Studies on page 300
Global Settings and Options
358
TeleTrader Software GmbH
Marc-Aurel-Straße 10-12, 1010 Vienna, Austria
E-Mail [email protected]
Internet http://professional.teletrader.com
Drawing toolbar
Icon
Name
Description
Select
Selects chart objects on click. Displays the Data Info box while clicking.
See Reading Values from a Chart on page 212
Crosshair
Keeps values visible in the Data Info box on click (shows crosshair on
chart).
See Reading Values from a Chart on page 212
Vertical Line
Keeps values visible in the Data Info box on click (shows vertical line on
chart).
See Reading Values from a Chart on page 212
Free Hand
Moves the time series on the screen (drag and drop).
See Scaling the Time Series to the Screen on page 206 and Extending
the Time Line to the Future on page 224
Snap
Positions the reference point of a drawing tool at the nearest price
(magnet).
See Snapping to the Nearest Price with the Magnet on page 246
Free Line
Draws a trend line or free line.
See Lines and Trend Channels on page 246
Trend Channel
Draws a trend channel.
See Lines and Trend Channels on page 246
Horizontal Line
Draws a horizontal line (support / resistance line).
See Lines and Trend Channels on page 246
Regression Line
Draws a regression line.
See Regression Lines and Regression Channels on page 251
Regression Channel
Draws a regression channel.
See Regression Lines and Regression Channels on page 251
Rectangle
Draws a rectangle.
See Shapes on page 252
Ellipse
Draws an ellipse.
See Shapes on page 252
Fibonacci Fan
Draws a Fibonacci Fan.
See Fibonacci Fans on page 252
Fibonacci Trend Line
Draws Fibonacci Trend Line.
See Fibonacci Trend Line on page 253
Fibonacci Retracements
Draws Fibonacci Retracements.
See Fibonacci Retracements and Expansions on page 254
Fibonacci Expansions
Draws Fibonacci Expansions.
See Fibonacci Retracements and Expansions on page 254
Fibonacci Arc
Draws Fibonacci Arcs.
See Fibonacci Arcs on page 256
Speed Resistance Line
Draws Speed Resistance Lines.
See Speed Resistance Lines on page 257
Gann Fan
Draws a Gann Fan.
See Gann Fans on page 259
Andrews Pitchfork
Draws an Andrews Pitchfork.
Global Settings and Options
359
TeleTrader Software GmbH
Marc-Aurel-Straße 10-12, 1010 Vienna, Austria
E-Mail [email protected]
Internet http://professional.teletrader.com
See Andrews Pitchfork on page 262
Wave and Harmonics
Draws waves or Harmonic Patterns.
See Wave and Harmonics on page 264.
Pivot Points
Inserts Pivot Points.
See Pivot Points on page 260
Text
Adds text.
See Text on page 267
Vertical Lines
Draws vertical lines.
See Vertical, Fibonacci and Cycle Lines on page 267
Fibonacci Vertical Lines
Draws Fibonacci vertical lines.
See Vertical, Fibonacci and Cycle Lines on page 267
Cycle Lines
Draws cycle lines.
See Vertical, Fibonacci and Cycle Lines on page 267
Price Change
Draws a price change object.
See Price Change on page 269
Data Cut
Cuts the data history of a chart.
See Changing the Amount of Data Displayed in the Chart on page 217
Set vertical scale zero
point
Sets a starting point for charts with a percentage scale.
See Changing the Type of the Price Scale on page 185
Arrow Up
Draws an upwards arrow.
See Arrows on page 270
Arrow Down
Draws a downwards arrow.
See Arrows on page 270
Next Line Style
Switches to the next line style for a chart object.
See Changing the Title, Color and Line Style on page 272
Color
Selects a new color for a chart object.
See Changing the Title, Color and Line Style on page 272
To Foreground
Moves a drawing object to the foreground.
See Moving and Copying Drawing Objects on page 273
To Background
Moves a drawing object to the background.
See Moving and Copying Drawing Objects on page 273
Delete All
Deletes all drawing objects of a chart.
See Deleting Drawing Objects on page 297
Workspace toolbar
Icon
Name
Description
Open Workspace
Opens a workspace.
See Opening Saved Workspaces on page 152
Save Workspace
Saves the current workspace.
See Creating and Saving Workspaces on page 150
Close Workspace
Closes the current workspace.
See Closing Workspaces on page 152
Virtual Page by Virtual
Page
Switches to another virtual page.
See Switching Between Virtual Pages on page 155
Global Settings and Options
360
TeleTrader Software GmbH
Marc-Aurel-Straße 10-12, 1010 Vienna, Austria
E-Mail [email protected]
Internet http://professional.teletrader.com
Symbol Search toolbar
See Searching for Securities from the Toolbar on page 33.
Status Bar
The status bar shows different information about the current state of TeleTrader Professional, for example its
connection status, the current number of subscribed symbols, the name of the active virtual page etc.
To hide or show the status bar
▪
On the View menu, choose Status Bar.
Elements of the status bar
Toolbar Status
On the left side of the status bar, a short description of a
toolbar command is shown when the mouse pointer is
moved over the corresponding toolbar icon.
Remaining Data
When the active document shows an intraday or tickbar
chart, the number of minutes or ticks that remain until
the current bar is completed is shown here. This
information is also shown in the chart header of the
respective chart.
Subscribed
Symbols
The number of symbols that you are subscribed to at the
moment is shown here. Only subscribed symbols are
automatically updated in your documents when new
ticks arrive.
The number will turn red when you have exceeded the
maximum number of subscribed symbols. It then shows
the maximum number allowed, and in brackets the
number of additional symbols that were automatically
unsubscribed.
Double-click on the number to directly access the
options sheet Subscription. There you can see which
symbols you are subscribed to and unsubscribe
symbols if necessary. See Subscription Settings on
page 339.
Connection Status
The current connection status between TeleTrader
Professional and the Market Data Server is shown here.
Right-click the icon to disconnect, reconnect or change
the settings for automatic reconnection. See Monitoring
the Connection on the Status Bar on page 441.
Virtual Page
The name of the active virtual page is shown here.
Click here to switch to a different virtual page. See also
Switching Between Virtual Pages on page 155.
Time Zone
The current time zone is shown here. The time zone is
used for all time values that are displayed in charts,
price pages, news documents etc.
Click on the current time zone to change the time zone
setting. See also Time Zone Settings on page 348.
Global Settings and Options
361
TeleTrader Software GmbH
Marc-Aurel-Straße 10-12, 1010 Vienna, Austria
E-Mail [email protected]
Internet http://professional.teletrader.com
E-Mail Status
Global Settings and Options
The current status of the internal e-mail client is shown
here.
Click here to configure the e-mail settings or to view or
clear the log files. See also E-Mail Settings on page 348
and Sending Workspaces, Virtual Pages or Documents
via E-Mail on page 169.
362
TeleTrader Software GmbH
Marc-Aurel-Straße 10-12, 1010 Vienna, Austria
E-Mail [email protected]
Internet http://professional.teletrader.com
Importing and Exporting Security Data
You can display live, updating quote data or historical data from TeleTrader Professional in Excel or Open Office
spreadsheets, using the DDE protocol (Dynamic Data Exchange) or RTD (Real-Time Data; only for Microsoft Excel).
To do this, you can simply use a Copy command in TeleTrader Professional, or use a flexible syntax to request
different data sets. DDE and RTD offer similar functionality: To help you decide which one to use, see below.
If you want to access data from other data feeds in TeleTrader Professional, you can use the Security Data Wizard
to import external security data in Metastock or ASCII format to your local database, and use it in Professional charts.
If you have a list of ISINs or other symbol identifiers that you want to open as a price page in TeleTrader Professional,
you have the possibility to import security lists from text files (must be used together with the RTD Lookup command
to transform ISINs, WKNs, tickers or names to internal symbol IDs).
You can also copy the content of most documents as text and insert it into other programs.
DDE vs. RTD for Microsoft Excel
When displaying data in Microsoft Excel, you can choose between DDE (Dynamic Data Exchange) or RTD (RealTime Data). Both offer similar functionalities. The main differences between TeleTrader Professional DDE and
TeleTrader Professional RTD are:
▫
Speed: RTD is a newer technology than DDE and was specifically designed for live data scenarios. On the other
hand, DDE can handle arrays of data, while RTD uses single connections for every cell. In most cases, RTD
should perform better, but when using a lot of arrays, DDE might be the better choice.
▫
Cell references: RTD uses an Excel function syntax and can therefore also use cell references as part of the
formula. This is not possible with DDE, as it uses a different function format than other standard Excel functions.
▫
Functionality: RTD offers more functionality than DDE, for example the possibility to search for symbols from
within an Excel spreadsheet and to set a custom time zone.
▫
Syntax hints: When creating links manually, Professional RTD offers hints when minor syntax errors are detected
(for example using the wrong date format).
▫
Studies: Copying Price Page studies into Microsoft Excel is only supported by Professional RTD.
Importing and Exporting Security Data
363
TeleTrader Software GmbH
Marc-Aurel-Straße 10-12, 1010 Vienna, Austria
E-Mail [email protected]
Internet http://professional.teletrader.com
RTD – Retrieving Real-Time Data with Excel
You can display live, updating quote data or historical data in Microsoft Excel using the software TeleTrader
Professional RTD. RTD (Real-Time Data) is a technology that was specifically designed for live data scenarios. It
uses the built-in RTD formulas of Microsoft Excel, which means that you can use cell references etc. as placeholders
in your spreadsheets like with any other Excel formula.
With TeleTrader Professional RTD, you can include the current quotes of several symbols in your spreadsheets, or
retrieve historical data and display it in a table. The necessary RTD formulas can be created by copying live, updating
quote data from TeleTrader Professional to Microsoft Excel. The syntax for RTD links gives you great flexibility in
formulating your own requests.
Note
For some examples of how to use TeleTrader Professional RTD, a sample Excel sheet is included
in the installation: Right-click the RTD tray icon and choose Help > Samples to open it. See also
Samples for the RTD Component on page 403.
Automatically started on opening your Excel spreadsheet
TeleTrader Professional RTD is started automatically in the background as needed. You can stop the connection
manually when you don't need it anymore. If you have not installed TeleTrader Professional yet, you have to
download and install it on your computer first.
Learn more:
System Requirements for the RTD Component on page 382
Downloading and Installing the RTD Component on page 383
Starting and Stopping the RTD Connection on page 384
Choosing the Time Zone for the RTD Component on page 388
Copy RTD links from
You can use the Copy command from a price page, watch list, market depth, options matrix, quick quote or time and
sales document to copy live, updating quote data to Microsoft Excel. The RTD links can then be inserted into a
Microsoft Excel Table with the function Insert or with the key combination CTRL + V.
In order to use RTD when copying data from TeleTrader Professional documents to your spreadsheet software, you
have to set the DDE/RTD format under Tools > Options > Price Page to Microsoft Office RTD (see Price Page
Settings on page 344).
Learn more:
Importing and Exporting Security Data
364
TeleTrader Software GmbH
Marc-Aurel-Straße 10-12, 1010 Vienna, Austria
E-Mail [email protected]
Internet http://professional.teletrader.com
Setting up an RTD Link with Live Data on page 388
Retrieve live, updating quote data, market depth and fundamental data
With live RTD links, you can retrieve a wide variety of data fields for a security, ranging from live, updating quote data
to live market depth data and fundamental data (including company information and balance sheet data).
=RTD("ProfRTD";;"Live";"{949843},Last")
Learn more:
Setting up an RTD Link with Live Data on page 388
Tips and Examples for Retrieving Live Data on page 392
Retrieve historical data, intraday and tick data
You can also display historical data for a security. Choose the time region that should be covered and the data
compression / period, which can range from raw / tick-by-tick data over intraday bars to daily, weekly and monthly
data.
=RTD("ProfRTD";;"History";"{829802},Daily, PCLOSE, E=23092008";1)
Learn more:
Setting up an RTD Link with Historical Data on page 393
Tips and Examples for Retrieving Historical Data on page 396
Search for symbol IDs using ISIN, WKN, ticker or name of the symbol
You can search for symbol IDs that are needed in other RTD formulas by using the symbol's ISIN, WKN, ticker or
name. Additional search options like exchange name, currency, strike price and expiration date are also available.
The search result will be shown with its symbol ID, allowing the user to reference the ID in other RTD requests (cell
references).
=RTD("ProfRTD";;"Lookup";"074305, Vienna")
Learn more:
Searching for Symbols with RTD on page 397
Tips and Examples for Looking Up Symbols on page 398
Alternative to using TeleTrader Professional RTD
The alternative to using RTD is the older DDE protocol (Dynamic Data Exchange). As RTD is a newer technology
than DDE, RTD performs better in most cases. RTD also uses standard Excel syntax, which means that you can use
cell references in RTD formulas to make them re-usable across your spreadsheet.
For information about using Microsoft Office DDE, see DDE – Dynamic Data Exchange with Excel / Open Office on
page 366.
Importing and Exporting Security Data
365
TeleTrader Software GmbH
Marc-Aurel-Straße 10-12, 1010 Vienna, Austria
E-Mail [email protected]
Internet http://professional.teletrader.com
DDE – Dynamic Data Exchange with Excel / Open Office
Dynamic Data Exchange (DDE) is a protocol that allows different programs to exchange data. With TeleTrader
Professional, you can use it to display live, updating quote date or historical quotes in your spreadsheet software, for
example in Microsoft Excel. Open Office is also supported.
You can include the current quotes of several symbols in your spreadsheets, much like in a price page. Additionally,
you can also retrieve historical data and display it in a table. The syntax of the DDE links gives you great flexibility in
formulating your own requests.
To retrieve and update the quote data in your spreadsheets, a separate program, TeleTrader Professional DDE, is
used to communicate with the TeleTrader Market Data Server. This program is included with TeleTrader Professional,
and started automatically in the background as needed.
In order to use DDE when copying data from TeleTrader Professional documents to your spreadsheet software, you
have to set the DDE/RTD format under Tools > Options > Price Page to Microsoft Office DDE or OpenOffice.org
DDE (see Price Page Settings on page 344).
For information about using Microsoft Office RTD, see RTD – Retrieving Real-Time Data with Excel on page 364.
Starting and Stopping the DDE Connection
To retrieve and update the quote data that you include in your spreadsheets, a separate program is needed that
communicates between the TeleTrader Market Data Server and your spreadsheet application. This program is called
TeleTrader Professional DDE. It is automatically included with TeleTrader Professional.
You can see if the DDE connection is active in your Windows system tray:
When you set up a DDE link in your spreadsheet software (like described in the sections Setting up a DDE Link with
Live Data on page 368 and Setting up a DDE Link with Historical Data on page 370), or open a spreadsheet that
contains DDE links, TeleTrader Professional DDE is started automatically. However, you can also manually start the
DDE connection.
The DDE connection stays active even if you close TeleTrader Professional or the spreadsheet that contains the DDE
links. You can stop the connection manually if you don’t need it anymore.
Note
TeleTrader Professional DDE creates a separate connection to the TeleTrader Market
Data Server. Therefore, firewalls have to be set up to allow traffic for TeleTrader Professional DDE
(ProfDDE.exe) on either port 80 or 2088 (TCP).
To start the DDE connection manually
▪
Click on the Windows Start button, and then select All Programs > TeleTrader Professional > TeleTrader
Professional DDE Server.
Importing and Exporting Security Data
366
TeleTrader Software GmbH
Marc-Aurel-Straße 10-12, 1010 Vienna, Austria
E-Mail [email protected]
Internet http://professional.teletrader.com
To stop the DDE connection manually
▪
In the Windows system tray, right-click the Professional DDE icon:
▪
Select Exit.
Possible issues in Microsoft Excel
TeleTrader Professional DDE always delivers all ticks to Microsoft Excel. However, in some cases, Excel will not
supply all ticks via the DDE link.
If you want to copy the content of calculated watch list columns like Total P/L or P/L Perc to Excel, you have to
change the formula options in the Excel Options dialog to use a different reference style. Click Formulas, and under
Working with formulas select the option R1C1 reference style.
In some cases, the calculated values of watch lists are not rounded correctly, resulting in displayed numbers like for
example 1.78E-15. In this case, you have to highlight the affected cells in Excel. Then, right-click on the selection and
click Format Cells. Choose Number and the amount of decimal places that you want to show. The calculated values
should then be rounded according to your settings.
Microsoft Excel 2007 security settings
Microsoft Excel 2007 has very tight security settings. Sometimes, when you open a saved spreadsheet with DDE
links, the data is not being updated even though TeleTrader Professional DDE is running and visible in the system
tray.
If this is the case, you can try to change the security settings in the Excel Options dialog. Click Trust Center, and
then click the button Trust Center Settings. Change the settings under External Content to your needs.
Copying Live Quote Data to Microsoft Excel with DDE
You can copy live, updating quote data from a price page, watch list, market depth, options matrix, quick quote or
time and sales document to Microsoft Excel. The easiest and most comfortable way to do this is to use the Copy
command in TeleTrader Professional. In addition, you can also set up a DDE link with live data manually (see Setting
up a DDE Link with Live Data on page 368).
Note
The following steps describe how to set up a DDE connection in Microsoft Excel. You can also use
Open Office instead: To do so, you have to adapt the DDE/RTD format in the program options (see
Price Page Settings on page 344).
To copy live, updating quote data to Microsoft Excel
▪
Open a price page, watch list, market depth, options matrix, quick quote or time and sales document in
TeleTrader Professional that shows the data that you want to copy. See also Opening Symbols on page 63 and
Adding and Removing Columns on page 80.
▪
Select all cells that you want to copy to Microsoft Excel. You can highlight them with the mouse, or select
complete rows or columns (see also Selecting Rows or Columns of a Price Page on page 89).
▪
Right-click on the selected cells and choose Copy.
Note
When you want to copy data from a market depth document, right-click in the summary view of the
market depth document and choose Copy to copy all data.
▪
Open a Microsoft Excel spreadsheet.
▪
Paste the data that you have copied into Excel. For example, you can use the shortcut CTRL + V.
Importing and Exporting Security Data
367
TeleTrader Software GmbH
Marc-Aurel-Straße 10-12, 1010 Vienna, Austria
E-Mail [email protected]
Internet http://professional.teletrader.com
▪
Microsoft Excel will now probably display a message to inform you that to display the data, an external program
called ProfDDE.exe needs to be started. Confirm this message by clicking Yes.
▪
The data that you have copied will now be displayed in the Excel spreadsheet. It will be updated whenever new
ticks arrive.
Note
By default, the column headings of the price page are copied along as well. You can disable this
setting under Tools > Options > Price Page (see Price Page Settings on page 344).
Setting up a DDE Link with Live Data
The following examples show you how to set up DDE links with live data in Microsoft Excel or Open Office. However,
in most cases it is easier to simply use the Copy command from your Professional document to create a live DDE link
(see Copying Live Quote Data to Microsoft Excel on page 367). We recommend to use the Copy command for live
quote data – this will create a separate DDE connection for every cell, which means that you can copy and paste the
content more easily inside your spreadsheet.
If you want to use historical data in your spreadsheet, or a combination of historical and current data (for example, the
last 10 ticks of a symbol), you have to use another type of DDE link: See Setting up a DDE Link with Historical Data
on page 370.
To request live quote data manually in Microsoft Excel (single data field)
▪
Open a Microsoft Excel spreadsheet.
▪
In the cell where you want the data field to appear, type (or copy) the following formula:
=ProfDDE|Live!'AAPL_0FSPC,Last'
▪
The requested data will appear in the Microsoft Excel cell. The request above will for example fetch the Last price
of the Apple stock.
To request live quote data manually in Microsoft Excel (multiple data fields)
▪
Open a Microsoft Excel spreadsheet.
▪
Highlight an area in the Excel spreadsheet that is big enough to hold the data fields that you want to request. For
the following example, highlight an area that is eight columns wide and one row high.
▪
Click into the formula bar in Microsoft Excel and type (or copy) the following formula:
=ProfDDE|Live!'{458917},Name,Last,PercChg,Change,VolLast,Volume,D
ate,Time'
▪
Press the keys CTRL + SHIFT + ENTER to insert the quote data as an array into the selected area.
Note
▪
The formula should now be surrounded with braces { } in the Excel formula bar to show that it has
been inserted as an array formula. You can only edit the array in whole, not single cells that are
part of it. To find more information about Excel arrays, please consult the documentation for
Microsoft Excel.
The requested data will appear in the highlighted area in Microsoft Excel. The request above will for example
fetch live data for multiple fields of the Deutsche Post stock.
Importing and Exporting Security Data
368
TeleTrader Software GmbH
Marc-Aurel-Straße 10-12, 1010 Vienna, Austria
E-Mail [email protected]
Internet http://professional.teletrader.com
Syntax for DDE links to live quote data
In your spreadsheet software, certain formulas are used to create the DDE links. If you use the Copy command, all
DDE links are created automatically for you. If you set up the links manually, you have to use the following syntax to
request live quote data:
=ProfDDE|Live!'<Symbol>,<Field1>[,<Field2>,...]'
Note
In this user guide, the syntax for Microsoft Excel is used for all examples. In Open Office, the
syntax needs to be changed as follows:
=DDE("PROFDDE";"Live";"<Symbol>,<Field1>[,<Field2>,...]")
Symbol
Internal identification of the symbol. You can either use the symbol identification number (for
example {829802} ) or its unique name (for example MSFT_0FSPC). To find out the
identification of a symbol, click in the row of the symbol in a price page and press F2.
Identification number and unique name can also be displayed in the price page columns TID
and TUN or in the Chart Properties dialog for a symbol.
Field(s)
Name of the data field(s) that should be retrieved. The name is equal to the heading of the
corresponding column in the Professional price page.
If you want to retrieve more than one data field, separate the field names with a comma. You
have to use the array command (CTRL + SHIFT + ENTER) after typing the formula in your
spreadsheet to retrieve multiple data fields at once. See Available Field Names on page 405.
Market Depth
Fields
For market depth data, the following fields can be used – the number in square brackets
signifies the depth level, starting with 0:
MDBidSize[depth_level]
For example, MDBidSize[2] for the third depth level
MDBidCount[depth_level]
MDBid[depth_level]
MDAsk[depth_level]
MDAskCount[depth_level]
MDAskSize[depth_level]
Note
VWAP Fields
It is not possible to display market depth data from NASDAQ via DDE.
When retrieving data from a calculated VWAP column (see Adding, Removing and
Customizing the VWAP Columns on page 98 for details), the following data field syntax is
used:
VWAP(Type,DateTimeF,DateTimeT,VolF,VolT,PriceF,PriceT)[OutputName]
Type
Time period used for VWAP calculations: This can be D (Daily), LH (Last
Hour), C (Custom), N (None) or F (Freeze).
DateTimeF/T
Begin and end date and time of a custom time period (C) in ISO format
YYYY-MM-DDThh:mm:ss
VolF/T
Lower and upper boundaries for the volume range (optional)
PriceF/T
Lower and upper boundaries for the price range (optional)
OutputName
Defines the VWAP value that should be returned: Price, StdDev,
TotalVol, AvgVol, NumTicks, DateF, DateT, TimeF, TimeT, VolF,
VolT, PriceF, PriceT
Examples for retrieving VWAP data:
=ProfDDE|Live!'{459237},VWAP(LH)[StdDev]'
=ProfDDE|Live!'{458757},VWAP(C,2010-04-08T22:00:00,2010-04-
Importing and Exporting Security Data
369
TeleTrader Software GmbH
Marc-Aurel-Straße 10-12, 1010 Vienna, Austria
E-Mail [email protected]
Internet http://professional.teletrader.com
09T10:00:00,0,100000,40.00,45.00)[Price]'
Setting up a DDE Link with Historical Data
You can request historical quote data in your spreadsheet software from the TeleTrader Market Data Server. To do
so, you must use a special formula syntax to tell TeleTrader Professional DDE what data you want to fetch.
To request only a single data field (for example, the Close price at a specific date), you can use the normal formula
functions of your spreadsheet software. To request multiple data fields or records (for example, the dates and Close
prices for a certain period of time), you have to use an array formula. With array formulas you can populate many
data fields with one single command. Probably you will use array formulas most of the time.
Note
The following examples describe how to set up a DDE connection in Microsoft Excel. You can also
use Open Office instead. Syntax differences are explained below.
To request historical quote data in Microsoft Excel (single data field)
▪
Open a Microsoft Excel spreadsheet.
▪
In the cell where you want the data field to appear, type (or copy) the following formula:
=ProfDDE|History!'{829802} ,DAILY,PCLOSE,S=23092008,E=23092008'
▪
The requested data will appear in the Microsoft Excel cell. The request above will for example fetch the Close
rd
price of the Microsoft stock on September 23 , 2008.
To request historical quote data in Microsoft Excel (multiple data fields)
▪
Open a Microsoft Excel spreadsheet.
▪
Highlight an area in the Excel spreadsheet that is big enough to hold the data fields that you want to request. For
the following example, highlight an area that is six columns wide and eight rows high.
▪
Click into the formula bar in Microsoft Excel and type (or copy) the following formula:
=ProfDDE|History!'{829802}
,MIN3,DATE,TIME,OPEN,HIGH,LOW,PCLOSE,N=8,R'
▪
Press the keys CTRL + SHIFT + ENTER to insert the quote data as an array into the selected area.
Note
▪
The formula should now be surrounded with braces { } in the Excel formula bar to show that it has
been inserted as an array formula. You can only edit the array in whole, not single cells that are
part of it. To find more information about Excel arrays, please consult the documentation for
Microsoft Excel.
The requested data will appear in the highlighted area in Microsoft Excel. The request above will for example
fetch the fields Date, Time, Open, High, Low and Close of the Microsoft stock for the last eight ticks in a 3-minute
compression.
To request historical quote data in Microsoft Excel (multiple data fields) using
Excel Add-in
Besides manually generating DDE links, you can also generate DDE links for retrieving the historical data using
TeleTrader Professional Add-in for Excel.
▪
Open a Microsoft Excel spreadsheet.
Importing and Exporting Security Data
370
TeleTrader Software GmbH
Marc-Aurel-Straße 10-12, 1010 Vienna, Austria
E-Mail [email protected]
Internet http://professional.teletrader.com
▪
Click the TeleTrader Professional ribbon in the Excel toolbar.
▪
Click the DDE Server toolbar button and then the Show button.
▪
In the Formula Generator pane define: Symbol name, Interval, Time Series and Quote Elements.
▪
Select one cell in the Excel spreadsheet and click the Insert button.
▪
Data will be displayed as an array to the right and down starting from the selected cell in the Excel spreadsheet.
Defines the symbol identification number (for example {829802} ) or unique name (for
example MSFT_0FSPC) of the symbol for which you want to retrieve historical data.
Symbol
If you don't know the symbol's identification number, enter the symbol name, ISIN or WKN
in the field and click the Search button. In the Symbol Search Results dialog, double-click
the symbol that you want to use.
Interval
Choose the desired time compression for the historical data series.
Start Date
Choose the first date for the historical data series.
End Date
Choose the last date for the historical data series.
Records
Enter the number of retrieved historical data records – this setting defines the number of
rows that will be added in the spreadsheet.
Display Time
Select this option to show time stamps in the Start Date and End Date date pickers
(relevant when using Intraday data).
Sort Descending
Check to sort the historical data in descending order (newest data on top).
Clear to sort the historical data in ascending order (oldest data on top).
Quote Elements
Select all quote elements that you want to show for the historical data series - this setting
defines the number of columns that will be added in the spreadsheet.
Select All
Selects all quote element items.
Insert
Copies the DDE formula into the Excel spreadsheet, based on the selections above.
Note
This interface can be used with Excel 2007 (or higher). During installation of the latest version of
TeleTrader Professional, you might be required to download and install Microsoft VSTO 2010
Runtime, which is a prerequisite for running the TeleTrader Professional Add-in for Excel. If you
don't install Microsoft VSTO 2010 Runtime, you will still be able to use RTD and DDE links, but you
will not be able to use the graphical user interface of the Add-in.
Syntax for DDE links to historical quote data
In your spreadsheet software, certain formulas are used to create the DDE links. To request historical data, you have
to manually set up the links using the following syntax:
=ProfDDE|History!'<Symbol>,<Period>,<Field1>[,<Field2>,...],<Retr
ieved Data>[,<Order>]'
Note
In this user guide, the syntax for Microsoft Excel is used for all examples. In Open Office, the
syntax needs to be changed as follows:
=DDE("PROFDDE";"History";"<Symbol>,<Period>,<Field1>[,<Field2>,...],<Ret
rieved Data>[,<Order>]")
Symbol
Internal identification of the symbol. You can either use the symbol identification number (for
example {829802} ) or its unique name (for example MSFT_0FSPC). To find out the
identification of a symbol, click in the row of the symbol in a price page and press F2.
Importing and Exporting Security Data
371
TeleTrader Software GmbH
Marc-Aurel-Straße 10-12, 1010 Vienna, Austria
E-Mail [email protected]
Internet http://professional.teletrader.com
Identification number and unique name can also be displayed in the price page columns TID and
TUN or in the Chart Properties dialog for a symbol.
Period
Data compression that you want to use.
MONTHLY
Use a monthly compression
WEEKLY
Use a weekly compression
DAILY
Use a daily compression
MINx
Use an intraday compression and specify the number of minutes (1-60)
For example: MIN5 – 5-minute compression
TICK
Field(s)
Use uncompressed data (tick by tick)
Name of the data field(s) that should be retrieved. The following fields are available:
DATE
Date for the retrieved record / data point
TIME
Time for the retrieved record / data point
LAST
Last price for the retrieved record / data point (for tick data only)
OPEN
Open price for the retrieved record / data point
HIGH
High price for the retrieved record / data point
LOW
Low price for the retrieved record / data point
PCLOSE
Last price for the retrieved record / data point
VOLLAST
Volume for the retrieved record / data point
OI
Open interest for the retrieved record / data point (for daily, weekly and
monthly data only)
If you want to retrieve more than one data field, separate the field names with a comma.
Retrieved
Data
You can either specify how many records (data points) should be retrieved, or define a time
region using a start date and end date. You cannot use both number of records and start / end
date at the same time.
Number of records:
The last x records / data points of the symbol will be retrieved. The data is updated dynamically
whenever new data comes in, so that always the most current data is shown.
N=x
Specify the number of records / data points that should be retrieved
For example: N=10
Time region with start / end date:
The records / data points between the start date and the end date are retrieved. You have to
always specify both dates, separated with a comma, in the format DDMMYYYY.
S=<Date>
Specify the start date for the time region that should be retrieved
E=<Date>
Specify the end date for the time region that should be retrieved
For example: S=01032005,E=31032005
If you want to set a time interval in addition to the date interval, you have to use the ISO
date/time format YYYY-MM-DDThh:mm:ss with the parameters Sdt and Edt:
Sdt=<ISO>
Specify the start date and time for the time region that should be retrieved
Edt=<ISO>
Specify the end date and time for the time region that should be retrieved
For example: Sdt=2009-02-02T19:00:00,Edt=2009-0202T20:00:00
Order
Order of the retrieved records / data point.
Skip to show the data in chronological order: Oldest data is displayed first.
R
Reverse chronological order: Newest data is displayed first
Importing and Exporting Security Data
372
TeleTrader Software GmbH
Marc-Aurel-Straße 10-12, 1010 Vienna, Austria
E-Mail [email protected]
Internet http://professional.teletrader.com
Note
If the result of your formula is an array, that means if you request several data fields or records at
once, you have to use the array command (CTRL + SHIFT + ENTER) after typing the formula in your
spreadsheet.
Historical data: More examples
Retrieve the last two dates, times and closes for the EURUSD currency pair (using its identification number) in a 5minute compression (3 columns x 2 rows):
=ProfDDE|History!'{949843},MIN5,DATE,TIME,PCLOSE,N=2,R'
rd
Retrieve the dates and closes for the Dow Jones Industrial Average (using its unique name) between April 3 , 2006
th
and April 24 , 2006 in a daily compression (2 columns x 15 rows):
=ProfDDE|History!'DJI_0AWSPC,DAILY,DATE,PCLOSE,S=03042006,E=24042
006'
Security Data Wizard
The Security Data Wizard helps you to import external security data in Metastock or ASCII format to your local
database, and use it in Professional charts. The Professional local database holds only symbols that you have
manually added to it – either by exporting a time series from a chart to the local database (see Using Charts Offline
on page 242) or by importing external data with the Security Data Wizard. You can also use the wizard to remove
symbols from the local database, or rename them.
To open the wizard, choose Security Data Wizard from the File menu. With the Next button, you can jump to the
next step of the wizard; with the Back button, you can review your settings and change them if necessary. The
Cancel button will close the wizard without doing any changes to the local database.
Importing External Data to the Local Database
You can import external data to the Professional local database. The data can be in Metastock or ASCII format (text
file, or comma separated values file).
The symbols in the local database can be found with Symbol Search and used in charts. You can work with all
symbols that are available in your local database even if you do not have a live connection to the Internet. To do this,
you have to switch to offline mode before disconnecting from the Internet: See Using Charts Offline on page 242.
Note
The data in the import file must be ordered chronologically, with the oldest data first.
To import external data to the local database
▪
On the File menu, click Security Data Wizard.
▪
On the first page of the Security Data Wizard, click Next.
▪
On the Action Selection page, select Data import from the list and click Next.
▪
On the Import Data Source page, select the data format that you want to import: Metastock format will search
for files in the Metastock data format, ASCII format will search for files in a text format (also comma separated
values files).
▪
In the Select data folder list, choose the location of your import file, click on the file that you want to import and
click Next.
Importing and Exporting Security Data
373
TeleTrader Software GmbH
Marc-Aurel-Straße 10-12, 1010 Vienna, Austria
E-Mail [email protected]
Internet http://professional.teletrader.com
▪
▪
On the Import settings page, you see a preview of the data that will be imported. The import settings on this
page will help Professional correctly identify the data format used in your import file. Data columns that could not
be correctly identified by Professional are marked in red. Adapt the settings to your needs, and click Apply every
time you change something:
Control
Description
Date
Choose the date format used in the import data file
Century in date
Check if the import data file uses a date format with the century in the date
(for example 2009-01-01)
Clear if the import data file uses a date format without the century (for
example 09-01-01)
Time
Choose the time format used in the import data file
Decimal
Choose the decimal separator used in the import data file
Thousands
Choose the thousands separator used in the import data file
Rename column
Click on a column header in the preview and choose a new name here to
rename a column
Column separator
Choose the column separator (for comma separated values files)
Click Next when you are finished.
Note
The Next button will be disabled as long as Professional cannot correctly identify all data columns.
These columns are highlighted in red. Adapt the settings until all columns are shown with a white
background to proceed.
Importing and Exporting Security Data
374
TeleTrader Software GmbH
Marc-Aurel-Straße 10-12, 1010 Vienna, Austria
E-Mail [email protected]
Internet http://professional.teletrader.com
▪
On the next page, enter the security information that will be used to identify the new symbol in the local database
and click Next:
Control
Description
Enter security’s symbol
Enter a local symbol ID with at most 14 characters
Enter security’s description
name
Enter a symbol description (name) with at most 16 characters
Conflict options
This setting is used when you choose a symbol ID that already exists in the
local database.
Select an option when you are asked to do so:
Append to existing data
Add imported data to the existing symbol
Replace existing data
Replace the existing symbol
Choose data periodicity
Select the data compression for the imported data
Number of decimals
Choose how many decimals you want to import
Copy data to local database
Check to insert the imported data to the local database
Clear to make the data available only temporarily (it will be deleted as soon
as Professional is closed)
▪
On the Completing Security Data Wizard page, a summary of the import options is displayed. Review this
summary – if you want to make changes to the import settings, click Back.
▪
When you are satisfied with the settings, click Finish.
▪
The wizard will close automatically when all data is imported. You can now find the imported symbol with Symbol
Search under the ID and name that you have chosen for it. The symbol is automatically added to the exchange
<Local>.
Importing and Exporting Security Data
375
TeleTrader Software GmbH
Marc-Aurel-Straße 10-12, 1010 Vienna, Austria
E-Mail [email protected]
Internet http://professional.teletrader.com
Maintenance of the Local Database
The local database of TeleTrader Professional holds only symbols that you have manually added to it – either by
exporting a time series from a chart to the local database (see Using Charts Offline on page 242) or by importing
external data with the Security Data Wizard (see Importing External Data to the Local Database on page 373). You
can search for symbols in the local database with the normal Symbol Search functions.
If you want to remove some symbols from the local database, you can do so with the Security Data Wizard, no
matter if they have been imported from external data or exported from a Professional chart. You can also compact the
database to reduce the space that it needs on your hard disk in the same step.
To delete local data from the database and compact the database
▪
On the File menu, click Security Data Wizard.
▪
On the first page of the Security Data Wizard, click Next.
▪
On the Action Selection page, select Database maintenance from the list and click Next.
▪
On the Securities database maintenance page, select the symbol(s) that you want to delete from the local
database. To select several symbols at once, hold the CTRL key while clicking on the symbols.
▪
Click Delete/Restore. The symbols that will be deleted are shown with a red, italic font.
Note
▪
If you have chosen symbols that already where marked for deletion, a click on Delete/Restore will
remove them from the list of symbols that should be deleted.
If you want to change the name or ID of a local symbol, double-click on the name, type a new name and press
ENTER.
Importing and Exporting Security Data
376
TeleTrader Software GmbH
Marc-Aurel-Straße 10-12, 1010 Vienna, Austria
E-Mail [email protected]
Internet http://professional.teletrader.com
▪
If you want to compact the database, select Compact database.
▪
Click Next when you are finished.
▪
On the Completing Security Data Wizard page, a list of actions is displayed that will be carried out as soon as
you complete the wizard. Review this list – if you want to make changes to the actions, click Back.
▪
When you are satisfied with the list of actions, click Finish.
▪
The wizard will close automatically when all actions are completed.
Importing Security Lists
TeleTrader Professional offers the possibility to import a list of symbols from a text file to a price page. The symbols
must be listed with their symbol identification number or unique name. Since you typically don't know the appropriate
symbol ID or unique name unless you have already inserted the symbol in a document in TeleTrader Professional,
the following procedure will show you a workaround using the RTD component (see RTD – Retrieving Real-Time
Data with Excel on page 364).
The following example is assuming that you have a list of ISINs that you want to show in a price page. The procedure
works in a similar way also for WKNs, tickers and names.
To open a security list as a price page (using RTD)
▪
In an Excel document, enter the list of ISINs in column A.
▪
In column B, enter an RTD formula that uses cell references to look up the ISINs from column A on a certain
exchange (you can also add other restrictions, see Searching for Symbols with RTD on page 397). For example,
if you want to get the Xetra stock with this ISIN, use the following formula:
=RTD("profrtd";;"Lookup";A2&",Xetra")
▪
The column B should now show a list of symbol IDs, like shown here:
▪
Copy the values from column B to a new text document and save the document as a *.txt or *.csv file.
▪
On the File menu in TeleTrader Professional, click Document > Open.
▪
In the Open dialog, select the saved text document.
▪
Click Open. The list of symbol IDs will now open as a price page.
To open a security list as a price page with ISIN
▪
In an Excel document, enter the list of ISINs in column A and the respective exchange in column B:
Importing and Exporting Security Data
377
TeleTrader Software GmbH
Marc-Aurel-Straße 10-12, 1010 Vienna, Austria
E-Mail [email protected]
Internet http://professional.teletrader.com
▫
Save the document as a *.csv file
▫
You can also enter the list of the ISINs into a *.txt file, the separator between the ISIN and the exchange can be
"," " ;" or "|":
▫
On the File menu in TeleTrader Professional, click Document > Open.
▫
In the Open dialog, select the saved file.
▫
Click Open. The list of ISINs will now open as a price page.
More information on importing security lists
Text files with security lists that should be imported to a price page must fulfill the following requirements:
▫
File format: *.txt or *.csv
▫
Instead of Symbol IDs, symbol unique names can also be used.
▫
Symbols can be separated by paragraph mark (windows-style end line separator) only.
▫
Only 100.000 symbols (chains) can be openend at once.
▫
If chain symbols are included in the symbol list, each chain will be opened in a separate price page
Copy Data to the Clipboard as Text
You can copy the content of a price page, watch list, chart, time and sales, options matrix, market depth or quick
quote document and insert it as normal text into other programs. If you copy one cell in tabular documents, only the
text is copied. If you copy more than one cell, the appropriate column headers are copied as well (this can be
switched off by using the option Copy header automatically under Tools > Options > Price Page – see Price Page
Settings on page 344).
To copy content from a price page or watch list
▪
Highlight the content that you want to copy in the price page or watch list (see also Selecting Rows or Columns of
a Price Page on page 89).
▪
On the Edit menu, choose Copy as text.
▪
Insert the copied data into another program or text editor.
To copy the time series of a chart
▪
Right-click on the symbol or study that you want to copy (or on the chart background to copy all symbols and
studies) and choose Copy Time-Series.
▪
Insert the copied data into another program or text editor.
Note
For copying the time series as text to the clipboard, the same export limitations for tick and intraday
data apply as for copying the time series directly to a text file. See Using Charts Offline on page
242.
To copy a row from a time and sales document
▪
In the time and sales document, right-click the row that you want to copy and choose Copy as text.
Importing and Exporting Security Data
378
TeleTrader Software GmbH
Marc-Aurel-Straße 10-12, 1010 Vienna, Austria
E-Mail [email protected]
Internet http://professional.teletrader.com
▪
Insert the copied data into another program or text editor.
To copy all content of a time and sales document
▪
Right-click anywhere in the time and sales document and choose Copy All.
▪
Insert the copied data into another program or text editor.
To copy the content of a market depth document
▪
Right-click on the part of the market depth document (summary or depth view) that you want to copy and choose
Copy as text.
▪
Insert the copied data into another program or text editor.
To copy the content of a quick quote document
▪
Right-click in the quick quote document and select Copy as text.
▪
Insert the copied data into another program or text editor.
Importing and Exporting Security Data
379
TeleTrader Software GmbH
Marc-Aurel-Straße 10-12, 1010 Vienna, Austria
E-Mail [email protected]
Internet http://professional.teletrader.com
RTD – Real-Time Data in Excel
You can display live, updating quote data or historical data in Microsoft Excel using the software TeleTrader
Professional RTD. RTD (Real-Time Data) is a technology that was specifically designed for live data scenarios. It
uses the built-in RTD formulas of Microsoft Excel, which means that you can use cell references etc. as placeholders
in your spreadsheets like with any other Excel formula.
With TeleTrader Professional RTD, you can include the current quotes of several symbols in your spreadsheets, or
retrieve historical data and display it in a table. The necessary RTD formulas can be created by copying live, updating
quote data from TeleTrader Professional to Microsoft Excel. The syntax for RTD links gives you great flexibility in
formulating your own requests.
Note
For some examples of how to use TeleTrader Professional RTD, a sample Excel sheet is included
in the installation: Right-click the RTD tray icon and choose Help > Samples to open it. See also
Samples for the RTD Component on page 403.
Automatically started on opening your Excel spreadsheet
TeleTrader Professional RTD is started automatically in the background as needed. You can stop the connection
manually when you don't need it anymore. If you have not installed TeleTrader Professional yet, you have to
download and install it on your computer first.
Learn more:
System Requirements for the RTD Component on page 382
Downloading and Installing the RTD Component on page 383
Starting and Stopping the RTD Connection on page 384
Choosing the Time Zone for the RTD Component on page 388
Copy RTD links from TeleTrader Professional
You can use the Copy command from a price page, watch list, market depth, options matrix or time and sales
document to copy live, updating quote data to Microsoft Excel. The RTD links can then be inserted into a Microsoft
Excel Table with the function Insert or with the key combination CTRL + V.
RTD – Real-Time Data in Excel
380
TeleTrader Software GmbH
Marc-Aurel-Straße 10-12, 1010 Vienna, Austria
E-Mail [email protected]
Internet http://professional.teletrader.com
In order to use RTD when copying data from TeleTrader Professional documents to your spreadsheet software, you
have to set the DDE/RTD format under Tools > Options > Price Page to Microsoft Office RTD (see Price Page
Settings on page 344).
Learn more:
Setting up an RTD Link with Live Data on page 388
Retrieve live, updating quote data, market depth and fundamental data
With live RTD links, you can retrieve a wide variety of data fields for a security, ranging from live, updating quote data
to live market depth data and fundamental data (including company information and balance sheet data).
=RTD("ProfRTD";;"Live";"{949843},Last")
Learn more:
Setting up an RTD Link with Live Data on page 388
Tips and Examples for Retrieving Live Data on page 392
Retrieve historical data, intraday and tick data
You can also display historical data for a security. Choose the time region that should be covered and the data
compression / period, which can range from raw / tick-by-tick data over intraday bars to daily, weekly and monthly
data.
=RTD("ProfRTD";;"History";"{829802},Daily, PCLOSE, E=23092008";1)
Learn more:
Setting up an RTD Link with Historical Data on page 393
Tips and Examples for Retrieving Historical Data on page 396
Search for symbol IDs using ISIN, WKN, ticker or name of the symbol
You can search for symbol IDs that are needed in other RTD formulas by using the symbol's ISIN, WKN, ticker or
name. Additional search options like exchange name, currency, strike price and expiration date are also available.
The search result will be shown with its symbol ID, allowing the user to reference the ID in other RTD requests (cell
references).
=RTD("ProfRTD";;"Lookup";"074305, Vienna")
Learn more:
Searching for Symbols with RTD on page 397
Tips and Examples for Looking Up Symbols on page 398
Alternative to using TeleTrader Professional RTD
The alternative to using RTD is the older DDE protocol (Dynamic Data Exchange). As RTD is a newer technology
than DDE, RTD performs better in most cases. RTD also uses standard Excel syntax, which means that you can use
cell references in RTD formulas to make them re-usable across your spreadsheet.
For information about using Microsoft Office DDE, see DDE – Dynamic Data Exchange with Excel / Open Office on
page 366.
RTD – Real-Time Data in Excel
381
TeleTrader Software GmbH
Marc-Aurel-Straße 10-12, 1010 Vienna, Austria
E-Mail [email protected]
Internet http://professional.teletrader.com
Setting Up the RTD Component
If Microsoft Excel is not available on your computer at the time that you install TeleTrader Professional, the RTD
component is not included with the installation. To add it to your computer at a later time, you have to download and
install TeleTrader Professional RTD on your computer before you can use RTD links. Before you start the installation,
make sure that your computer meets the system requirements.
After the installation is finished, TeleTrader Professional RTD is started automatically in the background as needed.
You can stop the connection manually when you don't need it anymore.
It is also recommended that you choose a proper time zone for all time stamps that are received via TeleTrader
Professional RTD. By default, the time zone is set to Local Time.
If you experience problems with retrieving data in Microsoft Excel, see also Troubleshooting the RTD Component on
page 404.
System Requirements for the RTD Component
Please make sure that your computer meets the system requirements for running TeleTrader Professional RTD.
Computer
Hardware
PC with 1,66 GHz or higher
Operating System
Windows 8, Windows 7 (recommended), Windows Vista, Windows XP
All operating systems need Microsoft .NET Framework 4.0 and the most recent service
packs.
Microsoft Excel
32-bit and 64-bit versions of Microsoft Excel are supported
The TeleTrader Professional Add-in for Excel can only be used with Excel 2007 (or
higher). With older Excel versions, you will be able to use RTD links, but you will not be
able to use the graphical user interface of the Add-in.
Microsoft Office
Add-Ins
Microsoft Office Primary Interlop Assembly is a pre-requisite for running TeleTrader
Professional RTD. If this package is not installed yet, you will be prompted to do so
during the installation process.
Microsoft VSTO 2010 Runtime is a prerequisite for running the TeleTrader Professional
Add-in for Excel. If you don't install this package, you will still be able to use RTD, but you
will not be able to use the graphical user interface of the Add-in.
RAM
1 GB
We recommend at least 2 GB for large time series.
Free Disk Space
ca. 5 MB of free hard drive space for a complete installation
Internet Connection
Persistent Internet connection with a recommended bandwidth of at least 64 kbps
Firewalls
▫
Port 80 and 2088 need to be open for TCP/IP traffic to the market data server (allowing HTTP traffic is not
sufficient)
▫
Some functions (automatic updates, fundamental data) require a HTTP connection
▫
Personal firewalls have to be set up to allow traffic for TeleTrader Professional RTD. You can either enable all
outgoing traffic from TeleTrader Professional RTD, or enable outgoing TCP traffic on port 2088 and HTTP traffic
on port 80
RTD – Real-Time Data in Excel
382
TeleTrader Software GmbH
Marc-Aurel-Straße 10-12, 1010 Vienna, Austria
E-Mail [email protected]
Internet http://professional.teletrader.com
Antivirus software
For better performance, we recommend configuring your antivirus software so that it does not scan the TeleTrader
Professional RTD folders. The folders are usually located at the following paths:
▫
Program data: C:\Program Files\Teletrader\Professional RTD Server\
The TeleTrader Professional RTD executable file is called ProfRTD.exe.
Downloading and Installing the RTD Component
If Microsoft Excel is not available on your computer at the time that you install TeleTrader Professional, the RTD
component is not included with the installation. To add it to your computer at a later time, you have to download and
install the software TeleTrader Professional RTD. TeleTrader Professional RTD is then started automatically in the
background as needed. Before you start the installation, make sure that your computer meets the system
requirements.
This section will show you how to download and install TeleTrader Professional RTD on your computer.
To download and install TeleTrader Professional RTD
▪
Go to the RTD download section at http://professional.teletrader.com/rtd.
▪
Depending on your browser, you can either save the setup file, or run it directly. You might have to start the
installation by navigating to the location where you saved the file and double-clicking the downloaded file.
▪
A security warning might appear. Click Run. Confirm the request of the Windows User Account Control by
clicking Continue.
▪
The InstallShield Wizard is started. This setup wizard will guide you through the installation in a few steps. Just
follow the instructions on the screen.
Note
TeleTrader Professional RTD needs the Microsoft Office PIA package to be installed
on your computer. If this package is not installed yet, you have to download and install it first
before carrying on with the installation of TeleTrader Professional RTD. Follow the instructions
below to install the PIA package.
To install the Microsoft Office PIA package
▪
During the installation of TeleTrader Professional RTD, you might be requested to download and install the
Microsoft Office PIA package.
▪
Click Finish to start downloading the PIA installation file.
▪
Double-click the downloaded file PrimaryInterlopAssembly.exe.
RTD – Real-Time Data in Excel
383
TeleTrader Software GmbH
Marc-Aurel-Straße 10-12, 1010 Vienna, Austria
E-Mail [email protected]
Internet http://professional.teletrader.com
▪
In the following dialog, accept the Microsoft License Terms and click Continue.
▪
Choose a folder for saving the extracted PIA package. As soon as the extraction is completed successfully, you
will be notified by a message window.
▪
Navigate to the folder where you extracted the PIA package and double-click the MSI file (for example
o2007pia.msi).
▪
Now you can resume installing TeleTrader Professional RTD. Double-click the downloaded RTD setup file to
start the InstallShield Wizard.
Starting and Stopping the RTD Connection
TeleTrader Professional RTD is started automatically when needed, for example when opening an Excel spreadsheet
containing RTD links. You can also manually start the RTD connection, if necessary.
You can see if the RTD connection is active in your Windows system tray:
The RTD connection stays active even if you close TeleTrader Professional or the spreadsheet that contains the RTD
links. You can stop the connection manually if you don’t need it anymore.
To start the RTD connection manually
▪
Click on the Windows Start button, and then select All Programs > TeleTrader Professional > TeleTrader
Professional RTD Server.
▪
If you are using the RTD connection without an active installation of TeleTrader Professional, you will be asked to
log in with your user name and password.
▪
Select the Save check box so you don't have to enter your user name and password again the next time you log
in.
RTD – Real-Time Data in Excel
384
TeleTrader Software GmbH
Marc-Aurel-Straße 10-12, 1010 Vienna, Austria
E-Mail [email protected]
Internet http://professional.teletrader.com
▪
Select Always show login dialog if you want to display the login dialog on every start of the RTD Server. If you
clear this option, the login dialog will not be displayed again on future logins, and you will be automatically logged
in using your last login information. You can however still bring up the login dialog by right-clicking the RTD icon
in the Windows system tray and selecting first Disconnect and then Connect.
▪
Select Automatic reconnect if you want RTD to automatically reconnect to the Market Data Server in case the
connection is lost.
▪
Select I accept the terms in the licence agreement radio button. If you want to, you can read the End User
License Agreement by clicking the EULA button.
To stop the RTD connection manually
▪
In the Windows system tray, right-click the RTD icon:
▪
Select Disconnect if you want to stop retreving data without closing RTD Server.
▪
Select Exit to close RTD Server.
RTD Server Login Dialog
On each start, TeleTrader Professional RTD must connect to the Market Data Server (MDS) to collect real-time /
historical quotes and fundamental data from multiple data feeds. On the first start of TeleTrader Professional RTD,
the login dialog is shown automatically. On future logins, the login dialog will only be displayed when the option
Always show login dialog is selected.
Control
Description
User Name
Enter the TeleTrader Professional user name that you have received via email.
Password
Enter the password that you have received via e-mail.
Save
Check to save your login data. The next time you log in, you don’t have to
enter your user name and password again.
Always show login dialog
Check to display the TeleTrader Professional RTD Server Login dialog on
each start
Automatic reconnect
Check to let TeleTrader Professional RTD try to reestablish the connection
automatically in case the connection is lost.
Server
Enter the address of the TeleTrader Market Data Server. The default setting is
mds*.ttweb.net.
RTD – Real-Time Data in Excel
385
TeleTrader Software GmbH
Marc-Aurel-Straße 10-12, 1010 Vienna, Austria
E-Mail [email protected]
Internet http://professional.teletrader.com
Settings
Click on this button to change the connection settings (see Connection
Settings in the RTD Server Login Dialog on page 386).
I accept the terms in the
licence agreement
(I do not accept the licence
agreement)
You have to accept the terms in the licence agreement to be able to receive
data.
EULA
Click on this button to view the End User Licence Agreement.
Connection Settings in the RTD Server Login Dialog
In the TeleTrader Professional RTD Server Login dialog, you can change the connection settings that are used to
connect to the Market Data Server to collect quotes. We recommend to use the default settings and only change
those if you have problems connecting to the TeleTrader servers.
To access the Connection Settings dialog, click Settings in the TeleTrader Professional RTD Server Login dialog.
Market Data Server settings
These settings control the connection to the Market Data Server. We recommend to always use the default settings.
Control
Description
Ports
Port numbers of the incoming connection from the remote server. Multiple
ports must be separated with a comma.
These ports must be open for the connection to the Market Data Server.
Defaults ports are 2088 and 80.
Use default setting
Check to use the default port settings.
Clear to enter your own port settings.
Web Service settings
These settings are used for the collection of fundamental data (for example company figures and master data), and
not for real-time quote data feeds.
Control
Description
Use web service (HTTP) data feed
Check to enable the web service for fundamental data.
Port
Port number of the web service.
This port must be open for the collection of fundamental data. Default
port is 80.
Use default settings
Check to use the default port settings.
Clear to enter your own port settings.
RTD – Real-Time Data in Excel
386
TeleTrader Software GmbH
Marc-Aurel-Straße 10-12, 1010 Vienna, Austria
E-Mail [email protected]
Internet http://professional.teletrader.com
Use Windows HTTP proxy setting
Check to use the proxy settings of Internet Explorer.
Reconnection settings
You can define how TeleTrader Professional RTD reacts if it loses the connection to the Market Data Server.
Control
Description
Reconnect after x sec.
Enter the amount of seconds after which TeleTrader Professional RTD tries
to reconnect to the Market Data Server.
Try to connect x times
Enter the number of times TeleTrader Professional RTD tries to reconnect.
Limitless
Check to let TeleTrader Professional RTD try to reconnect an unlimited
number of times (until the connection is reestablished).
Clear to let TeleTrader Professional RTD try to reconnect only for the
number of times defined above (even if the connection cannot be
established).
Note
Reconnection settings will be applied only if the option Automatic Reconnect is selected in Tele
Trader RTD Server Login dialog.
Monitoring the Connection Status
You can monitor the status of the connection to the Market Data Server, including software versions and login
information, by right-clicking the RTD icon.
To view detailed connection status information
▪
In the Windows system tray, right-click the RTD icon and select About.
Label
Description
Status
General status of the connection (Connected or Disconnected)
Server address
IP address and port of the connected Market Data Server (quote data)
User Name
Currently logged-in user
RTD – Real-Time Data in Excel
387
TeleTrader Software GmbH
Marc-Aurel-Straße 10-12, 1010 Vienna, Austria
E-Mail [email protected]
Internet http://professional.teletrader.com
Web Service domain name
Domain name of the connected web service (fundamental data)
Web Service IP/Port
IP address and port of the connected web service
Choosing the Time Zone for the RTD Component
You can choose a certain time zone for all timestamps that are received via TeleTrader Professional RTD (for
example, the fields Date, Time and DateTime). All time definitions of requests for historical data (start / end date and
time) must be made in the chosen time zone.
To choose a time zone
▪
In the Windows system tray, right-click the RTD icon:
▪
Under Time Zone, select the zone that you want to use:
Local Time
Select to use the local time of your computer for all time values.
GMT
Select to use Greenwich Mean Time for all time values.
Exchange Time
Select to use the local time of the exchange for all time values.
Custom Time
Select to use a custom time in increments or decrements of 30 minutes from GMT for all
time values.
Setting up an RTD Link with Live Data
The following examples show you how to set up RTD links with live data in Microsoft Excel.
However, in most cases it is easier and more comfortable to simply use the Copy command from your Professional
document to create a live RTD link (see below). An RTD link for the displayed symbol or a list of symbols is then
created automatically. The RTD links can then be inserted into a Microsoft Excel table with the function Insert or with
the key combination CTRL + V.
In order to use RTD when copying data from TeleTrader Professional documents to your spreadsheet software, you
have to set the DDE/RTD format under Tools > Options > Price Page to Microsoft Office RTD (see Price Page
Settings on page 344).
If you want to use historical data in your spreadsheet, or a combination of historical and current data (for example, the
last 10 ticks of a symbol), you have to use another type of RTD link: See Setting up an RTD Link with Historical Data
on page 393.
To copy live, updating quote data to Microsoft Excel
▪
Open a price page, watch list, market depth, options matrix or time and sales document in TeleTrader
Professional that shows the data that you want to copy. See also Opening Symbols on page 63 and Adding and
Removing Columns on page 80.
▪
Select all cells that you want to copy to Microsoft Excel. You can highlight them with the mouse, or select
complete rows or columns (see also Selecting Rows or Columns of a Price Page on page 89).
▪
Right-click on the selected cells and choose Copy.
Note
▪
When you want to copy data from a market depth document, right-click in the summary view of the
market depth document and choose Copy to copy all data.
Open a Microsoft Excel spreadsheet.
RTD – Real-Time Data in Excel
388
TeleTrader Software GmbH
Marc-Aurel-Straße 10-12, 1010 Vienna, Austria
E-Mail [email protected]
Internet http://professional.teletrader.com
▪
Paste the data that you have copied into Excel. For example, you can use the shortcut CTRL + V.
▪
The data that you have copied will now be displayed in the Excel spreadsheet. It will be updated whenever new
ticks arrive.
Note
By default, the column headings of the price page are copied along as well. You can disable this
setting under Tools > Options > Price Page (see Price Page Settings on page 344).
To request live quote data manually in Microsoft Excel (example)
▪
Open a Microsoft Excel spreadsheet.
▪
In the cell where you want the data field to appear, type (or copy) the following formula:
=RTD("ProfRTD";;"Live";"{949843},Last")
▪
The requested data will appear in the Microsoft Excel cell. The request above will for example fetch the Last price
of the EURUSD currency pair.
Syntax for RTD Links to Live Data
In your Microsoft Excel spreadsheet, certain formulas are used to create the RTD links. If you use the Copy
command, all RTD links are created automatically for you. If you set up the links manually, you have to use the
following syntax to request live quote data:
=RTD("ProfRTD";;"Live";"<Symbol>,<Field>")
Note
The character you have to use for separating the different arguments of the RTD function (shown
as a semicolon ; above) depends on the regional configuration of your operating system. Under
Windows, you can change this configuration in the Control Panel.
Symbol
Internal identification of the symbol. You can either use the symbol identification number (for
example {829802} ) or its unique name (for example MSFT_1061SPC).
To find out the identification of a symbol, click in the row of the symbol in a price page and
press F2. Identification number and unique name can also be displayed in the price page
columns TID and TUN or in the Chart Properties dialog for a symbol.
You can also use the Lookup command to search for a symbol ID within Excel (see Searching
for Symbols with RTD on page 397).
Field(s)
Name of the data field(s) that should be retrieved. See Available Field Names on page 405.
Market Depth
Fields
For market depth data, the following field names can be used – the number in square brackets
signifies the depth level, starting with 0:
MDBidSize[depth_level]
MDBidCount[depth_level]
MDBid[depth_level]
MDAsk[depth_level]
MDAskSize[depth_level]
Note
RTD – Real-Time Data in Excel
It is not possible to display market depth data from NASDAQ via RTD.
389
TeleTrader Software GmbH
Marc-Aurel-Straße 10-12, 1010 Vienna, Austria
E-Mail [email protected]
Internet http://professional.teletrader.com
Example for retrieving the Bid price at the third depth level:
=RTD("ProfRTD";;"Live";"{458812},MDBid[2]")
VWAP Fields
The Volume Weighted Average Price (VWAP) of a stock over a specified market period is
defined as the average price paid per share during that period (price of each transaction in the
market weighted by its volume). It is calculated from the volumes and prices of all trades during
a certain period of time. See also Adding, Removing and Customizing the VWAP Columns on
page 98.
You can retrieve VWAP data with an RTD link. The VWAP data is calculated for a certain time
period, according to your request. Use the following field syntax:
VWAP(Type,DateTimeF,DateTimeT,VolF,VolT,PriceF,PriceT)[OutputName]
Type
Time period used for VWAP calculations: This can be D (Daily), LH (Last
Hour), C (Custom), N (None) or F (Freeze).
DateTimeF/T
Begin and end date and time of a custom time period (C) in ISO format
YYYY-MM-DDThh:mm:ss
VolF/T
Lower and upper boundaries for the volume range (optional)
PriceF/T
Lower and upper boundaries for the price range (optional)
OutputName
Defines the VWAP value that should be returned: Price, StdDev,
TotalVol, AvgVol, NumTicks, DateF, DateT, TimeF, TimeT, VolF,
VolT, PriceF, PriceT
Examples for retrieving VWAP data:
=RTD("ProfRTD";;"Live";"{458757},VWAP(LH)[StdDev]")
=RTD("ProfRTD";;"Live";"{458757},VWAP(C,2010-04-08T22:00:00,2010-0409T10:00:00,0,100000,40.00,45.00)[Price]")
Study Fields
TeleTrader Professional offers a large amount of analysis tools (studies) to calculate indicators
and signals. Depending on the study, one or more columns are necessary for displaying the
study data for a symbol. You can choose the data compression that should be used for the
study (Daily, Weekly, Monthly, Intraday or Tick by Tick data) and adapt the study's parameters.
For a list of all available studies and their parameters, see the Study Reference.
To retrieve study data with an RTD link, use the following field syntax:
AT(FunctionName,{Base1Name:Base1Symbol}...{BaseXName:BaseXSymbol},Comp
ression,{FID1}...{FIDn},{Param1Name:Param1Value}...{ParamXName:
ParamXValue},TickOrBar,LastNBars)[OutputEntity:OutputProperty]
FunctionName
Name of study function (for example movs for Moving Average Simple)
Base1Name
Usually there is only one base symbol which is called Source. For some
studies that have more than one base symbol, the appropriate names for
the different bases are listed in the Study Reference.
Base1Symbol
Symbol identification number of the base symbol, for example {829802}.
Compression
Data compression of the time series that is used to calculate the study
values. Possible values are: Daily, Weekly, Monthly, x Minutes (for
Intraday compressions), Tick by Tick.
FID1
Price that is used for calculation of the study. Possible values are: Open,
Close, High, Low, Volume, OI
Some studies use all price values; in that case, you have to use {All}.
Param1Name
Name of the study's first parameter as listed in the Study Reference, for
RTD – Real-Time Data in Excel
390
TeleTrader Software GmbH
Marc-Aurel-Straße 10-12, 1010 Vienna, Austria
E-Mail [email protected]
Internet http://professional.teletrader.com
example period.
If a study has more than one parameter, they all have to be listed.
Param1Value
Value assigned to the study's first parameter, for example 21.
TickOrBar
Define whether the study should be recalculated on each new tick (tick) or
on each new bar (bar). Use bar if you are experiencing performance
problems.
LastNBars
Time region that is used for calculating the study, for example 21. This
setting influences the amount of historical time series data that is
downloaded for the base symbol The appropriate setting often depends on
the currently set study parameters, such as the period of a Moving Average.
If you add too little history, the study might not be calculated (leading to an
empty value in the study column); If you add too much history, this can
affect performance.
OutputEntity
Name of the study's output entity, usually similar to the function name, for
example MovS.
OutputProperty Name of the study's output property (Upper, Lower, Price etc.). In case of
Line studies, OutputProperty is fixed to Value since there is only one
property.
Example for retrieving study data with one result ("Line"):
=RTD("profrtd";;"Live";",AT(movs,{Source:{459237}},Daily,{Close},{peri
od:21}{shift:0},tick,21)[MovS:Value]")
Example for retrieving study data with multiple results ("Multiple Lines", "Areas"):
=RTD("ProfRTD";;"Live";",AT(boll,{Source:{459237}},Tick by
Tick,{High},{period:20}{deviation1:2}{deviation2:2},tick,20)[Boll:Upper]")
=RTD("profrtd";;"Live";",AT(boll,{Source:{459237}},Tick by
Tick,{High},{period:20}{deviation1:2}{deviation2:2},tick,20)[Mid:Value]")
=RTD("profrtd";;"Live";",AT(boll,{Source:{459237}},Tick by
Tick,{High},{period:20}{deviation1:2}{deviation2:2},tick,20)[Boll:Lower]")
Example for retrieving study data with markers – values will only be displayed if the marker
appears on the current bar ("Candlestick Patterns", "Buy/Sell Signals"):
=RTD("profrtd";;"Live";",AT(atr_trail,{Source:{458822}},60
Minutes,{All},{TrailTypeMod:True}{Period:21}{Factor:1.5}{InitialMonth:
1}{InitialDay:1}{InitialYear:2009}{FirstTrade:1}{ShowTraderMarks:True}
{ShowLine:True},tick,142)[BuySell:Price]")
=RTD("profrtd";;"Live";",AT(atr_trail,{Source:{458822}},60
Minutes,{All},{TrailTypeMod:True}{Period:21}{Factor:1.5}{InitialMonth:
1}{InitialDay:1}{InitialYear:2009}{FirstTrade:1}{ShowTraderMarks:True}
{ShowLine:True},tick,142)[BuySell:Text]")
=RTD("profrtd";;"Live";",AT(atr_trail,{Source:{458822}},60
Minutes,{All},{TrailTypeMod:True}{Period:21}{Factor:1.5}{InitialMonth:
1}{InitialDay:1}{InitialYear:2009}{FirstTrade:1}{ShowTraderMarks:True}
{ShowLine:True},tick,142)[BuySell:Direction]")
Example for retrieving study data with multiple base symbols:
=RTD("profrtd";;"Live";",AT(indCorrelation,{Source1:{459237}}{Source2:
RTD – Real-Time Data in Excel
391
TeleTrader Software GmbH
Marc-Aurel-Straße 10-12, 1010 Vienna, Austria
E-Mail [email protected]
Internet http://professional.teletrader.com
{458757}},Daily,{Close}{Close},{period:5}{shift:0},tick,5)[Corr:Value]
")
In case of study fields that exceed Microsoft Excel's limit of 200 characters, the field can be
broken into several parts of formula where each part begins with AT+.
Example for formulas that exceed maximum number of characters:
=RTD("profrtd";;"Live";",AT(tmv,{Source:{458757}},Daily,{All},{Keltner
Period:20}{ShowVolatilityAndTrend:True}{UseLindaRaschkeKeltner:False}{
ADXPeriod:10}{SMAPeriod:8}{ShowTrendStrengthAndDirection:True}{CCIPeri
od:13}{UpperL)";"AT+(evel:100}{LowerLevel:100}{ShowMomentumAndTrend:True}{ShortTermVolumePeriod:1}{LongTermVolum
ePeriod:20}{VolumeOscSpikeThreshold:50}{ShowVolumeOscillationExtremes:
True},tick,131)[KeltnerMidLine:Value]")
Tips and Examples for Retrieving Live Data
Note
For more examples of how to use TeleTrader Professional RTD, a sample Excel sheet is included
in the installation: Right-click the RTD tray icon and choose Help > Samples to open it. See also
Samples for the RTD Component on page 403.
RTD – Real-Time Data in Excel
392
TeleTrader Software GmbH
Marc-Aurel-Straße 10-12, 1010 Vienna, Austria
E-Mail [email protected]
Internet http://professional.teletrader.com
Retrieving live quotes
Retrieve live quotes for the EURUSD currency pair:
=RTD("ProfRTD";;"Live";"{949843},Last")
Using cell references
In RTD formulas, you can use references to other cells, which makes your formulas reusable – for example, you can
substitute the symbol name with a cell reference (the correct symbol ID should be entered manually into the
referenced cell A1):
=RTD("ProfRTD";;"Live";A1&",Last")
Using a wrapper function for RTD requests
For more ease-of-use when typing a lot of RTD formulas manually, you can define a wrapper function using Microsoft
Visual Basic/VBA. The following example shows the wrapper function GetData:
Function GetData(SymbolField)
GetData = Application.WorksheetFunction.RTD("ProfRTD", Null,
"Live", SymbolField)
End Function
You can then use the function GetData instead of RTD formulas in your worksheets using the following syntax:
=GetData("<Symbol>,<Field>")
=GetData("{949843},Last")
Setting up an RTD Link with Historical Data
You can also request historical quote data from the Market Data Server and display it in Microsoft Excel. To do so,
you must use an RTD formula in the cell of your spreadsheet where you want to show the data.
To request historical quote data in Microsoft Excel (example)
▪
Open a Microsoft Excel spreadsheet.
▪
In the cell where you want the data field to appear, type (or copy) the following formula:
=RTD("ProfRTD";;"History";"{829802},Daily, PCLOSE, E=23092008";1)
▪
The requested data will appear in the Microsoft Excel cell. The request above will for example fetch the Close
rd
price of the Microsoft stock on September 23 , 2008.
RTD – Real-Time Data in Excel
393
TeleTrader Software GmbH
Marc-Aurel-Straße 10-12, 1010 Vienna, Austria
E-Mail [email protected]
Internet http://professional.teletrader.com
To request historical quote data in Microsoft Excel using Excel Add-in
Besides manually generating RTD links, you can also generate RTD links for retrieving the historical data using
TeleTrader Professional Add-in for Excel.
▪
Open a Microsoft Excel spreadsheet.
▪
Click the TeleTrader Professional ribbon in the Excel toolbar.
▪
Click the RTD Server toolbar button and then the Show button.
▪
In the Formula Generator pane define: Symbol name, Interval, Time Series and Quote Elements.
▪
Select one cell in the Excel spreadsheet and click the Insert button.
▪
Data will be displayed as an array to the right and down starting from the selected cell in the Excel spreadsheet.
Defines the symbol identification number (for example {829802} ) or unique name (for
example MSFT_0FSPC) of the symbol for which you want to retrieve historical data.
Symbol
If you don't know the symbol's identification number, enter the symbol name, ISIN or WKN
in the field and click the Search button. In the Symbol Search Results dialog, double-click
the symbol that you want to use.
Interval
Choose the desired time compression for the historical data series.
Start Date
Choose the first date for the historical data series.
End Date
Choose the last date for the historical data series.
Records
Enter the number of retrieved historical data records – this setting defines the number of
rows that will be added in the spreadsheet.
Display Time
Select this option to show time stamps in the Start Date and End Date date pickers
(relevant when using Intraday data).
Sort Descending
Check to sort the historical data in descending order (newest data on top).
Clear to sort the historical data in ascending order (oldest data on top).
Quote Elements
Select all quote elements that you want to show for the historical data series - this setting
defines the number of columns that will be added in the spreadsheet.
Select All
Selects all quote element items.
Insert
Copies the RTD formulas into the Excel spreadsheet, based on the selections above.
Note
This interface can be used with Excel 2007 (or higher). During installation of the latest version of
TeleTrader Professional, you might be required to download and install Microsoft VSTO 2010
Runtime, which is a prerequisite for running the TeleTrader Professional Add-in for Excel. If you
don't install Microsoft VSTO 2010 Runtime, you will still be able to use RTD and DDE links, but you
will not be able to use the graphical user interface of the Add-in.
Syntax for RTD Links to Historical Data
In a Microsoft Excel spreadsheet, use the following syntax to request historical quote data with RTD:
=RTD("ProfRTD";;"History";"<Symbol>,<Period>,<Field>,<TimeRegion>
";<Index>)
Note
The character you have to use for separating the different arguments of the RTD function (shown
as a semicolon ; above) depends on the regional configuration of your operating system. Under
Windows, you can change this configuration in the Control Panel.
RTD – Real-Time Data in Excel
394
TeleTrader Software GmbH
Marc-Aurel-Straße 10-12, 1010 Vienna, Austria
E-Mail [email protected]
Internet http://professional.teletrader.com
Symbol
Internal identification of the symbol. You can either use the symbol identification number (for
example {829802} ) or its unique name (for example MSFT_0FSPC).
To find out the identification of a symbol, click in the row of the symbol in a price page and press
F2. Identification number and unique name can also be displayed in the price page columns TID
and TUN or in the Chart Properties dialog for a symbol.
You can also use the Lookup command to search for a symbol ID within Excel (see Searching
for Symbols with RTD on page 397).
Period
Data compression that you want to use.
MONTHLY
Use a monthly compression
WEEKLY
Use a weekly compression
DAILY
Use a daily compression
MINx
Use an intraday compression and specify the number of minutes (1-60)
For example: MIN5 – 5-minute compression
TICK
Field
TimeRegion
Use uncompressed data (tick by tick)
Name of the data field that should be retrieved. The following fields are available:
DATE
Date for the retrieved record / data point
TIME
Time for the retrieved record / data point
LAST
Last price for the retrieved record / data point (for tick data only)
OPEN
Open price for the retrieved record / data point
HIGH
High price for the retrieved record / data point
LOW
Low price for the retrieved record / data point
PCLOSE
Last price for the retrieved record / data point
VOLLAST
Volume for the retrieved record / data point
OI
Open interest for the retrieved record / data point (for daily, weekly and
monthly data only)
You can specify a time region using a start date and end date. For different data compressions,
you can define the time region in different ways.
For tick data, use NOW. This specifies the current point in time.
For daily, weekly or monthly data, enter the start or end dates for the time region that should be
retrieved in the format DDMMYYYY. You can specify one or both dates. When you only use a start
date, the end date is implicitly set to the current date/time.
S=<DateTime>
Start date
E=<DateTime>
End date
For intraday data, specify start or end of the time region in the date/time format DDMMYYYYhhmm.
Index
The RTD functionality in Excel can only connect single cells to a data source. If you need more
than one cell of data for the same symbol and time region (for example, the last 30 ticks of a
symbol), you can use the Index parameter. An index of 1 means that the data for the specified
time / date is retrieved. An index of 2 means that the data from the last bar before the specified
end date is retrieved, and so on.
RTD – Real-Time Data in Excel
395
TeleTrader Software GmbH
Marc-Aurel-Straße 10-12, 1010 Vienna, Austria
E-Mail [email protected]
Internet http://professional.teletrader.com
Tips and Examples for Retrieving Historical Data
For using cell references and wrapper functions, see the Tips and Examples for Retrieving Live Data on page 392.
Note
For more examples of how to use TeleTrader Professional RTD, a sample Excel sheet is included
in the installation: Right-click the RTD tray icon and choose Help > Samples to open it. See also
Samples for the RTD Component on page 403.
Retrieving daily data
th
Retrieve the volume of the Microsoft stock for 3 days counting backwards from April 5 , 2006 in a daily compression
(each formula needs to be entered in a different cell):
=RTD("ProfRTD";;"History";"{829802},Daily,VOLLAST,E=05042006";1)
=RTD("ProfRTD";;"History";"{829802},Daily,VOLLAST,E=05042006";2)
=RTD("ProfRTD";;"History";"{829802},Daily,VOLLAST,E=05042006";3)
Retrieving intraday data
th
Retrieve the Close price of 1-hour-bars (60 minutes) for the EURUSD currency pair, from March 30 , 2011, 8:00 h to
noon. The first cell should contain the following formula – it retrieves the Close price of the 12:00 bar:
=RTD("ProfRTD";;"History";"{3212164},Min60,PCLOSE,S=300320110800,
E=300320111200";1)
To retrieve the rest of the data (8:00, 9:00, 10:00 and 11:00 bars), the following formulas should be used (notice that
the Index count is going up for each cell):
=RTD("ProfRTD";;"History";"{3212164},Min60,PCLOSE,S=300320110800,
E=300320111200";2)
=RTD("ProfRTD";;"History";"{3212164},Min60,PCLOSE,S=300320110800,
E=300320111200";3)
=RTD("ProfRTD";;"History";"{3212164},Min60,PCLOSE,S=300320110800,
E=300320111200";4)
=RTD("ProfRTD";;"History";"{3212164},Min60,PCLOSE,S=300320110800,
E=300320111200";5)
=RTD("ProfRTD";;"History";"{3212164},Min60,PCLOSE,S=300320110800,
E=300320111200";6)
As there is no more data available for this time region, the last cell (with index 6) will show n/a (not available).
RTD – Real-Time Data in Excel
396
TeleTrader Software GmbH
Marc-Aurel-Straße 10-12, 1010 Vienna, Austria
E-Mail [email protected]
Internet http://professional.teletrader.com
Retrieving tick data
Retrieve the last five ticks of the Dow Jones Industrial Average – note that the data will NOT update automatically
when new ticks come in (use live RTD links for ticking data):
=RTD("ProfRTD";;"History";"{394917},TICK,LAST,now";1)
=RTD("ProfRTD";;"History";"{394917},TICK,LAST,now";2)
=RTD("ProfRTD";;"History";"{394917},TICK,LAST,now";3)
=RTD("ProfRTD";;"History";"{394917},TICK,LAST,now";4)
=RTD("ProfRTD";;"History";"{394917},TICK,LAST,now";5)
Searching for Symbols with RTD
You can search for symbol IDs that are needed in other RTD formulas by using the symbol's ISIN, WKN, ticker or
name. Additional search options like exchange name, currency, strike price and expiration date are also available.
The search result will be shown with its symbol ID, allowing the user to reference the ID in other RTD requests (cell
references).
To search for symbols in Microsoft Excel (example)
▪
Open a Microsoft Excel spreadsheet.
▪
In the cell where you want the symbol ID to appear, type (or copy) the following formula:
=RTD("ProfRTD";;"Lookup";"Microsoft,NASDAQ")
▪
The symbol ID of the Microsoft stock on NASDAQ ( {829802} ) will be shown in the cell. If there is more than
one search result, the number of results will be shown and you will need to refine your search.
▪
You can now use this symbol ID in another RTD formula using cell references. This means that you use the
name of the Excel cell (e.g. A1) instead of the symbol ID for retrieving quote data, for example:
=RTD("ProfRTD";;"Live";A1&",Last")
▪
The request above will fetch the current Last price of the Microsoft stock on NASDAQ.
Syntax for Looking Up Symbols
In a Microsoft Excel spreadsheet, use the following syntax to look up symbol IDs with RTD:
=RTD("ProfRTD";;"Lookup";"<Identifier>, [<Exchange>,
<SymbolType>, <Currency>, <Strike>, <Expiration>, <Options>])
All parameters except Identifier are optional. If you want to skip a parameter, just add the comma, but leave out
the value, for example:
RTD – Real-Time Data in Excel
397
TeleTrader Software GmbH
Marc-Aurel-Straße 10-12, 1010 Vienna, Austria
E-Mail [email protected]
Internet http://professional.teletrader.com
=RTD("profrtd";;"Lookup";"FDAX,Eurex,,,,122011")
Note
The character you have to use for separating the different arguments of the RTD function (shown
as a semicolon ; above) depends on the regional configuration of your operating system. Under
Windows, you can change this configuration in the Control Panel.
Identifier
The name, ticker, ISIN or local ID (for example WKN) of a security. This is used as the search
term for looking up the symbol.
Exchange
Name of the exchange on which you want to search.
SymbolType
Type of symbol that you want to search for. The following types are available:
Stock
Future
Index
Currency
Warrant
Bond
Mutual Fund
Interest Rate
Option
Put Option
Call Option
Certificate
Currency
ISO code of the currency (for example EUR).
Strike
Strike price for options as a number.
Expiration
Expiration date (month/year) for options and futures in the format MMYYYY.
Options
Search options to control the search result. Currently two options are available:
EXACT
Only symbols whose ticker, name or ISIN match your search term
(Identifier) exactly will be part of the search result. This option is useful
when you use short tickers, for example F.
SHOW
The first returned symbol that matches your search term exactly will be
shown as the result. This option is useful when you want to show a symbol ID
in any case for the search result (instead of the message informing you that
more than one symbol has been found).
Tips and Examples for Looking Up Symbols
For using cell references and wrapper functions, see the Tips and Examples for Retrieving Live Data on page 392.
Note
For more examples of how to use TeleTrader Professional RTD, a sample Excel sheet is included
in the installation: Right-click the RTD tray icon and choose Help > Samples to open it. See also
Samples for the RTD Component on page 403.
Looking up an ISIN
If you look up an ISIN that is traded on several exchanges, it makes sense to add the exchange name in the formula
– here, an ISIN is looked up on Xetra:
RTD – Real-Time Data in Excel
398
TeleTrader Software GmbH
Marc-Aurel-Straße 10-12, 1010 Vienna, Austria
E-Mail [email protected]
Internet http://professional.teletrader.com
=RTD("profrtd";;"Lookup";"DE000BASF111,Xetra")
Looking up a ticker symbol
When you look up the Ford ticker on NYSE, you should use the option EXACT to get a result immediately, since there
are many tickers that start with F:
=RTD("profrtd";;"Lookup";"F,NYSE,,,,,EXACT")
Refining a search – step by step
Sometimes you have to refine your search based on the results that you get when looking for an options contract
(search result is shown in red below – in Microsoft Excel, the search result will be shown in the same cell where you
enter the formula).
Look up an option on Eurex, using the option's ISIN and type:
=RTD("profrtd";;"Lookup";"DE000BASF111,Eurex,Call Option")
Found 332 symbols. Please refine your search.
Add the strike price:
=RTD("profrtd";;"Lookup";"DE000BASF111,Eurex,Call Option,,48")
Found 13 symbols. Please refine your search.
Add the expiration date – this finally returns the symbol ID:
=RTD("profrtd";;"Lookup";"DE000BASF111,Eurex,Call
Option,,48,032012")
{28374544}
Symbol Syntax for Securities, Forwards and Continuous Contracts
As you know, when retrieving financial data with TeleTrader Professional RTD, you have to specify the internal
identification of the symbol for which you want to get data. A symbol is the unique identification given to every security
that is traded on an exchange or over-the-counter market (for example stocks, futures, options, indices and other
types of securities).
You can either use the symbol identification number (for example {829802} ) or its unique name (for example
MSFT_0FSPC). To find out the identification of a symbol, you can use the Lookup command to search for a symbol ID
within Excel (see Searching for Symbols with RTD on page 397), or you can display the necessary information in
TeleTrader Professional price pages. The symbol ID is also visible in the Chart Properties dialog for a symbol.
For futures contracts, additional functionality is available to create forwards and continuous contracts.
Note
We recommend to use symbol IDs, as unique names are subject to change (for example due to
changes on the side of the exchanges).
RTD – Real-Time Data in Excel
399
TeleTrader Software GmbH
Marc-Aurel-Straße 10-12, 1010 Vienna, Austria
E-Mail [email protected]
Internet http://professional.teletrader.com
Symbol identification numbers and unique names
Note
This requires an active subscription for TeleTrader Professional. If you don't have such a
subscription, we recommend to use the Lookup command instead (see Searching for Symbols
with RTD on page 397).
To display the symbol ID in price pages
▪
Start TeleTrader Professional and log in to your user account.
▪
Open a price page for the symbol(s) that you are interested in. You can for example use the QuickBar:
▪
-
Click an icon in the QuickBar.
-
In the menu that appears, select the group that you want to open, for example NASDAQ 100.
-
In the submenu, select All Symbols.
-
All symbols of this group are displayed in a price page.
Click in the row of the symbol and press F2. The symbol ID is displayed and can be copied from here.
To display symbol ID and unique name in separate price page columns
▪
Right-click the price page and choose Properties.
▪
In the Price Page Properties dialog, click Columns.
▪
From the Available Columns list, choose the column TID (for symbol ID) or TUN (for symbol unique name).
Note
To search for a column, type its name into the Filter field below the list.
▪
Click the >> button.
▪
The chosen column is now moved to the Displayed Columns list and is visible in the price page.
▪
You can copy the symbol ID or unique name by right-clicking the cell and choosing Copy as Text.
Forwards and continuous contracts
For futures symbols, you can use special syntax to create:
▫
Forwards, which means that you always retrieve data for the current front month or any defined forward month.
▫
Continuous contracts, which means that you combine data from several futures contracts using various
continuation settings to roll over from one contract to the next.
To create forwards and continuous contracts, you have to use the root symbol of a futures contract. Like with normal
symbols, root symbols have both a root symbol identification number and a unique name.
You can look up the root symbol ID of various futures contracts under this link:
http://company.ttweb.net/futureOverview/
Alternativey, you can also display the root symbol's unique name (TRUN) in price pages, or copy forwards and
continuous contracts from futures price pages in TeleTrader Professional by using F2.
To copy forwards and continuous contracts from price pages
▪
Open a price page with forwards or continuous contracts from the QuickBar, for example the Commodities
Futures Overview or a similar price page.
▪
Click in the row of the continuous contract or forward that you want to use and press F2. The root symbol ID and
correct syntax is displayed and can be copied from here. For more information about the syntax used for
continuous contracts and forwards, see further below.
RTD – Real-Time Data in Excel
400
TeleTrader Software GmbH
Marc-Aurel-Straße 10-12, 1010 Vienna, Austria
E-Mail [email protected]
Internet http://professional.teletrader.com
To display the root symbol's unique name in a price page column
▪
Right-click the price page and choose Properties
▪
In the Price Page Properties dialog, click Columns.
▪
From the Available Columns list, choose the column TRUN.
▪
Click the >> button.
▪
The chosen column is now moved to the Displayed Columns list and is visible in the price page.
▪
You can copy the unique name by right-clicking the cell and choosing Copy as Text.
Syntax for forwards
Forwards are created by adding a pound sign # before the root symbol identification, and adding the desired forward
month behind the symbol. The front month is given with 1-, the following month with 2- and so on.
#Symbol
Identification of the futures' root symbol. You can use the symbol ID or unique name.
;1;2...
Forward month. ;1- is the front month, ;2- the following month and so on.
To get the front month of Soybeans on CBOT, e.g. ZS 05/2011, you can use the root symbol ID as copied from a
price page in TeleTrader Professional:
#{866918};1-
The following month of Soybeans on CBOT, e.g. ZS 07/2011, can be specified in the following way:
#{866918};2-
The same request using the root symbol's unique name for Soybeans:
#F2:ZS_15U_SPC;2-
Syntax for continuous contracts
Continuous contracts are created by adding a percent sign % before the root symbol identification, and adding the
desired continuation settings behind the symbol as shown in the table below.
%Symbol
Identification of the futures' root symbol. You can use the symbol ID or unique name.
;FGHJKMNQUVXZn-
Contract expiration months that are used for creating the continuous contract. Can be any
ordered subset of FGHJKMNQUVXZ.
n- specifies the forward month, with 1- being the front month, 2- the following month and
so on.
Trigger
Condition that is used to trigger the rollover into the next contract.
;TR0DnXM0
Expiration date: Rollover will occur n days before the expiration date.
;TR0DnBMm
Beginning of month: Rollover will occur n days after the start of the
month in which the front month contract expires and m months before
the expiration month.
End of month: Rollover will occur n days before the end of the month
in which the front month contract expires and m months before the
;TR0DnEMm
RTD – Real-Time Data in Excel
401
TeleTrader Software GmbH
Marc-Aurel-Straße 10-12, 1010 Vienna, Austria
E-Mail [email protected]
Internet http://professional.teletrader.com
;TR1
;TR2
;TR3
;TR4
Timing
expiration month.
Open Interest: Rollover will be triggered when the open interest of the
next contract is higher than the open interest of the front month
contract.
Volume: Rollover will be triggered when the volume of the next contract
is higher than the volume of the front month contract.
Open interest and volume: Rollover will be triggered when both open
interest and volume of the next contract are higher than the open
interest and volume of the front month contract.
Open interest or volume: Rollover will be triggered when either open
interest or volume of the next contract are higher than the open interest
or volume of the front month contract.
Optional. Determines when the rollover takes place as soon as the trigger condition is
met.
;T0
;T1
;T2
Anticipate: Rollover will occur on the exact date that you specify in the
trigger settings.
Align with price data: Rollover will occur on the day after the rollover
was triggered with an open interest or volume trigger. The day after the
trigger will already start with the Open price of the new contract.
When known: Rollover will occur two days after the rollover was
triggered with an open interest or volume trigger. The day after the
trigger will still show the prices of the old contract, the Open price of the
new contract will start the following day.
Default: ;T1
Pricing
Optional. Determines how the price difference between the old and the new contract is
calculated to splice the contracts together.
;PCC
;POO
;PCO
Close old contract, close new contract: The Close price of the
current contract is compared with the Close price of the previous
contract on the same day.
Open old contract, open new contract: The Open price of the current
contract is compared with the Open price of the previous contract on
the same day.
Close old contract, open new contract: The Open price of the current
contract is compared with the Close price of the previous contract from
the previous day.
Default: ;PCC
Accumulation
Optional. Determines if the prices of older contracts are adjusted to the current contract,
and in what way.
;AB
;AP
;AN
Back adjust: The absolute price difference between the current
contract and the previous contract is added to or subtracted from all
older contracts.
Percentage adjust: The price difference between the current contract
and previous contract is calculated as a percentage. The prices of older
contracts are adjusted by this percentage.
No adjustment: The prices of older contracts are not adjusted to the
price of the current contract. Gaps may be visible in the chart on
rollover.
Default: ;AB
RTD – Real-Time Data in Excel
402
TeleTrader Software GmbH
Marc-Aurel-Straße 10-12, 1010 Vienna, Austria
E-Mail [email protected]
Internet http://professional.teletrader.com
Confirmation
Optional. Details for the open interest or volume rollover conditions.
;C1
Roll on first trigger
;C2
Roll on second consecutive trigger
;C3
Roll on third consecutive trigger
;C4
Roll on fourth consecutive trigger
Default: ;C1
For example, the following FDAX continuous contract uses the root symbol ID of DAX Futures. Rollover will occur 2
days before the expiration date:
%{413719};FGHJKMNQUVXZ1-;TR0D-2XM0;T1;PCC;AB
If rollover should be triggered by open interest instead, a different trigger setting must be used:
%{413719};FGHJKMNQUVXZ1-;TR1;T1;PCC;AB;C1
Samples for the RTD Component
For some examples of how to use TeleTrader Professional RTD, a sample Excel sheet is included in the installation.
It contains samples for retrieving live data, historical data, market depth data, VWAPs, studies and a complete field
reference. You can easily copy the reusable samples to your own Excel tables and tweak them there.
To open the sample Excel sheet
▪
In the Windows system tray, right-click the RTD icon:
▪
Choose Help > Samples.
To copy RTD formulas with a fixed symbol
Samples with fixed symbols contain the symbol ID as a fixed value in the RTD formula. If you copy the formula, you
must replace the sample symbol ID with the one that you want to use:
▪
Copy the formula from the sample document, for example:
=RTD("profrtd";;"Live";"{458757},Name")
▪
Insert the formula in the target document and replace the highlighted part with the new symbol ID, for example:
=RTD("profrtd";;"Live";"{49317942},Name")
To copy RTD formulas with a variable symbol
Samples with variable symbols take advantage of Excel's cell references: The RTD formula contains the symbol ID as
a cell reference. You can enter a new symbol ID in the highlighted Symbol ID cell in the sample, and all formulas will
automatically be calculated for this new symbol ID. If you copy the formulas, you can either include the cell that holds
the symbol ID if you want to keep the flexibility, or you can replace the cell references in each RTD formula with the
fixed symbol ID (using search & replace):
▪
Copy the data from the sample document and insert it in the target document
RTD – Real-Time Data in Excel
403
TeleTrader Software GmbH
Marc-Aurel-Straße 10-12, 1010 Vienna, Austria
E-Mail [email protected]
Internet http://professional.teletrader.com
▪
Search for the cell reference in all formulas, for example:
=RTD("profrtd";;"Live";B25&",Name")
▪
Replace with the symbol ID (in quotes), for example:
=RTD("profrtd";;"Live";"{458757}"&",Name")
To copy RTD formulas with a variable symbol with LOOKUP
For maximum flexibility, some samples use the Lookup command to determine the symbol ID used in the RTD
formulas. These samples can be used if you don't know your security's symbol ID. Use the search form (LOOKUP) to
find out the correct symbol ID; the found symbol ID is then used automatically (by using cell references) in all RTD
formulas of the sample. When you want to copy the formulas, make sure that you convert the cell reference in the
highlighted Symbol ID field to the actual symbol ID before copying the formulas:
▪
Click into the formula bar of the field that holds the symbol ID, e.g. =C14
▪
Press the F9 key to convert the cell reference to a fixed value, e.g. {458757}
▪
Copy the data from the sample document and insert it in the target document.
▪
If you did not include the Symbol ID cell while copying, you must now search & replace the cell references in the
RTD formulas of the target document (see above).
Note
You can of course also copy the LOOKUP box to your target document, if you want to keep the
flexibility of a sample.
Troubleshooting the RTD Component
If you experience problems with retrieving data in Microsoft Excel, you will find tips about recommended settings in
Microsoft Excel below to solve some of the most common problems.
Possible Issues in Microsoft Excel
Microsoft Excel only refreshes RTD data periodically, based on a system-wide throttle interval named
Excel.Application.RTD.ThrottleInterval. This interval is automatically set to 100 milliseconds on
installation of TeleTrader Professional RTD in the registry (exception: If the throttle interval has already been set by
another application to a value lower than 100, it is left unchanged). You can configure the throttle interval (in
milliseconds) by using either Visual Basic/VBA or the registry:
▫
With Visual Basic / VBA, you can set Application.RTD.ThrottleInterval in immediate mode or in a
startup handler.
▫
In the registry, you can change the registry value:
HKEY_CURRENT_USER\Software\Microsoft\Office\10.0\Excel\Options\RTDThrottleInterval (for Excel 2002)
HKEY_CURRENT_USER\Software\Microsoft\Office\11.0\Excel\Options\RTDThrottleInterval (for Excel 2003)
HKEY_CURRENT_USER\Software\Microsoft\Office\12.0\Excel\Options\RTDThrottleInterval (for Excel 2007).
For more information, please refer to the following Microsoft FAQ item from MSDN:
http://msdn.microsoft.com/en-us/library/aa140060%28office.10%29.aspx#odc_xlrtdfaq_howconfigrtdthrottle
RTD – Real-Time Data in Excel
404
TeleTrader Software GmbH
Marc-Aurel-Straße 10-12, 1010 Vienna, Austria
E-Mail [email protected]
Internet http://professional.teletrader.com
Copying Calculated Watch List Columns
If you want to copy the content of calculated watch list columns like Total P/L or P/L Perc to Excel, you have to
change the formula options in the Excel Options dialog to use a different reference style. Click Formulas, and under
Working with formulas select the option R1C1 reference style.
In some cases, the calculated values of watch lists are not rounded correctly, resulting in displayed numbers like for
example 1.78E-15. In this case, you have to highlight the affected cells in Excel. Then, right-click on the selection and
click Format Cells. Choose Number and the amount of decimal places that you want to show. The calculated values
should then be rounded according to your settings.
Microsoft Excel 2007 Security Settings
Microsoft Excel 2007 has very tight security settings. Sometimes, when you open a saved spreadsheet with RTD
links, the data is not being updated even though TeleTrader Professional RTD is running and visible in the system
tray.
If this is the case, you can try to change the security settings in the Excel Options dialog. Click Trust Center, and
then click the button Trust Center Settings. Change the settings under External Content to your needs. The macro
security settings need to be set to "low" or "medium".
Available Field Names
For live RTD links, the following field names can be used. In this list you see the column names (used in TeleTrader
Professional price pages) in alphabetic order, the field name that you must use for RTD links, and an optional
description of the field.
Note
For most financial information, you can retrieve figures for a specific year by adding the year in
square brackets after the field name, for example
CompanyRatioNetEarningsPerShare[2010]. Those fields are marked with the note (years
available).
TeleTrader
Professional Column
RTD Field Name
Description
Ask
Ask
Best Ask price
AskDateTime
AskDateTime
Date and time of the best Ask price
AskDateTimeNotNull
AskDateTimeNotNull
Date and time of the best Ask price
(never null)
AskHigh
AskHigh
Highest Ask from last trading day
or session
AskLow
AskLow
Lowest Ask from last trading day or
session
AskNotNull
AskNotNull
Best Ask price (never null)
AskSize
AskSize
Size of the best Ask price
AskSizeNotNull
AskSizeNotNull
Size of the best Ask price (never
null)
AskSup
AskSup
Supplement to the Ask price
AskSupNotNull
AskSupNotNull
Supplement to the Ask price (never
null)
AskTotal
AskTotal
Accumulated Ask Size, available
Quote Information
RTD – Real-Time Data in Excel
405
TeleTrader Software GmbH
Marc-Aurel-Straße 10-12, 1010 Vienna, Austria
E-Mail [email protected]
Internet http://professional.teletrader.com
only on Belgrade Stock Exchange
Auction_MOI
AuctionMOI
Auction Market Order Interruption
Indicator
Auction_VI
AuctionVI
Auction Volatility Interruption
Indicator
AvgPrice1M
Average Price 1M
Average price of the last month
AvgPrice1Y
Average Price 1Y
Average price of the last year (last
52 weeks)
AvgPriceMTD
Average Price MTD
Average price of the current month
(month-to-date)
AvgPricePrevM
Average Price Previous Month
Average price of the previous
month
AvgPricePrevQ
Average Price Previous Quarter
Average price of the previous
quarter
AvgVolume1M
Average Volume 1M
Average volume of the last month
AvgVolume1Y
Average Volume 1Y
Average volume of the last year
(last 52 weeks)
Bid
Bid
Best Bid price
BidDateTime
BidDateTime
Date and time of the best Bid price
BidDateTimeNotNull
BidDateTimeNotNull
Date and time of the best Bid price
(never null)
BidHigh
BidHigh
Highest Bid from last trading day or
session
BidLow
BidLow
Lowest Bid from last trading day or
session
BidNotNull
BidNotNull
Best Bid price (never null)
BidSize
BidSize
Size of the best Bid price
BidSizeNotNull
BidSizeNotNull
Size of the best Bid price (never
null)
BidSup
BidSup
Supplement to the Bid price
BidSupNotNull
BidSupNotNull
Supplement to the Bid price (never
null)
BidTotal
BidTotal
Accumulated Bid Size, available
only on Belgrade Stock Exchange
Change
Change
Change of the last trading day or
session
Change%
PercChg
Percent change of the last trading
day or session
ChgLast
ChgLast
Absolut change of the last price
ChgLast%
ChgLastPerc
Percent change of the last price
ChgSettle
ChangeSettle
Absolut change of the last price
compared to last settlement value
ChgSettle%
ChgSettlePerc
Percent change of the last price
compared to last settlement value
ChgTo
ChangeToday
Change of todays trading session
only
ChgTo%
PercChgToday
Percent change of todays trading
session only
RTD – Real-Time Data in Excel
406
TeleTrader Software GmbH
Marc-Aurel-Straße 10-12, 1010 Vienna, Austria
E-Mail [email protected]
Internet http://professional.teletrader.com
Contr
Contributor
Contributor of the last Bid, Ask and
Last price (Forex only)
Date
Date
Date of the last price
DateTime
DateTime
Date and time of the last price
FirstClose
First Close
Close from the first day of trading
FirstDate
First Trading Date
Date of the first day of trading
High
High
Highest quote from last trading day
or session
High1M
High 1M
Highest quote in the last month
High1W
High 1W
Highest quote in the last week
High1Y
High 1Y
Highest quote in the last year (last
52 weeks)
High3M
High 3M
Highest quote in the last three
months
High3Y
High 3Y
Highest quote in the last three
years
High5Y
High 5Y
Highest quote in the last five years
HighDate1Y
High Date 1Y
Date on which the highest quote in
the last year (last 52 weeks)
occured
HighDatePrevY
High Date Previous Year
Date on which the highest quote in
the previous year (the year before
the current calendar year) occured
HighDateYTD
High Date YTD
Date on which the highest quote in
the current year (year-to-date)
occured
HighPrevY
High Previous Year
Highest quote in the previous year
(the year before the current
calendar year)
HighYTD
High YTD
Highest quote in the current year
(year-to-date)
Historical10Y
Historical Close 10Y
Close ten years before current date
Historical1M
Historical Close 1M
Close one month before current
date
Historical1W
Historical Close 1W
Close one week before current
date
Historical1Y
Historical Close 1Y
Close one year before current date
Historical2Y
Historical Close 2Y
Close two years before current
date
Historical3M
Historical Close 3M
Close three months before current
date
Historical3Y
Historical Close 3Y
Close three years before current
date
Historical4Y
Historical Close 4Y
Close four years before current
date
Historical5Y
Historical Close 5Y
Close five years before current
date
Historical6M
Historical Close 6M
Close six months before current
date
RTD – Real-Time Data in Excel
407
TeleTrader Software GmbH
Marc-Aurel-Straße 10-12, 1010 Vienna, Austria
E-Mail [email protected]
Internet http://professional.teletrader.com
HistoricalYTD
Historical Close YTD
Close from the first trading session
of the current year (year-to-date)
IndPrice
IndPrice
Indicative price calculated by the
exchange
Last
Last
Last price
LastSup
LastSup
Supplement to the Last price
Low
Low
Lowest quote from last trading day
or session
Low1M
Low 1M
Lowest quote in the last month
Low1W
Low 1W
Lowest quote in the last week
Low1Y
Low 1Y
Lowest quote in the last year (last
52 weeks)
Low3M
Low 3M
Lowest quote in the last three
months
Low3Y
Low 3Y
Lowest quote in the last three
years
Low5Y
Low 5Y
Lowest quote in the last five years
LowDate1Y
Low Date 1Y
Date on which the lowest quote in
the last year (last 52 weeks)
occured
LowDatePrevY
Low Date Previous Year
Date on which the lowest quote in
the previous year (the year before
the current calendar year) occured
LowDateYTD
Low Date YTD
Date on which the lowest quote in
the current year (year-to-date)
occured
LowPrevY
Low Previous Year
Lowest quote in the previous year
(the year before the current
calendar year)
LowYTD
Low YTD
Lowest quote in the current year
(year-to-date)
MPh
MarketPhase
Indicates the current Market Phase
NumT
NumTicks
Number of trades or ticks on that
day
OI
OI
Number of outstanding contracts at
the end of the day
OIDateTime
OIDateTime
Date and time of the Open Interest
Open
Open
Opening quote from last trading
day or session
P2Ask
P2Ask
Ask value at the end of the day
before the previous trading day or
session
P2AskDateTime
P2AskDateTime
Date/Time of the Ask value at the
end of the day before the previous
trading day or session
P2Bid
P2Bid
Bid value at the end of the day
before the previous trading day or
session
P2BidDateTime
P2BidDateTime
Date/Time of the Bid value at the
end of the day before the previous
RTD – Real-Time Data in Excel
408
TeleTrader Software GmbH
Marc-Aurel-Straße 10-12, 1010 Vienna, Austria
E-Mail [email protected]
Internet http://professional.teletrader.com
trading day or session
P2Close
P2Close
Close from the day before the
previous trading day or session
P2Date
P2Date
Date from the day before the
previous trading day or session
P2High
P2High
High from the day before the
previous trading day or session
P2Low
P2Low
Low from the day before the
previous trading day or session
P2NumT
P2NumTicks
Number of trades in the day before
the previous trading day or session
P2Open
P2Open
Open from the day before the
previous trading day or session
P2Volume
P2Volume
Volume from the day before the
previous trading day or session
PAsk
PAsk
Ask value at the end of the
previous trading day or session
PAskDateTime
PAskDateTime
Date/Time of the Ask value at the
end of the previous trading day or
session
PBid
PBid
Bid value at the end of the previous
trading day or session
PBidDateTime
PBidDateTime
Date/Time of the Bid value at the
end of the previous trading day or
session
PChg
PChg
Change from the previous trading
day or session
PClose
PClose
Close from the previous trading
day or session
PDate
PDate
Date of the previous trading day or
session
Perf1W
Perf1W
Performance in the last week
Perf1M
Perf1M
Performance in the last month
Perf3M
Perf3M
Performance in the last three
months
Perf6M
Perf6M
Performance in the last six months
PerfYTD
PerfYTD
Performance in the current year
(year-to-date)
Perf1Y
Perf1Y
Performance in the last year
Perf2Y
Perf2Y
Performance in the last two years
Perf3Y
Perf3Y
Performance in the last three years
Perf4Y
Perf4Y
Performance in the last four years
Perf5Y
Perf5Y
Performance in the last five years
Perf10Y
Perf10Y
Performance in the last ten years
PerfStart
PerfStart
Performance since the first trading
day
PHigh
PHigh
High from the previous trading day
or session
PLow
PLow
Low from the previous trading day
RTD – Real-Time Data in Excel
409
TeleTrader Software GmbH
Marc-Aurel-Straße 10-12, 1010 Vienna, Austria
E-Mail [email protected]
Internet http://professional.teletrader.com
or session
PNumT
PNumTicks
Number of trades in the previous
trading day or session
POpen
POpen
Open from the previous trading day
or session
PVolume
PVolume
Total volume from the previous
trading day or session
Settle
Settle
Settlement price
SurplInd
SurplInd
Surplus Indicator
SurplQty
SurplQty
Surplus Quantity
TickTrend
TickTrend
Trend of the last 10 ticks, + means
up, - means down, . means equal
Time
Time
Time of the last price
Turnover
Turnover
Total volume traded, each trade
multiplied with its volume
Turnover10Y
Turnover 10Y
Turnover in the last ten years
Turnover1M
Turnover 1M
Turnover in the last month
Turnover1W
Turnover 1W
Turnover in the last week
Turnover1Y
Turnover 1Y
Turnover in the last year (last 52
weeks)
Turnover2Y
Turnover 2Y
Turnover in the last two years
Turnover3M
Turnover 3M
Turnover in the last three months
Turnover3Y
Turnover 3Y
Turnover in the last three years
Turnover4Y
Turnover 4Y
Turnover in the last four years
Turnover5Y
Turnover 5Y
Turnover in the last five years
Turnover6M
Turnover 6M
Turnover in the last six months
TurnoverEuro1M
Turnover Euro 1M
Turnover in the last month in Euro
TurnoverYTD
Turnover YTD
Turnover in the current year (yearto-date)
Vol
Volume
Total volume of the last trading day
or session
Volatility1M
Volatility 1M
Volatility in the last month
Volatility1Y
Volatility 1Y
Volatility in the last year (last 52
weeks)
Volatility6M
Volatility 6M
Volatility in the last six months
VolLast
VolLast
Volume of the last price
Volume10Y
Volume 10Y
Total volume traded in the last ten
years
Volume1M
Volume 1M
Total volume traded in the last
month
Volume1W
Volume 1W
Total volume traded in the last
week
Volume1Y
Volume 1Y
Total volume traded in the last year
(last 52 weeks)
Volume2Y
Volume 2Y
Total volume traded in the last two
years
Volume3M
Volume 3M
Total volume traded in the last
RTD – Real-Time Data in Excel
410
TeleTrader Software GmbH
Marc-Aurel-Straße 10-12, 1010 Vienna, Austria
E-Mail [email protected]
Internet http://professional.teletrader.com
three months
Volume3Y
Volume 3Y
Total volume traded in the last
three years
Volume4Y
Volume 4Y
Total volume traded in the last foru
years
Volume5Y
Volume 5Y
Total volume traded in the last five
years
Volume6M
Volume 6M
Total volume traded in the last six
months
VolumeYTD
Volume YTD
Total volume traded in the current
year (year-to-date)
VWAP
VWAP
Volume Weighted Average Price
VWAP_Chg
VWAPChg
VWAP Change to Prev VWAP
VWAP_Chg%
VWAPChgPerc
VWAP Change % to Prev VWAP
VWAP_DatePrev
VWAPDatePrev
VWAP DateTime from Previous
Trading Day
VWAP_DatePrev2
VWAPDatePrev2
VWAP DateTime from day before
VWAP_DateTime
VWAPTime
VWAP DateTime
VWAP_NetChg
VWAPNetChg
VWAP NetChange to Prev VWAP
VWAP_NetChg%
VWAPNetChgPerc
VWAP NetChange % to Prev
VWAP
VWAP_NEtChgPrev
VWAPNetChgPrev
VWAP Prev NetChange to Day
Before VWAP
VWAP_NetChgPrev%
VWAPNetChgPrevPerc
VWAP Prev NetChange % to Day
Before VWAP
VWAP_NetChgTO
VWAPNetChgTO
VWAP NetChange Today to Prev
VWAP
VWAP_NetChgTO%
VWAPNetChgTOPerc
VWAP NetChange % Today to
Prev VWAP
VWAP_NetChgTS
VWAPNetChgTS
VWAP NetChange TradingSession
to Prev VWAP
VWAP_NetChgTS%
VWAPNetChgTSPerc
VWAP NetChange %
TradingSession to Prev VWAP
VWAP_PREV
VWAPPrev
VWAP from Previous Trading Day
VWAP_Prev2
VWAPPrev2
VWAP from Day Before
ContractMonths
ContractMonths
Contract months of a futures
contract.
ContrSz
ContrSz
Contract size for options and
futures contracts
CQuantity
CQuantity
Contract size quantity of a futures
contract
CuID
Curr
The ID of the currency for the
symbol
CUnit
CUnit
Contract size unit of a futures
contract (for example "bushels" for
corn futures)
Symbol information
RTD – Real-Time Data in Excel
411
TeleTrader Software GmbH
Marc-Aurel-Straße 10-12, 1010 Vienna, Austria
E-Mail [email protected]
Internet http://professional.teletrader.com
Curr
CurrISO
The ISO code of the currency for
the symbol
DailyPriceLimit
DailyPriceLimit
Maximum amount a futures
contract is allowed to rise or fall on
a single trading day.
ExchName
ExchName
Exchange Name
ExpDate
ExpDate
Expiration data of futures and
options contracts. The time shown
is not the time where trading ends!
ExpMonth
ExpMonth
Month where the contract expires
ExpYear
ExpYear
Year where the contract expires
FXUnit
FXUnit
Exchange rate unit
FilteredPutCallRatio
FilteredPutCallRatio
Filtered PUT/CALL ratio.
ISIN
ISIN
International security identification
number
LocalID
LocalID
Identification code used locally on
the exchange
LocalIDType
LocalIDType
Type of the identification code
used locally on the exchange
LongName
LongName
Descriptive name of futures and
options contracts
MinTickSize
MinTickSize
Minimum price increment of a
futures contract
Name
Name
Full name of the symbol
OptVersion
OptVersion
Version number of options contract
PointValue
PointValue
Point value of a futures contract.
PutCallRatio
PutCallRatio
Put Call Ratio for Options
QuoteDenominator
QuoteDenominator
Denominator for the price quote of
a futures contract (for example 100
if quoted in cents per bushel)
Remark
Remark
Optional remark for the description
of a futures contract.
SettlementType
SettlementType
Type of settlement of a futures
contract.
Strike
Strike
Strike price
Ticker
Ticker
Ticker name given by the
exchange
TickValue
TickValue
Tick value of a futures contract.
TradingHours
TradingHours
Trading hours of a futures contract.
Type
Type
Type of the symbol
UndCategory
UndCategory
Category of the underlying asset or
instrument of a futures contract.
UndSegment
UndSegment
Segment of the underlying asset or
instrument of a futures contract.
UndSubCategory
UndSubCategory
Subcategory of the underlying
asset or instrument of a futures
contract.
WKN
WKN
German or Austrian symbol
RTD – Real-Time Data in Excel
412
TeleTrader Software GmbH
Marc-Aurel-Straße 10-12, 1010 Vienna, Austria
E-Mail [email protected]
Internet http://professional.teletrader.com
number
Extra information
Buy
Buy
New buy order - No data available
in RTD
Delay
Delay
Delay of the symbol
Kursblatt
Kursblatt
The so called "Kursblatt Number"
MarketSeg
MarketSeg
Market Segment the Symbol is
traded in
Sell
Sell
New sell order - No data available
in RTD
StatDB
StatDB
Database status of the Symbol
StorageServer
StoringServer
Storage Server Name
Text
Text
Text column - No data available in
RTD
TID
TID
Unique numeric ID for a symbol
TradeSeg
TradeSeg
Trading Segment the Symbol is
traded in
TRUN
TRUN
Unique root symbol ID for a symbol
TUN
TUN
Unique symbol ID for a symbol
Annuals web address
Annuals_www
Direct link to annuals reports
section on the companies website
BB from
BbDateFrom
Bookbuilding starting date
BB Price from
BbPriceFrom
Bookbuilding lower price limit
BB Price to
BbPriceTo
Bookbuilding upper price limit
BB to
BbDateTo
Bookbuilding end date
Bearer
IsBearer
"yes" if the security is a bearer
share, "no" if it is a name share
Board
Board
Board
BV
R_BookValuePerShare
Book value per share
BV
CompanyRatioBookValuePerShare[2014
]
Book value per share (years
available)
Calc. Date
CompanyRatioCalculation Date
Date where the calculated Ratios
were last updated
Calc. Date
CompanyRatioCalculation Date[2014]
Date where the Ratios were
calculated (years available)
Calendar web address
Calendar_www
Direct link to company calendar
part on the companies website
CEO
CEO
CEO
CF I
R_CFPerShareI
Cash flow per share I
CF I
CompanyRatioCFPerShareI[2014]
Cash flow per share I (years
available)
CF II
R_CFPerShareII
Cash flow per share II
CF II
CompanyRatioCFPerShareII[2014]
Cash flow per share II (years
Company Information
RTD – Real-Time Data in Excel
413
TeleTrader Software GmbH
Marc-Aurel-Straße 10-12, 1010 Vienna, Austria
E-Mail [email protected]
Internet http://professional.teletrader.com
available)
City
City
City
Company web address
CompanyPart_www
Direct link to company information
on the companies website
Country
CountryID
Country of residence
Dividend yield
R_DividendYield
Dividend yield
Dividend yield
CompanyRatioDividendYield[2014]
Dividend yield (years available)
Earnings yield I
R_EarningsYieldI
Earnings yield I
Earnings yield I
CompanyRatioEarningsYieldI[2014]
Earnings yield I (years available)
Earnings yield II
R_EarningsYieldII
Earnings yield II
Earnings yield II
CompanyRatioEarningsYieldII[2014]
Earnings yield II (years available)
Earnings yield III
R_EarningsYieldIII
Earnings yield III
Earnings yield III
CompanyRatioEarningsYieldIII[2014]
Earnings yield III (years available)
Email
Email
E-mail address
Face value
FaceValue
Face value
Face Value Currency
FaceValueCurrencyId
Currency of the stocks Face value
Fax
Fax
Fax number
First day Close
FDayClose
Closing price of the first trading day
First day Open
FDayOpen
Opening price of the first trading
day
Fiscal year end
FiscalYearEnd
Fiscal year end
Free Float
FreeFloat
Percentage of freely floated shares
that are traded and held by the
public.
Free Float Market Cap
R_FreeFloatMarketCap
Free Float market capitalization
Greenshoe
Greenshoe
Number of shares offered as
Greenshoe
Has Face Value
HasFaceValue
Security with face value
Industry
CompanyIndustry
Industry
IPO date
IPODate
IPO date
IR Contact
IRelationsName
Name of Investor Relations contact
person
IR Email
IRelationsEmail
Fax number of Investor Relations
contact person
IR Fax
IRelationsFax
E-mail of Investor Relations
contact person
IR Phone
IRelationsPhone
Telephone number of Investor
Relations contact person
IR web address
IR_www
Direct link to Investor Relations
area on the companies website
IR2 Contact
IR2Name
Name of the second Investor
Relations contact person
IR2 Fax
IR2Fax
Fax number of the second Investor
Relations contact person
IR2 Telefon
IR2Telefon
Telephone number of the second
Investor Relations contact person
RTD – Real-Time Data in Excel
414
TeleTrader Software GmbH
Marc-Aurel-Straße 10-12, 1010 Vienna, Austria
E-Mail [email protected]
Internet http://professional.teletrader.com
Issue price
IssuePrice
Final issue price of IPO
Issue Type
IssueTypeID
Issue type name
Lead manager
LeadManager
Lead manager of the IPO
Liquid Assets
R_LiquidAssetsPerShare
Liquid assets per share
Liquid Assets
CompanyRatioLiquidAssetsPerShare[2
014]
Liquid assets per share (years
available)
Market capitalization
R_MarketCap
Market capitalization
Market capitalization
CompanyRatioMarketCap[2014]
Market capitalization (years
available)
MC/EBITDA
R_MarketCapEBITDA
Market capitalization / EBITDA
MC/EBITDA
CompanyRatioMarketCapEBITDA[2014]
Market capitalization / EBITDA
(years available)
MCPE
R_MarketCapPerEmployee
Marketet capitalization per
employee
MCPE
CompanyRatioMarketCapPerEmployee[2
014]
Marketet capitalization per
employee (years available)
Net Assets
R_NetAssetsPerShare
Net assets per share
Net Assets
CompanyRatioNetAssetsPerShare[2014
]
Net assets per share (years
available)
Net EPS
R_NetEarningsPerShare
Net earnings per share (EPS),
calculated
Net EPS
CompanyRatioNetEarningsPerShare[20
14]
Net earnings per share (EPS),
calculated (years available)
Net EPS 2
R_NetEarningsWithoutExtraPerShare
Net earnings without extraordinary
income or loss per share
Net EPS 2
CompanyRatioNetEarningsWithoutExtr
aPerShare[2014]
Net earnings without extraordinary
income or loss per share (years
available)
PBVR
R_PriceBookValue
Price book value ratio
PBVR
CompanyRatioPriceBookValue[2014]
Price book value ratio (years
available)
PCFR I
R_PriceCFI
Price-to-cash flow ratio I
PCFR I
CompanyRatioPriceCFI[2014]
Price-to-cash flow ratio I (years
available)
PCFR II
R_PriceCFII
Price-to-cash flow ratio II
PCFR II
CompanyRatioPriceCFII[2014]
Price-to-cash flow ratio II (years
available)
PE I
R_PriceEarnings
Price earnings ratio I with EPS
Basic
PE I
CompanyRatioPriceEarnings[2014]
Price earnings ratio I with
calculated EPS (years available)
PE II
R_PriceEPSBasic
Price earnings ratio II with
calculated EPS
PE II
CompanyRatioPriceEPSBasic[2014]
Price earnings ratio II with EPS
Basic (years available)
PE III
R_PriceEarningsWithoutExtra
Price earnings ratio III without
extraordinary income or loss
PE III
CompanyRatioPriceEarningsWithoutEx
tra[2014]
Price earnings ratio III without
extraordinary income or loss (years
RTD – Real-Time Data in Excel
415
TeleTrader Software GmbH
Marc-Aurel-Straße 10-12, 1010 Vienna, Austria
E-Mail [email protected]
Internet http://professional.teletrader.com
available)
PEG I
R_PEGI
PEG (Price-earnings-to-growth) I
PEG I
CompanyRatioPEGI[2014]
PEG (Price-earnings-to-growth) I
(years available)
PEG II
R_PEGII
PEG (Price-earnings-to-growth) II
PEG II
CompanyRatioPEGII[2014]
PEG (Price-earnings-to-growth) II
(years available)
PEG III
R_PEGIII
PEG (Price-earnings-to-growth) III
PEG III
CompanyRatioPEGIII[2014]
PEG (Price-earnings-to-growth) III
(years available)
Phone
Phone
Telephone number
Profile
BusinessDescrEng
Business description
PRR
R_PriceRevenues
Price-to-revenues ratio
PRR
CompanyRatioPriceRevenues[2014]
Price-to-revenues ratio (years
available)
Revenues
R_RevenuesPerShare[2014]
Revenues per share (years
available)
Revenues
CompanyRatioRevenuesPerShare[2014]
Revenues per share (years
available)
Sector
SectorID
Sector
Shares offered
SharesOffered
Number of shares offered during
IPO
Stockholders Structure
Stockholders Structure
Stockholders Structure
Street
Street
Street address
Sub sector
SubSectorID
Sub sector
Supervisory board
SupervisoryBoard
Supervisory board
Underwriter group
UnderwriterGroup
Group of underwriters
WWW
WWW
Internet address
Accounting standard
AccountingStandardID[2014]
Accounting standard (years
available)
Accounts payable
BS_L_Ind_AccountPayble[2014]
Accounts payable (years available)
Accounts receivable
BS_A_ReceivablesLoansTotal[2014]
Accounts receivable (years
available)
Administrative
expenses
IS_AdministrativeExpenses[2014]
Administrative expenses (years
available)
Affiliated party
receivables
BS_A_Ind_ReceivablesRelatedPart[20
14]ies
Affiliated party receivables (years
available)
Allowances
BS_A_Allowances[2014]
Allowance for credit losses (years
available)
Amortisation
IS_Ammortisation[2014]
Amortisation (years available)
Associated party
receivables
BS_A_Ind_ReceivablesShareholders[2
014]
Associated party receivables
(years available)
Benefits
IS_Ins_Benefits[2014]
Benefits (years available)
Book value
R_BookValue[2014]
Book value (years available)
Financial Figures
RTD – Real-Time Data in Excel
416
TeleTrader Software GmbH
Marc-Aurel-Straße 10-12, 1010 Vienna, Austria
E-Mail [email protected]
Internet http://professional.teletrader.com
Book value per share
growth rate
R_BookValuePerShareGrowth[2014]
Book value per share growth rate
(years available)
Capital expenditures
CFCapitalExpenditures[2014]
Capital expenditure and financial
investment (years available)
Capital resereves
BS_L_CapitalPaidIn[2014]
Capital resereves (years available)
Cash
BS_A_Cash[2014]
Cash and cash equivalents (years
available)
Cash at the end of the
year
CFCashAtYearEnd[2014]
Cash at the end of the year (years
available)
Cash Flow
CFCashFlow[2014]
Cash Flow (years available)
Cash flow growth rate
R_CFGrowth[2014]
Cash flow growth rate (years
available)
Cash flow marge I
R_CFMargeI[2014]
Cash flow marge I (years available)
Cash flow marge II
R_CFMargeII[2014]
Cash flow marge II (years
available)
Cash flow ROA I
R_CFROAI[2014]
Cash flow ROA I (years available)
Cash flow ROA II
R_CFROAII[2014]
Cash flow ROA II (years available)
Cash flow ROE I
R_CFROEI[2014]
Cash flow ROE I (years available)
Cash flow ROE II
R_CFROEII[2014]
Cash flow ROE II (years available)
Cash Flow, total
CFCashFlowTotal[2014]
Decrease/increase in cash in the
year (years available)
CF from financing
CFFinancing[2014]
Cash flow from financing (years
available)
CF from investing
CFInvesting[2014]
Cash flow from investing activities
(years available)
CF from operations
CFOperations[2014]
Cash flow from operating activities
(years available)
Claims expenses, net
IS_Ins_ClaimsExpensesNet[2014]
Total expences for claims (net),
Benefits payble to policyoldrs, net
(years available)
Commisions expenses
IS_Ins_CommisionsExpenses[2014]
Commisions expenses (years
available)
Commission fee,
expenses
IS_Bank_CommissionFeeExpenses[2014
]
Fees and commission payable
(years available)
Commission fee,
income
IS_Bank_CommissionFeeIncome[2014]
Fees and commission receivable
(years available)
Common stock
BS_L_CommonStock[2014]
Common stock (years available)
Core Capital
BS_L_Bank_CoreCapital[2014]
Core Capital (years available)
Cost of goods sold
IS_Ind_CostOfGoodsSold[2014]
Cost of goods sold (years
available)
Costs of materials
IS_Ind_CostsOfMaterials[2014]
Other administrative expences
(Material costs) (years available)
Costs of materials rate
R_CostsOfMaterialsRate[2014]
Costs of materials rate (years
available)
Currency BS
CurrencyBS[2014]
Balance sheet currency (years
available)
Current assets
BS_A_Ind_CurrAssetsTotal[2014]
Current assets (years available)
Debt capital
R_DebtCapital[2014]
Debt capital (years available)
RTD – Real-Time Data in Excel
417
TeleTrader Software GmbH
Marc-Aurel-Straße 10-12, 1010 Vienna, Austria
E-Mail [email protected]
Internet http://professional.teletrader.com
Debt equity ratio
R_DebtEquityRatio[2014]
Debt equity ratio (years available)
Debt ratio
R_DebtRatio[2014]
Debt ratio (years available)
Debt securities
BS_A_Bank_FixedIncomeInstruments[2
014]
Debt securities (years available)
Debt securities
BS_L_Bank_DebtSecurities[2014]
Debt evidenced by certificates
(years available)
Debt, total
BS_L_DebtTotal[2014]
Debt (Borrowings), total (years
available)
Deferred current
income taxes
BS_A_Ind_DeferredIncomeTaxesCurren
t[2014]
Deferred current income taxes
(years available)
Deferred current
income taxes
BS_L_Ind_DeferredIncomeTaxesCurren
t[2014]
Deferred current income taxes
(years available)
Deferred income
BS_A_DeferredIncome[2014]
Prepayments and accrued income
(years available)
Deffered tax assets
BS_A_DeferredIncomeTaxes[2014]
Deffered tax assets (years
available)
Deffered tax liabilities
BS_L_DeferredIncomeTaxes[2014]
Deffered tax liabilities (years
available)
Depreciation
BS_A_Depreciation[2014]
Depreciation (years available)
Depreciation
IS_Depreciation[2014]
Depreciation (years available)
Depreciation &
Amortisation
IS_DepreciationAndAmortisation[201
4]
Depreciation and Amortisation,
total (years available)
Depreciation &
Amortization
CFDepreciationAmortization[2014]
Depreciation & Amortization (years
available)
Depreciation on
financial assets
IS_DepreciationOnFinancialAssets[2
014]
Depreciation on financial assets
(years available)
Depreciation rate
R_DepreciationRate[2014]
Depreciation rate (years available)
Differed income
BS_L_DifferedIncome_Recnungsabgr[2
014]
Differed income (years available)
Dividend
BS_L_Bank_Dividend[2014]
Dividend (years available)
Dividend growth rate
R_DividendGrowth[2014]
Dividend growth rate (years
available)
Dividends paid
CFCashDividendsPaid[2014]
Dividends paid (years available)
Dividends PS
DividendsPS[2014]
Dividends per share (years
available)
Dynamic debt equity
ratio I
R_DynamicDebtEquityRatioI[2014]
Dynamic debt equity ratio I (years
available)
Dynamic debt equity
ratio II
R_DynamicDebtEquityRatioII[2014]
Dynamic debt equity ratio II (years
available)
EBIT growth rate
R_EBITGrowth[2014]
EBIT growth rate (years available)
EBITDA
IS_Ind_EBITDA[2014]
EBITDA (years available)
EBITDA-margin
R_EBITDAMargin[2014]
EBITDA-margin (years available)
EBIT-margin
R_EBITMargin[2014]
EBIT-margin (years available)
EGT
IS_OperatingIncomeBeforeTaxes_EGT[
2014]
Operating income before taxes
(years available)
Employees
Employees[2014]
Employees (years available)
Employees growth rate
R_EmployeesGrowth[2014]
Employees growth rate (years
available)
RTD – Real-Time Data in Excel
418
TeleTrader Software GmbH
Marc-Aurel-Straße 10-12, 1010 Vienna, Austria
E-Mail [email protected]
Internet http://professional.teletrader.com
EPS Basic
EPSBasic[2014]
EPS Basic (years available)
EPS Basic, 3 Year
annualized growth
R_EPSBasic3YearAnnualizedGrowth[20
14]
EPS Basic, 3 Year annualized
growth (years available)
EPS Diluted
EPSDiluted[2014]
EPS Diluted (years available)
Equities
BS_A_Bank_Equities[2014]
Shares and other variable-yield
instruments (years available)
Equity ratio
R_EquityRatio[2014]
Equity ratio (years available)
Equity to fixed assets
ratio
R_EquityToFixedAssetsRatio[2014]
Equity to fixed assets ratio (years
available)
Equity turnover
R_EquityTurnover[2014]
Equity turnover (years available)
Extraordinary result
IS_ExtraordinaryIncomeLoss[2014]
Extraordinary result (years
available)
Financial assets
(incurances)
BS_A_Bank_FinancialAssetsIncurance
s[2014]
Financial assets (incurances)
(years available)
Fixed assets
BS_A_NonCurrentAssetsTotal[2014]
Fixed assets (years available)
Fixed assets turnover
R_FixedAssetsTurnover[2014]
Fixed assets turnover (years
available)
Fixed to current assets
ratio
R_FixedToCurrentAssetsRatio[2014]
Fixed to current assets ratio (years
available)
General expenses
IS_GeneralExpenses[2014]
General expenses (years
available)
Gross profit
IS_Ind_GrossProfit[2014]
Gross profit (years available)
Gross profit growth rate
R_GrossProfitGrowth[2014]
Gross profit growth rate (years
available)
Gross profit margin
R_GrossProfitMargin[2014]
Gross profit margin (years
available)
Group balance profit
IS_GroupBalanceProfit[2014]
Group balance profit (years
available)
Income after taxes
IS_IncomeAfterTaxes[2014]
Profit after tax (years available)
Income before
extraordinary item
IS_IncomeBeforeExtraordinaryItem[2
014]
Income before extraordinary item
(years available)
Income before taxes
IS_IncomeBeforeTaxes[2014]
Income before income taxes (years
available)
Income taxes
IS_IncomeTaxes[2014]
Income taxes (years available)
Income, continuing
operations
IS_Ind_IncomeContinuingOperations[
2014]
Income from continuing operations
(years available)
Income, discontinued
business
IS_Ind_IncomeDiscontinuedBusiness[
2014]
Income from discontinued business
(years available)
Insurance income, net
IS_Ins_InsuranceIncomeNet[2014]
Net Income from the insurance
business (years available)
Insurance reserves
BS_L_Ins_InsuranceReserves[2014]
Insurance reserves (provisions)
(years available)
Intangible assets
BS_A_IntangiblesNet[2014]
Intangible assets (years available)
Intensity of capital
expenditure
R_IntensityOfCapitalExpenditure[20
14]
Intensity of capital expenditure
(years available)
Intensity of capital
investments
R_IntensityOfCapitalInvestments[20
14]
Intensity of capital investments
(years available)
Intensity of current
R_IntensityOfCurrentAssets[2014]
Intensity of current assets (years
RTD – Real-Time Data in Excel
419
TeleTrader Software GmbH
Marc-Aurel-Straße 10-12, 1010 Vienna, Austria
E-Mail [email protected]
Internet http://professional.teletrader.com
assets
available)
Intensity of liquid
assets
R_IntensityOfLiquidAssets[2014]
Intensity of liquid assets (years
available)
Intensity of
onvestments
R_IntensityOfInvestments[2014]
Intensity of onvestments (years
available)
Intensity of PPEinvestments
R_IntensityOfPPEInvestments[2014]
Intensity of PPE-investments
(years available)
Interest
BS_A_Bank_Interest[2014]
Interest receivable (years
available)
Interest
BS_L_Bank_Interest[2014]
Accrued interest payable (years
available)
Interest bearing
deposits
BS_A_Bank_InterestBearingDep[2014]
Deposits at interest with banks
(years available)
Interest expences
IS_InterestExpenses[2014]
Interest expences (years available)
Interest income
IS_InterestIncome[2014]
Interest income (years available)
Interest-bearing
deposits
BS_L_Bank_InterestBearingDeposits[
2014]
Interest-bearing deposits (years
available)
Interst expence rate
R_InterstExpenceRate[2014]
Interst expence rate (years
available)
Inventories
BS_A_Ind_Inventories[2014]
Inventories (years available)
Inventory turnover
R_InventoryTurnover[2014]
Inventory turnover (years available)
Investment income,
insurance
IS_Ins_InvestmentIncomeInsurance[2
014]
Investment income from insurance
(years available)
Investments
BS_A_Investments[2014]
Investments (years available)
Investments for the risk
of policyholders
BS_A_Ins_InvestmentsForRiskOfPolic
yholders[2014]
Investments for the risk of
policyholders (years available)
Investments in affiliates
BS_A_InvestmentsInAffiliates[2014]
Investments in affiliates and related
enterprises (years available)
Investments in Joint
Ventures (UK)
BS_A_UK_InvestmentsJointVentures[2
014]
Investments in Joint Ventures (UK)
(years available)
Investments, equities
BS_A_Bank_InvestmentsEquities[2014
]
Shares and other variable yield
securities (years available)
Investments, fixed
income
BS_A_Bank_InvestmentsFixedIncome[2
014]
Securities held to maturity (Bonds
and other fixed-income securities)
(years available)
Is Bank
IsBank
YES - financial company, bank; NO
- industrial company
Liabilities & Equity,
total
BS_L_LiabilitiesEquityTotal[2014]
Total liabilities and shareholders
funds (years available)
Liabilities to banks
BS_L_LiabilitiesBanks[2014]
Liabilities to banks (years
available)
Liabilities to customes
BS_L_Bank_LiabilitiesCustomers[201
4]
Liabilities to customes (years
available)
Liquidity I
R_LiquidityI[2014]
Liquidity I (years available)
LiquidityII / QuickRatio
R_LiquidityII_QuickRatio[2014]
LiquidityII / QuickRatio (years
available)
LiquidityIII /
CurrentRatio
R_LiquidityIII_CurrentRatio[2014]
LiquidityIII / CurrentRatio (years
available)
Loans to banks
BS_A_Bank_LoansToBanks[2014]
Loans and advances to banks
RTD – Real-Time Data in Excel
420
TeleTrader Software GmbH
Marc-Aurel-Straße 10-12, 1010 Vienna, Austria
E-Mail [email protected]
Internet http://professional.teletrader.com
(years available)
Loans to customers
BS_A_Bank_LoansToCustomers[2014]
Loans and advances to customers
(years available)
Long-term debt
BS_L_LongTermDebt[2014]
Long-term debt (years available)
Market capitalization,
total
R_MarketCapTotal[2014]
Market capitalization, total (years
available)
Marketable securities
BS_A_SecuritiesCurrent[2014]
Marketable securities (years
available)
Minority interests
BS_L_MinorityInterests[2014]
Minority interests (years available)
Minority interests
IS_MinorityInterests[2014]
Minority interests (years available)
Mortgages
BS_A_Bank_Mortgages[2014]
Mortgages (years available)
Net assets (UK)
BS_A_UK_NetAssets[2014]
Net assets (UK) (years available)
Net current liabilities
(UK)
BS_A_Ind_UK_NetCurrentLiabilities[
2014]
Net current liabilities (UK) (years
available)
Net EPS (calculated)growth rate II
R_NetEarningsPerShareGrowth[2014]
Net earnings per share (EPS)
(calculated)- growth rate II (years
available)
Net EPS 3 Year
annualized growth
R_NetEarningsPerShare3YearAnnualiz
edGrowth[2014]
Net EPS 3 Year annualized growth
(years available)
Net EPS- growth rate I
R_EPSBasicGrowth[2014]
Net earnings per share (EPS)growth rate I (years available)
Net EPS without extra
income - growth rate III
R_NetEarningsWithoutExtraPerShareG
rowth[2014]
Net earnings without extraordinary
income or loss per share - growth
rate III (years available)
Net EPS without extra, 3
Year annualized growth
R_NetEarningsWithoutExtra3YearAnnu
alizedGrowth[2014]
Net EPS without extra 3 Year
annualized growth (years
available)
Net fees and
commission income
IS_Bank_CommissionFeeIncomeNet[201
4]
Net fees and commission income
(years available)
Net financial income
IS_FinancialIncomeNet[2014]
Net financial income (years
available)
Net income
BS_L_NetIncome[2014]
Net income for the year (years
available)
Net income
IS_NetIncome[2014]
Net Income / Profit for the financial
year (years available)
Net income growth rate
R_NetIncomeGrowth[2014]
Net income growth rate (years
available)
Net income in percent
of personal expenses
R_NetIncomeInPercentOfPersonalExpe
nses[2014]
Net income in percent of personal
expenses (years available)
Net income per
employee
R_NetIncomePerEmloyee[2014]
Net income per employee (years
available)
Net interest income
IS_InterestIncomeNet[2014]
Net interest income (years
available)
Net margin
R_NetMargin[2014]
Net margin (years available)
Non-current liabilities
BS_L_Ind_NonCurrentLiabilitiesTota
l[2014]
Non-current liabilities (years
available)
Non-interest-bearing
deposits
BS_L_Bank_NonInterestBearingDeposi
ts[2014]
Non-interest-bearing deposits
(years available)
Operating income after
taxes
IS_OperatingIncomeAfterTaxes[2014]
Profit on ordinary activities after tax
(years available)
RTD – Real-Time Data in Excel
421
TeleTrader Software GmbH
Marc-Aurel-Straße 10-12, 1010 Vienna, Austria
E-Mail [email protected]
Internet http://professional.teletrader.com
Operating profit (EBIT)
IS_OperatingIncome_EBIT[2014]
Operating profit (EBIT) (years
available)
Other assets
BS_A_OtherAssets[2014]
Other assets (years available)
Other comprehensive
income (loss)
BS_L_OtherComprehensiveIncome[2014
]
Other comprehensive income
(loss) (years available)
Other current assets
BS_A_Ind_OtherCurrentAssets[2014]
Other receivables and other
current assets (years available)
Other current liabilties
BS_L_Ind_OtherCurrentLiabilities[2
014]
Other current liabilties (years
available)
Other expenses, total
IS_US_OtherExpensesTotal[2014]
Other expenses, total (years
available)
Other liabilities
BS_L_OtherLiabilities[2014]
Other liabilities (years available)
Other non-current
assets
BS_A_OtherNonCurrentAssets[2014]
Other non-current assets (years
available)
Other non-current
liabilties
BS_L_Ind_OtherNonCurrentLiabilitie
s[2014]
Other non-current liabilties (years
available)
Other operating
expenses
IS_OtherOperatingExpenses[2014]
Other operating expenses (years
available)
Other operating income
IS_OtherOperatingIncome[2014]
Other operating income (years
available)
Other operating result
IS_OtherOperatingResult[2014]
Other operating result (years
available)
Own stocks
BS_A_OwnStocks[2014]
Own stocks (years available)
Own stocks
BS_L_Bank_OwnStocks[2014]
Own stocks (years available)
Participations result
IS_ParticipationsResult[2014]
Result from investments in
subsidiaries, associates and other
investments (years available)
Payble insurance
BS_L_Ins_PaybleInsurance[2014]
Insurance policy claimes and
reserves (years available)
Period from
PeriodFrom[2014]
The beginning of the fiscal year
period (years available)
Period to
PeriodTo[2014]
The end of the fiscal year (years
available)
Personal expenses per
employee
R_PersonalExpensesPerEmployee[2014
]
Personal expenses per employee
(years available)
Personal expenses rate
R_PersonalExpensesRate[2014]
Personal expenses rate (years
available)
Personnel expences
IS_PersonalExpences[2014]
Personnel expences (years
available)
PPE
BS_A_PropertyEquipment[2014]
Property, plant and equipment
(years available)
PPE, net
BS_A_PropertyEquipmentNet[2014]
Property, plant and equipment, net
(years available)
Preferred stock
BS_L_PreferredStock[2014]
Preferred stock (years available)
Premium icome, net
IS_Ins_PremiumIncomeNet[2014]
Net earned premiums (years
available)
Pre-tax margin
R_PreTaxMargin[2014]
Pre-Tax margin (years available)
Pre-tax ROA
R_PretaxROA[2014]
Pre-tax ROA (years available)
Pre-tax ROE
R_PretaxROE[2014]
Pre-tax ROE (Return On Equity)
RTD – Real-Time Data in Excel
422
TeleTrader Software GmbH
Marc-Aurel-Straße 10-12, 1010 Vienna, Austria
E-Mail [email protected]
Internet http://professional.teletrader.com
(years available)
Provision for credit loss
IS_Bank_ProvisionCreditLoss[2014]
Provisions for bad and doubtful
debts (years available)
Provisions
BS_L_Provisions[2014]
Provisions for liabilities and
charges (years available)
Provisions for pension
BS_L_ProvisionsForPension[2014]
Provisions for pensions and similar
long term (years available)
Provisions ratio
R_ProvisionsRatio[2014]
Provisions ratio (years available)
R&D costs rate
R_RAndDCostsRate[2014]
R&D costs rate (years available)
R&D expenses
IS_Ind_RAndDExpenses[2014]
Research and development
expenses (years available)
R_ROA
R_ROA[2014]
ROA (Return On Assets) (years
available)
R_ROE
R_ROE[2014]
ROE (Return On Equity) (years
available)
Real estate
BS_A_INS_RealEstate[2014]
Real estate (years available)
Receivables from
Insurance
BS_A_Ins_ReceivablesFromInsurance[
2014]
Receivables from Insurance (years
available)
Receivables from
Reinsurance
BS_A_Ins_ReceivablesFromReinsuranc
e[2014]
Receivables from Reinsurance
(years available)
Reinsurance share of
Technical Provisions
BS_A_Ins_ReinsuranceShareOfTechnic
alProvisions[2014]
Reinsurance share of Technical
Provisions (years available)
Related party payables
BS_L_Ind_LiabilitiesRelatedParties
[2014]
Related party payables (years
available)
Result of technical
account in Life
Insurance
IS_Ins_ResultTechnicalAccountLifeI
nsurance[2014]
Result of technical account in Life
Insurance (years available)
Result of technical
account in Non-Life
Insurance
IS_Ins_ResultTechnicalAccountNonLi
feInsurance[2014]
Result of technical account in NonLife Insurance (years available)
Retained earnings
IS_Retained[2014]
Retained earnings (years
available)
Retained eranings
BS_L_RetainedEarnings[2014]
Retained eranings (years
available)
Revenues
IS_RevenuesTotal
Revenues
Revenues growth rate
R_RevenuesGrowth[2014]
Revenues growth rate (years
available)
Revenues per employee
R_RevenuesPerEmloyee[2014]
Revenues per employee (years
available)
Revenues total 3 Year
annualized growth
R_RevenuesTotal3YearAnnualizedGrow
th[2014]
Revenues total 3 Year annualized
growth (years available)
Sales
IS_Ind_Sales[2014]
Sales / Turnover (years available)
Sales & Marketing costs
IS_SalesMarketingCosts[2014]
Sales and marketing costs,
Distribution costs (years available)
Securities available for
sale
BS_A_SecurritiesAvailableForSale[2
014]
Securities available for sale (years
available)
Share premium account
BS_L_UK_SharePremiumAccount[2014]
Share premium account (years
available)
Shares outstanding
(particular ISIN)
SharesOutstandingHistory[2014]
Number of shares outstanding for
particular ISIN (years available)
RTD – Real-Time Data in Excel
423
TeleTrader Software GmbH
Marc-Aurel-Straße 10-12, 1010 Vienna, Austria
E-Mail [email protected]
Internet http://professional.teletrader.com
Shares outstanding
(total)
SharesOutstandingHistory[2014]
Shares outstanding (total) history
(years available)
Shares outstanding
date
SharesOutstandingDate[2014]
Shares outstanding date (years
available)
Shares outstanding
diluted (particular ISIN)
SharesOutstandingDelHistory[2014]
Number of shares outstanding
(diluted) for particular ISIN (years
available)
Shares outstanding
diluted (total)
SharesOutstandingDelHistory[2014]
Shares outstanding diluted history
(years available)
Short term debt
BS_L_ShortTermDebt[2014]
Short-term debt and current
maturities (Creditors: amounts
falling due within one year) (years
available)
Subordinated liabilities
BS_L_Bank_SubordinateLiabilities[2
014]
Subordinated liabilities (years
available)
Subscribed capital
BS_L_CapitalSubscribed[2014]
Subscribed capital (years
available)
Tax expence rate
R_TaxExpenceRate[2014]
Tax expence rate (years available)
Total assets
BS_A_AssetsTotal[2014]
Total assets (years available)
Total assets less
current liabilities (UK)
BS_A_Ind_UK_TotalAssetsLessCurrent
Liabilities[2014]
Total assets less current liabilities
(UK) (years available)
Total assets per
emloyee
R_TotalAssetsPerEmloyee[2014]
Total assets per emloyee (years
available)
Total capital employed
BS_L_UK_TotalCapitalEmployed[2014]
Total capital employed (years
available)
Total capital turnover
R_TotalCapitalTurnover[2014]
Total capital turnover (years
available)
Total current liabilities
BS_L_Ind_CurrentLiabilitiesTotal[2
014]
Total current liabilities (years
available)
Total deposits
BS_L_Bank_DepositsTotal[2014]
Total deposits (years available)
Total liabilities
BS_L_LiabilitiesTotal[2014]
Total liabilities (years available)
Total non interest
expenses
IS_Bank_US_NonInterestExpense[2014
]
Total non interest expenses (years
available)
Total non interest
income
IS_Bank_US_NonInterestIncome[2014]
Total non interest income (years
available)
Total shareholders
equity
BS_L_StockholdersEquityTotal[2014]
Total shareholders equity (years
available)
Trade accounts
receivable
BS_A_Ind_ReceivablesFromThirdParti
es[2014]
Trade accounts receivable (years
available)
Trading assets
BS_A_Bank_TradingAssets[2014]
Trading assets (years available)
Trading income, net
IS_Bank_TradingIncomeNet[2014]
Earnings from financial
transactions, net (years available)
Trading liabilities
BS_L_Bank_Trading_Liabilities[2014
]
Trading liabilities (years available)
Treasury Bills
BS_A_Bank_TreasuryBills[2014]
Debt instruments (public) +
refinancing with central bank
(years available)
Units BS
UnitsBS[2014]
Balance sheet units (years
available)
RTD – Real-Time Data in Excel
424
TeleTrader Software GmbH
Marc-Aurel-Straße 10-12, 1010 Vienna, Austria
E-Mail [email protected]
Internet http://professional.teletrader.com
Certificates
AutoExercise
AutoExercise
Specifies whether the option right
is automatically exercised in the
case of expiration (j=yes or n=no)
BonusLevel
BonusLevel
A bonus amount which is paid off,
if security level is not touched
BonusYieldPaPerc
BonusYieldPaPerc
Bonus yield in percent per year
BonusYieldPerc
BonusYieldPerc
Bonus yield in percent
BreakEven
BreakEven
Break Even
CalcLeverage
CalcLeverage
Leverage
CalcUndHistVola
CalcUndHistVola
Max volumen from last 30 days
Cancellation
Cancellation
Specifies whether the product
contains cancellation (j=yes or
n=no)
Cap
Cap
Cap / ceiling price of the certificate
CapitalProtection
CapitalProtection
If there is capital protection
included
Currency
Currency
Currency of the derivative
CurrRiskProtection
CurrRiskProtection
Whether the product comprises
protection against currency risk
(j=yes, n=no or -=currency
protection is obsolete)
Delta
Delta
Delta
DescriptionDE
DescriptionDE
Supplemental data of the product
(Deutsch)
DescriptionEN
DescriptionEN
Supplemental data of the product
(English)
DiscountAbsolute
DiscountAbsolute
Discount
DiscountInPerc
DiscountInPerc
Discount in percent
DistanceToCap
DistanceToCap
Distance to cap
DistanceToCapPerc
DistanceToCapPerc
Distance to cap in percent
DistanceToKnockOutLe
vel
DistanceToKnockOutLevel
Distance to Knock-Out
DistanceToKnockOutLe
velPerc
DistanceToKnockOutLevelPerc
Distance to Knock-Out in percent
DistanceToSafetyLevel
DistanceToSafetyLevel
Distance to Safety Level
DistanceToSafetyLevel
Perc
DistanceToSafetyLevelPerc
Distance to Safety Level in percent
DistanceToStrikePrice
DistanceToStrikePrice
Distance to Strike Price
DistanceToStrikePriceP
erc
DistanceToStrikePricePerc
Distance to Strike Price in percent
DistanceToUpperBarrier
DistanceToUpperBarrier
Distance to Bonus Level
DistanceToUpperBarrier
Perc
DistanceToUpperBarrierPerc
Distance to Bonus Level in percent
DividendPayment
DividendPayment
Dividend payment
ExerciseRatio
ExerciseRatio
How many securities of the
underlying will be supplied for one
security (warrant or certificate)
RTD – Real-Time Data in Excel
425
TeleTrader Software GmbH
Marc-Aurel-Straße 10-12, 1010 Vienna, Austria
E-Mail [email protected]
Internet http://professional.teletrader.com
ExerciseStyle
ExerciseStyle
a(merican), e(uropean), m(ix),
b(ermuda)
Expiration Date
Expiration Date
Expiration Date
ExpirationDays
ExpirationDays
Days till expiration date
FairValue
FairValue
Fair value calculated with BlackScholes formula
Fees
Fees
Specifies whether separate fees
will be charged for the product
(management compensation and
s.o.) (j=yes or n=no)
FirstTradingDate
FirstTradingDate
Date on which the security can be
traded for the first time
Gamma
Gamma
Gamma
ImpliedVola
ImpliedVola
Implied Volatility
ImpliedVolaAsk
ImpliedVolaAsk
Implied Volatility (Ask)
ImpliedVolaBid
ImpliedVolaBid
Implied Volatility (Bid)
InterestRate
InterestRate
Interest rate (coupon)
IntrinsicValue
IntrinsicValue
Intrinsic Value
IsRolling
IsRolling
Field specifies whether instrument
is rolling (j=yes or n=no)
Issuer
Issuer
Issuer
IssueSize
IssueSize
Amount of securities issued
originally
KnockIn
KnockIn
Security level
KnockOut
KnockOut
Knock-out-barrier
KnockOutDate
KnockOutDate
Knock-Out level touched
LastTradingDate
LastTradingDate
Date on which the security can be
traded for the last time
Leverage
Leverage
Various lever type characteristics
are listed: 1=no or 2=yes or 3=in
parts
MaximumYieldAbs
MaximumYieldAbs
Maximum yield
MaximumYieldPaPerc
MaximumYieldPaPerc
Maximum yield in percent per year
MaximumYieldPerc
MaximumYieldPerc
Maximum yield in percent
MaxSpreadEuro
MaxSpreadEuro
Maximum difference between the
bid and the offer price (as an
absolute homogenised value) at
EUWAX
MaxSpreadPerc
MaxSpreadPerc
Maximum difference between the
bid and the offer price at EUWAX
in percent
Moneyness
Moneyness
Moneyness
NominalValue
NominalValue
Nominal value (of reverse
convertibles or instruments with a
percentage quotation)
Omega
Omega
Omega
OptionType
OptionType
Type of the option: Call/Put
Parity
Parity
Parity
RTD – Real-Time Data in Excel
426
TeleTrader Software GmbH
Marc-Aurel-Straße 10-12, 1010 Vienna, Austria
E-Mail [email protected]
Internet http://professional.teletrader.com
ParityReturn
ParityReturn
Return Parity
ParityReturnPA
ParityReturnPA
Return Parity per year
ParticipationRate
ParticipationRate
From a certain price the investor
takes part with a specific
participation rate in the increase of
the underlying instruments of a
certificate. Interpretation of the
data: 1,3000 means 130%, 8000
means 80%
PaymentDate
PaymentDate
Payment date of the security
Premium
Premium
Premium
PremiumPA
PremiumPA
Premium per year
ProductCategory
ProductCategory
ProductCategory
ProductName
ProductName
Name of the product provided by
the issuer
ProductType
ProductType
ProductType
RangeStart
RangeStart
Start value / lower border
RangeStop
RangeStop
Stop value / upper border
RatingDate
RatingDate
Date of the last rating
RedemptionPrice
RedemptionPrice
If RedemptionPrice is NULL -> =
CAP * ExerciseRatio
Rho
Rho
Rho
RiskClass1
RiskClass1
Risk class 1: security oriented
RiskClass2
RiskClass2
Risk class 2: moderately risky
RiskClass3
RiskClass3
Risk class 3: risky
RiskClass4
RiskClass4
Risk class 4: increasingly risky
RiskClass5
RiskClass5
Risk class 5: speculative
RiskFit
RiskFit
Best fitting risk class
SecurityLevelTouched
SecurityLevelTouched
Date when the security level was
touched Notice: We only deliver
data in this field for securities listed
in Stuttgart of the category Bonus
and Discount+Pro.
SecurityLevelValidFrom
SecurityLevelValidFrom
Activation date of security level
SidewaysYieldPaPerc
SidewaysYieldPaPerc
Sideways yield in percent per year
SidewaysYieldPerc
SidewaysYieldPerc
Sideways yield in percent
Spread
Spread
Spread
SpreadHomogen
SpreadHomogen
Spread Homogen
SpreadMove
SpreadMove
Spread Move
SpreadRelative
SpreadRelative
Spread Ask / Spread Bid in relation
to Spread Ask
StopLoss
StopLoss
Field for derivative leverage
product category (1=knock out with
stopp loss, 2=knock out without
stopp loss, -)
Strike
Strike
Strike price
Theta
Theta
Theta
RTD – Real-Time Data in Excel
427
TeleTrader Software GmbH
Marc-Aurel-Straße 10-12, 1010 Vienna, Austria
E-Mail [email protected]
Internet http://professional.teletrader.com
TimeValue
TimeValue
Time Value
TimeValueMove
TimeValueMove
Time Value Move
Und ISIN
Und ISIN
Und ISIN
UndBasket
UndBasket
Whether the underlying includes a
basket (j=yes or n=no)
UndFuture
UndFuture
Whether the underlying includes a
future (j=yes or n=no)
UndNameOriginal
UndNameOriginal
Name of the underlying instrument
(as supplied by the issuer)
UndNameSymbol
UndNameSymbol
Name of the underlying instrument
(symbol name)
UndType
UndType
Date where the Ratios were
calculated
UpdateDate
UpdateDate
Date of changing conditions for this
certificate in the cases: Change of:
Strike price / Subscription ratio /
Cap / Security level /Knock-outbarrier / Range I / Range II / Bonus
level / Basket: composition of
underlying changes
VariableAmount
VariableAmount
This specifies the smallest variably
tradable number of items
Vega
Vega
Vega
VAvgVol
VAvgVol
Average Volume per trade
VFVar
VFVar
Define the percentage fraction for
VWAP Fractional Volume (VFVol)
calculation
VFVol
VFVol
Fraction of the VWAP Total
Volume (VVolume) as defined in
VFVar parameter (in %).
VPrice
VPrice
Calculated VWAP price
VPriceF
VPriceF
Start Price of the custom VWAP
price range
VPriceT
VPriceT
End Price of the custom VWAP
price range
VStdDev
VStdDev
Standard Deviation of the VWAP
Price
VTrans
VTrans
Numbers of transactions for a
trading session
VVolF
VVolF
Start Volume of the custom VWAP
volume range
VVolT
VVolT
End Volume of the custom VWAP
volume range
VVolume
VVolume
Calculated VWAP Total Volume
VWAP Button
V
VWAP Change to Prev VWAP
VWAP
RTD – Real-Time Data in Excel
428
TeleTrader Software GmbH
Marc-Aurel-Straße 10-12, 1010 Vienna, Austria
E-Mail [email protected]
Internet http://professional.teletrader.com
HTTP Trading Integration for Online
Brokers
Many online brokers offer a web based trading platform to their customers. This platform is usually displayed in a web
browser window.
With TeleTrader Professional, you can directly access your online trading accounts and portfolios. The information is
displayed in an embedded browser window (see Web Watch on page 62). Additionally, you can place orders by
calling up the online order mask of your broker and transferring symbol information from Professional to the trading
platform.
Several pre-configured brokers are available (see Available Brokers on page 437). If your broker is not among them,
you can contact us (see Customer Support on page 534) – we will be happy to check the possibility of integrating new
brokers.
Creating Brokers and Portfolios
Before you can start using the HTTP trading integration for accessing your portfolio and placing orders, you have to
create a broker and portfolio configuration. You can also define additional brokers and portfolios.
To create a broker and a portfolio
Note
The following steps only apply to the first broker and portfolio that you create. For instructions how
to add more brokers and portfolios, see below.
▪
On the Trade menu, click HTTP Trading > Add broker.
▪
In the Add Broker dialog, select the broker that you want to add and click OK.
▪
On the left side of the Set HTTP Broker Properties dialog, choose Portfolios.
HTTP Trading Integration for Online Brokers
429
TeleTrader Software GmbH
Marc-Aurel-Straße 10-12, 1010 Vienna, Austria
E-Mail [email protected]
Internet http://professional.teletrader.com
▪
On the right side of the dialog, click Create Portfolio.
▪
In the dialog Add New Portfolio, enter the name and login data of your portfolio. The available fields depend on
the broker. See Available Brokers on page 437.
▪
Your portfolio is now added on the left side of the dialog under the entry Portfolios. Next, you should log in to
your portfolio: See Logging In and Accessing a Portfolio on page 431.
To add more brokers
▪
On the Trade menu, click the name of any broker and then Set broker properties. For example:
direktanlage.at > Set broker properties.
▪
In the Set HTTP Broker Properties dialog, click Manage > Add Broker.
▪
In the Add Broker dialog, select the broker that you want to add and click OK.
▪
You can now create a portfolio for this broker.
To add more portfolios
▪
On the Trade menu, click the name of the broker where you want to add the portfolio and then Set broker
properties. For example: direktanlage.at > Set broker properties.
▪
On the left side of the Set HTTP Broker Properties dialog, choose Portfolios.
▪
On the right side of the dialog, click Create Portfolio.
▪
In the dialog Add New Portfolio, enter the name and login data of your portfolio. The available fields depend on
the broker. See Available Brokers on page 437.
▪
Your portfolio is now added on the left side of the dialog under the entry Portfolios. Next, you should log in to
your portfolio: See Logging In and Accessing a Portfolio on page 431.
HTTP Trading Integration for Online Brokers
430
TeleTrader Software GmbH
Marc-Aurel-Straße 10-12, 1010 Vienna, Austria
E-Mail [email protected]
Internet http://professional.teletrader.com
Logging In and Accessing a Portfolio
You can automatically log in to your portfolio with the account data that you have entered in your portfolio
configuration when you created the portfolio. After logging in, you can display some pre-configured information pages
with TeleTrader Professional menu commands.
To log in to your portfolio
▪
On the Trade menu, click the name of the broker, then the name of the portfolio, and Login. For example:
direktanlage.at > MyPortfolio > Login.
▪
A web watch browser window with the online trading platform of your broker is displayed. Depending on your
broker, you might have to enter additional data to complete the login process. See Available Brokers on page
437.
To show information from your portfolio
▪
On the Trade menu, click the name of the broker, then the name of the portfolio, and the type of information you
want to access. For example: direktanlage.at > MyPortfolio > Order Book.
▪
The following pages are available:
▪
Portfolio Overview
Overview page of your portfolio
Portfolio
Detailed view of your portfolio
Order Book
Overview page showing your current orders
Trading History
Overview page showing your processed trades
A web watch browser window with the requested information is displayed. The exact content and layout depends
on your broker. You can of course also use the online navigation links and controls of your broker to switch to
different pages.
Placing Orders
You can place orders with your broker from all Professional documents that show quote data. Placing an order will
open the online order mask of your broker. For many supported brokers, Professional can also transfer data of the
selected symbol. Always check the information for accuracy and complete the form before you approve an order!
There are several different ways to place an order in TeleTrader Professional. For all of them, you first have to select
a security that you want to trade. Depending on the type of document where you select the security, you have
different possibilities to open a new order ticket:
▫
Price page / watch list: You can create an order by right-clicking a symbol, or by double-clicking in the Bid / Ask
columns.
▫
Chart: You can create an order by right-clicking the symbol, or by double-clicking below or above the time series.
▫
Market depth: You can create an order by right-clicking in the document, or by double-clicking in the Bid / Ask
columns.
▫
Time and sales: You can create an order by right-clicking the symbol, or by double-clicking in the Bid / Ask
columns.
▫
Options matrix: You can trade the underlying symbol by right-clicking it, or by double-clicking in the Bid / Ask
columns.
For easier placement of orders, you can also activate single-click trading: See Changing the Trading Settings on page
433.
HTTP Trading Integration for Online Brokers
431
TeleTrader Software GmbH
Marc-Aurel-Straße 10-12, 1010 Vienna, Austria
E-Mail [email protected]
Internet http://professional.teletrader.com
Warning
The symbol data that is transferred to the order masked depends on the broker.
To place a buy or sell order from the context menu
Note
This method works from all TeleTrader Professional documents (price page, watch list, chart,
market depth, options matrix or time and sales).
▪
In a Professional document, for example in a price page, right-click the symbol that you want to trade.
▪
Choose Buy or Sell.
▪
The order mask of your broker is displayed in a web watch browser window with some fields already filled.
▪
Check the information for accuracy and complete the form before you approve the order!
To place a buy or sell order from the Bid and Ask columns
Note
This method works from price pages, watch lists, market depth, options matrix or time and sales
documents. If you have activated single-click trading, you can use a single click instead of a
double-click to place an order. See Changing the Trading Settings on page 433.
▪
Double-click on the Bid or Ask column of the symbol that you want to trade.
▪
Depending on your trading settings, the buy or sell order mask of your broker is displayed in a web watch
browser window with some fields already filled. By default, Join Bid/Ask is activated which means that a click on
the Bid column will open a buy order, and a click on the Ask column will open a sell order, like shown in the
picture below. For more information, see Changing the Trading Settings on page 433.
▪
Check the information for accuracy and complete the form before you approve the order!
To place a buy or sell order from a chart document
Note
If you have activated single-click trading, you can use a single click instead of a double-click to
place an order. See Changing the Trading Settings on page 433.
▫
Double-click below the time series to place a buy order.
▫
Double-click above the time series to place a sell order.
▫
Double-click on the time series to show the order book.
HTTP Trading Integration for Online Brokers
432
TeleTrader Software GmbH
Marc-Aurel-Straße 10-12, 1010 Vienna, Austria
E-Mail [email protected]
Internet http://professional.teletrader.com
▪
Check the information for accuracy and complete the form before you approve the order!
Changing the Trading Settings
You can change the behavior of the HTTP trading integration – you can deactivate trading from some Professional
document types, enable single-click trading for more ease of use, and define which kind of order is created when you
click on the Bid or Ask columns in a price page, watch list, market depth or time and sales document.
Note
The trading settings are valid for all brokers and portfolios.
To deactivate trading from some document types
▪
On the Trade menu, choose Settings.
▪
For the desired document type(s), clear the appropriate Enable trading… check box.
To activate single-click trading
▪
On the Trade menu, choose Settings.
▪
For the desired document type(s), select the Single Click check box.
To define which kind of order is created when clicking on Bid / Ask columns
▪
On the Trade menu, choose Settings.
HTTP Trading Integration for Online Brokers
433
TeleTrader Software GmbH
Marc-Aurel-Straße 10-12, 1010 Vienna, Austria
E-Mail [email protected]
Internet http://professional.teletrader.com
▪
Choose Join Bid/Ask or Take/Hit to define which kind of order is created when clicking on a Bid or Ask column.
Clicking on Bid creates a…
Clicking on Ask creates a…
Join Bid/Ask
Buy order
Sell order
Take/Hit
Sell order
Buy order
To use the Bid / Ask price in limit orders
Note
This option is not available for the HTTP trading integration at the moment.
▪
On the Trade menu, choose Settings.
▪
Select Pre-Fill Bid/Ask for limit orders. The Bid or Ask price will automatically be suggested as the limit price
when creating limit orders.
Customizing Broker Configurations
You can change the configuration of your broker, that means the links and settings that are used to request
information pages and open the order mask. However, we recommend to use the default settings for a broker,
especially if you are unsure about the effects of your configuration changes.
You can of course also remove a broker – its (custom) settings and portfolio configurations are then deleted as well.
To change the configuration of a broker
Note
Leave the default settings of the broker configuration as they are if you are not sure what the
effects of a change would be.
▪
On the Trade menu, click the name of the broker and then Set broker properties. For example: direktanlage.at
> Set broker properties.
▪
On the left side of the Set HTTP Broker Properties dialog, double-click Actions to open its sub-entries.
▪
Click on the sub-entry that you want to adapt:
Login
URL and configuration settings for the login page
Buy
URL and configuration settings for the buy order mask
Sell
URL and configuration settings for the sell order mask
Portfolio Overview
URL and configuration settings for the overview page of your portfolio
Portfolio
URL and configuration settings for the detailed view of your portfolio
Order Book
URL and configuration settings for the overview page showing your current orders
Trading History
URL and configuration settings for the overview page showing your processed trades
HTTP Trading Integration for Online Brokers
434
TeleTrader Software GmbH
Marc-Aurel-Straße 10-12, 1010 Vienna, Austria
E-Mail [email protected]
Internet http://professional.teletrader.com
▪
On the right side of the dialog, adapt the default configuration to your needs.
Control
Description
Link
URL of the page that will be requested. Use variables as placeholders for certain data
fields:
##SESSIONID##
Session ID – filled if Read session ID is activated
##ISIN##
ISIN of the selected symbol
##SECURITY_TYPE## Symbol type of the selected symbol
##EXCHANGE##
Exchange code of the selected symbol
##DISPLAY_NAME##
Display name of the selected symbol
##TICKER##
Ticker of the selected symbol
For login data, additional portfolio-dependent variables are used.
Redirect link
Redirect the specified response page (FROM page) to another page (TO page).
Syntax:
{FROM;<URL of response page>}{TO;<URL of redirect page>}
Use POST method
Check to use HTTP POST when requesting the page
Clear to use HTTP GET when requesting the page
Bring to front
Check to only bring the existing web watch browser window to the front
No GET/POST if
query string already
exists
Check to not do a HTTP GET or POST request if the query string would not change
through that
Read session ID
Check to read the session ID from the response to this request and store it in the
session variable ##SESSIONID##
Block popups
Check to redirect pop-up windows to the existing web watch browser window
To reset the configuration of a broker to its default settings
▪
Export the portfolio configurations of the broker: See Customizing Portfolio Configurations on page 436.
▪
Delete the broker: See below.
▪
Create the broker again with its default settings: See Creating Brokers and Portfolios on page 429.
▪
Import the portfolio configurations of the broker: See Customizing Portfolio Configurations on page 436.
HTTP Trading Integration for Online Brokers
435
TeleTrader Software GmbH
Marc-Aurel-Straße 10-12, 1010 Vienna, Austria
E-Mail [email protected]
Internet http://professional.teletrader.com
To remove a broker
Note
This action cannot be undone. This will remove the broker with all its configured portfolios. You can
create the broker again, but you can only restore the portfolio configuration if you have exported it
before.
▪
On the Trade menu, click the name of the broker and then Set broker properties. For example: direktanlage.at
> Set broker properties.
▪
In the Set HTTP Broker Properties dialog, click Manage > Remove Broker.
▪
In the Remove broker dialog, select the broker that should be removed and click OK.
▪
The broker is removed including all configured portfolios.
Customizing Portfolio Configurations
You can change the login data (account data) for your portfolios. If you are using more than one portfolio, you can
define one of them as your default portfolio (the default portfolio is used for placing orders when you are logged in into
more than one portfolio at once).
When you want to transport your portfolio configuration to another Professional installation, or save it to disk, you can
export the configuration as an XML file and later re-import it in Professional. Of course, you can also remove
portfolios from Professional completely.
To change the login data of a portfolio
▪
On the Trade menu, click the name of the broker and then Set broker properties. For example: direktanlage.at
> Set broker properties.
▪
On the left side of the Set HTTP Broker Properties dialog, choose Portfolios, and then the name of the
portfolio. For example: Portfolios > MyPortfolio.
▪
On the right side of the dialog, edit the login data of the portfolio. The fields available depend on the broker. See
Available Brokers on page 437.
To set a default portfolio
▪
On the Trade menu, click the name of the broker, then the name of the portfolio, and Set as default portfolio.
For example: direktanlage.at > MyPortfolio > Set as default portfolio.
To export a portfolio configuration
▪
On the Trade menu, click the name of the broker and then Set broker properties. For example: direktanlage.at
> Set broker properties.
▪
In the Set HTTP Broker Properties dialog, click Manage > Export Portfolio.
▪
In the Save as dialog, enter the name for the XML configuration file in the File name field.
▪
Choose the location where you want to save the XML configuration file. Professional will suggest to save it into
your Documents folder. You can also use a different location.
▪
Click Save.
To import a portfolio configuration
▪
On the Trade menu, click the name of the broker and then Set broker properties. For example: direktanlage.at
> Set broker properties.
▪
In the Set HTTP Broker Properties dialog, click Manage > Import Portfolio.
HTTP Trading Integration for Online Brokers
436
TeleTrader Software GmbH
Marc-Aurel-Straße 10-12, 1010 Vienna, Austria
E-Mail [email protected]
Internet http://professional.teletrader.com
▪
In the Open dialog, select the XML configuration file that you want to import.
▪
Click Open.
To remove a portfolio
Note
This action cannot be undone. This will remove the portfolio with its configuration. You can only
restore the portfolio configuration if you have exported it before.
▪
On the Trade menu, click the name of the broker and then Set broker properties. For example: direktanlage.at
> Set broker properties.
▪
On the left side of the Set HTTP Broker Properties dialog, choose Portfolios.
▪
On the right side of the dialog, click Remove Portfolio.
▪
In the Remove Portfolio dialog, select the portfolio that should be removed and click OK.
Available Brokers
The following brokers are currently supported in the HTTP trading integration:
direktanlage.at
▫
Portfolio configuration: Enter your depot number ("Depotnummer"), PIN and identifier.
▫
Login: You are logged in automatically and redirected to the start page of your portfolio.
▫
Placing an order: The display name of the symbol is transferred to the online trading platform.
bankdirekt.at
▫
Portfolio configuration: Enter your bank code ("Bankleitzahl"), account number ("Konto oder Depot") and disposer
number ("Verfügernummer").
▫
Login: To complete the login you have to enter your PIN. You are then redirected to the overview page of your
portfolio.
▫
Placing an order: The display name and exchange of the symbol are transferred to the online trading platform.
brokerjet
▫
Portfolio configuration: Enter your user name ("Benutzer-Name") and password ("Benutzer-Passwort").
▫
Login: You are logged in automatically and redirected to the start page of your portfolio.
▫
Placing an order: The display name and exchange of the symbol is transferred to the online trading platform.
Warning
When placing an order, the order mask defaults to Buy, even when you have chosen Sell in
Professional!
DAB bank
▫
Portfolio configuration: Enter your access number ("Zugangsnummer"), account number ("Kontonummer"), PIN
and identifier.
▫
Login: You are logged in automatically and redirected to the start page of your portfolio.
▫
Placing an order: The display name and exchange of the symbol is transferred to the online trading platform.
HTTP Trading Integration for Online Brokers
437
TeleTrader Software GmbH
Marc-Aurel-Straße 10-12, 1010 Vienna, Austria
E-Mail [email protected]
Internet http://professional.teletrader.com
Connection Settings
In this section, you will find an overview of the different connection settings for connecting TeleTrader Professional to
the Market Data Server (MDS). This connection is needed to collect real-time and historic quotes, news and
fundamental data.
TeleTrader MDS Login Dialog
On each start, TeleTrader Professional must connect to the Market Data Server (MDS) to collect real-time and
historical quotes, news and fundamental data from multiple data feeds. On the first start of TeleTrader Professional,
the TeleTrader MDS Login dialog is shown automatically. On future logins, the login dialog will only be displayed
when the option Always show login dialog is selected, or when you hold the SHIFT key while starting Professional.
To enter your login data and startup settings
▪
The TeleTrader MDS Login dialog should be displayed automatically on the first start of Professional.
Note
If you have disabled the login dialog, but later want to change your login data, hold the SHIFT key
while starting TeleTrader Professional. You can also change the setting under Tools > Datafeed
Options.
Control
Description
User Name
Enter the TeleTrader Professional user name that you have received via email.
Password
Enter the password that you have received via e-mail.
Save
Check to save your login data. The next time you log in, you don’t have to
enter your user name and password again.
Always show login dialog
Check to display the TeleTrader MDS login dialog on every start of
Professional.
Reopen last workspace
Check to automatically open the workspace that you worked with last on every
start of Professional.
Server
Enter the address of the TeleTrader Market Data Server. The default setting is
mds*.ttweb.net.
Connection Settings
438
TeleTrader Software GmbH
Marc-Aurel-Straße 10-12, 1010 Vienna, Austria
E-Mail [email protected]
Internet http://professional.teletrader.com
Change this setting to 91.220.8.135, 91.220.8.136, 91.220.8.137 or
91.220.8.138 if you use a SOCKS proxy.
Settings
Click on this button to change the connection settings (see Connection
Settings in the Login Dialog on page 439).
I accept the terms in the
licence agreement
(I do not accept the licence
agreement)
You have to accept the terms in the licence agreement to be able to log in to
TeleTrader Professional.
EULA
Click on this button to view the End User Licence Agreement.
Sign up for a Demo Account!
Click on this link to create a free demo account for TeleTrader Professional.
Forgot your Password?
Click on this link to send your password to the e-mail address that you
provided during the registration process.
Connection Settings in the Login Dialog
In the TeleTrader MDS Login dialog, you can change the connection settings that are used to connect TeleTrader
Professional to the Market Data Server to collect quotes and news, and the proxy settings used to collect fundamental
data (company profiles and analyst recommendations) via a web service. We recommend to use the default settings
and only change those if you have problems connecting to the TeleTrader servers (see also Connection Problems on
page 445).
To access the Connection Settings dialog, click Settings in the TeleTrader MDS Login dialog.
Note
If the login dialog is not shown on the start of TeleTrader Professional, hold the SHIFT key while
starting TeleTrader Professional.
Market Data Server settings
These settings control the connection to the Market Data Server. We recommend to always use the default settings.
Control
Description
Ports
Port numbers of the incoming connection from the remote server. Multiple
ports must be separated with a comma.
These ports must be open for the connection to the Market Data Server.
Defaults ports are 2088 and 80.
Sites
Number of Market Data Server sites that are available for connection.
Default value is 4.
Use default setting
Check to use the default port or site settings.
Clear to enter your own port or site settings.
Keep MDS server settings after
update
Check to keep all servers that you have successfully connected to in the past
in the Server list on the Login dialog even after a software update.
Connection Settings
439
TeleTrader Software GmbH
Marc-Aurel-Straße 10-12, 1010 Vienna, Austria
E-Mail [email protected]
Internet http://professional.teletrader.com
SOCKS proxy settings
Use these settings only if you have to use a SOCKS proxy for connecting to the Market Data Server and are aware
of its configuration. You have to manually set the entry Server in the TeleTrader MDS Login dialog to 91.220.8.135,
91.220.8.136, 91.220.8.137 or 91.220.8.138 when you are using a SOCKS proxy.
Control
Description
Use SOCKS proxy
Check to connect to the Market Data Server using a SOCKS proxy.
IP and Port
IP address and port of the SOCKS proxy divided by a colon, for
example 10.0.0.222:1080. Ask your network administrator for your
SOCKS configuration.
User Name
User name required by your SOCKS configuration. Leave empty if no
user authentication is required.
Password
Password required by your SOCKS configuration. Leave empty if no
user authentication is required.
Web Service settings
These settings are used for the collection of fundamental data (company profiles and analyst recommendations), and
not for real-time quote data feeds.
Control
Description
Use web service (HTTP) data feed
Check to enable the web service for fundamental data.
Port
Port number of the web service.
This port must be open for the collection of fundamental data. Default
port is 80.
Use default setting
Check to use the default port settings.
Clear to enter your own port settings.
Connection Settings
440
TeleTrader Software GmbH
Marc-Aurel-Straße 10-12, 1010 Vienna, Austria
E-Mail [email protected]
Internet http://professional.teletrader.com
Use Internet Explorer proxy settings
Check to use the proxy settings of Internet Explorer.
Manual proxy configuration
Check to enter a different proxy configuration below.
HTTP proxy
Address of the HTTP proxy.
Port
Port of the HTTP proxy.
Monitoring the Connection on the Status Bar
Once TeleTrader Professional has successfully connected to the Market Data Server and the program is started, you
can monitor the status of the connection on the status bar:
Changes in the connection status are indicated with an icon:
Connection is established (Connected)
Connection is interrupted (Disconnected)
Connection is being reestablished (In progress)
To reconnect to the Market Data Server
When Professional loses the connection to the Market Data Server, you can try to establish a new connection.
▪
Right-click on the connection status icon and choose Connect.
▪
Professional tries to reestablish the connection.
Note
You can also manually interrupt the connection to the Market Data Server by choosing
Disconnect.
To change the settings for automatic reconnection
You can define how Professional reacts if it loses the connection to the Market Data Server.
▪
Right-click on the connection status icon and choose Settings.
▪
On the left side of the dialog, choose Settings.
Connection Settings
441
TeleTrader Software GmbH
Marc-Aurel-Straße 10-12, 1010 Vienna, Austria
E-Mail [email protected]
Internet http://professional.teletrader.com
▪
On the right side of the dialog, adapt the default settings to your needs.
Control
Description
Automatic reconnect
Check to let Professional try to reestablish the connection automatically.
Reconnect x sec.
Enter the amount of seconds after which Professional tries to reconnect.
Try to connect x times
Enter the number of times that Professional tries to reconnect.
Limitless
Check to let Professional try to reconnect an unlimited number of times
(until the connection is reestablished).
Clear to let Professional try to reconnect only for the number of times
defined above (even if the connection cannot be established).
Show Login Dialog when
reconnecting
Check to show the login dialog when Professional tries to reconnect.
Play sound when disconnect
Check to play a sound when the connection is lost. You have to choose the
sound file (WAV format) that should be played.
To view detailed connection status information
▪
Right-click on the connection status icon and choose Settings.
▪
On the left side of the dialog, choose Connection Info.
Connection Settings
442
TeleTrader Software GmbH
Marc-Aurel-Straße 10-12, 1010 Vienna, Austria
E-Mail [email protected]
Internet http://professional.teletrader.com
Label
Description
Present Status
General status of the connection (Connected or Disconnected)
Server Version
Version number of the connected Market Data Server (quote data and news)
Server Address
IP address and port of the connected Market Data Server
User Name
Currently logged-in user
Web Service domain name
Domain name of the connected Web Service (fundamental data)
Web Service IP/Port
IP address and port of the connected Web Service
Connection Log in the Information Pane
You can also see information about the connection between TeleTrader Professional and the Market Data Server in
the Information pane. The information is shown as a continuous log.
Note
Like all other panes, the Information pane can be undocked and moved on the screen. See
Undocking, Moving and Hiding Panes on page 144.
To display the Information pane
▪
On the View menu, click Information Pane.
Note
For all time data in the Information pane Greenwich Mean Time (GMT) is used.
To copy the data from the Information pane
▪
Right-click on the Information pane and choose Select All.
▪
Right-click again and choose Copy to Clipboard.
▪
Insert the copied data into another program or text editor.
Datafeed Options
In the Datafeed Options dialog, you can change the display settings for the login dialog, and set a timeout for the
connection.
To change the datafeed options
▪
On the Tools menu, choose Datafeed Options.
▪
In the Datafeed Options dialog, adapt the default settings to your needs.
Control
Connection Settings
Description
443
TeleTrader Software GmbH
Marc-Aurel-Straße 10-12, 1010 Vienna, Austria
E-Mail [email protected]
Internet http://professional.teletrader.com
Always show login dialog
Check to display the TeleTrader MDS login dialog on every start of Professional.
Timeout (in seconds)
Enter the timeout in seconds after which the connection is considered
interrupted.
Connection Settings
444
TeleTrader Software GmbH
Marc-Aurel-Straße 10-12, 1010 Vienna, Austria
E-Mail [email protected]
Internet http://professional.teletrader.com
Troubleshooting
This section gives you some tips as to what you can do when you encounter a problem while working with TeleTrader
Professional. If you cannot log in, or did log in but lost the connection afterwards, the sections Connection Problems
on page 445 and Testing your Connection with the Connectivity Checker on page 446 might help you.
When you see an error message after login, please refer to the section Error Messages on page 447. If you want to
contact the support team and send specific data about a problem, look at the sections Sending an Error Report
(Support Package) on page 449 or Reporting Bad Ticks or Wrong Data on page 449.
Connection Problems
If you cannot connect to the TeleTrader Market Data Server, TeleTrader Professional will either not start, or you will
only be able to work with your offline database (see Using Charts Offline on page 242). If you are experiencing
connection problems, follow the guide below to find and eliminate the possible cause for the problems.
I cannot log in
▪
You might receive an error message that gives you further hints as to where the problem lies.
See Error Messages on page 447.
▪
Make sure that the data in the login dialog is correct.
-
You can copy your user name and password from the e-mail with your login data and paste them into the
login dialog to make sure you do not mistype any character. Be careful not to copy any additional blanks
from the e-mail.
-
Make sure that the server name in the Server field of the login dialog is set to mds*.ttweb.net
Exception: When you use a SOCKS proxy, the address should be set to 91.220.8.135, 91.220.8.136,
91.220.8.137 or 91.220.8.138
▪
Check if your Internet connection in general is still working.
Open a web browser and try to go to some websites to verify this. If the Internet connection does not work,
contact your network administrator or Internet service provider.
▪
Check if Windows Management Instrumentation service is enabled.
Click on the Windows Start button and choose Control Panel > Administrative Tools > Services. Right-click
Windows Management Instrumentation and choose Properties from the context menu. In the Properties
dialog under the General tab, make sure that the Startup type is set to Automatic.
▪
Test the connection with the Connectivity Checker.
See Testing your Connection with the Connectivity Checker on page 446. If the test is successful, your network
settings are correct. Check your login data again or contact the support team.
▪
Contact your network administrator and ask if your Internet connection and firewall is configured correctly to allow
the connection to the Market Data Server.
See System Requirements on page 451.
▪
If the firewall settings cannot be changed accordingly, you can also try to connect using HTTP Tunneling
software.
See Alternative Ways to Connect to the TeleTrader Servers on page 456.
▪
If you have already successfully logged in before: Contact your network administrator and ask if there were any
changes in the Internet connection.
Common problems are changes in the firewall configuration. See System Requirements on page 451.
▪
Enter mds0.ttweb.net in the Server field of the login dialog and try to connect.
This should only be a temporary workaround. Change the setting to mds*.ttweb.net again as soon as your
connection problems are resolved.
Troubleshooting
445
TeleTrader Software GmbH
Marc-Aurel-Straße 10-12, 1010 Vienna, Austria
E-Mail [email protected]
Internet http://professional.teletrader.com
▪
Contact the support team.
See Customer Support on page 534.
I was logged in successfully, but the connection was lost
When the connection between TeleTrader Professional and the Market Data Server is lost, the connection status icon
in the status bar will show that Professional is disconnected.
▪
Check if your Internet connection in general is still working.
Open a web browser and try to go to some websites to verify this. If the Internet connection does not work,
contact your network administrator or Internet service provider.
▪
Try to reconnect.
See Monitoring the Connection on the Status Bar on page 441.
▪
Try to close Professional and log in again.
If you still cannot log in, you might receive an error message that gives you further hints as to where the problem
lies. See Error Messages on page 447.
▪
Contact your network administrator and ask if there were any changes in the Internet connection.
Common problems are changes in the firewall configuration. See System Requirements on page 451.
▪
Contact the support team.
See Customer Support on page 534.
Note
Sometimes your connection might be lost if you are logged in to TeleTrader Professional on more
than one computer with the same user account. TeleTrader Professional usually does not allow
multiple sessions for one user at the same time, therefore all computers but one will automatically
lose their connection to the Market Data Server. To connect the computer that you are working
with at the moment, try to reconnect from that computer. All other computers with the same user
login will be disconnected.
Testing your Connection with the Connectivity Checker
With the Connectivity Checker you can test if your computer can connect with the TeleTrader Market Data Server.
To test your connection with the Connectivity Checker
▪
Click on the Windows Start button and choose All Programs > TeleTrader Professional > Check
connectivity.
▪
Click the Start button and wait until the blue progress bar shows that the test is completed.
Troubleshooting
446
TeleTrader Software GmbH
Marc-Aurel-Straße 10-12, 1010 Vienna, Austria
E-Mail [email protected]
Internet http://professional.teletrader.com
▪
If the connection test was successful, you will see one or more lines ending with OK.
▪
If the connection test fails, the Connectivity Checker shows one or more lines with ERROR.
▪
You can click the button Copy on the right to transfer the results to the clipboard, and then insert the copied data
into another program or text editor.
Error Messages
If you cannot log in to TeleTrader Professional, you might receive one of the following error messages. Usually, they
will help you to identify where the connection problem lies. For general information, see Connection Problems on
page 445.
Login failed, wrong username / password
This error occurs when the user name and/or password that you provided in the login dialog are wrong. It also shows
that Professional can in principle connect to the Market Data Server, which means that your other connection settings
should be correct.
Tips
▪
Make sure that the user name and password in the login dialog are correct.
Copy your user name and password from the e-mail with your login data and paste them into the login dialog to
make sure you do not mistype any character. Be careful not to copy any additional blanks from the e-mail.
▪
Request your password again if you have lost it.
Click on the link Forgot your Password? and enter your user name in the form that appears. Your account data
will be sent to the e-mail address that you provided during the registration process.
▪
Sign up for a user account.
If you do not know your login data yet, click on the link Sign up for a Demo Account! in the login dialog to sign
up for a free trial account of TeleTrader Professional.
Login failed, user account expired
This error occurs when the user name that you provided in the login dialog is not valid anymore. It also shows that
Professional can in principle connect to the Market Data Server, which means that your other connection settings
should be correct.
Troubleshooting
447
TeleTrader Software GmbH
Marc-Aurel-Straße 10-12, 1010 Vienna, Austria
E-Mail [email protected]
Internet http://professional.teletrader.com
Tips
▪
Contact the support team to sign up for a permanent user account.
This version of TeleTrader Professional is not supported anymore
This error occurs when the version of TeleTrader Professional you are running on your system has fallen out of
support. You have to update to a newer version of TeleTrader Professional to log in with your user account.
Tips
▪
Click the button Upgrade to automatically download and install the latest version of TeleTrader Professional. See
also Automatic Update Process on page 453.
▪
After the update has completed, you can log in with your normal user account.
Cannot resolve server name
This error can have several reasons:
▫
The server name in the Server field of the login dialog is not correct.
▫
The domain name could not be resolved (possibly DNS problems).
▫
There are problems with the Internet connection.
▫
A firewall is blocking the connection.
Tips
▪
Make sure that the server name in the login dialog is correct.
The Server field of the login dialog should be set to mds*.ttweb.net
Exception: When you use a SOCKS proxy, the address should be set to 91.220.8.135, 91.220.8.136,
91.220.8.137 or 91.220.8.138
▪
Check if your Internet connection in general is still working.
Open a web browser and try to go to some websites to verify this. If the Internet connection does not work,
contact your network administrator or Internet service provider.
▪
Test the connection with the Connectivity Checker.
See Testing your Connection with the Connectivity Checker on page 446. If the test is successful, your network
settings are correct. Check your login data again or contact the support team.
▪
Contact your network administrator and ask if your Internet connection and firewall is configured correctly to allow
the connection to the Market Data Server.
See System Requirements on page 451.
▪
If the firewall settings cannot be changed accordingly, you can also try to connect using HTTP Tunneling
software.
See Alternative Ways to Connect to the TeleTrader Servers on page 456.
▪
If you have already successfully logged in before: Contact your network administrator and ask if there were any
changes in the Internet connection.
Common problems are changes in the firewall configuration. See System Requirements on page 451.
▪
Enter mds0.ttweb.net in the Server field of the login dialog and try to connect.
This should only be a temporary workaround. Change the setting to mds*.ttweb.net again as soon as your
connection problems are resolved.
▪
Contact the support team.
See Customer Support on page 534.
QuickBar Error. Line -1, Character -1
This error occurs when the QuickBar cannot be loaded. The component msxml4.dll might be missing.
Troubleshooting
448
TeleTrader Software GmbH
Marc-Aurel-Straße 10-12, 1010 Vienna, Austria
E-Mail [email protected]
Internet http://professional.teletrader.com
Tips
▪
Download the file msxml4.dll
For example from this link: http://support.microsoft.com/kb/269238
▪
Save this file into the folder C:/WINDOWS/System32
▪
Try to start Professional again
Sending an Error Report (Support Package)
If the program encounters a serious problem, you can send an error report to the support team. Such reports are also
created automatically whenever the application experiences a severe error.
To send an error report (support package)
▪
On the Help menu, click Send support package.
▪
Enter a description of the error and of all the steps that you took before the error occurred. Detailed information
helps us to detect and fix potential software bugs.
▪
Click Send Report. If you want to see the contents of the support package before sending it, click on the link
next to Content.
▪
The support package is generated and automatically attached to a new e-mail message. The process of
collecting information after you clicked the Send Report button might take some minutes.
▪
As soon as the e-mail message appears, click Send to forward your report to the support team.
Reporting Bad Ticks or Wrong Data
If you see a bar or candle on a chart that seems to display wrong data, please notify TeleTrader. We will verify the
data and, if necessary, correct the value as soon as possible.
Troubleshooting
449
TeleTrader Software GmbH
Marc-Aurel-Straße 10-12, 1010 Vienna, Austria
E-Mail [email protected]
Internet http://professional.teletrader.com
To report wrong data / bad ticks
▪
Right-click on the bar or candle that displays wrong data and choose Report Bad Tick.
▪
In the dialog window, select the check box Wrong value next to each price or value that is not correct. If there
are several errors on the same bar, you can report them at the same time.
▪
If you want to, you can also add a comment to your report.
▪
Click Send.
Clean Reinstallation
In some cases, system errors might be caused by corrupt workspaces, documents or other data. Such problems can
usually be solved with a complete new installation of TeleTrader Professional.
With the program CleanRemoval.exe you can completely remove TeleTrader Professional from your computer,
including all settings, registry entries, default workspaces and templates. After that, you can download and install the
latest version of TeleTrader Professional. Your user-specific data, such as templates, default settings etc., can be
backed up and restored during the process.
Note
The CleanRemoval.exe program file will be sent to you on request by the support team (see
Customer Support on page 534).
To remove and reinstall TeleTrader Professional
▪
Log on to your computer as an administrator – the program can only be run with administrator rights. If you are
unsure, ask your system administrator.
▪
Make sure that your computer is connected to the Internet – you will need an active Internet connection to
download the latest version of TeleTrader Professional.
▪
Close TeleTrader Professional.
▪
Run the program CleanRemoval.exe that you have received from the support team. The program first determines
information about the installed version. This can take some time.
▪
In the Software Removal Tool dialog, choose Remove previous installation and install new version.
Note
When you don't want a reinstallation and just want to remove TeleTrader Professional, choose
Remove previous installation instead.
▪
If you want to back up your customized settings, workspaces, documents and templates, select Save user
specific application data.
▪
Click Start Removing Files.
▪
After TeleTrader Professional has been removed from your computer, the latest version is automatically
downloaded and the installation wizard is started. Please do not try to start TeleTrader Professional until the
words Setup done OK and/or Copyback done OK are shown in the Software Removal Tool dialog.
Removed data
When removing TeleTrader Professional from your computer, the following data is deleted:
▫
Application data in C:\Program Files\Teletrader\Professional
▫
Personal settings:
-
on Windows XP: C:\Documents and Settings\[user]\Application Data\Professional
Troubleshooting
450
TeleTrader Software GmbH
Marc-Aurel-Straße 10-12, 1010 Vienna, Austria
E-Mail [email protected]
Internet http://professional.teletrader.com
-
on Windows Vista / Windows 7: C:\Users\[user]\AppData\Roaming\Professional
▫
Default workspaces
▫
Registry keys in:
-
HKEY_CURRENT_USER\Software\Teletrader\Professional
-
HKEY_LOCAL_MACHINE\Software\Teletrader\Professional
Backed-up user-specific data
If you have activated the option Save user specific application data, the following data is saved and restored
automatically after reinstallation:
▫
Changed templates
▫
Changed studies
▫
Default workspaces
▫
Some settings and registry entries, for example chart settings, colors, FastLook, symbol search, HTTP trading
integration
System Requirements
Computer
Hardware
PC with 1,66 GHz or higher
Operating System
Windows 8, Windows 7 (recommended), Windows Vista, Windows XP
All operating systems need Microsoft .NET Framework 4.0, the most recent service
packs and the component MSXML 6.0. Some functionalities of TeleTrader Professional
need components from Microsoft Internet Explorer 7 (or higher).
RAM
1 GB
We recommend at least 2 GB for large time series or a high number of charts and time
and sales documents.
Free Disk Space
ca. 85 MB of free hard drive space for a complete installation
Internet Connection
Persistent Internet connection with a recommended bandwidth of at least 64 kbps
Firewalls
Ports 2088 and 80 need to be open for TCP/IP traffic to the market data server (allowing HTTP traffic is not sufficient)
▫
Some functions (automatic updates, fundamental data) require a HTTP connection
▫
Personal firewalls have to be set up to allow traffic for TeleTrader Professional. You can either enable all
outgoing traffic from TeleTrader Professional, or enable outgoing TCP traffic on port 2088 and HTTP traffic on
port 80
▫
SOCKS proxies are supported
Antivirus software
For better performance, we recommend configuring your antivirus software so that it does not scan the TeleTrader
Professional folders. The Professional folders are usually located at the following paths:
▫
Program data: C:\Program Files\Teletrader\Professional
▫
Personal settings:
-
Windows XP: C:\Documents and Settings\[user]\Application Data\Professional
Troubleshooting
451
TeleTrader Software GmbH
Marc-Aurel-Straße 10-12, 1010 Vienna, Austria
E-Mail [email protected]
Internet http://professional.teletrader.com
-
Windows Vista: C:\Users\[user]\AppData\Roaming\Professional
The executable file is called Professional.exe.
Troubleshooting
452
TeleTrader Software GmbH
Marc-Aurel-Straße 10-12, 1010 Vienna, Austria
E-Mail [email protected]
Internet http://professional.teletrader.com
Updates
TeleTrader Professional includes an automatic update function. On every start of the program, Professional checks if
you are running the most recent version. Therefore, if a newer version is available for download, you will be notified
automatically.
If you don’t want Professional to perform this check on every start, you can set the update interval to weekly, monthly
or quarterly checks. If you do so, you can also do an additional manual check for updates occasionally.
Note
To completely remove and reinstall TeleTrader Professional (including registry keys, settings etc.),
see also Clean Reinstallation on page 450.
Automatic Update Process
As soon as Professional finds a new update, the update process will be run automatically when you start the program
the next time.
To follow the automatic update process
▪
The installation package is downloaded from the server. Depending on the speed of your Internet connection,
this will take some minutes.
Note
▪
If you do not want to update Professional right now, click Cancel during the download. You will be
asked to do the update again when you start the program the next time.
After the download has completed, TeleTrader Professional will be updated automatically. This process is not
interactive, which means that you will not have to do anything during the update process. You might see the
following window:
Updates
453
TeleTrader Software GmbH
Marc-Aurel-Straße 10-12, 1010 Vienna, Austria
E-Mail [email protected]
Internet http://professional.teletrader.com
▪
When the update is finished, a message will appear. Even if the update process takes some time, please do not
attempt to start Professional before this message is shown!
▪
The update is now completed. Click OK and start Professional again.
Note
After an update, you might have to click on the option I accept the terms in the licence
agreement in the login dialog before you can login to Professional.
Checking for Updates
You can check manually for updates. This is especially useful if you have set the update interval to a longer period, so
that Professional does not detect new updates automatically on every start.
To check for updates
▪
On the Help menu, click Check for updates.
▪
Professional looks for the latest available version and compares it with the version you are running now. If you
are running the latest version this message appears:
▪
If a newer version is available, you will be asked to update. Click Yes to update Professional now.
Note
▪
If you click No, the update process is cancelled. You should then do the update as soon as
possible. We recommend to always use the latest version of Professional.
The installation package is downloaded from the server. Depending on the speed of your Internet connection,
this will take some minutes.
Updates
454
TeleTrader Software GmbH
Marc-Aurel-Straße 10-12, 1010 Vienna, Austria
E-Mail [email protected]
Internet http://professional.teletrader.com
▪
After the download has completed, TeleTrader Professional will be closed automatically. You might be asked to
save your workspace (unless you have disabled this question before).
▪
The automatic update process is started now: See Automatic Update Process on page 453. Please wait until the
update has completed, and then start Professional again.
Changing the Update Interval
TeleTrader Professional usually checks for updates on every start of the program. If this is inconvenient for you, you
can change the update interval to weekly, monthly or quarterly checks.
To change the update interval
▪
On the Tools menu, click Options.
Note
You can also click on the button Settings when the update dialog is shown on the screen.
▪
On the left side of the dialog, choose Updater.
▪
On the right side of the dialog, select the update interval that is most convenient to you (On each start, Weekly,
Monthly or Every 3 months).
▪
Click OK.
Note
Updates
If you want to disable updates completely, please contact the support team for the appropriate
registry setting.
455
TeleTrader Software GmbH
Marc-Aurel-Straße 10-12, 1010 Vienna, Austria
E-Mail [email protected]
Internet http://professional.teletrader.com
Third Party Software
You can use some helpful third party software tools to overcome connectivity problems related to firewall or proxy
settings, share workspaces between different PCs you are working on or install TeleTrader Professional on Apple
Macs.
Note
TeleTrader is not connected with any of the companies producing that software and cannot
guarantee that the solutions mentioned will work like expected.
Alternative Ways to Connect to the TeleTrader Servers
If local or corporate firewall or proxy settings prevents the usage of a TCP connection (which is required by
Professional), and you cannot configure your firewall to allow outgoing TCP traffic to the TeleTrader servers, you can
try using HTTP tunneling software which tunnels the TCP traffic through HTTP. If your environment supports the
SOCKS protocol, Professional can also be configured to connect to a SOCKS proxy (see Connection Settings in the
Login Dialog on page 439).
Note
If you are in a corporate environment, take care not to violate your in-house security and software
policies. Always ask for permission before installing software.
HTTP-Tunnel
The HTTP-Tunnel Client runs in your system tray acting as a SOCKS server. It offers a free as well as a commercial
service.
▪
Download the HTTP-Tunnel Client from http://www.http-tunnel.com/ and install it on your computer.
▪
In the HTTP-Tunnel Client, choose Settings > Add Ports/Applications and configure the destination IP
91.220.8.135 with destination port set to 2088.
▪
Start TeleTrader Professional.
▪
In the TeleTrader MDS Login dialog, set the Server field to the IP address 127.0.0.1.
▪
TeleTrader Professional should now be able to connect to the Market Data Server.
Sharing Workspaces Through Online Drives
Storing workspaces on an online drive allows you to share these workspaces between the different PCs that you are
working on (for example your home PC and your work PC). You can also upload charts, price pages or workspaces
on a network drive and share it with others.
Online storage providers offer easy-