1
Jurik Research Limited Use Software License Agreement
TO READ THIS DOCUMENT,
YOU MUST AGREE TO THE FOLLOWING TERMS AND CONDITIONS:
Jurik Research & Consulting ("JRC") grants you a non-exclusive license to use the accompanying software
documentation ("Documentation") in the manner described as follows:
1. LICENSE GRANT. As licensor, JRC grants to you, and you accept, a non-exclusive license to use the
enclosed Documentation, only as authorized in this agreement.
2. COPYRIGHT. This Document is copyrighted and protected by both United States copyright law and
international treaty provisions. All rights are reserved. You may not permit other individuals to use the
Documentation except under the terms in this agreement. No part of the Documentation may be reproduced or
transmitted in any form or by any means, for any purpose other than the purchaser's personal use without the
written permission of JRC. You may not remove any proprietary notices or labels on the Documentation. You
may print this document only for your personal use.
3. LIMITED WARRANTY. Information in the Documentation is subject to change without notice and does not
represent a commitment on the part of JRC. The user's sole remedy, in the event a typographical or other error
is found in the Documentation within the warranty period, is that JRC will replace the documentation. The
above express warranty is the only warranty made by JRC. It is in lieu of any other warranties, whether
expressed or implied, including, but not limited to, any implied warranty of merchantability of fitness for a
particular purpose. This disclaimer of warranty constitutes an essential part of the agreement. Some
jurisdictions do not allow exclusions of an implied warranty, so this disclaimer may not apply to you.
4. LIMITATION OF LIABILITY. The user agrees to assume the entire risk of using the software described by
the Documentation. In no event shall JRC be liable for any indirect, incidental, consequential, special or
exemplary damages or other damages, regardless of type, including, without limitation, damages for loss of
profit or goodwill resulting from the use of this documentation. In no event shall JRC be liable for any damages
even if JRC shall have been informed of the possibility of such damages, or for any claim by any other party.
Some jurisdictions do not allow the exclusion or limitation of incidental or consequential damages, so this
exclusion and limitation may not apply to you. JRC's total liability to you or any other party for any loss or
damages resulting from any claims, demands or actions arising out of or related to this agreement shall not
exceed the license fee paid to JRC for use of the software described by the Documentation.
5. TITLE. You acquire no right, title or interest in or to the Documentation. Title, ownership rights, and
intellectual property rights shall remain in Jurik Research and/or its respective suppliers.
6. GOVERNING LAW. The license agreement shall be construed and governed in accordance with the laws of
California. In any legal action regarding the subject matter hereof, you agree to have venue be in the State of
California.
7. COST OF LITIGATION. In any legal action regarding the subject matter hereof, the prevailing party shall be
entitled to recover, in addition to any other relief granted, reasonable attorney fees and expenses of litigation.
8. TERMINATION. The license will terminate automatically if you fail to comply with the limitations described
herein. On termination, you must destroy all your copies of the Software and Documentation.
9. NO WAIVER. The failure of either party to enforce any rights granted hereunder shall not be deemed a
waiver by that party as to subsequent enforcement of rights in the event of future breaches.
10. MISCELLANEOUS. If any provision of this Agreement is held to be unenforceable, such provision shall be
reformed only to the extent necessary to make it enforceable.
© 2000 Jurik Research and Consulting
Aurora, CO
www.jurikres.com
JURIK RESEARCH
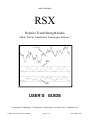
RSX
Relative Trend Strength Index
Add-In Tool for TradeStation Technologies Software *
U.S. 30Year Bonds
RSX
80
20
80
20
RSI
USER’S GUIDE
* TradeStation Technologies: TradeStation 4, SuperCharts 4, ProSuite 2000, TradeStation Pro
© 2000 Jurik Research and Consulting
Aurora, CO
www.jurikres.com
Installation Instructions
The software accompanying this manual is designed to be used inside TradeStation Technologies (formerly
Omega Research) TradeStation 4, SuperCharts 4, TradeStation 2000, ProSuite 2000 or TradeStation Pro.
If you do not have an up-to-date version, call TradeStation Technologies for the appropriate upgrade.
Getting Jurik's tools into a TradeStation software application is a 2-step process:
• INSTALLATION: to create .ELA or .ELS files containing the Jurik modules.
• TRANSFER: to move the modules into your TradeStation software product.
Step 1: INSTALLATION
1. The name of the installation software is JRSACT_2.EXE
2. If you HAVE received a password from Jurik Research (on a colored sheet of paper that came with this
software), then SKIP THIS STEP and proceed to step #3. Otherwise, using Windows' Explorer (or File
Manager), double-click or run the installer program JRSACT_2.EXE. If you have TradeStation 4 or
SuperCharts 4, enter your security block number if you have one. (SuperCharts end-of-day users probably
have no security block number so they should leave the field blank.) If you have TradeStation 2000 or
ProSuite 2000, enter your TradeStation Customer ID number. Working through, select all the Jurik tools
you currently have license to use. Eventually the program will give you an identification code. To
receive your activation password from us, e-mail to: [email protected], or call 323-258-4860 or fax
323-258-0598, and tell us your name, phone number, the platform you are installing to (TS4, SC4,
TS2000, PS2000) and the identification code. After receiving your password, proceed to step #3.
3. Close your software application (SuperCharts, TradeStation or ProSuite). Leaving it open may interfere
with the installation process. You do NOT need to shut down the data server.
4. Using Windows' Explorer (or File Manager), double-click or run JRSACT_2.EXE. Enter your security
block number or Customer ID number, if applicable. (SuperCharts end-of-day users probably have no
security block number.) Also enter your password. Click OK. Select all and only those tools you
currently have license to use, otherwise the password will not be accepted. Click OK. Follow other
instructions on screen.
5. At this point, all the Jurik tools (eg. JMA, VEL, CFB, WAV, DDR, RSX) you currently have license to
use were placed as Easy Language files on your hard drive. The next page shows how to transfer (import)
them into your TradeStation software product.
3
Step 2: TRANSFER / IMPORT
Transferring to TradeStation 4.0 / SuperCharts 4.0
1.
Run TOOLS / VERIFY_ALL to ensure all linkages are correct.
2.
Using either QuickEditor or PowerEditor, use the FILE / OPEN command to bring up a dialog box,
then press the TRANSFER button.
3.
Select "Transfer .... FROM Easy Language Archive File" and press the OK button.
4.
Transfer in RSX, whose default filepath is C:\JRSOMEGA\EASYLANG\JRC_RSX.ELA. (You may
have elected to change this filepath during installation.) Enter the filepath and press OK.
5.
Select "Transfer All" and press OK. All JMA related tools will be automatically transferred.
6.
Do not assume all transferred modules were properly verified. Execute TOOLS \ VERIFY_ALL to
ensure all linkages are correct.
Importing to TradeStation 2000 / ProSuite 2000
1.
Using the PowerEditor, execute FILES \ VERIFY_ALL to ensure all linkages are correct.
2.
Execute the FILE \ IMPORT_and_EXPORT command.
3.
Select "Import Easy Language Archive Files" to import .ELS files. Press the OK button.
4.
Import RSX, whose default filepath is C:\JRSOMEGA\EASYLANG\RSX.ELS. (You may have
elected to change this filepath during installation.) Enter the filepath or use the browser to find it.
Make sure you select to import all studies contained within the ELS file. Press OK.
5.
During importation, it may want to load the same function several times, so you may repeatedly see a
dialog box asking if you want to overwrite an already existing module. To speed up the import
process, select "YES TO ALL".
6.
Do not assume all the imported modules were properly verified. Execute the command FILES \
VERIFY ALL to ensure all linkages are correct.
4
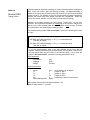
IMPORTANT NOTICE
When upgrading
from
TradeStation 4 or SuperCharts 4
to
TradeStation 2000 or TradeStation Pro
INCOMPATIBILITY
TradeStation 2000 and TradeStation Pro (hereafter referred to as "TS2000") are 32-bit programs,
which makes them completely different than TradeStation 4 and SuperCharts 4 (hereafter referred
to as "TS4/SC4"), which are 16-bit programs. Consequently, the Jurik modules designed for
TS4/SC4 are not compatible with TS2000. To get Jurik modules for TS2000, you must run the
installer and designate that platform.
EXPANDED NAMES
Easy Language studies (functions, indicators and systems) will include during transfers (imports &
exports) all functions required to make them work. Therefore, any studies that you import to
TS2000 that were developed in TS4/SC4 will also transfer with them any Jurik functions that they
utilize. Because these functions are not compatible with TS2000 (see incompatibility notice
above), it is imperative that they not overwrite the Jurik modules already installed in TS2000.
To accomplish this, the names of all Jurik functions, indicators and systems for TS2000 have been
expanded to include the suffix "2k". For example, if this user manual refers to a function named
JRC.RSX, its expanded name for TS2000 is JRC.RSX.2k
You will need to modify any studies you transferred in from TS4/SC4 so that they will now
include the ".2k" suffix on the names of all Jurik functions that they utilize.
5
Executive Summary
brief instructions for those who don’t read user manuals
Use the JRC RSX indicator just as if it were the classical RSI indicator. It uses a proprietary function, called
JRC.RSX. You can code your own Easy Language modules to employ the user function as follows:
value1 = JRC.RSX ( SERIES , LENGTH ) ;
SERIES is the time series to be processed, such as the daily closing price. To use closing prices, replace
“SERIES” in the above expression with “close”. This input series can also be any QuickEditor expression that
produces a series. For example, “SERIES” could be replaced by “7+average (close, 14)”.
LENGTH is roughly the number of bars used in the calculation of RSX, and it determines the degree of
smoothness. Small values make RSX respond rapidly to price change and larger values produce smoother, flatter
curves. Typical values for LENGTH range from 5 to 30. You can even use decimal numbers, such as 28.3.
There may be times when you want to feed RSX your own calculated time series variable, instead of the standard
open, low, low and close. For this purpose, we have a special version of RSX, called JRC.RSX.flex. In the
following example, the time series variable is calculated just prior to feeding RSX:
series = close + 0.5 * stdev ( high , 10 ) ;
result = JRC.RSX.flex ( series , 14 ) ;
NOTE: Although JRC.RSX.flex has this advantage over JRC.RSX, it also has two important disadvantages.
Both are directly the result of the properties of type SIMPLE user functions in Easy Language. You need to
decide which version of RSX is more appropriate in your coding. The two disadvantages of the flex version are:
1)
JRC.RSX.flex does not produce a time series. Consequently, you cannot reference past values of it directly.
However, you can do so indirectly by referring its output to a variable and then seeking past values of that
variable. For example:
INVALID EXPRESSION:
result = JRC.RSX.flex (series,length)[7] ;
VALID EXPRESSION:
value1 = JRC.RSX.flex (series,length) ;
result = value1[7] ;
Note: This method of referencing past values of variables in not permitted inside type-SIMPLE functions.
2) JRC.RSX.flex is not automatically evaluated on every bar. You must control when it gets evaluated. This
can be advantageous. For instance, you can take a moving average of only Tuesday's closing prices when
using a daily chart, by writing code so that RSX is called only on Tuesdays. For example:
if (DateOfWeek(Date) = 2) then result = JRC.RSX.flex (close,length) ;
----------------------------------------------------------------------------------------------------------------------------------------Max number of bars RSX will reference equals the lookback of the input time series plus the lookback of RSX
itself.
INPUT to RSX
close
close[5]
average(close[5],14)
FULL EXPRESSION
JRC.RSX ( close, 21 )
JRC.RSX ( close[5], 21 )
JRC.RSX ( average(close[5], 14 ), 21 )
6
MaxBarsBack
21
21 + 5
21 + 14 + 5
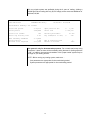
Why use RSX ?
The popular RSI indicator is very noisy.
RSX eliminates noise completely !!
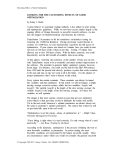
There is only one convincing way to illustrate the power of RSX. In the chart below, we see daily bars of U.S.
Bonds analyzed by RSX and the classical RSI.
RSX is very smooth. Typically any indicator can be smoothed by a moving average, but the penalty is added lag
to the resulting signal. Not only is RSX smoother than RSI, but its smoothness comes without added lag.
RSX permits more accurate analysis, helping you avoid many trades that would have been prematurely trigged by
the jagged RSI. Once you begin using RSX, you may never apply the classical RSI again!
U.S. 30Year Bonds
RSX
80
20
80
20
RSI
7
User Guide
for use in
Power Editor
After installing RSX, the indicator JRC RSX is ready for use. You may use it within
TradeStation and SuperCharts the same way as you would use the classical RSI
indicator. The indicator JRC RSX consists of the following Easy Language code:
INPUTS: PRICE(CLOSE), LENGTH(8) ;
VARS: RSXplot(0);
RSXplot = JRC.RSX(PRICE, LENGTH);
PLOT1(RSXplot,"JRC RSX");
The first line of code says the indicator requires 2 input parameters. The first one is
PRICE, which defines the time series to be processed. It defaults to the closing price
of each bar. PRICE can be any simple calculation that produces a series, such as
(High+Low+Close)/3, or any function that produces a series as its output, such as
“average(close, 14)”. In the later case, a line of code may look like this:
RSXplot = JRC.RSX(average(close,14), LENGTH);
Although any type-series function can be used to generate input to JRC.RSX, we do
not recommend using any time series other than simple combinations of Open, High,
Low and Close, for example, (H+L+C) / 3. This gives results with the least lag.
The next parameter is LENGTH, and it determines the function’s time scale. Larger
values produce a smoother result. The default value for LENGTH is 8.
The third line of code above calls the user function JRC.RSX. This user function
contains a proprietary algorithm. It is encrypted and cannot be viewed. The last line
tells the indicator to draw a plot of RSX's results.
Set the indicator's PROPERTIES so that its maximum number of bars referenced
(MaxBarsBack) is as specified in the Executive Summary section of this manual.
You may want to design your own indicators that use the underlying user function
directly. To see how to do this, read the “Executive Summary”earlier in this manual.
SuperCharts users can easily build their own RSX indicator by specifying it as follows:
for use in
Quick Editor
Indicator Name:
Plot1 Formula:
MaxBarsBack:
Inputs:
my_RSX
JRC.RSX ( price, length )
1
{see Executive summary for more info}
Name
Default Value
Series
close
Length
8
The formula for plot1 may use complex expressions for PRICE. PRICE can be any
calculation that produces a series, such as (High+Low+Close)/3, or any function that
produces a series as its output, such as “average(close, 14)”. In the later case, the
formula for Plot1 might look like this....
JRC.RSX(average(close,14), LENGTH);
8
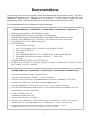
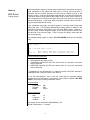
Demonstrations
The remaining portion of this user manual contains demonstrations that show the power of RSX. The demonstrations include systems for the S&P and for US 30-Yr Bonds. The installer created two data files in the
JRSOMEGA \ DATA directory: USBONDS.TXT and SP500.TXT. You are invited to perform the same
experiments as we did. Just follow the instructions in the manual, and you should get similar results.
To load the sample data for any demonstration, following these steps:
LOADING SAMPLE U.S. T-BOND DATA (or SP500 DATA) in TradeStation 4 / SuperCharts 4
1.
2.
3.
4.
5.
6.
Select menu command FILE / NEW WINDOW / CHART
In the INSERT PRICE DATA box select DIRECTORY radio button
Press NEW DIR and enter C:\JRSOMEGA\DATA\ in the DIRECTORY field and select ASCII
Press OK. Select USBONDS.TXT or SP500.TXT Select "Prompt for Format". Press PLOT
Select FIRST LINE OF DATA FILE and press OK.
In SETTINGS box
• Select FUTURE as data type
• enter "US" {for Bonds} or “SP” {for SP500} in the SEARCH FOR field
• Deselect EXACT MATCH
• Press FIND
• Select "TREASURY BONDS 30 Yr" or “S&P500 Index” in the DATA NAME field
• For the S&P, specify these price settings: Min Move = 5, Value = 500
• Press OK
7. In FORMAT PRICE DATA box, select SETTINGS tab
8. For Bonds, enter ‘First Date’as 1/03/84 and ‘Last Date’as 1/03/90. For S&P, Enter ‘First Date’as 1/01/83
and ‘Last Date’as 1/10/96. Press OK
LOADING SAMPLE U.S. T-BOND DATA (or SP500 DATA) in ProSuite 2000 / TradeStation 2000
1.
Select menu command FILE / NEW… / TradeStation Chart
2.
Select menu command INSERT / SYMBOL … , then press NEW DIR…
3.
Select DATA TYPE as ASCII and press the BROWSE button and find the C:\ JRSOMEGA \ DATA folder
4.
Press OK to exit the Browse box. Press OK to exit the NEW DIRECTORY box.
5.
Select either USBONDS.TXT or SP500.TXT and press PLOT.
6.
Select date format MONTH/DAY/YEAR for SP500, or select YEAR/MONTH/DAY for USBONDS. Press OK
7.
In the Settings box, set DATA TYPE: future
8.
For S&P: set SEARCH FOR = SP.
For BONDS, set SEARCH FOR = US
9.
Deselect “EXACT MATCH”, press FIND
Select “First Line of Data File”
10. FOR S&P: Select “S&P500 Index” in the DATA NAME field, set MIN MOVE= 5, VALUE = 500. Press OK
FOR BONDS: Select “TREASURY BONDS 30 Yr”, set MIN MOVE= 1, VALUE = 1000. Press OK
11. In Format Symbol box, For Bonds, enter ‘First Date’as 1/03/84 and ‘Last Date’as 1/03/90.
For S&P, Enter ‘First Date’as 1/01/83 and ‘Last Date’as 1/10/96. Press OK
9
DEMO #1
Load any price data onto a chart.
Comparing
RSX to RSI
Insert onto your chart the indicator “Custom 2 line”. Before pressing the PLOT
button, make sure the “Format”box is selected.
For the field “Input 1”, enter the formula … RSI ( close , 10 )
For the field “Input 2”,
in TradeStation/SuperCharts 4, enter the formula … JRC.RSX ( close , 10 )
or in TradeStation 2000, enter the formula … … ...… JRC.RSX.2k ( close , 10 )
Set it to plot on any subgraph other than subgraph 1. Press OK button.
For the chart below, we used daily US Bonds data. Your chart may look different.
The heavy line is RSX and the thin, lighter line is RSI. Note RSX smoothness.
Smoothness can be adjusted by varying the LENGTH parameter. Small values
make RSX respond rapidly to price change and larger values produce smoother,
flatter curves. Typical values for LENGTH range from 5 to 80.
NOTE
ALL DEMONSTRATION SYSTEMS
Historical back-testing does not prove a system will be profitable in the future,
but it can demonstrate whether or not a system would be worthless in the future.
The example trading systems described in this manual are for illustration purposes only.
Do not trade real money using these demonstration systems.
A real trading system should be tested extensively for various kinds of flaws,
including over sensitivity to parameter settings.
A real trading system requires not one but several mutually concurring indicators as well as
good money management rules useful for assessing how much to invest and for placing exit stops.
10
DEMO #2
RSX Zones
Trading System
RSX measures two aspects of market trend simultaneously: momentum and purity.
Trend momentum is the speed with which price is moving, and trend purity is
concerned with the relative proportion of bars that are actually moving in the
direction of trend. A fast moving upward trend with 90% of the last 20 bars moving
in the same direction will produce a strong RSX value (a value close to either 0 or
100). Congested price movement will have about half of the price bars moving up
and half moving down. In that case, RSX will produce a neutral value of 50 out of
100 (just as the classical RSI would).
Trend momentum and purity are import aspects to consider when timing trade
entries and exits. The following demonstration trading system is based on the
following key rules: Buy when RSX is rising, sell when RSX is falling. However, if
RSX is in either extreme long/short range, let the current position continue until
RSX falls out of the extreme range. There’s no point in ending a trade when the
trend is going strong.
The installed trading system is called “JRC RSX ZONES” and has the following
code:
Inputs: rlen(12), LongZone(74), ShrtZone(34);
vars: RSX(0) ;
RSX = JRC.RSX.2k(h+l,rlen) ;
If
else if
RSX < RSX[1] AND RSX < LongZone then sell
RSX > RSX[1] and RSX > ShrtZone then buy ;
System parameter definitions:
• RLEN specifies the length of RSX.
• LONGZONE specifies the RSX level above which no “sell-short” commands
may be executed.
• SHRTZONE specifies the RSX level below which no “buy-long” commands
may be executed.
In TradeStation 4 and SuperCharts 4, it uses the function JRC.RSX, whereas in
TradeStation 2000 it uses the function JRC.RSX.2k.
To run this demonstration, load in the U.S. Bond data we supplied (loading
instructions are provided earlier in this manual). Next, insert the system "JRC RSX
ZONES", and set the following parameters values:
Cost parameters:
Commission
Slippage
Margin
$30
$50
$2700
System parameters:
Rlen
LongZone
ShrtZone
12
74
34
Max number of bars referenced (MaxBarsBack) = 50.
Default Trade Number = 1 contract.
11
This very simple system was profitable during the 6 years of trading, yielding a
$44,000 profit when trading with only $2,700 margin, and a worst case drawdown of
less than $10,000.
JRC RSX Zones
USBONDS.TXT-Daily
01/02/84 - 01/03/90
Performance Summary: All Trades
Total net profit
Gross profit
$ 44,315
$140,888
Total # of trades
Ratio avg win/avg loss
Max intraday drawdown
Profit factor
Account size required
182
2.03
$ -9,860
1.46
$ 12,560
Open position P/L
Gross loss
$
1,718
$ -96,573
Percent profitable
Avg trade(win & loss)
$
Max # contracts held
Return on account
41.76%
243
1
352%
This system is only for demonstration purposes. Do not trade real money using
this system, it does not have all the necessary safety features for limiting exposure
to risk. In addition, the maximum drawdown of this "paper traded" system may be
too large for your trading account.
NOTE: Before running any trading system, make sure …
• Cost parameters are appropriate for the market being traded.
• System parameters are appropriate for the market being traded.
12
DEMO #3
RSX Zones 2
Trading System
The previous demonstration had a profit factor of only 1.46. This means that only
$1.46 was gained for each $1 lost. We’d like to improve this performance, while
keeping maximum drawdown (MDD) low, and the Return on Account (ROA) high.
Examination of the actual trades reveals many were entered prematurely, despite
the fact that the RSX zones were designed to prevent this. The question then
becomes “How do I get additional confirmation before entering a trade?”
In this demonstration, additional confirmation of a trend reversal is attained by
requiring the bar of entry to move sufficiently in the direction of the anticipated new
trend direction. This is accomplished by requiring the bar low to be below a moving
average before entering a SHORT trade, and requiring the high to be above the
moving average before entering a LONG trade.
The installed trading system is called “RSX Zones 2”and is coded as follows:
Inputs: Rlen(10), Wlen(24), LongZone(77), ShrtZone(38);
vars: RSX(0), Wavg(0) ;
RSX = JRC.RSX.2k(h+l,rlen) ;
Wavg = waverage( waverage( (h+l)/2, Wlen), Wlen ) ;
If RSX < RSX[1] and RSX < LongZone and L < Wavg then sell;
If RSX > RSX[1] and RSX > ShrtZone and H > Wavg then buy;
Although not as good as Jurik’s JMA moving average, the double weighted moving
average employed in this system does a fair job of smoothing with low lag.
System parameter definitions:
• RLEN = length of RSX.
• WLEN = length of the double weighted moving average.
• LONGZONE = RSX level above which no “sell-short” commands may be
executed.
• SHRTZONE = RSX level below which no “buy-long” commands may be
executed.
To run this demonstration, load in the U.S. Bond data we supplied (loading
instructions are provided earlier in this manual). Next, insert the system "JRC RSX
ZONES 2", and set the following parameters values:
Cost parameters:
Commission
Slippage
Margin
$30
$50
$2700
System parameters:
Rlen
Wlen
LongZone
ShrtZone
10
24
77
38
Max number of bars referenced (MaxBarsBack) = 50.
Default Trade Number = 1 contract.
13
This simple system was profitable during the 6 years of trading, yielding a $45,000
profit when trading with only $2,700 margin, and a worst case drawdown of less
than $12,000.
The detailed performance statistics show a profit factor of 1.80, a nice increase
over 1.46 from the previous system. Consequently, significantly fewer trades were
needed to maintain the same overall net profit, as profit per trade almost doubled in
value. The downside is that maximum drawdown increased, thereby lowering ROA
from 352% to 317%.
When designing any system, there are multiple factors to consider, and as is
typically the case, a tradeoff exists between them.
JRC RSX Zones 2
USBONDS.TXT-Daily
01/02/84 - 01/03/90
Performance Summary: All Trades
Total net profit
Gross profit
$ 45,183
$101,452
Total # of trades
Ratio avg win/avg loss
Max intraday drawdown
Profit factor
Account size required
102
2.58
$-11,533
1.80
$ 14,233
Open position P/L
Gross loss
$
375
$ -56,268
Percent profitable
Avg trade(win & loss)
$
Max # contracts held
Return on account
41%
442
1
317%
This system is only for demonstration purposes. Do not trade real money using
this system, it does not have all the necessary safety features for limiting exposure
to risk. In addition, the maximum drawdown of this "paper traded" system may be
too large for your trading account.
NOTE: Before running any trading system, make sure …
• Cost parameters are appropriate for the market being traded.
• System parameters are appropriate for the market being traded.
14
The following examples require Jurik tools RSX and JMA
This section illustrates the power of combining RSX with another tool of ours, the JMA (Jurik
Moving Average). To run the demonstrations described herein, you will need to have installed
both JMA and RSX onto your TradeStation application software. Details about JMA and how to
acquire it are available on our web page at http://www.jurikres.com/catalog/ms_ama.htm .
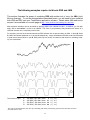
Most technical indicators can be smoothed by applying JMA to the indicator’s output. In addition, you can also
apply JMA to data before it is fed to an indicator. This form of pre-processing may transform the nature of a
technical indicator into a completely new function.
For example, plot A in the chart below shows the RSX indicator with no pre-smoothing by JMA. In plots B, C and
D, JMA’s smoothness parameter is 10, 30 and 60 respectively. As pre-smoothness increases, note how RSX tends
to yield more extreme values. In plot D, RSX yields only two values, its maximum and minimum, indicating “trendup”and “trend-down”.
The formula for plot
A:
B:
C:
D:
JRC.RSX ( JRC.JMA ( close, 0 , 0 ) , 14
JRC.RSX ( JRC.JMA ( close, 10 , 0 ) , 14
JRC.RSX ( JRC.JMA ( close, 30 , 0 ) , 14
JRC.RSX ( JRC.JMA ( close, 60 , 0 ) , 14
)
)
)
)
The next two demonstrations show how pre-smoothing with JMA yields trading systems better than those shown in
demonstrations 2 and 3.
15
DEMO #4
Threshold RSX
Trading System
In this demonstration, we take the RSX signal, whose input was pre-smoothed
by JMA, and compare it to two threshold values for triggering buy/sell signals.
If the signal crosses above BUYLINE, then buy long. If the signal crosses
below the SELLINE, then sell short.
The installed trading system is called "JRC thresh RSX", and its code is as
follows:
Input: series(close), L1(2), P1(49), L2(9), Buyline(39), Selline(54) ;
IF JRC.RSX( JRC.JMA( series, L1, P1 ), L2 ) crosses above BuyLine
Then Buy on Close ;
IF JRC.RSX( JRC.JMA( series, L1, P1 ), L2 ) crosses below SelLine
Then Sell on Close ;
System parameter definitions:
•
•
•
•
•
•
SERIES = the price time series to be analyzed.
L1 = length of JMA.
P1 = phase of JMA.
L2 = length of RSX.
BUYLINE = RSX level that triggers a buy command.
SELLINE = RSX level that triggers a sell command.
To run this demonstration, load in the U.S. Bond data we supplied (loading
instructions are provided earlier in this manual). Next, insert the JRC thresh
RSX ", and set the following parameters values:
Cost parameters:
Commission
Slippage
Margin
$30
$50
$2700
System parameters:
series:
L1:
P1:
L2:
Buyline
Selline
Money Management
close
2
49
9
39
54
$2550
{ price series to be analyzed }
{ length of JMA }
{ phase of JMA }
{ length of XMA }
{ threshold to enter long }
{ threshold to enter short }
Max number of bars referenced (MaxBarsBack) = 50.
Default Trade Number = 1 contract.
16
This simple system was more profitable than demonstrations #2 and #3.
Overall net profit was $60,000, profit factor was 2.06, average trade was
$609 and ROA was almost 500%.
Note: This demonstration system has more input variables that the prior
demonstrations, naturally lending it to be more finely tuned to the market’s
behavior. However, there is always the danger of developing systems that
are too complex, enabling it to memorize specific trades, rather than learn
the general behavior of a market. This is why it is crucial to keep your
system as simple as possible. With regards to this system, its complexity
consists of a money management stop and the three lines of code as shown
on the previous page.
JRC thresh RSX
USBONDS.TXT-Daily
Performance Summary:
01/02/84 - 01/03/90
All Trades
Total net profit
Gross profit
$ 60361
$ 119705
Total # of trades
Ratio avg win/avg loss
Max intraday drawdown
Profit factor
Account size required
$
$
Open position P/L
Gross loss
$
1093
$ -59343
99
2.06
Percent profitable
Avg trade(win & loss)
$
-9400
2.02
12100
Max # contracts held
Return on account
49%
609
1
499%
This system is only for demonstration purposes. Do not trade real money using
this system, it does not have all the necessary safety features for limiting exposure
to risk. In addition, the maximum drawdown of this "paper traded" system may be
too large for your trading account.
NOTE: Before running any trading system, make sure …
• Cost parameters are appropriate for the market being traded.
• System parameters are appropriate for the market being traded.
17
DEMO #5
Reverse RSX
Trading System
This demonstration illustrates a strategy for trading reversal markets. In addition to
RSX, it uses the function JMA (Jurik Moving Average). Its design philosophy is
based on the notion that reversal markets flip direction too fast for trend following
systems to track. For example, by the time a trend following indicator registers an
uptrend, the market may have already reversed into a downtrend. When this
occurs, we say the indicator is “out of phase”with the market’s swings.
Because the market’s reversals are fairly regular, “phase error” can be fairly
constant. We exploited this property by adding lag to the indicator, making it so
late as to put it back in phase again, but with the market’s next reversal. This idea
is implemented in the following demonstration system.
The installed trading system "JRC reverse RSX" contains the following three lines
of code ...
Input: series(H+L), L1(5), P1(9), L2(22), lag(8) ;
IF JRC.RSX( JRC.JMA( series[lag], L1, P1 ), L2 ) crosses below 50
Then Buy at market ;
IF JRC.RSX( JRC.JMA( series[lag], L1, P1 ), L2 ) crosses above 50
Then Sell at market ;
To run this demonstration, load in the daily S&P500 futures price data we
supplied. (Loading instructions are provided earlier in this manual. Note that for
the time period used, the point value of the S&P was $500.) Next, insert the
system " JRC reverse RSX", and set the following parameters values:
Cost parameters:
Commission
Slippage
Margin
$30
$150
$15,000
System parameters:
series:
L1:
P1:
L2:
lag:
Money Management
H+L
5
9
22
8
$3850
{ price series to be analyzed }
{ length of JMA }
{ phase of JMA }
{ length of RSX }
{ added lag to the price time series }
Max number of bars referenced (MaxBarsBack) = 40.
Default Trade Number = 1 contract.
18
Note that because this is a reversal-market system, it is blind to long price trends.
For example, although all of 1995 was one huge uptrend for the S&P, this system
did not capitalize on it, and for most of the year, was out of the market.
Nonetheless, this system’s profit factor is almost 2.0, ROA is 510% and the
average trade nets a $1330 profit.
JRC reverse RSX
Performance Summary:
SP500.TXT-Daily
All Trades
Total net profit
Gross profit
Total # of trades
Ratio avg win/avg loss
Max intraday drawdown
Profit factor
Account size required
01/03/83 - 01/10/96
$ 166250
$ 345485
125
1.37
$ -17580
1.93
$ 32580
Open position P/L
Gross loss
$
0
$-179235
Percent profitable
Avg trade(win & loss)
$
Max # contracts held
Return on account
58%
1330
1
510%
This system is only for demonstration purposes. Do not trade real money using
this system, it does not have all the necessary safety features for limiting exposure
to risk. In addition, the maximum drawdown of this "paper traded" system may be
too large for your trading account.
NOTE: Before running any trading system, make sure …
• Cost parameters are appropriate for the market being traded.
• System parameters are appropriate for the market being traded.
19
IF YOU FIND A BUG . . . YOU WIN
If you discover a legitimate bug in any of our preprocessing tools, please let us know! We will
try to verify it on the spot. If you are the first to report it to us, you will receive the following two
coupons redeemable toward your acquisition of any of our preprocessing tools:
•
•
a $50 discount coupon
a free upgrade coupon
You may collect as many coupons as you can.
You may apply more than one discount coupon toward the purchase of your next tool.
$$$ Anti-Piracy Reward Policy $$$
Jurik tools are world renown for excellence and value. We manage to keep costs down with large sales volume,
maintained in part by protecting our copyrights with the following anti-piracy policy…
1. We have on permanent retainer one of the best intellectual property law firms in the U.S.
2. We do not perform cost-benefit analysis when it comes to litigation. We prosecute all offenders.
3. We register portions of our software with the U.S. Copyright office, entitling us to demand the offender
compensate Jurik Research for all legal costs, which is typically over $10,000 per lawsuit.
4. We offer up to $5000 reward for information leading to the prosecution of any offender(s).
Risk & Liability
Hypothetical or simulated performance results have certain inherent limitations. Simulated performance is
subject to the fact that they are designed with the benefit of hindsight.
We must also state here that, due to the frequently unpredictable nature of the marketplace, past performance
of any trading system is never a guarantee of future performance. In addition, all trading systems have risk and
commodities trading leverages that risk. We advise you never to place at risk more than you can afford to lose.
It's only common sense.
The user is advised to test the software thoroughly before relying upon it. The user agrees to assume the entire
risk of using the software. In no event shall JRC be responsible for any special, consequential, actual or other
damages, regardless of type, and any lost profit resulting from the use of this software.
20