1
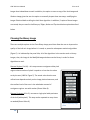
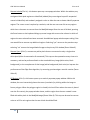
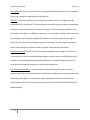
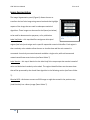
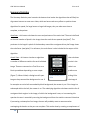
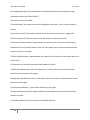
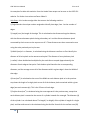
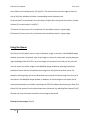
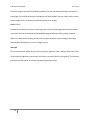
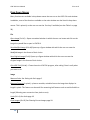
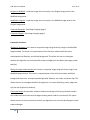
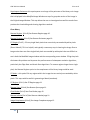
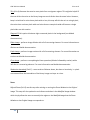
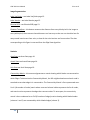
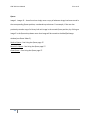
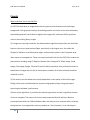
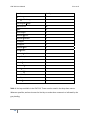
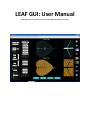
 LEAF GUI: User Manual (Leaf Extraction and Analysis Framework Graphical User Interface) LEAF GUI User Manual Price et al. Index How to cite the LEAF GUI……………………………………………………………………………………………..Page 3 Introduction ………………………………………………………………………………………………………………..Page 3 Installation………………………………………………………………………………………………………..Page 4 Overview of the LEAF GUI layout……………………………………………………………………….Page 5 LEAF GUI Operation……..………………………………………………………………..………………………..…..Page 6 Setting the Scale…………………………………………………………………………………………….…Page 6 Image Cropping………………………………………………………….…………………………………….Page 6 Thresholding…………………………………………………………………………………………………….Page 7 Image Storage and Area Mask………………………………………………………………………….Page 9 Cleaning the Binary Image ……………………………………………………………………………….Page 10 Image Segmentation.……………………………………………………………………………………….Page 13 Summary Statistics ………………………………………………………………………………………….Page 14 Using the Queue………………………………………………………………………………………………Page 17 Clearing the Current Images…….………………………………………………………………………Page 18 Undoing the Previous Step………………………………………………………………………………Page 18 Interrupting the GUI..………………………………………………………………………………………Page 18 Drop Down Menus…………….…….………………………………………………………………………Page 19 Caveats……………………………..…….…………………………………………………………………………………Page 25 Contacts………………………………….…………………………………………………………………………………Page 27 Table 1: Hot Keys……………………………………………………………………………………………………….Page 28
2 LEAF GUI User Manual Price et al. How to cite the LEAF GUI The LEAF GUI was designed to be free for academic use. We get no money for this, so aside from the appreciation from our colleagues, the only recognition we get is when you cite us for using the software. Please cite as: Price, C.A., Y. Mileyko, O. Symonova, T. Hilley and J.S. Weitz, LEAF GUI: segmenting and analyzing the structure of leaf veins and areoles. Citation to follow. Introduction The LEAF GUI software is designed for plant biologists and ecologists who wish to analyze the macroscopic structure of veins in leaves. The software allows users to extract descriptive statistics on the dimensions and positions of leaf veins and the areoles they surround by following a series of thresholding, cleaning and segmentation algorithms given images of leaves where veins have been enhanced relative to the background. Extensive descriptions of the intended use of the software, and of software specific algorithms can be found in the accompanying journal article (citation to follow). Here we present a brief introduction and tutorial explaining how to use the LEAF GUI. In addition, a series of tutorial videos can be found at www.leafgui.org. We anticipate that most users will find these tutorial videos the fastest way to learn how to use the LEAF GUI software as they are narrated computer screen recordings of the software in action. The software is written in 3 LEAF GUI User Manual Price et al. Matlab and many of the functional aspects of the LEAF GUI rely on specific functions from the Matlab image processing library. We provide brief descriptions of such functions here and refer the user to the Matlab documentation for some of the more complicated operations. Installation The code for the LEAF GUI software is written in Matlab. However, thanks to Matlab’s GUI development environment, the GUI can be compiled as a stand‐alone executable that can run on most platforms. Source code, download instructions and versions compiled for PC’s, Macs and Linux operating systems are available at www.leafgui.org. 4 Drop down menus
Clean Binary
Image Options
Original
Image
Window
Zoom
Rectangle
(movable, resizable)
Original Zoom
Set the scale
Queue
Crop the
image
Adaptive
Thresholding
Global
Thresholding
Combine
Images
Area Mask
Image Storage
Summary Statistics
Options
Output Preference
(xls or txt)
Image
Segmentation
Options
Modified
Image
Window
Send to Queue
Undo!
Clear Images
Interrupt!
Modified Zoom
Overview of the LEAF GUI layout LEAF GUI contains seven operational panels, “Set Scale and Crop”, “Filtering”, “Thresholding”, “Image Storage”, “Clean Binary Image”, “Image Segmentation” and “Summary Statistics”. In the following sections we describe the functionalities of the panels. LEAF GUI also has four display panels, “Original Image”, “Modified Image”, and two panels displaying their respective zoomed regions. There is also a Queue on the right hand side of the GUI where users can store thumbnails of images as they work.
LEAF GUI Operation We now describe operations on leaf images which can be performed using left side panels of the main window (see Overview above). We assume that a user has already loaded an image of a leaf (see File‐>Open Image in Drop Down Menus section for instructions on how to load an image). Setting the Scale This panel allows the user to set the scale, in pixels per millimeter for the image. If the scale is known for example, 50 pixels per mm, the user can enter this value and proceed (Figure 1). Alternatively, if the image contains a scale bar, the user can enter the length of the scale bar in mm, then click on the set scale button (Demo Video 2). When the user places the cursor over the raw Figure 1 Setting the scale and cropping panel. image, crosshairs will appear. The user then clicks at either end of the scale bar, then double clicks on the bar itself. The newly calculated scale, in pixels/mm will appear in the scale window. Note that the calculation of summary statistics such as areole or vein dimensions requires that the user enter or set the scale, and if the scale is not entered when selecting these options, an error message will appear. Because many users will be working with collections of images that all have the same scale, the scale is not reset when a user clears the images (see Clear Images below). Image Cropping LEAF GUI User Manual Price et al. There are two image cropping options available, rectangular and polygonal cropping (Figure 2). Rectangular cropping, which will likely be the preferred choice of most users due to its ease of use, is available as a button on the main gui panel (Figure 1), while polygonal cropping can be found on the Image dropdown menu. Both options allow the user to crop away unwanted noise that occurs around the leaf image, or focus on a region of interest. Polygonal cropping allows Figure 2. Polygon and rectangular cropping options.
the user to place points around the region they want to crop by clicking a mouse. When the region of interest is closed, a new rectangular image will be formed that just encloses the polygon. Black pixels will pad the image to form a rectangle. Alternatively, the user can place a rectangle around the leaf or region of interest. This approach typically yields the best results as it does not create black regions around the desired region that must be dealt with later (see Demo Video 3). Thresholding The thresholding options within the LEAF GUI allow the user to convert RGB or grayscale images into binary images (1’s and 0’s). This is a critical step as almost all subsequent cleaning and segmentation functions within the LEAF GUI act on binary images. There are three options within the thresholding button group: adaptive thresholding, global thresholding, or a 7 LEAF GUI User Manual Price et al. combination of the two (Figure 3). Adaptive thresholding is an approach that takes into account the uneven illumination of many leaf images. To correct for this, adaptive thresholding uses a local window, the size of which in pixels is set by the user. This window is then moved across the image and pixels are separated into foreground and background depending on whether their values are greater than the threshold level set by the user. In addition, we provide a global thresholding option. Global thresholding first converts the image to grayscale, then separates foreground from background based on whether the pixel intensities are greater or Figure 3 Thresholding Panel with Combining option. less than the threshold level. Both adaptive and global thresholding utilize sliders to set the threshold levels which can speed up the process when trying multiple levels out to see how well they segment the image. We have found that a combination of both adaptive and global thresholding works best on images of cleared leaves: adaptive thresholding tends to capture small veins better while global captures large veins better. To combine images, first utilize the adaptive approach to get the Modified Image where you want it. By checking the “Adaptive Image” check box at the bottom of the Thresholding panel, the user stores a copy of the thresholded image and an additional copy is sent to the Queue (see below). This applies to global thresholding as well, and once both boxes are checked, the user presses the “Combine” button, and the two thresholded images are combined into a single image which is now displayed in the Modified Image panel (see Demo Video 4). 8 LEAF GUI User Manual Price et al. Image Storage and Area Mask Many of the cleared leaf images we have processed have significant noise around the leaf image itself that remains in the images even after thresholding steps. There are multiple approaches by which the user could remove that noise including cropping or combinations of options within the Clean Binary Image panel (see below), but we have found that simply Figure 4. Area Mask Panel with Area, Vein and Skeleton image storage options. creating a binary mask of the leaf image is by far the fastest approach. To do this the user first sets the global thresholding level high enough (or low enough depending on image details) so that all the pixels within the interior of the leaf are black and the background is white. Often there are still regions that need to be removed and this can be accomplished through the Remove Regions option in the Clean Binary Image panel (see below). Once the user is satisfied with the segmentation and cleaning, the user creates a complement of the image which is then stored by checking the Area Image checkbox within the Area Mask panel, which also sends a copy to the Queue (Figure 4). The image is now stored, and can be used in subsequent step to remove background noise by pressing the Mask button (Demo Video 4). This multiplies whatever image is in the Modified Image window by the stored image mask. The resulting image contains only the part of the Original Image that would be contained within the white Mask region. Checking the Area Image, Vein Image or Skeleton Image tabs causes a copy of these images to be sent to the Queue for future use if needed and as verification to the user that the 9 LEAF GUI User Manual Price et al. images have indeed been stored. In addition, the option to store a copy of the Vein Image and Skeleton Image gives the user the option to manually inspect these two steps, modifying the images if desired before calling the Vein Stats algorithm. In addition, if copies of these images are stored, they are used in the Binary w/ Edges, Nodes and Tips visualization option described below. Cleaning the Binary Image There are multiple options in the Clean Binary Image panel that allow the user to improve the quality of the leaf vein image before it is saved, or passed to subsequent statistics algorithms (Figure 5). As indicated by the panel title, all of the algorithms in the section work on binary images, thus, the image in the Modified Image window must be binary in order for these algorithms to work. Remove Regions (Ctrl+R) – this step removes contiguous white pixel regions whose number of pixels is equal to or less than the value set by the user (1000 in Figure 5). The actual value that the user utilizes here depends entirely on the image, desired outcome, and the comfort level of the user in the wholesale removal of contiguous regions: use with caution (Demo Video 6). Remove Perimeter (Ctrl+P)– removes a single pixel wide perimeter of the leaf (white pixels). This step can be repeated as many times as needed (Demo Video 6). Figure 5 Clean Binary Image panel. 10 LEAF GUI User Manual Price et al. Remove Labeled (Ctrl+L)– this button opens up a new popup window. Within the window, any contiguous black pixel regions are identified, labeled (they are assigned a specific sequential numerical identifier) and randomly assigned a color to allow the user to better identify separate regions. The cursor arrow is replace by crosshairs, and the user can now click on any regions which he or she wants to remove from the Modified Image. After the user is finished, pressing the Enter button on the keyboard brings up a new image with a new color scheme in which all regions the user selected have been removed. An additional popup window opens asking if the user would like to remove any additional regions. Selecting “yes” returns to the previous step: selecting “no” returns the image labeled image to the primary GUI window (Demo Video 6). Remove Spurs (Ctrl+S)– removes any white pixels that are connected to only a single other white pixel (either 4 connected or 8 connected). This step can be repeated as many times as is necessary, and can be performed both on the standard binary image (white veins, black background), or the complement of that image (white background, black veins) to improve the performance of the Edge Stats algorithm, by removing spurious edges: use with caution (Demo Video 6). Fill Regions (Ctrl+Y)– this button opens up an entirely separate popup window. Within this window, the user interactively places the cursor (crosshairs) by clicking within the image to form a polygon. When the polygon region is closed (a circle will form when the cursor is placed over the first vertex), the popup window closes, and the region that the user created is now filled with white pixels in the Modified Image (Demo Video 6). This step can be used to remove noise or to fill in vein regions that the user thinks should be filled. 11 LEAF GUI User Manual Price et al. Clear Border (Ctrl+B)– this step removes any contiguous white pixel regions, such as unwanted noise, that overlap the image border (Demo Video 4). Skeleton – this button reduces the vein image to its skeleton, which is a single pixel wide representation of the network. This can be done iteratively by clicking the button repeatedly or entirely by invoking the Skeletonize Fully (Ctrl+F) option in the Clean Binary dropdown menu. The skeleton is integral in the Edge Stats algorithm, so visualizing the skeleton will be important for verifying that there is general agreement between the skeleton image and the original image. This can further be visualized using some of the options in the Composite drop down menu: either Original w/ Skeleton or Binary w/ edges, nodes and tips (see below). Image Complement (Ctrl+K)– this simply creates a complement of the image (0’s become 1’s, 1’s become 0’s) in the in the Modified Image window, whether binary or RGB (Demo Video 6). Creative use of the Image Complement option expands the methods by which the user can clean the binary image before passing it to the statistic algorithms. Full or Zoom Radio Buttons – these mutually exclusive buttons allow the user to specify whether they want the operations within the Clean Binary Image panel to be performed on the entire image (Full option) or only with the region delineated by the zoom window (Zoom option) (Demo Video 6). This can be a helpful step if noise is unequally distributed within the Modified Image. 12 LEAF GUI User Manual Price et al. Image Segmentation The Image Segmentation panel (Figure 6) allows the user to transform the leaf vein image using several methods that highlight aspects of the image that are used in subsequent statistical algorithms. These images can be saved in the Queue (see below) to be used for demonstration purposes, or for publication. Label Leaf Veins – this step identifies contiguous white pixel Figure 6 Image Segmentation Panel regions (leaf veins) and assigns each a specific sequential numerical identifier. Each region is then randomly color coded to allow the user to visualize how well the vein network is connected. An entirely connected network would be a single color; while a disconnected network would have several colors (see Demo Video 7). Label Areoles – this step is identical to the Label Leaf Veins step except that areoles instead of veins are labeled and randomly color coded. The regions identified here are the same those that will be processed by the Areole Stats algorithm in the following section (see Demo Video 7). Binarize RGB – this button converts an RGB image as might be created in the previous step (Label Areoles) into a binary image (Demo Video 7). 13 LEAF GUI User Manual Price et al. Summary Statistics The Summary Statistics panel contains the buttons that invoke the algorithms that will likely be of greatest interest to most users. Note, while we have made every effort to optimize these algorithms for speed, for large leaves or large leaf images, they can take some time to complete, so be patient. Area Stats – this button calculates the area and perimeter of the entire leaf. The area is defined as the total number of pixels in the image times the scale factor squared (mm/pixel)2. The perimeter is the length in pixels of the boundary around the contiguous binary leaf image times the scale factor (mm/pixel). For reference, the scale factor is also included in the output of this algorithm. Areole Stats – this button invokes an algorithm that calculates a number of different statistics for each individual areole in the image. These are returned as a Text file or as a table in an Excel spreadsheet depending on user output preferences (Figure 7). When clicked, a dialog box will open image to be processed has background or not. If Figure 7 Summary Statistic Panel asking if the the image is for example an entire leaf surrounded by black background, the answer is yes. If the image is a subsample within the leaf, the answer is no. The underlying algorithm calculates statistics for all contiguous black regions in the image, of which the background is one, so in answering this question the user is essentially removing the background from the statistics returned. Note that if processing a subsample of an image, the user will probably want to remove areoles overlapping the border as they are not complete. This can be done by creating a complement of 14 LEAF GUI User Manual Price et al. the image and using the Clear Border button introduced previously and creating an image complement again (see Demo Video 8). The statistics returned include: 1) Areole Number, the unique numerical ID assigned to that areole, from 1 to the number of areoles. 2) Areole Area (mm2), the number of pixels in each areole times the area of a single pixel. 3) Convex Area (mm2) the area of the convex hull that just encloses the areole. 4) Eccentricity (dimensionless, range between zero and one) this is the ratio of the distance between the foci of an ellipse and its major axis. The ellipse has the same normalized second moment of area as the region. 5) Solidity (dimensionless, range between zero and one) this is the ratio of the Areole Area to its Convex Area. 6) Perimeter (mm) the distance around the boundary of areole. 7) Equivalent Diameter (mm) this is the diameter of a circle that has the same normalized second central moments as the region. 8) Major Axis and Minor Axis (mm) of the ellipse that has the same normalized second central moments as the region. 9) Centroid (coordinates, x,y) the center of density of the region. 10) Mean Distance (mm) the average Euclidean distance between each areole pixel and the nearest vein pixel. 11) Variance Distance (mm) the variance in the Mean Distance. 15 LEAF GUI User Manual Price et al. An example of a table with statistics from the Areole Stats output can be seen on the LEAF GUI website. For further instruction see Demo Video 8. Vein Stats – this invokes an algorithm that returns the following statistics: 1) Edge Number the unique number assigned to identify that edge, from 1 to the number of edges. 2) Length (mm) the length of the edge. This is calculated as the distance along the skeleton, with the distance between pixels sharing a boundary as 1 and the distance between pixels connected by their corners as the square root of 2. These distances are then converted to mm using the scale previously set by the user. 3) Width (mm) a.k.a. diameter, is calculated using the distance transform to first identify the distance of all vein pixels to the nearest areole pixel. The distance of every skeleton pixel (ºradius) is then doubled and multiplied by the scale factor to equal (approximately) the diameter of each edge at that point. Each skeleton pixel therefore has a corresponding diameter, and the average across all of the diameters within a given edge is then the Width of that edge. 4) Area (mm2) is calculated as the sum of the Width at each skeleton pixel as in the previous step times the length of a single pixel across all of the skeleton pixels contained within a given edge (see main manuscript). This is the 2D area of each edge. 5) Surface Area (mm2) is calculated using the same approach is the previous step, except that each skeleton pixel is treated as the center of a cylinder instead of a rectangle. The diameter (d) of the cylinder is as calculated above. The length (l or height) of the cylinder is length of a single pixel, and the surface area is the calculated using the familiar formula for the surface area (SA) 16 LEAF GUI User Manual Price et al. of a cylinder (not including ends), SA=2p(d/2)*l. The total surface area of an edge is then the sum of all of the individual cylinders corresponding to each skeleton pixel. 6) Volume (mm3) is calculated in the same way as Surface Area, except the formula for cylinder Volume (V) is used instead, V=p(d/2)2*l. 7) Centroid 1 is the mean of all x‐coordinates for the skeleton pixels in a given edge. 8) Centroid 2 is the mean of all y‐coordinates for the skeleton pixels in a given edge. Using the Queue The Queue (Ctrl+Q) button stores a copy of whatever image is currently in the Modified Image window, and sends a thumbnail copy of the image to a series of small panels running along the right hand edge of the LEAF GUI. Up to ten images can be stored in this way. At any point the user can return one of the images to the Modified Image window by selecting the position (numbered top to bottom) occupied by that image from the Queue drop down menu. For example, selecting Image 4 from the drop down menu places the fourth image from the top of the Queue in the Modified Image window. In addition, all of the images in the Queue can be saved simultaneously to the folder containing the LEAF GUI software by selecting the Save All In Queue (Ctrl+H) options from the drop down menu. Moreover, by selecting Clear Queue (Ctrl+P), the user can clear the Queue to allow for more image to be stored. Clearing Current Images (Ctrl+D) 17 LEAF GUI User Manual Price et al. Clears all images from the GUI window and Queue: Do this step before starting to work with a new image. On clicking this button a dialog box will open asking if the user really wants to clear all the images. This is to prevent accidental clearing of all images. Undo (Ctrl+U) Undoes the last step: As the user is working, copies of the last 20 images that were processed are stored, and can be returned to the Modified Image window by clicking Undo. However, there is no redo option meaning that once a user goes back to a previous image, the images that had been subsequent to it are no longer stored. Interrupt The interrupt button allows the user to interrupt any algorithm that is taking a long time. Some of the statistics algorithms, particularly Vein Stats, can take a while on a large leaf. This function gives the user the option to halt any processes currently running. 18 LEAF GUI User Manual Price et al. Drop Down Menus Many functions are available in drop down menus that are not on the LEAF GUI main window. In addition, most of the functions available on the main window are also listed in drop down menus. This is primarily so the user can see the “hot keys” available (see also Table 1 on page 28). File Open Image (Ctrl+O) – Opens a standard window in which the user can locate and click on the image they would like to open in LEAF GUI. Save Modified Image (Ctrl+M) Opens up a figure window with which the user can save the Modified Image in the format of their choice. Save Original Image (Ctrl+I) Opens up a figure window with which the user can save the Original Image in the format of their choice. Quit LEAF GUI (Ctrl+W) – Closes the entire LEAF GUI program, after asking if that’s really what you want to do. Image Measure Scale See Setting the Scale page 6. Measure Distance (in pixels) – places a movable, resizable line on the image that displays its length in pixels. This feature can be useful for measuring leaf features such as total leaf width or length (following user conversion from pixels to mm). Undo (Ctrl+U) See Undo page 18. Clear Images (Ctrl+D) See Clearing Current Images page 18. 19 LEAF GUI User Manual Price et al. Original to Modified – sends the image that is currently in the Original Image panel to the Modified Image panel. Modified to Original – sends the image that is currently in the Modified Image panel to the Original Image panel. Crop with Rectangle ‐ See Image Cropping page 6. Crop with Polygon – See Image Cropping page 6. Composite Functions Original w/ skeleton – this creates a composite image using the binary image in the Modified Image window. The result is a representation of the leaf vein network with blue veins, superimposed red Skeleton, and a black background. This allows the user to investigate whether the algorithm correctly identifies nodes and edges (see also Binary plus edges, nodes and tips). Binary plus edge, nodes and tips this creates a composite image using the binary image in the Modified Image window. The result is a representation of the leaf vein network with black background, blue veins, and superimposed light blue Skeleton, red nodes, and yellow tips. This allows the user to investigate whether the algorithm is correctly identifying nodes, edges and tips (see also Original w/ skeleton). Connected Nodes this algorithm creates a skeletonized image of the binary network overlain with nodes encircled in blue and red edges showing which nodes are connected. This option allows the user to assess the extent to which the algorithms are correctly identifying the actual nodes and edges. 20 LEAF GUI User Manual Price et al. Superimpose Perimeter this superimposes a red copy of the perimeter of the binary vein image that is displayed in the Modified Image Window on top of a grayscale version of the image in the Original Image Window. This step allows the user to investigate how well the results from previous the thresholding and cleaning algorithms worked. Clean Binary Remove Regions (Ctrl+R) See Remove Regions page 10. Remove Perimeter (Ctrl+P) See Remove Perimeter page 10. Fill Singles (Ctrl+E) – fills any single black pixels that are entirely surrounded by white pixels (Demo Video 6). This is a helpful, and typically a necessary step in cleaning the image. Due to image noise there are often single black pixels surrounded by white pixels that are difficult to see in both the Modified image window and the corresponding zoom window. Filling the pixels eliminates this problem and improves the performances of subsequent statistics algorithms, particularly the Edge Stats and Areole Stats algorithms. To remove regions larger than a single pixel, the Remove Regions option in the complement of the binary image could be used. Fill Holes – this option fills any regions within the image that are entirely surrounded by white pixels. This step could be useful in generating a Mask (see above). Fill Regions (Ctrl+Y) See Fill Regions page 11. Remove Spurs (Ctrl+N) See Remove Spurs page 11. Clear Border (Ctrl+E) See Clear Border page 12. Remove Labeled (Ctrl+G) See Remove Labeled page 11. Image Complement (Ctrl+Q) See Image Complement page 12. 21 LEAF GUI User Manual Price et al. Thin (Ctrl+X) Removes the exterior‐most pixels from contiguous regions. This might be helpful if the user thinks the veins on the binary image are much thicker than the actual veins. However, keep in mind that for veins three pixels wide or less, this step will thin the vein to a single pixel, thus veins that are three pixels wide and veins that are two pixels wide will become a single pixel wide: use with caution. Diagonal Fill this option eliminates eight connected pixels in the background (see Matlab documentation). Dilate Image ‐ performs image dilation with a 3x3 structuring element. For more information on dilation see Matlab documentation. Erode Image ‐ performs image erosion with a 3x3 structuring element. For more information on erosion see Matlab documentation. Close Image – performs a morphological close operation (dilation followed by erosion) with a 3x3 disc as a structuring element. For more information see Matlab documentation. Skeletonize Iteratively (Ctrl+F) – same result as Skeleton above, but does so iteratively, i.e. pixels are removed from the boundaries of the binary image one layer at a time. Zoom Refresh Zoom (Ctrl+Z) use this step after resizing or moving the Zoom Window in the Original Image. This step will also update the red reference window in the Modified Image window which simply allows the user to see easily the region on the Modified Image that the Zoom Window on the Original Image corresponds to. 22 LEAF GUI User Manual Price et al. Image Segmentation Label Leaf Veins – see Label Leaf Veins page 13. Label Areoles – see Label Areoles page 13. Binarize RGB – see Binarize RGB page 13. Distance Transform – this button measures the distance from every black pixel in the image to every white pixel, then converts those distances to a heat map so the user can visualize how far away areole interiors are from veins, or how far the vein interiors are from areoles. The data corresponding to this figure is returned from the Edge Stats algorithm. Statistics Area Stats see Area Stats page 14. Areole Stats see Areole Stats page 14. Vein Stats see Vein Stats page 16. Connectivity Matrix – this command generates a matrix showing which Nodes are connected to which Edges. To determine the Connectivity Matrix, the 3x3 neighborhood around each node is searched to see what edges it is connected to. The Connectivity Matrix is first represented as an N x N (N=number of nodes) matrix where rows and column indices represent the list of nodes, and matrix entries represent the edges that connect nodes. To save space, the connectivity matrix is then condensed to an Ex3 (E=number of edges) matrix showing which labeled nodes (columns 1 and 2) are connected by which labeled edges (column 3). 23 LEAF GUI User Manual Price et al. Queue Image 1 –Image 10 ‐ these functions simply move a copy of whatever image has been stored in the corresponding Queue position, numbered top to bottom. For example, if the user has previously stored a copy of a binary leaf vein image in the second Queue position, by clicking on Image 2 in the Queue drop down menu that image will be moved to the Modified Image window (see Demo Video 5). Send to Queue – See Using the Queue page 17. Save All in Queue – See Using the Queue page 17. Clear Queue – See Using the Queue page 17. 24 LEAF GUI User Manual Price et al. Caveats When and when not to use LEAF GUI 1) LEAF GUI works best on images where there is good contrast between veins and image background. If the grayscale intensity of the background is too similar to the veins themselves, thresholding steps will not be able to segment the images well, and there will be significant noise in the resulting binary images. 2) If images are very high resolution, the skeletonization algorithms upon which the Vein Stats function relies may create spurious Edges, particularly in the largest veins. Use either the Original w/ Skeleton or the Binary with edges, nodes and tips options in the Composite drop down menu to investigate this. There are several methods built into the LEAF GUI to reduce this phenomenon including using Fill Regions, Remove Spurs, Diagonal Fill, Dilate Image, Erode Image, Close Image, Bridge, Thin and Fill and the ability to perform many of these functions on subsections of images with the Full or Zoom option; however all of these methods should be used with caution. 3) The results from the software are heavily dependent on the quality of the initial images. Taking a little extra time beforehand to improve image quality will go a long way toward improving the software’s performance. 4) Some of the algorithms, in particular the statistics algorithms can take a significant amount of time to complete. The amount of time increases exponentially with leaf size. We have processed leaves with over 100k individual nodes, but doing so on a computer with a relatively slow processor is not a good idea, and may produce an “out of memory” error. We hope to 25 LEAF GUI User Manual Price et al. develop an online version of the GUI linked to a dedicated server, or even perhaps a supercomputer, but until that time, we suggest running LEAF GUI on a more powerful machine. 5) Almost all of the functions in LEAF GUI are interruptible meaning that if a new function is invoked too soon, the previous function may not have finished. Thus to avoid confusing results from “click happy” users, patience is advised. 26 LEAF GUI User Manual Contacts Dr Chuck Price Postdoctoral Fellow, Weitz Lab School of Biology Georgia Institute of Technology Atlanta, GA, 30332 [email protected] Contact information as of August 2010: Assistant Professor School of Plant Biology University of Western Australia 35 Stirling Highway Crawley, Perth Western Australia 6009 Dr Joshua Weitz Assistant Professor School of Biology Georgia Institute of Technology Atlanta, GA, 30332 [email protected] Dr Olga Symonova Postdoctoral Fellow, Weitz Lab School of Biology Georgia Institute of Technology Atlanta, GA, 30332 [email protected] Dr Yuriy Mileyko Department of Mathematics Duke University, Box 90320 Durham, NC 27708‐0320 [email protected]
27 Price et al. LEAF GUI User Manual Price et al. Function Hot Key Open Image O Save Modified Image M Save Original Image I Quit Leaf GUI W Undo U Clear Images D Remove Regions R Remove Perimeter P Fill Singles E Fill Regions Y Remove Spurs S Clear Border B Remove Labeled L Image Complement K Skeleton F Refresh Zoom Z Label Leaf Veins V Label Areoles A Binarize RGB G Save All In Queue H Clear Queue N Send to Queue Q Table 1. Hot keys available in the LEAF GUI. These are also noted in the drop down menus. Wherever possible, we have chosen the Hot Keys to make them mnemonic as indicated by the gray shading. 28