1
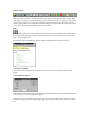
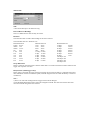
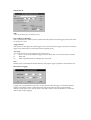
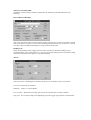
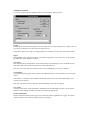
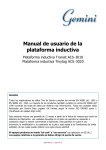
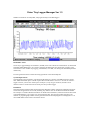
Orion Tiny Logger Manager Ver 1.3
Windows™ Software for Tinytalk®, Tinytag® and Tinyview® Dataloggers
INTRODUCTION
Orion Tiny Logger Manager for Windows (OTLM) is the host software for TINYTALK II, TINYTAG
and TINYVIEW Dataloggers. It is used to configure the dataloggers and begin their logging cycles.
The software is also used to stop logging, off-load data, save data, view data, print data and export data
numerically.
License agreement: Please read the licensing agreement in the OTLM help file.
System Requirements
The minimum system required to run OTLM for Windows is a 386 PC with 4MB of memory and at
least 3MB of hard disk space. OTLM requires Microsoft Windows version 3.1. In order to connect a
logger to the PC you will also need a spare serial port (9 way D-type connector) and the correct
interface cable to connect between the serial port and your data logger.
Installation
OTLM should be installed while running Microsoft Windows. Before starting the installation program
ensure that all applications are closed, including any utillities such as the Microsoft Office® Toolbar
for example. To install OTLM for Windows run SETUP from Windows (select Run from the File menu
in Program Manager, type a:\setup or b:\setup and click OK). The setup procedure may take a few
minutes. A program group window will be generated with the OTLM program icon displayed in it. To
run OTLM double click on the icon with the mouse.
USING OTLM
OTLM provides a 'tool bar' which can be used to access the most commonly used menu options. When
menu options and their associated tool buttons are not available for use they are greyed out. Moving the
mouse over menu options or tool buttons will display a hint about that option in the status bar at the
bottom of the window. The 'Toolbar Button Options' dialogue box found under the options menu allows
you to select which groups of buttons are shown on the toolbar.
Help
Detailed instructions on how to use OTLM are provided in the on-line OTLM help file. The help file is
accessed from the Help menu or button. For details about how to use the help file, select 'How to use
Help...' from the Help menu.
The help file will also document any changes made to OTLM after this manual was printed.
GETTING STARTED
Attach the interface cable between the serial port connector on your PC and the serial port on the
logger.
Communications Options
Communications Port: Select 'Options' from the Options menu and check that the Communications Port
is set to the one you have connected the logger to.
Logger type: Used to select the correct logger type. There is also a toolbar button available to toggle
between the logger types before connecting. Logger type for the next connection is shown on the status
bar.
Connecting
Whenever you connect a logger the first thing you must do is to select 'Connect' from the Logger menu
(there is a button to do this). OTLM will then check the status of the logger to determine which
operations are allowed, and define the menu options accordingly. It is important that this is done every
time a logger is connected, otherwise OTLM will not know that it is talking to a different logger and
will not clear the settings from the previous logger.
When connecting to a TINYTALK logger, the only option initially available is that of stopping the
logger. This is because all communications with a TINYTALK logger first require the logger to be
stopped.
Obtaining a Current Reading (TINYTALK II & TINYTAG Only)
Selecting 'Current Reading' from the Logger menu (there is a button to do this) will instruct the logger
to take a reading which will then be displayed. The first time this is done after a logger has been
connected will take a few seconds (since the type of logger must first be identified). The current reading
is updated every 1 second.
Start Logging
To set up a logger and start it logging select 'Start Logging...' from the Logger menu (there is a button to
do this). A dialogue will appear, after a second or two, showing the various possible logger
settings.
Please refer to the following 3 pages for specific information on each type of logger.
TINYTALK
Title
A title for the data up to 40 characters long.
Interval Between Readings
One of 31 different time intervals may be chosen.
Duration
The total time taken to make 1800 readings at the above interval.
The selectable intervals / durations
Duration/Interval
15min 0.5 sec
30min 1 sec
45min 1.5 sec
1hr
2 sec
1.5 hr 3 sec
2 hr
4 sec
3 hr
6 sec
4 hr
8 sec
6 hr
12 sec
8 hr
16 sec
are :
Duration/Interval
12 hr
24 sec
15 hr
30 sec
20 hr
40 sec
1day
48 sec
1.5 days 1.2 min
2 days 1.6 min
3 days 24 min
4 days 3.2 min
6 days 4.8 min
8 days 6.4 min
Duration/Interval
12 days
9.6 min
15 days
12 min
20 days
16 min
30 days
24 min
45 days
36 min
60 days
48 min
90 days
1.2 hr
120 days1.6 hr
180 days2.4 hr
240 days3.2 hr
360 days4.8 hr
Wrap When Full
If this is selected, when the logger is full the oldest data is overwritten with the new data. Otherwise the
logger will stop when it is full.
Delayed Start (35mm loggers only)
If this option is selected, the logger will begin logging the next time the battery is replaced (Note: Real
time information will be lost with this option, since the length of time for which the battery is removed
is unknown).
Note :
i) There is no real time reading from the Logger in the Launch dialogue.
ii) The Prefered Measurement Units cannot be changed in OTLM. The units used will be those that
were last selected using other host software.
TINYTALK II
Title
A title for the data up to 24 characters long.
Interval Between Readings
This is specified to the nearest second (as TINYTALK II operates in second logging interval units) and
can be up to 4.5 hours.
Triggered Start
This option box may appear for certain loggers. If it is selected, then the logger will wait for an external
trigger event (followed by any time delay) before beginning to log.
Auto Stop
The logger may be set to stop logging in one of three ways:
i)
Never - In this mode, when the logger is full, the oldest data is overwritten with the new data.
ii)
When full.
iii)
After a specified number of readings have been made.
Note :
Sending a Stop command from the Host Software will stop the logger regardless of which option is set.
Delay Before Logging
Logging can be programmed to begin up to 45 days from the time the logger is started from the host
software. If the delays option is selected, then the delays button may be used to open the delays
dialogue, which allows you to specify either a time delay (in days, hours and minutes) or a time and
date at which to begin logging.
TINYTAG and TINYVIEW
In addition to those settings available to TINYTALK II, TINYTAG and TINYVIEW have the
following:
Interval Between Readings
This can be specified in either second or minute logging interval units. An interval specified in second
units can be from 1 second to 4.5 hours and an interval specified in minute units can be from 1 minute
to 10 days. There are different advantages to using second or minute units.
Reading Type
When using a multiple minute logging interval, actual, maximum or minimum readings may be
specified based on a one minute interval. e.g. if using a 10 minute reading interval a maximum reading
would be stored based on the highest of 10 possible readings.
Alarms
This button opens a sub-dialogue in which the alarms are set. Each alarm can be set as follows :
On or Off : Alarms may be disabled.
Indication : Either 1 or 2 alarm flashes.
Over or Under : Which side of the trip piont should be considered as the alarm condition.
Trip point : One of 256 possible points depending on specific logger range and unit of measurement.
Latching : If an alarm is not set to latch it will indicate whenever the alarm condition is met. If an alarm
is set to latch, it is triggered when the logger CROSSES INTO the alarm condition, and continues to be
indicated even when the logger has dropped out of the alarm state.
Starting the logger
The logger can now be started (click on the 'Start' button) or the start can be cancelled (click on the
'Cancel' button). If start is selected the set information is sent to the logger, this takes several
seconds. Once this is complete OTLM will beep at which point the logger may be unplugged. A further
few seconds after OTLM has beeped, the logger will begin logging. After a logger has been started (or
a start has been cancelled) OTLM automatically 'disconnects' the logger, ready for another to be
connected.
Note: When Loggers start logging they store the time and date, this is taken from the internal clock on
the PC being used. It is therefore important to keep your PC's clock set accurately.
Stopping the logger
To stop the logger you must first connect it to your PC with the interface cable. Next choose connect
from the Logger menu followed by Stop from the Logger menu after the logger has connected.
Offlaoding the data
If a TINYTAG is logging in minute logging interval units then it can have its data off-loaded while it
continues to log. Other loggers and TINYTAGs logging in second units, must first be stopped. To offload a logger select 'Off-load' from the Logger menu (there is a button to do this). The time taken to offload a logger will depend on how much data it contains. Off-loading a logger will automatically open a
default plot window showing the measurements made during the entire deployment.
Alarm limits (TINYTAG Only)
Any alarm values will also be shown on the plot as straight lines. Alarm one is shown as a red line,
while alarm two is shown as a green line.
Clearing Alarm Indicators
Alarm indicators may be cleared while the logger is logging by selecting 'Clear Alarms' from the
Logger menu (there is a button to do this). See the logger manual for more details on Clearing Alarms.
VIEWING THE DATA
Data from a logger can be viewed in Graph View, Readings View and Information View. All views
generated from one data set are dynamically linked so that when the section of data selected in any view
is changed, all other views of that data set are updated to show the new section.
Graph View
The Graph View shows a plot of the measured property over time. Also shown is the data title (entered
by the user who started the logger) and the logger's serial number. The time of the first reading in a
Graph View is stated following the Time axis label.
Detailed Plots
By default, if there is more data to plot than can fit on a Graph View (allowing one pixel per reading),
every nth point is omitted from the plot. This allows for fast redraws whilst still giving informative
plots. Selecting the detailed plots option forces the Graph View to always display every reading. This is
useful with data from loggers where transient 'spikes' of data are important such as shock loggers or
temperature loggers with long logging intervals (where the temperature can rise and fall for a single
reading).
Note: Selecting Detailed Plots will slow down the redraw process. Copying and Printing Graph Views
is also affected by the Detailed Plots setting.
Digital Pointer
Moving the cursor into a plot area will bring up the digital pointer which can be moved along the data.
Holding down the SHIFT key snaps the Cursor to the nearest reading (this function can be inverted by
selecting an option in the General options box, see page 11). When the digital pointer is positioned over
a reading the reading number is also shown in the status bar.
Reading View
The Readings View is a text listing of all the readings in the current time range selected using the zoom
options. For each reading the reading number, date and time are given. A title bar is included containing
the data title, logger serial number and headings for each column. You can scroll up and down through
the readings by clicking on or dragging the scroll bar.
Date format: By default the format used is the Windows long date format. The short date format can be
selected in the General Options to reduce the required Window size for the Readings View. Windows
long and short date formats are specified in the international settings.
Font size: The font sizes used to display the Readings view on the screen and to print it may be adjusted
in the General Options.
Copying: When the Readings View is copied to the clipboard the title bar is included in the copy. Note:
Large data sets may take several seconds to copy on slower computers.
Printing: The Readings View printout includes the title bar on each page as a header and a page
number as a footer. Page breaks can be added when printing on continuous paper.
Data Information View
Data found under the heading 'Statistics for sub range of data' is dynamically linked to graph and
reading views.
ZOOMING DATA
In any view you can zoom to select data in a specific time range. All other views of that data set are
then updated to show the new range. In graph view you zoom in on a section of plot by drawing a box
around it using the left mouse button. In readings and data view you enter zoom details via a dialogue
box. The zoom options in the View menu are Zoom Range, Zoom Back and Zoom 100%.
Zoom Range
Allows you to select a section of data by entering a time range. All available readings between the two
dates and times entered will be selected. By default the date and time of the first and last reading in the
current range will be shown. Dates should be entered in the Windows short date format (This will
depend on your international settings in Windows) and times should be entered in 24 hour format.
When using Zoom Range the y-axis of the Graph View scales automatically.
Zoom Back
Steps you back through the various zooms you have made, one at a time, until you get back to the
original view of the full data set. When the full data set is selected the Zoom Back option is disabled on
all views except the Graph View, where it can be used toggle between the default plot and a plot shown
using the full y-axis range of the logger.
Zoom 100%
Resets the zooming process and goes back to a view of the full data set (the y-axis scaling will be that
last used for a full data view).
Copy
Any of the data views may be copied to the Windows Clipboard so they can be pasted into other
applications. To copy the current view select copy from the Edit menu (there is also a toolbar button
available to do this). Views are copied in the following formats:
Graph View : Windows Metafile (WMF) format.
i)
The clipboard image will be scaled accordingly by the application it is pasted into, although its
proportions will depend on the size of the Graph View being copied.
ii)
Selecting the Detailed Plots option will slow down the Copy and Paste process with Graph
Views of large data sets.
Info View : Plain text with a single tab character separating the two columns.
Readings View: Plain text with single tab characters between columns. The title bar is also copied to
the Clipboard. Note: Readings Views containing large amounts of data may take several seconds to
copy on slower computers.
Print Graph
The plots displayed can be sent directly to a printer by selecting the Print option from the File menu
(there is a button to do this). The Printer Setup... option in the File menu allows you to configure
the default printer.
Save Data to Disk
Off-loaded datafiles may be saved to disk, so they can be re-opened later, by selecting 'Save' or 'Save
As' from the file menu. If an off-loaded file has not been saved when you come to close the window,
OTLM will prompt you to save it first.
Notes
It is not possible for OTLM to Open TINYTALK datafiles which were saved using other Host
Software. e.g. *.DTF files.
Exporting data
OTLM allows the export of off-loaded datafiles as text. These text files can then be used to import data
into spreadsheet programs. To export a file, first display a plot from that file and then select 'Export'
from the File menu. A window will appear to prompt you for a name for the text file. The 'Save File as
Type' Option in this dialogue allows you to specify the format that the exported text file will take. The
'Text' options display the data with various time/date formats using a tab separator. The Excel™ format
uses the Excel time/date code with a tab separator, while the Lotus™ format uses the Lotus time/date
code with either a comma separator for CSV (Comma Separated Variable) files or the Windows default
separator for Lotus International files. (Both the Lotus and Excel time/date codes are numeric codes
which the spreadsheet programs can interpret as a time and date).
Notes :
a) Exported datafiles also contain a header giving information about the datafile.
b) Files in Excel and Lotus formats must be imported into the spreadsheet as text files.
c) The Export option in the 'General Options ' dialogue allows you to export data range that you are
currently viewing (see page 11).
GENERAL OPTIONS
To view the 'General Options' dialogue Select 'General' from the 'Options' menu.
Graph
Detailed Plots: Selecting detailed plots forces the Graph View to always display every reading. This can
give improved detail but will slow down the redraw process.
Cursor Snap: With cursor snap on, the digital pointer in a Graph View snaps onto the nearest reading.
Export
Selected Range Only: This option allows just the data range shown in the current view to be exported.
By default the whole datafile is exported.
Text Views
Short Reading Dates: By default the format used for dates in the Readings View is the Windows long
date format. Short date format will reduce the required Window size.
Font Size: The screen font size used for the Info View and Readings View may be changed.
Text Printing
Page Breaks: Selecting page breaks will leave an additional border at the top and bottom of each page
of text.
Left Border: A left border will be added to the default printer border in the Info and Readings Views
with this option selected.
Font Size: The font size used to print the Info and Readings Views may be changed.
User Name
The name entered here will be appended to all datafiles that are offloaded using this copy of OTLM.
Whenever these datafiles are then viewed the User Name will appear here.
Further Information
Further information about specific logger can be found in manuals supplied with loggers. For further
technical support on this software please contact your supplier.