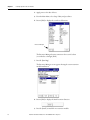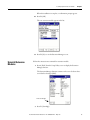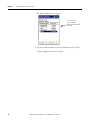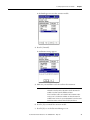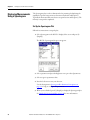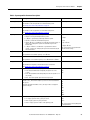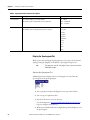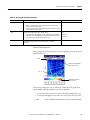
1
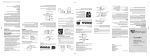
User Manual
Run Up Coast Down Extension Module for the
Dynamix 2500 Data Collector
Catalog Number 1441-DYN25-MRUC
Important User Information
Solid-state equipment has operational characteristics differing from those of electromechanical equipment. Safety
Guidelines for the Application, Installation and Maintenance of Solid State Controls (publication SGI-1.1 available from
your local Rockwell Automation sales office or online at http://www.rockwellautomation.com/literature/) describes some
important differences between solid-state equipment and hard-wired electromechanical devices. Because of this difference,
and also because of the wide variety of uses for solid-state equipment, all persons responsible for applying this equipment
must satisfy themselves that each intended application of this equipment is acceptable.
In no event will Rockwell Automation, Inc. be responsible or liable for indirect or consequential damages resulting from
the use or application of this equipment.
The examples and diagrams in this manual are included solely for illustrative purposes. Because of the many variables and
requirements associated with any particular installation, Rockwell Automation, Inc. cannot assume responsibility or
liability for actual use based on the examples and diagrams.
No patent liability is assumed by Rockwell Automation, Inc. with respect to use of information, circuits, equipment, or
software described in this manual.
Reproduction of the contents of this manual, in whole or in part, without written permission of Rockwell Automation,
Inc., is prohibited.
Throughout this manual, when necessary, we use notes to make you aware of safety considerations.
WARNING: Identifies information about practices or circumstances that can cause an explosion in a hazardous
environment, which may lead to personal injury or death, property damage, or economic loss.
ATTENTION: Identifies information about practices or circumstances that can lead to personal injury or death,
property damage, or economic loss. Attentions help you identify a hazard, avoid a hazard, and recognize the
consequence
SHOCK HAZARD: Labels may be on or inside the equipment, for example, a drive or motor, to alert people that
dangerous voltage may be present.
BURN HAZARD: Labels may be on or inside the equipment, for example, a drive or motor, to alert people that
surfaces may reach dangerous temperatures.
IMPORTANT
Identifies information that is critical for successful application and understanding of the product.
Allen-Bradley, Rockwell Software, Rockwell Automation, Emonitor, Dynamix, Enpac, and TechConnect are trademarks of Rockwell Automation, Inc.
Trademarks not belonging to Rockwell Automation are property of their respective companies.
Table of Contents
Preface
Optional Extension Modules. . . . . . . . . . . . . . . . . . . . . . . . . . . . . . . . . . . . . . . . 5
Additional Resources . . . . . . . . . . . . . . . . . . . . . . . . . . . . . . . . . . . . . . . . . . . . . . . 6
Chapter 1
Installing Optional Extension
Modules
Install an Extension Module . . . . . . . . . . . . . . . . . . . . . . . . . . . . . . . . . . . . . . . . 7
Uninstall Extension Modules. . . . . . . . . . . . . . . . . . . . . . . . . . . . . . . . . . . . . . . . 9
Manage Extension Modules . . . . . . . . . . . . . . . . . . . . . . . . . . . . . . . . . . . . . . . 12
Extension Module Battery Status Indicators . . . . . . . . . . . . . . . . . . . . . . . . 13
Chapter 2
Run Up/Coast Down Extension
Module
Set Up Run Up/Coast Down Measurements . . . . . . . . . . . . . . . . . . . . . . .
Collect Run Up/Coast Down Measurements. . . . . . . . . . . . . . . . . . . . . . .
Displaying Measurements by Using a Bode Plot. . . . . . . . . . . . . . . . . . . . .
Set Up the Bode Plot . . . . . . . . . . . . . . . . . . . . . . . . . . . . . . . . . . . . . . . . .
Display the Bode Plot . . . . . . . . . . . . . . . . . . . . . . . . . . . . . . . . . . . . . . . . .
Displaying Measurements Using a Nyquist Plot. . . . . . . . . . . . . . . . . . . . .
Set Up the Nyquist Plot. . . . . . . . . . . . . . . . . . . . . . . . . . . . . . . . . . . . . . .
Display the Nyquist Plot . . . . . . . . . . . . . . . . . . . . . . . . . . . . . . . . . . . . . .
Displaying Measurements in Table Format . . . . . . . . . . . . . . . . . . . . . . . . .
Set Up the Table . . . . . . . . . . . . . . . . . . . . . . . . . . . . . . . . . . . . . . . . . . . . .
Display the Table. . . . . . . . . . . . . . . . . . . . . . . . . . . . . . . . . . . . . . . . . . . . .
Displaying Measurements Using a Waterfall. . . . . . . . . . . . . . . . . . . . . . . .
Set Up the Waterfall . . . . . . . . . . . . . . . . . . . . . . . . . . . . . . . . . . . . . . . . . .
Display the Waterfall Plot. . . . . . . . . . . . . . . . . . . . . . . . . . . . . . . . . . . . .
Displaying Measurements Using a Spectrogram. . . . . . . . . . . . . . . . . . . . .
Set Up the Spectrogram Plot . . . . . . . . . . . . . . . . . . . . . . . . . . . . . . . . . .
Display the Spectrogram Plot . . . . . . . . . . . . . . . . . . . . . . . . . . . . . . . . . .
Save Run Up/Coast Down Measurements . . . . . . . . . . . . . . . . . . . . . . . . .
Recall a Setup . . . . . . . . . . . . . . . . . . . . . . . . . . . . . . . . . . . . . . . . . . . . . . . . . . . .
Review Run Up/Coast Down Measurements . . . . . . . . . . . . . . . . . . . . . . .
Screen Capturing . . . . . . . . . . . . . . . . . . . . . . . . . . . . . . . . . . . . . . . . . . . . . . . .
Delete Run Up/Coast Down Files . . . . . . . . . . . . . . . . . . . . . . . . . . . . . . . . .
17
19
22
22
24
25
25
27
28
28
30
31
31
33
36
36
38
40
41
43
45
45
Index
Rockwell Automation Publication 1441-UM006A-EN-P - May 2011
3
Table of Contents
Notes:
4
Rockwell Automation Publication 1441-UM006A-EN-P - May 2011
Preface
This manual covers the Dynamix 2500 data collector Run Up Coast Down
(RUCD) extension module.
When using the Dynamix 2500 Data Collector Run Up Coast Down Extension
Module, you can do the following:
• Record and analyze data from intermittent events and transient vibration
signals from non-steady state machines.
• Analyze a machine’s critical speeds and resonant frequencies.
Optional Extension
Modules
These are the optional extension modules for the Dynamix 2500 data collector:
• 1441-DYN25-4C, 4-channel Activation (1)
The 4-channel activation lets you take 3- or 4- channel magnitude, time
waveform, spectra, and Offroute measurements.
• 1441-DYN25-MBMP Bump Test
The Bump test (or hammer test) determines the natural frequencies of a
machine or a structure.
• 1441-DYN25-MBAL Balancing
The Balancing test resolves single-plane, two-plane, and static-couple
balances with high precision.
• 1441-DYN25-MFRF Frequency Response Function
The FRF test lets you determine the natural frequencies of a machine as
well as sophisticated information about the frequency response of the
structure being tested.
• 1441-DYN25-MREC Time Recorder
The Time Recorder test uses a the instrument as a data recorder for realtime data acquisition and analysis.
• 1441-DYN25-MRUC Run Up Coast Down
The RUCD test records and analyzes data from intermittent events and
transient vibration signals from non-steady state machines.
See Additional Resources on page 6 for a listing of available publications.
(1) This is an activation license for the Dynamix 2500 data collector.
Rockwell Automation Publication 1441-UM006A-EN-P - May 2011
5
Preface
Additional Resources
These documents contain additional information concerning products from
Rockwell Automation.
Resource
Description
Dynamix 2500 Data Collector User Manual,
publication 1441-UM001
Describes the Dynamix 2500 data collector
which provides predictive maintenance by
using noise and vibration analysis.
Dynamix 2500 Data Collector Bump Test Extension
Module User Manual, publication 1441-UM002
Describes how determine natural (or resonant)
frequencies of a machine or structure.
Dynamix 2500 Data Collector Frequency Response
Function Extension Module User Manual,
publication 1441-UM003
Describes how to determine the natural
frequencies of a machine or structure using
modal hammer.
Dynamix 2500 Data Collector Balancing Extension
Module User Manual, publication 1441-UM004
Describes the direct method to balance your
rotating machinery in one or two planes.
Dynamix 2500 Data Collector Time Recorder
Extension Module User Manual,
publication 1441-UM005
Describes how to use the data collector as a
data recorder for real-time data acquisition,
post processing, and analysis.
Emonitor User’s Guide, publication
EMONTR-UM001
Describes data management for predictive
maintenance services.
Dynamix 2500 Data Collector Kit Release Notes,
publication 1441-RN001
Provides important information on the latest
updates, for example, firmware, certifications,
warnings, and hardware changes for the data
collector.
Dynamix 2500 Data Collector Optional Extension
Modules Release Notes, publication 1441-RN002
Provides important information on how to
install the Optional Extension Modules onto
the Dynamix 2500 data collector.
Industrial Automation Wiring and Grounding
Guidelines, publication 1770-4.1
Provides general guidelines for installing a
Rockwell Automation industrial system.
Product Certifications website, http://www.ab.com Provides declarations of conformity,
certificates, and other certification details.
You can view or download publications at http://www.rockwellautomation.com/
literature. To order paper copies of technical documentation, contact your local
Allen-Bradley distributor or Rockwell Automation sales representative.
6
Rockwell Automation Publication 1441-UM006A-EN-P - May 2011
Chapter
1
Installing Optional Extension Modules
The data collector uses the Extension Manager to install and uninstall extension
modules. These extension modules are licensed and ordered separately from the
basic entry level product.
Topic
Page
Install an Extension Module
7
Uninstall Extension Modules
9
Manage Extension Modules
12
Extension Module Battery Status Indicators
13
The installation Secure Digital (SD) cards that you receive work with any
Dynamix 2500 data collector. Once you have installed an extension module, the
card is locked so that it can be used only with that instrument.
IMPORTANT
One installation SD card is required for each instrument that needs to
be upgraded.
You can uninstall extension modules if required. When uninstalling an extension
module, you have the option to free up the license so you can install the extension
module on another instrument. This makes the extension module available to be
transferred between units.
IMPORTANT
When ever you re-run the OS Loader software, you will re-load only the
main OS firmware. The OS loader will backup licence files and data, but
not the optional extension modules. Once you have updated the OS
firmware, install the latest version of your optional extension modules.
See the Dynamix 2500 Data Collector User Manual, 1441-UM001, for
more information.
Install an Extension
Module
Follow these instructions to install an extension module.
1. Open the base cover at the bottom of the Dynamix 2500 data collector.
2. Place the extension module SD card contact side-up into the unit until it is
firmly seated in place.
3. Close the base cover.
Rockwell Automation Publication 1441-UM006A-EN-P - May 2011
7
Chapter 1
Installing Optional Extension Modules
4. Apply power to the data collector.
5. From the Main Menu, select Setup Utility and press Enter.
6. Press 0 (Shift) to display the second set of functions.
Extension Manager
The Extension Manager function remains on the screen for about
3 seconds after releasing 0 (Shift).
7. Press F1 (Extn Mgr).
The Extension Manager screen appears showing the current extension
module installations.
8. Press 0 (Shift) to display the Install extension function.
9. Press F2 (Install) to install the new extension module.
8
Rockwell Automation Publication 1441-UM006A-EN-P - May 2011
Installing Optional Extension Modules
Chapter 1
When the installation is complete, a confirmation prompt appears.
10. Press F4 (OK).
The new extension module appears in the list.
11. Press F4 (Esc) to exit the Extension Manager screen.
Uninstall Extension
Modules
Follow these instructions to uninstall an extension module.
1. Press 0 (Shift) from the Setup Utility screen to display the Extension
Manager function.
The Extension Manager function remains on the screen for about three
seconds after releasing 0 (Shift).
Extension Manager
2. Press F1 (Extn Mgr).
Rockwell Automation Publication 1441-UM006A-EN-P - May 2011
9
Chapter 1
Installing Optional Extension Modules
The Extension Manager screen appears.
This screen lists the
extension modules
currently installed and the
on the unit.
3. Select the extension module you want to uninstall and press F3 (Select).
F3 (Select) toggles the selection on and off.
10
Rockwell Automation Publication 1441-UM006A-EN-P - May 2011
Installing Optional Extension Modules
Chapter 1
A checkmark appears next to that extension module.
4. Press F1 (Uninstall).
A confirmation message appears.
5. Make sure your installation card is inserted into the instrument.
IMPORTANT
The extension module is uninstalled and the license on the card is
released so that the card can be used to install the extension
module on another Dynamix 2500 data collector.
If the installation card is not inserted in the instrument and no
card, you are is found or the card does not have the extension
module license for the unit, you are prompted to insert the correct
installation card or continue without freeing the license.
6. Press F2 (Yes) to uninstall the extension module.
7. Press F4 (Esc) to exit the Extension Manager screen.
Rockwell Automation Publication 1441-UM006A-EN-P - May 2011
11
Chapter 1
Installing Optional Extension Modules
Manage Extension
Modules
The Dynamix 2500 data collector lets you to hide installed extension modules
from the Main Menu. You may need to hide an advanced extension module icon
from an inexperienced user, for example, RUCD and FRF.
IMPORTANT
Once an extension module is hidden, its icon is not represented on the
Main Menu or displayed in the Dynamix 2500 data collector About
screen.
Follow these instructions to hide or show an extension module icon on the Main
Menu.
1. Press 0 (Shift) on the Setup Utility screen to display the Extension
Manager function.
The Extension Manager function should remain on the screen for
approximately three seconds after releasing 0 (Shift).
2. Press F1 (Extn Mgr).
The Extension Manager screen appears. The Extension Manager displays a
list of installed extensions module.
The extension modules that
are hidden are shown in
[square brackets].
The F2 (Hide) toggles between Hide and Show depending if the selected
extension module is hidden or not.
TIP
12
You have to exit and re-enter the Extension Manager after hiding an
extension module to have the Show function appear.
Rockwell Automation Publication 1441-UM006A-EN-P - May 2011
Installing Optional Extension Modules
Chapter 1
3. Select the extension module that you want to hide or show and press F2
(Show/Hide).
TIP
If you want to show or hide multiple extension modules
simultaneously, select each extension module and press F3
(Select).
A checkbox appears next to each selected extension module. If
you select multiple extension modules and some are hidden
while others are shown, F2 (Show/Hide) reflects the status of the
selected extension module.
4. Press F4 (Esc) to exit the Extension Manager.
Extension Module Battery
Status Indicators
The battery status icons show the strength of the battery.
Table 1 - Extension Module Battery Icon Descriptions
Battery Icon
Meaning
Battery status is good: >30% life remaining.
Battery status is low: >10% life remaining.
Battery status is very low: <10% life remaining.
Battery is charging.
Rockwell Automation Publication 1441-UM006A-EN-P - May 2011
13
Chapter 1
Installing Optional Extension Modules
Notes:
14
Rockwell Automation Publication 1441-UM006A-EN-P - May 2011
Chapter
2
Run Up/Coast Down Extension Module
The Run Up/Coast Down (RUCD) extension module is an optional module for
the Dynamix 2500 data collector. You install the extension module with the
RUCD Secure Digital (SD) card.
See Installing Optional Extension Modules on page 7 for installation
instructions.
Topic
Page
Set Up Run Up/Coast Down Measurements
17
Collect Run Up/Coast Down Measurements
19
Displaying Measurements by Using a Bode Plot
22
Displaying Measurements Using a Nyquist Plot
25
Displaying Measurements in Table Format
28
Displaying Measurements Using a Waterfall
31
Displaying Measurements Using a Spectrogram
36
Save Run Up/Coast Down Measurements
40
Recall a Setup
41
Review Run Up/Coast Down Measurements
43
Screen Capturing
45
Delete Run Up/Coast Down Files
45
The Run Up/Coast Down extension module lets the data collector record and
analyze data from intermittent events and transient vibration signals from
non-steady state machines.
The Run Up/Coast Down extension module is used to record and analyze data
from machines where noise or vibration levels are changing with speed or time
such as during a run up (increase in speed), coast down (decrease in speed), or
other applications causing transient phenomena. You use the data to analyze a
machine’s critical speeds and resonant frequencies.
Rockwell Automation Publication 1441-UM006A-EN-P - May 2011
15
Chapter 2
Run Up/Coast Down Extension Module
The application acquires a simultaneous noise or vibration signal and a
tachometer signal.
This example setup includes the following:
• Accelerometer attached to connector A of the Dynamix 2500 data
collector
• Optical tachometer signal connected to the POWER/USB/TRIGGER
cable
• Tripod for tachometer signal stability
• Speed reference trigger
• Small piece of reflective tape on the part of the shaft can serve as a reference
trigger or you can simply pass the laser over a notch in the shaft
This graphic illustrates a typical Run Up/Coast Down setup.
Figure 1 - Run Up/Coast Down Setup
Accelerometer
Reflective Tape
Tachometer
Tripod
32147-M
The recorded data is saved in the form of a Microsoft .wav time waveform file.
You can analyze this file and viewed in a variety of different formats including:
•
•
•
•
•
16
Bode Plot
Nyquist Plot
Table
Waterfall
Spectrogram
Rockwell Automation Publication 1441-UM006A-EN-P - May 2011
Run Up/Coast Down Extension Module
Set Up Run Up/Coast Down
Measurements
Chapter 2
The first step in the Run Up/Coast Down extension module is to setup how the
measurements are taken by the data collector.
1. Select RUCD on the Main Menu and press the Enter.
The RUCD screen appears.
2. Select Setup and press Enter to set up the Run Up/Coast Down
parameters.
The RUCD - Setup screen appears.
3. Select a parameter and press the Right arrow to open a list of values.
4. Select or type the parameter value.
5. Press Left arrow to save your selection.
6. Press F2 (Save) to save the current settings to a file.
See Save Run Up/Coast Down Measurements on page 40 for details.
Rockwell Automation Publication 1441-UM006A-EN-P - May 2011
17
Chapter 2
Run Up/Coast Down Extension Module
Use these descriptions to help you configure the parameters in the Run Up/Coast
Down Setup screen.
Table 2 - Run Up/Coast Down Setup Parameters
Parameter
Description
Values/Comments
Transducer
Specifies the type of sensor used on Connector A, this is typically
Accel (g).
Accel ICP (g) (default)
The specified sensor type determines available options and
engineering units for subsequent setup fields.
Accel ICP (m/s2)
Accel (g)
Accel (m/s2)
Vel ICP (mm/s)
Vel (mm/s)
Vel ICP (ips)
Vel (ips)
Disp (mils)
Disp (µm)
Volts AC
User (EU)
Sens (mV/EU)
Range (EU)
The transducer sensitivity in millivolts (MV) per engineering units
(EU).
1…2000 (mV/EU)
The expected maximum amplitude range value for the incoming input
signal.
.1 EU
The range should accommodate for unexpected events. If you are
unsure about the range value, set the range 10 to 20 times higher
than expected.
.5 EU
100 (default)
.2 EU
1 EU
2 EU (default)
5 EU
10 EU
20 EU (default)
50 EU
100 EU
200 EU
500 EU
1000 EU
2000 EU
Max M/c Speed
Max No Orders
Mode
The maximum speed that the shaft will reach in rpm.
10…60000 rpm
This is used with Max No Orders to determine the sampling rate.
3600 rpm (default)
The maximum number of shaft orders of interest during analysis.
1 to 166
This is used with Max M/c Speed to determine the sampling rate.
32 (default)
The method for initiating the data collection.
Runup (default)
• Runup - The data collection starts when the machine speed
rises above Start Spd.
• Coast down -The data collection starts when the machine
speed falls below Stop Spd.
• Manual - Manually start data collection by pressing F4 (Start).
No tachometer signal is required for this mode.
18
Rockwell Automation Publication 1441-UM006A-EN-P - May 2011
Manual
Coastdown
Run Up/Coast Down Extension Module
Chapter 2
Table 2 - Run Up/Coast Down Setup Parameters
Parameter
Description
Values/Comments
Pulses/Rev
The number of tachometer signal pulses per revolution of the
reference shaft.
.1…1000
To acquire a suitable tachometer signal, the tachometer signal must
be approximately 1.5 volts peak-to-peak. The adverse effect of
excessively short tachometer pulse widths can be addressed by
setting the Max No Order to a higher value to increase the sampling
rate.
This number can be a multiple or a noninteger to accommodate, for example, gear
ratios.
Sets the speed at which the unit should start collecting data.
10…3600 rpm
Start Spd (RPM)
• If Mode is set to Runup, this value must be less than the Stop
Spd.
• If Mode is set to Coast down, this value must be greater than
the Stop Spd.
1 (default)
60 rpm (default)
This parameter is not available if Mode is set to Manual.
Stop Spd (RPM)
Sets the speed at which the unit should stop collecting data.
• If Mode is set to Runup, this value must be greater than the
Start Spd.
• If Mode is set to Coast down, this value must be less than Start
Spd.
10…3600 rpm
300 rpm (default)
This parameter is not available if Mode is set to Manual.
Save To
Max Acq Time (s)
Sets the location where data is saved.
Internal (default)
Save the data to the SD or PC card if the .wav files will be large. Your
selection affects the maximum recording time.
SD Card
The number of seconds to record the time waveform.
1…1131.65 s
This limit applies only if the run up or coast down takes longer than
the time set here.
1131.65 s (default)
Collect Run Up/Coast Down
Measurements
This section describes the Run Up/Coast Down status indicators and how to
collect Run Up/Coast Down data.
Table 3 - RUCD Status Indicators
Indicator
Status
Description
Red
Solid
An overload error (clipping or streaming error) has
occurred during data collection.
Amber
Solid
An error has occurred during data collection The status
indicator turns off when the error condition disappears.
Green
Flashing Green
No errors occurred during data collection.
Once you have configured the parameters, you can begin collecting data. The
data is automatically recorded as a .wav file, which can then be analyzed using
several different types of plots.
1. Using the a tachometer cable, connect the reference input device to the
POWER/USB/TRIGGER connector and the transducer to connector A.
2. Align the reference input device (tachometer, optical tachometer, or
strobescope) to capture shaft speed.
Rockwell Automation Publication 1441-UM006A-EN-P - May 2011
19
Chapter 2
Run Up/Coast Down Extension Module
3. Attach a transducer to the bearing house.
4. Start the machine or stop the machine as needed.
5. From the RUDC Setup screen press F3 (Start).
The RUCD - Taking Data screen appears.
Current Speed of Machine
Current Overall
Vibration Reading
Maximum Acquisition Time in the
Armed State
Remaining Recording Time in the
Acquiring State
Message Area
The Dynamix 2500 data collector begins collecting run up or coast down
data based on the parameters you selected. The state of the machine is
indicated on the screen.
State
Description
Armed
The machine speed has not reached the Start Spd and data collection has
not yet started.
At any time during this state, you can press F3 (Start) to manually start
data collection.
Acquiring
The machine speed has reached the Start Spd and data collection has
started.
At any time during this state, you can press F3 (Stop) to manually stop
data collection.
Error-Clipped
An error occurred during data collection. If a sensor’s Range setting is too
small to accommodate the signal’s amplitude, a message displays in the
message error.
Press F4 (Back) to return to the RUCD - Setup screen and increase the
Range setting.
Data collection is complete when the specified Stp Speed or Maximum
Acquisition Time is reached, or you press F3 (Stop).
20
Rockwell Automation Publication 1441-UM006A-EN-P - May 2011
Run Up/Coast Down Extension Module
Chapter 2
The resulting time waveform is recorded as a Microsoft Windows .wav file
and the Acquisition Completed dialog appears on the screen.
TIP
If an error occurs during data collection, a message
appears in this dialog box.
6. Press F4 (OK) to continue.
The RUCD - Display Select screen appears.
The Dynamix 2500 data collector provides five different formats for you to
use to view the newly recorded time waveform.
7. Select the format and press F3 (Display).
Format
Description
Bode
Displays the magnitude and phase over a varying rpm.
See Displaying Measurements by Using a Bode Plot on page 22.
Nyquist
Displays the selected orders as complex data.
See Displaying Measurements Using a Nyquist Plot on page 25.
Rockwell Automation Publication 1441-UM006A-EN-P - May 2011
21
Chapter 2
Run Up/Coast Down Extension Module
Format
Description
Table
Displays the magnitude and phase of selected orders at the varied rpm speeds
in a table format.
See Displaying Measurements in Table Format on page 28.
Waterfall
Displays multiple FFT traces overlaid and offset on one single plot.
See Displaying Measurements Using a Waterfall on page 31.
Spectrogram
Displays multiple FFT traces on one single plot, using color to indicate relative
magnitude.
See Displaying Measurements Using a Spectrogram on page 36.
8. When you are finished analyzing the time waveform, you can save it to a
file.
See Save Run Up/Coast Down Measurements on page 40.
Displaying Measurements
by Using a Bode Plot
The Bode plot is actually two graphs of 1X rpm amplitude and phase as a
function of frequency. The screen shows both plots at the same time. The top
plot shows magnitude versus rpm. The bottom plot shows phase versus rpm.
Set Up the Bode Plot
1. Select Bode on the RUCD - Display Select screen and press F3 (Display).
The RUCD - Bode Setup screen appears.
2. Select the parameter and press the Right arrow to open a list of values.
3. Select or type in the parameter value.
4. Press the Left arrow to save your selection.
See Bode Plot Parameters on page 23 to help you configure the parameters.
22
Rockwell Automation Publication 1441-UM006A-EN-P - May 2011
Run Up/Coast Down Extension Module
Chapter 2
5. When you are finished, press F3 (Display) to display the Bode plot.
See Display the Bode Plot on page 24.
Table 4 - Bode Plot Parameters
Parameter
Description
Values/Comments
Start Spd (RPM)
Sets the start speed of the recorded data for the Bode plot.
10…3600 rpm
This defaults to the Start Spd value set in the RUCD Setup screen. See Table 2
on page 18.
Stop Spd (RPM)
Sets the stop speed of the recorded data for the Bode plot.
10…3600 rpm
This defaults to the Stop Spd value set in the RUCD Setup screen.
See Run Up/Coast Down Setup Parameters on page 18.
Spacing
Controls the spacing between collected spectra.
• Δ rpm is a fixed speed change between spectra.
• % Δ rpm is a percentage speed change between spectra.
• Δ Time is a fixed time interval between spectra.
• Δ rpm + Δ Time is a combination of speed and time interval settings. If
speed stops changing then spectra are calculated using the Time Interval
value.
• % Δ rpm + Δ Time is a combination of speed and time interval settings.
If speed stops changing then spectra are calculated using the Time
Interval value.
Speed Interval (rpm) Sets the speed interval used in calculating FFT spectra.
Δ rpm
% Δ rpm
Δ Time
Δ rpm + Δ Time
% Δ rpm + Δ Time
Your selection affects the Speed Interval
and Time Interval settings.
1…240 rpm or % rpm
This parameter not used when Spacing is set to Δ Time.
Time Interval (sec)
Sets the time interval used in calculating FFT spectra.
Enter a value from .001…604800 s
This parameter is not used when Spacing is set to Δ rpm and % Δ rpm.
Display Units
Sets the Y-axis units.
Accel (g)
The available units depends on the transducer used to collect data.
Accel (m/s2)
See Run Up/Coast Down Setup Parameters on page 18.
Accel (m/s2)
Vel (mm/s)
Vel (ips)
Disp (mils)
Disp (µm)
LF Cutoff
Detection
Determines whether to apply a low frequency filter (0.3 times the running
speed) to the data.
Off (default)
Sets the signal detection and scaling display for the Bode plot:
RMS
On
• Peak - Measured RMS value multiplied by the square root of two (1.4142). Peak (default)
• Pk-Pk - Measured RMS value multiplied by two times the square root of
PkPk
two (2.8284).
• RMS - Root mean squared signal level of the input signal.
Y-axis
Sets the y-axis scaling on the Bode plot:
• Linear - The plot grid centers are linearly spaced in Y between the centers
of the first and last grid.
• Log - The plot grid centers are logarithmically spaced in Y between the
centers of the first and last grid.
Rockwell Automation Publication 1441-UM006A-EN-P - May 2011
Linear (default)
Log
23
Chapter 2
Run Up/Coast Down Extension Module
Table 4 - Bode Plot Parameters
Parameter
Description
Values/Comments
Show Overall
Determines whether to display the overall severity as a trace on the Bode plot.
Yes (default)
No
Num Traces
Sets the number of traces or order tracks to be displayed on the Bode plot:
• The number of traces available is determined by the Show Overall
parameter.
• Your selection determines the available number of Trace Order
parameters.
Trace Order #1…4
The order numbers to be tracked and displayed on the Bode plot. This value
cannot exceed the Max No Orders value set in the RUCD Setup screen.
1 (default)
2
3
4
.001…166 orders
See Run Up/Coast Down Setup Parameters on page 18.
Display the Bode Plot
When you are done setting up the Bode plot parameters, you can process the data
and display the Bode plot by pressing F3 (Display) on the RUCD - Bode Setup
screen.
TIP
The larger the .wav file, the longer it takes to process the data
and display the plot.
Active Trace
Speed, Magnitude, and Q Factor
at Cursor Location
The top of the display shows magnitude versus rpm. The bottom of the display
shows phase versus rpm:
• To sequence through the traces, press the Up and Down arrows.
The order number of the current trace is displayed in the top left corner of
the screen. To move the cursor along the trace, press the Left and Right
arrows.
24
Rockwell Automation Publication 1441-UM006A-EN-P - May 2011
Run Up/Coast Down Extension Module
Chapter 2
• From the Bode plot you can also display the data in a Table format or
Nyquist plot. To display the data in a table, press 0 (Shift) and F4 (Table).
See Display the Table on page 30 for more information.
• To display the data in a Nyquist plot, press 0 (Shift) and F1 (Nyqst).
See Display the Nyquist Plot on page 27 for more information.
Displaying Measurements
Using a Nyquist Plot
The Nyquist plot is a polar representation of the amplitude and phase angle as a
function of frequency. Three variables are combined into a single plot in polar
format.
Set Up the Nyquist Plot
1. Select Nyquist on the RUCD - Display Select screen and press F3
(Display).
The RUCD - Nyquist Setup screen appears.
2. Select the option and press the Right arrow to open a list of values.
3. Select or type in a parameter value.
4. Press the Left arrow to save your selection.
Use the descriptions in Nyquist Plot Parameters on page 26 to help you
configure the parameters.
5. When you are finished, press F3 (Display) to display the Nyquist plot.
Rockwell Automation Publication 1441-UM006A-EN-P - May 2011
25
Chapter 2
Run Up/Coast Down Extension Module
See Display the Nyquist Plot on page 27.
Table 5 - Nyquist Plot Parameters
Parameter Name
Description
Values/Comments
Start Spd (RPM)
Sets the start speed of the recorded data for the plot.
10…3600 rpm
This defaults to the Start Spd value set in the RUCD Setup screen.
See Run Up/Coast Down Setup Parameters on page 18.
Stop Spd (RPM)
Sets the stop speed of the recorded data for the plot.
10…3600 rpm
This defaults to the Stop Spd value set in the RUCD Setup screen.
See Run Up/Coast Down Setup Parameters on page 18.
Spacing
Controls the spacing between collected spectra:
• Δ rpm is a fixed speed change between spectra.
• % Δ rpm is a percentage speed change between spectra.
• Δ Time is a fixed time interval between spectra.
• Δ rpm + Δ Time is a combination of speed and time interval
settings. If speed stops changing then spectra are calculated using
the Time Interval value.
• % Δ rpm + Δ Time is a combination of speed and time interval
settings. If speed stops changing then spectra are calculated using
the Time Interval value.
Speed Interval (RPM)
Sets the speed interval used in calculating FFT spectra.
Δ rpm
% Δ rpm
Δ Time
Δ rpm + Δ Time
% Δ rpm + Δ Time
Your selection affects the Speed Interval
and Time Interval settings.
1… 240 rpm or % rpm
This parameter not used when Spacing is set to Δ Time.
Time Interval (sec)
Sets the time interval used in calculating FFT spectra.
.001…604800 s
This parameter is not used when Spacing is set to Δ RPM and % Δ RPM.
Display Units
Sets the Y-axis units.
The available units depends on the transducer used to collect data.
See Run Up/Coast Down Setup Parameters on page 18.
LF Cutoff
Detection
Determines whether to apply a low frequency filter (0.3 times the running
speed) to the data.
Off
Sets the signal detection and scaling display for the plot:
RMS
• Peak - Measured RMS value multiplied by the square root of two
(1.4142).
• Pk-Pk - Measured RMS value multiplied by two times the square root
of two (2.8284).
• RMS - Root mean squared signal level of the input signal.
Num Traces
On
Peak
PkPk
Sets the number of traces or order tracks to be displayed on the plot.
1
Your selection determines the available number of Trace Order
parameters.
2
3
4
Trace Order #1-#4
The order numbers to be tracked and displayed on the plot.
This value cannot exceed the Max No Orders value set in the RUCD Setup
screen.
See Run Up/Coast Down Setup Parameters on page 18.
26
Rockwell Automation Publication 1441-UM006A-EN-P - May 2011
.001…166 orders
Run Up/Coast Down Extension Module
Chapter 2
Display the Nyquist Plot
When you are done setting up the plot parameters, you can process the data and
display the Nyquist plot by pressing F3 (Display) on the RUCD - Nyquist Setup
screen.
TIP
The larger the .wav file, the longer it takes to process the data
and display the plot.
Active Trace
Speed, magnitude, and Q
Factor at Cursor Location
The display shows the selected orders as complex data with zero degrees along the
positive X-axis and 90 degrees along the positive Y-axis:
• To sequence through the traces, press the Up and Down arrows. The order
number of the current trace is displayed in the top left corner of the screen.
To move the cursor along the trace, press the Left and Right arrows.
• From the Nyquist plot you can display the data in a table or Bode plot,
press 0 (Shift) and F4 (Table).
See Display the Table on page 30 for more information.
• To display the data in a Bode plot, press 0 (Shift) and then F1 (Bode).
See Display the Bode Plot on page 24 for more information.
Rockwell Automation Publication 1441-UM006A-EN-P - May 2011
27
Chapter 2
Run Up/Coast Down Extension Module
Displaying Measurements
in Table Format
The magnitude and phase of selected orders at the varied rpm speeds are
displayed in a table.
Set Up the Table
1. Select Table on the RUCD - Display Select screen and press F3 (Display).
The RUCD - Table Setup screen appears.
2. Select a parameter press the Right arrow to open a list of values.
3. Select or type in a parameter value.
4. Press the Left arrow to save your selection.
Use the descriptions in Table Parameter Descriptions on page 28 to help
you configure the parameters.
5. When you are finished, press F4 (Display) to display the table.
See Display the Table on page 30.
Table 6 - Table Parameter Descriptions
Parameter Name
Description
Values/Comments
Start Spd (RPM)
Sets the start speed of the recorded data for the table.
10…3600 rpm
This defaults to the Start Spd value set in the RUCD Setup screen.
See Run Up/Coast Down Setup Parameters on page 18.
Stop Spd (RPM)
Sets the stop speed of the recorded data for the table.
This defaults to the Stop Spd value set in the RUCD Setup screen.
See Run Up/Coast Down Setup Parameters on page 18.
28
Rockwell Automation Publication 1441-UM006A-EN-P - May 2011
10…3600 rpm
Run Up/Coast Down Extension Module
Chapter 2
Table 6 - Table Parameter Descriptions
Parameter Name
Description
Values/Comments
Spacing
Controls the spacing between collected spectra:
Δ rpm
% Δ rpm
Δ Time
Δ rpm + Δ Time
% Δ rpm + Δ Time
• Δ rpm is a fixed speed change between spectra.
• % Δ rpm is a percentage speed change between spectra.
• Δ Time is a fixed time interval between spectra.
• Δ rpm + Δ Time is a combination of speed and time interval settings.
If speed stops changing then spectra are calculated using the Time
Interval value.
• % Δ rpm + Δ Time is a combination of speed and time interval
settings. If speed stops changing then spectra are calculated using the
Time Interval value.
Speed Interval (RPM)
Sets the speed interval used in calculating FFT spectra.
Your selection affects the Speed Interval
and Time Interval settings.
1…240 rpm or % rpm
This parameter not used when Spacing is set to Δ Time.
Time Interval (sec)
Sets the time interval used in calculating FFT spectra.
.001…604800 s
This parameter is not used when Spacing is set to Δ RPM and % Δ RPM.
Display Units
Sets the Y-axis units.
The available units depends on the transducer used to collect data.
See Run Up/Coast Down Setup Parameters on page 18.
LF Cutoff
Detection
Determines whether to apply a low frequency filter (0.3 times the running
speed) to the data.
Off
Sets the signal detection and scaling display for the table:
RMS
• Peak - Measured RMS value multiplied by the square root of two
(1.4142).
• Pk-Pk - Measured RMS value multiplied by two times the square root of
two (2.8284).
• RMS - Root mean squared signal level of the input signal.
Num Traces
Trace Order #1-#4
On
Peak
PkPk
Sets the number of traces or order tracks to be displayed in the table.
1
Your selection determines the available number of Trace Order parameters.
2
The order numbers to be tracked and displayed in the table.
.001…166 orders
This value cannot exceed the Max No Orders value set in the RUCD Setup
screen.
See Run Up/Coast Down Setup Parameters on page 18.
Rockwell Automation Publication 1441-UM006A-EN-P - May 2011
29
Chapter 2
Run Up/Coast Down Extension Module
Display the Table
When you are done setting up the table parameters, you can process the data and
display the table by pressing F4 (Display) on the RUCD - Table Setup screen.
Up to two orders of the magnitude and phase data set is displayed in the table:
• To scroll through the table, press the Up and Down arrows.
• You can also display the data in a Bode plot. To display the data in a Bode
plot or Nyquist plot, press 0 (Shift) and F4 (Bode).
See Display the Bode Plot on page 24.
• To display the data in a Nyquist plot, press 0 (Shift) and F1 (Nyquist).
See Display the Nyquist Plot on page 27.
30
Rockwell Automation Publication 1441-UM006A-EN-P - May 2011
Run Up/Coast Down Extension Module
Displaying Measurements
Using a Waterfall
Chapter 2
The Waterfall plot displays the vibration level in relation to the frequencies at
which the vibration occurs. It lets you view several measurements in relationship
to each other.
Set Up the Waterfall
1. Select Waterfall on the RUCD - Display Select screen and press F3
(Display).
The RUCD - Waterfall Setup screen appears.
2. Select the option and press the Right arrow to open a list of values.
3. Select or type in the parameter value.
4. Press the Left arrow to save your selection.
Use the descriptions in Waterfall Plot Parameters on page 31 to help you
configure the parameters.
5. When you are finished, press F3 (Display) to display the Waterfall plot.
See Display the Waterfall Plot on page 33.
Table 7 - Waterfall Plot Parameters
Parameter Name
Description
Values/Comments
Start Spd (RPM)
Sets the start speed of the recorded data for the plot.
10…3600 rpm
This defaults to the Start Spd value set in the RUCD Setup screen.
See Run Up/Coast Down Setup Parameters on page 18.
Stop Spd (RPM)
Sets the stop speed of the recorded data for the plot.
10…3600 rpm
This defaults to the Stop Spd value set in the RUCD Setup screen.
See Run Up/Coast Down Setup Parameters on page 18.
Rockwell Automation Publication 1441-UM006A-EN-P - May 2011
31
Chapter 2
Run Up/Coast Down Extension Module
Table 7 - Waterfall Plot Parameters
Parameter Name
Description
Values/Comments
Spacing
Controls the spacing between collected spectra:
Δ rpm
% Δ rpm
Δ Time
Δ rpm + Δ Time
% Δ rpm + Δ Time
• Δ rpm is a fixed speed change between spectra.
• % Δ rpm is a percentage speed change between spectra.
• Δ Time is a fixed time interval between spectra.
• Δ rpm + Δ Time is a combination of speed and time interval settings. If
speed stops changing then spectra are calculated using the Time Interval
value.
• % Δ rpm + Δ Time is a combination of speed and time interval settings.
If speed stops changing then spectra are calculated using the Time
Interval value.
Speed Interval (RPM) Sets the speed interval used in calculating FFT spectra.
Your selection affects the Speed Interval
and Time Interval settings.
1…240 rpm
This parameter not used when Spacing is set to Δ Time.
Time Interval (sec)
Sets the time interval used in calculating FFT spectra.
.001…604800 s
This parameter is not used when Spacing is set to Δ RPM and % Δ RPM.
Display Units
Sets the Y-axis units.
The available units depends on the transducer used to collect data.
See Run Up/Coast Down Setup Parameters on page 18.
Detection
Sets the signal detection and scaling display for the plot:
RMS
• Peak - Measured RMS value multiplied by the square root of two (1.4142). Peak
• Pk-Pk - Measured RMS value multiplied by two times the square root of
PkPk
two (2.8284).
• RMS - Root mean squared signal level of the input signal.
Lines
The number of lines (bins) of resolution for the FFT spectra. The larger the
number of lines, the better the frequency resolution of the measured data in the
spectra. Similarly, the higher the number of lines, the longer it takes to display
the spectra in the plot.
100
200
400
800
1600
3200
6400
12800
X-axis
Sets the x-axis frequency units for displaying spectra/FFT data:
• Hz - Displays spectra in Hertz, cycles per second.
• CPM - Displays spectra in cycles per minute.
• Orders - Displays spectra in orders of the operating speed.
Hz
CPM
Orders
Your selection affects the Freq Range and
LF Cutoff parameters.
Freq. Range (EU)
The maximum frequency for the measurement.
10…2000 Hz
The frequency range is determined by the X-axis parameter.
600…120000 CPM
.001…166 Orders
32
Rockwell Automation Publication 1441-UM006A-EN-P - May 2011
Run Up/Coast Down Extension Module
Chapter 2
Table 7 - Waterfall Plot Parameters
Parameter Name
Description
Values/Comments
LF Cutoff (EU)
Sets a low frequency cutoff filter to remove noise from the analysis.
Off
The available options are determined by the X-axis selection.
21.6 CPM
66 CPM
120 CPM
600 CPM
4200 CPM
.36 Hz
1.1 Hz
2 Hz
10 Hz
70 Hz
Display the Waterfall Plot
When you are finished setting up the plot parameters, you can process the
spectral data by pressing F3 (Display) on the RUCD - Waterfall Setup screen.
TIP
The larger the .wav file, the longer it takes to process the data
and display the plot.
Optimize the Waterfall Plot
Additional parameters display on the screen letting you to control how the
spectra appear in the waterfall plot.
1. Select the option and press the Right arrow to open a list of values.
2. Select or type in a parameter value.
3. Press the Left arrow to save your selection.
Use the descriptions in Waterfall Plot Setup Parameters on page 34 to help
you configure the parameters.
Rockwell Automation Publication 1441-UM006A-EN-P - May 2011
33
Chapter 2
Run Up/Coast Down Extension Module
4. When you are finished and ready to display the waterfall plot, press F3
(Display).
Table 8 - Waterfall Plot Setup Parameters
Parameter Name
Description
Values/Comments
Z-axis
Controls the spacing between the collected spectra.
RPM
• RPM- FFTs spaced depending on the rpm at which they were recorded.
• Timestamp- FFTs spaced depending on the time the data was recorded.
• Even Spacing- FFTs spaced evenly along the Z-axis.
No. Spectra
Controls the number of spectra to display on the waterfall plot. The spectra
are displayed as follows:
Timestamp
Even Spacing
2…60 spectra
• The first spectrum is always displayed.
• The last spectrum is always displayed.
• The other spectra (No. Spectra minus first and last spectrum) are evenly
distributed on the plot.
Trace Offset
0° (C)
Sets the angle of the Z-axis on the plot.
22.5° (C)
45° (C)
Trace Height
Controls the height of the spectra on the plot.
Small
Medium
Large
Disp. Order
Controls the order in which to display the spectra.
• Forward- Display spectra from oldest (front of the waterfall) to newest
(rear of the waterfall).
• Reverse- Display spectra from newest (front of the waterfall) to oldest
(rear of the waterfall).
Blanking
Eliminates the display of data below a certain level on the Y-axis. This setting
helps clarify the presence of machine orders or structural frequencies.
Forward
Reverse
0%…25%
View the Waterfall Plot
After setting up the Waterfall spectra, press F3 (Display) on the Waterfall Display
Setup screen.
At the bottom of the waterfall plot is a display area that indicates the active
spectrum, and provides information (number of spacing of spectra, speed) on
how the spectra are displayed in the waterfall plot.
TIP
If more than sixty spectra were collected, the ticks along the
line indicate which spectra were selected to be displayed.
See No. Spectra on page 34 for more information.
Cursor Movement
Use the Up and Down arrows to sequence through the displayed spectra. The
active spectrum displays in green. The zero positions of the X and Y-axis move to
34
Rockwell Automation Publication 1441-UM006A-EN-P - May 2011
Run Up/Coast Down Extension Module
Chapter 2
Frequency and
Magnitude at Cursor
Position
Speed
Speed, Time, or Data
Collection Number of
Rear Spectrum
Active Spectrum
Number and Spacing of Spectra
be relative to the active spectrum. Use the Left and Right arrows to move the
cursor on the active spectrum.
TIP
Press P to quickly move the cursor to the next significant peak.
Z-axis Zoom
The Z-axis zoom lets you to zoom in around the current trace. The display area
updates to indicate the number and position of the spectra displayed on the
screen. The zoom capability is only available when the No. Spectra parameter is
set to a number less than the number of extracted spectra.
See No. Spectra on page 34 for more information.
To use the Z-axis zoom feature, press 0 (Shift) and the +/- key. Repeat this key
sequence to continue zooming in. After the highest zoom level is reached, the
above procedure will cause you to zoom out.
TIP
There are more zoom levels available when there are fewer
spectra displayed in the plot.
Rockwell Automation Publication 1441-UM006A-EN-P - May 2011
35
Chapter 2
Run Up/Coast Down Extension Module
Displaying Measurements
Using a Spectrogram
The Spectrogram plot is a three-dimensional color intensity plot displaying the
amplitude of spectral components as a function of both time and frequency.
Typically the horizontal and vertical axes correspond to time and frequency. The
intensity corresponds to amplitude.
Set Up the Spectrogram Plot
Follow these instructions to setup the plot.
1. Select Spectrogram on the RUCD - Display Select screen and press F3
(Display).
The RUCD - Spectrogram Setup screen appears.
2. Select a parameter and press the Right arrow to open a list of parameters.
3. Select to type in a parameter value.
4. Press the Left arrow to save your selection.
Use the descriptions in Spectrogram Plot Parameter Descriptions on
page 37 to help you configure the parameters.
5. When you are finished, press F3 (Display) to display the Spectrogram plot.
See Display the Spectrogram Plot on page 38 for more information.
36
Rockwell Automation Publication 1441-UM006A-EN-P - May 2011
Run Up/Coast Down Extension Module
Chapter 2
Table 9 - Spectrogram Plot Parameter Descriptions
Parameter Name
Description
Values/Comments
Start Spd (RPM)
Sets the start speed of the recorded data for the plot.
10…3600 rpm
This defaults to the Start Spd value set in the RUCD Setup screen.
See Run Up/Coast Down Setup Parameters on page 18.
Stop Spd (RPM)
Sets the stop speed of the recorded data for the plot.
10…3600 rpm
This defaults to the Stop Spd value set in the RUCD Setup screen.
See Run Up/Coast Down Setup Parameters on page 18.
Spacing
Controls the spacing between collected spectra:
• Δ rpm is a fixed speed change between spectra.
• % Δ rpm is a percentage speed change between spectra.
• Δ Time is a fixed time interval between spectra.
• Δ rpm + Δ Time is a combination of speed and time interval settings. If
speed stops changing then spectra are calculated using the Time
Interval value.
• % Δ rpm + Δ Time is a combination of speed and time interval
settings. If speed stops changing then spectra are calculated using the
Time Interval value.
Speed Interval (RPM)
Sets the speed interval used in calculating FFT spectra.
Δ rpm
% Δ rpm
Δ Time
Δ rpm + Δ Time
% Δ rpm + Δ Time
Your selection affects the Speed Interval
and Time Interval settings.
1…240 rpm
This parameter not used when Spacing is set to Δ Time.
Time Interval (sec)
Sets the time interval used in calculating FFT spectra.
.001…604800 s
This parameter is not used when Spacing is set to Δ RPM and % Δ RPM.
Display Units
Sets the Y-axis units.
The available units depends on the transducer used to collect data.
See Run Up/Coast Down Setup Parameters on page 18.
Detection
Sets the signal detection and scaling display for the plot:
• Peak - Measured RMS value multiplied by the square root of two
(1.4142).
• Pk-Pk - Measured RMS value multiplied by two times the square root of
two (2.8284).
• RMS - Root mean squared signal level of the input signal.
Lines
RMS
Peak
PkPk
The number of lines (bins) of resolution for the FFT spectra. The larger the
number of lines, the better the frequency resolution of the measured data in
the spectra.
100
Similarly, the higher the number of lines, the longer it takes to display the
spectra in the plot.
400
200
800
1600
3200
6400
12800
X-axis
Sets the X-axis frequency units for displaying spectra/FFT data:
• Hz - Displays spectra in Hertz, cycles per second.
• CPM - Displays spectra in cycles per minute.
• Orders - Displays spectra in orders of the operating speed.
Rockwell Automation Publication 1441-UM006A-EN-P - May 2011
Hz
CPM
Orders
Your selection affects the Freq Range and
LF Cutoff parameters.
37
Chapter 2
Run Up/Coast Down Extension Module
Table 9 - Spectrogram Plot Parameter Descriptions
Parameter Name
Freq. Range (EU)
Description
Values/Comments
The maximum frequency for the measurement.
10…2000 Hz
The frequency range is determined by the X-axis parameter.
600…120000 CPM
.001…166 Orders
LF Cutoff (EU)
Sets a low frequency cutoff filter to remove noise from the analysis.
Off
The available options are determined by your X-axis selection.
21.6 CPM
66 CPM
120 CPM
600 CPM
4200 CPM
.36 Hz
1.1 Hz
2 Hz
10 Hz
70 Hz
Display the Spectrogram Plot
When you are done setting up the plot parameters, you can process the spectral
data by pressing F3 (Display) on the RUCD - Spectrogram Setup screen.
TIP
The larger the .wav file, the longer it takes to process the data
and display the plot.
Optimize the Spectrogram Plot
Additional parameters display on the screen letting you to control how the
spectra appear in the spectrogram plot.
1. Select a parameter and press the Right arrow to open a list of values.
2. Select or type in a parameter value.
3. Press the Left arrow to save your selection.
Use the descriptions in Spectrogram Plot Setup Parameters on page 39 to
help you configure the parameters.
4. When you are finished and ready to display data, press F3 (Display) to view
the Spectrogram.
38
Rockwell Automation Publication 1441-UM006A-EN-P - May 2011
Run Up/Coast Down Extension Module
Chapter 2
Table 10 - Spectrogram Plot Setup Parameters
Parameter Name
Description
Values/Comments
Y-axis
Sets the Y-axis scaling on the spectrogram plot:
Linear
• Linear - The plot grid centers are linearly spaced in Y between the
centers of the first and last grid.
• Log - The plot grid centers are logarithmically spaced in Y between the
centers of the first and last grid.
Z-axis
Controls the spacing between the collected spectra:
• RPM- FFTs spaced depending on the rpm at which they were recorded.
• Timestamp- FFTs spaced depending on the time the data was recorded.
• Even Spacing- FFTs spaced evenly along the Z-axis.
Blanking
Eliminates the display of data below a certain level on the Y-axis. This
setting helps clarify the presence of machine orders or structural
frequencies.
Log
RPM
Timestamp
Even Spacing
0%…25%
View the Spectrogram Plot
After setting up the Spectrogram spectra, press F3 (Display) on the Spectrogram
Display Setup screen.
Speed
Frequency and Magnitude
at the Cursor Position
Cursor
Amplitude Indicator at
Cursor Position
The Spectrogram plot uses color to indicate the amplitude of the signals. Red
means a higher amplitude and blue means a lower amplitude:
• Use the Up and Down arrows to sequence through the displayed spectra.
• Use the Left and Right arrows to move the cursor on the active spectrum.
TIP
Press P to quickly move the cursor to the next significant peak.
Rockwell Automation Publication 1441-UM006A-EN-P - May 2011
39
Chapter 2
Run Up/Coast Down Extension Module
Save Run Up/Coast Down
Measurements
The Run Up/Coast Down setup parameters and measurements can be saved to a
file which you can recall at a later time. The collected data is saved in the form of
a time waveform (.wav file).
You can save the RUCD setup and measurement anytime the Save function is
displayed on the screen.
Follow these steps to save a RUCD measurement.
1. Do one of the following:
• Press F3 (Save) if you are saving the data from the Setup screen.
• Press F4 (Save) if you are saving the recorded data from a plot screen.
The RUCD - Save Data screen appears.
2. Do one of the following:
• To save the data to an existing file, highlight the file, and press F4 (Save).
Press F2 (Yes) to overwrite the existing file. You can return to the Save
screen without overwriting the file by pressing F3 (No).
• To save the data to a new file, highlight save reading as and press F4
(Save). Enter a file name using the keypad or accept the default file
name (current date timestamp).
3. When the entry is complete, press F4 (OK).
IMPORTANT
The setup parameters are saved along with the measurement
when you press F4 (Save) on the RUCD - Save Data screen.
4. When you are finished, press F1 (Cancel).
40
Rockwell Automation Publication 1441-UM006A-EN-P - May 2011
Run Up/Coast Down Extension Module
Recall a Setup
Chapter 2
You can recall a previously saved setup and use it to collect another measurement.
The setup may have been saved only as a setup, or may have been saved with the
recorded data.
See Save Run Up/Coast Down Measurements on page 40 for more information.
Follow these steps to recall a setup.
1. Select RUCD on the Main Menu and press Enter.
The RUCD screen appears.
2. Select Recall and press Enter.
The RUCD - Load Setup screen appears.
Rockwell Automation Publication 1441-UM006A-EN-P - May 2011
41
Chapter 2
Run Up/Coast Down Extension Module
3. Select the filename that you want recall and press F3 (Open).
The RUCD - Setup screen appears.
You can edit the settings or start collecting data:
• For information on editing the settings, see Set Up Run Up/Coast
Down Measurements on page 17.
• For information on collecting RUCD measurements, see Collect Run
Up/Coast Down Measurements on page 19.
42
Rockwell Automation Publication 1441-UM006A-EN-P - May 2011
Run Up/Coast Down Extension Module
Review Run Up/Coast
Down Measurements
Chapter 2
You can review previously saved RUCD measurements with the Dynamix 2500
data collector. The instrument saves the recorded data in the form of a time
waveform (.wav file).
Follow these steps to review an RUCD measurement.
1. Select RUCD on the Main Menu and press Enter.
The RUCD screen appears.
2. Select Review Data and press Enter.
The RUCD - Review Data screen appears.
3. Select the filename that you want review and press F3 (Open).
If you select a .wav file, the RUCD - WAV Setup screen appears. Otherwise
the appropriate plot setup screen appears.
Rockwell Automation Publication 1441-UM006A-EN-P - May 2011
43
Chapter 2
Run Up/Coast Down Extension Module
The RUCD - WAV Setup screen lets you to setup the .wav file parameters.
TIP
The instrument reads the .wav file to determine the
maximum speed present. If the number of pulses per
revolution is not equal to 1, enter the correct value
before processing.
4. Select the parameter and press the Right arrow to open a list of values.
5. Select or type in a parameter value.
6. Press the Left arrow to save your selection.
Use the descriptions in WAV Setup Parameter Descriptions on page 44 to
help you configure the parameters.
7. When you are finished, press F3 (Start).
The Display Select screen appears letting you select the appropriate plot to
view the recorded time waveform.
Table 11 - WAV Setup Parameter Descriptions
Parameter Name
Description
Values/Comments
Max M/c Speed
The maximum machine speed in the .wav file.This parameter is set to the
highest detected m/c speed.
Mode
The method used in the .wav file to initiate data collection. When in doubt,
select manual:
• Runup - The data collection starts when the machine speed rises above
Start Spd.
• Coast down -The data collection starts when the machine speed falls
below Stop Spd.
• Manual - Manually start data collection by pressing F4 (Start). No
tachometer signal is required for this mode.
44
Runup
Coast down
Manual
Pulses/Rev
The number of tachometer signal pulses per revolution of the reference shaft. This value may affect the Max M/c Speed
value.
Start Spd (RPM)
The speed used in the .wav file to start collecting data.
Stop Spd (RPM)
The speed used in the .wav file to stop collecting data.
Rockwell Automation Publication 1441-UM006A-EN-P - May 2011
These parameters are not available if
Mode is set to Manual.
Run Up/Coast Down Extension Module
Chapter 2
Screen Capturing
Screens can be saved as a bitmap (.bmp) image to internal memory or to the
Secure Digital (SD) card. Press 0 (Shift) and 7 and follow the instructions.
Delete Run Up/Coast Down
Files
You can delete a RUCD measurement or setup from the Dynamix 2500 data
collector.
Follow these steps to delete a file.
1. Select RUCD on the Main Menu and press Enter.
The RUCD screen appears.
2. Select Review Data to delete a measurement or Recall Data to delete a
setup and press Enter.
The RUCD - Review Data screen appears.
3. Select the appropriate filename or select all to delete all the files.
Rockwell Automation Publication 1441-UM006A-EN-P - May 2011
45
Chapter 2
Run Up/Coast Down Extension Module
4. Press 0 (Shift) and F4 (Delete) to delete the selected files.
5. Press F2 (Yes) to delete.
46
Rockwell Automation Publication 1441-UM006A-EN-P - May 2011
Index
B
battery
status icons 13
battery status icons 13
Blanking 34, 39
Bode plot 22
Bode plot parameters
Detection 23
Display Units 23
LF Cutoff 23
Num Traces 24
Show Overall 24
Spacing 23
Speed Interval 23
Start Spd 23
Stop Spd 23
Time Interval 23
Trace Order 24
Y-axis 23
C
collecting data
run up/coast down measurements 17
configure
bode plot parameters 23
nyquist plot parameters 26
run up/coast down parameters 18
spectrogram plot parameters 37, 39
table parameters 28
waterfall plot parameters 31, 34
WAV setup parameters 44
D
Detection 23, 26, 29, 32, 37
Disp. Order 34
Display Units 23, 26, 29, 32, 37
E
Extension Manager 7
F
Freq Range 32, 38
I
install extension module 7
L
LF Cutoff 23, 26, 29, 33, 38
license
extension module 11
Lines 32, 37
M
manage extension modules 12
hide and show 12
Max Acq Time 19
Max M/c Speed 18, 44
Max No Orders 18
Mode 18, 44
N
No. Spectra 34
Num Traces 24, 26, 29
Nyquist plot 25
Nyquist plot parameters
Detection 26
Display Units 26
LF Cutoff 26
Num Traces 26
Spacing 26
Speed Interval 26
Start Spd 26
Stop Spd 26
Time Interval 26
Trace Order 26
P
Pulses/Rev 19, 44
R
Range 18
reviewing data
run up/coast down 43
RUCD - Bode Plot screen 24
RUCD - Bode Setup screen 22
RUCD - Display Select screen 21
RUCD - Nyquist Plot screen 27
RUCD - Review Data screen 43
RUCD - Spectrogram Plot screen 39
RUCD - Spectrogram Setup screen 36
RUCD - Table screen 30
RUCD - Table Setup screen 28
RUCD - Taking Data screen 20
RUCD - Waterfall screen 34
RUCD - Waterfall Setup screen 31
RUCD - WAV Setup screen 44
Run Up/Coast Down 15
Bode plot 22
Bode plot screen 24
collecting data 19
deleting data 45
Display Select screen 21
Nyquist plot 25
Nyquist plot screen 27
overview 15
recalling setup 41
Review Data screen 43
Rockwell Automation Publication 1441-UM006A-EN-P - May 2011
47
Index
reviewing data 43
save measurement 40
save setup 40
setting up 17
Setup screen 22
Spectrogram Disp. Setup screen 38
Spectrogram plot 36
Spectrogram plot screen 39
Spectrogram Setup screen 36
Table screen 30
Table Setup screen 28
Taking Data screen 20
Waterfall Disp. Setup screen 33
Waterfall plot 31
Waterfall plot screen 34
Waterfall Setup screen 31
WAV Setup screen 44
Run Up/Coast Down Setup parameters
Max Acq Time 19
Max M/c Speed 18
Max No Orders 18
Mode 18
Pulses/Rev 19
Range 18
Save To 19
Sens 18
Start Spd 19
Stop Spd 19
Transducer 18
S
Save To 19
Sens 18
Show Overall 24
Spacing 23, 26, 29, 32, 37
Spectrogram Disp. Setup screen 38
Spectrogram plot 36
Spectrogram plot parameters
Blanking 39
Detection 37
Display Units 37
Freq Range 38
LF Cutoff 38
Lines 37
Spacing 37
Speed Interval 37
Start Spd 37
Stop Spd 37
Time Interval 37
X-axis 37
Y-axis 39
Z-axis 39
Speed Interval 23, 26, 29, 32, 37
Start Spd 19, 23, 26, 28, 31, 37, 44
Stop Spd 19, 23, 26, 28, 31, 37, 44
Detection 29
Display Units 29
LF Cutoff 29
Num Traces 29
Spacing 29
Speed Interval 29
Start Spd 28
Stop Spd 28
Time Interval 29
Trace Order 29
Time Interval 23, 26, 29, 32, 37
Trace Height 34
Trace Offset 34
Trace Order 24, 26, 29
Transducer 18
U
uninstall extension module 9
W
Waterfall Disp. Setup screen 33
Waterfall plot 31
Waterfall plot parameters
Blanking 34
Detection 32
Disp. Order 34
Display Units 32
Freq Range 32
LF Cutoff 33
Lines 32
No. Spectra 34
Spacing 32
Speed Interval 32
Start Spd 31
Stop Spd 31
Time Interval 32
Trace Height 34
Trace Offset 34
X-axis 32
Z-axis 34
WAV setup parameters
Max M/c Speed 44
Mode 44
Pulses/Rev 44
Start Spd 44
Stop Spd 44
X
X-axis 32, 37
Y
Y-axis 23, 39
T
Table Format 28
Table parameters
48
Z
Z-axis 34, 39
Rockwell Automation Publication 1441-UM006A-EN-P - May 2011
Rockwell Automation Support
Rockwell Automation provides technical information on the Web to assist you in using its products.
At http://www.rockwellautomation.com/support/, you can find technical manuals, a knowledge base of FAQs, technical and
application notes, sample code and links to software service packs, and a MySupport feature that you can customize to make the
best use of these tools.
For an additional level of technical phone support for installation, configuration, and troubleshooting, we offer TechConnect
support programs. For more information, contact your local distributor or Rockwell Automation representative,
or visit http://www.rockwellautomation.com/support/.
Installation Assistance
If you experience a problem within the first 24 hours of installation, review the information that is contained in this manual.
You can contact Customer Support for initial help in getting your product up and running.
United States or Canada
1.440.646.3434
Outside United States or
Canada
Use the Worldwide Locator at http://www.rockwellautomation.com/support/americas/phone_en.html, or contact
your local Rockwell Automation representative.
New Product Satisfaction Return
Rockwell Automation tests all of its products to ensure that they are fully operational when shipped from the manufacturing facility.
However, if your product is not functioning and needs to be returned, follow these procedures.
United States
Contact your distributor. You must provide a Customer Support case number (call the phone number above to obtain
one) to your distributor to complete the return process.
Outside United States
Please contact your local Rockwell Automation representative for the return procedure.
Documentation Feedback
Your comments will help us serve your documentation needs better. If you have any suggestions on how to improve this document,
complete this form, publication RA-DU002, available at http://www.rockwellautomation.com/literature/.
Rockwell Otomasyon Ticaret A.Ş., Kar Plaza İş Merkezi E Blok Kat:6 34752 İçerenköy, İstanbul, Tel: +90 (216) 5698400
Publication 1441-UM006A-EN-P - May 2011 50
Copyright © 2011 Rockwell Automation, Inc. All rights reserved. Printed in the U.S.A.