1
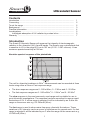
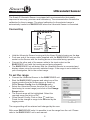
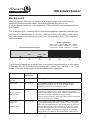
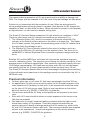
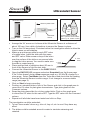
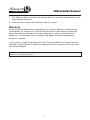
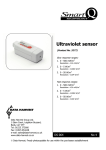
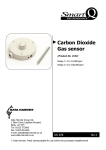
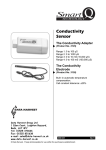
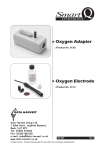
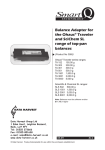
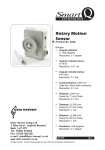
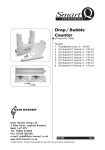
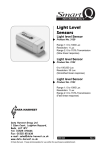
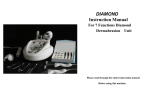
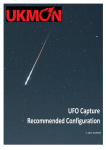
Smart
Q
TECHNOLOGY
Ultraviolet Sensor
(Product No. 3277)
EFR-105
Slow response ranges:
1. 500 mW/m2
Resolution: <0.4 mW/m2
2. 5 W/m2
Resolution: <0.004 W/m2
3. 50 W/m2
Resolution: <0.04 W/m2
Fast response ranges:
1. 500 mW/m2
Resolution: <0.4 mW/m2
2. 5 W/m2
Resolution: <0.004 W/m2
3. 50 W/m2
Resolution: <0.04 W/m2
DATA HARVEST
Data Harvest Group Ltd
1 Eden Court, Leighton Buzzard,
Beds, LU7 4FY
Tel: 01525 373666
Fax: 01525 851638
e-mail: [email protected]
www.data-harvest.co.uk
DS 064
© Data Harvest. Freely photocopiable for use within the purchasers establishment.
No 3
Smart
Q
Ultraviolet Sensor
TECHNOLOGY
Contents
Introduction . ....................................................................................................
Connecting.......................................................................................................
To set the range . .............................................................................................
Background......................................................................................................
Practical information ........................................................................................
Investigations ..................................................................................................
Investigate absorption of UV radiation by suntan lotion ............................
Warranty ........................................................................................................
1
2
2
3
4
5
5
7
Introduction
The Smart Q Ultraviolet Sensor will measure the intensity of electromagnetic
radiation in the ultraviolet (UV) A and B bands. The Sensor uses a photodiode that
is sensitive to UV in the range 215 nm to 387 nm (0.215 - 0.387 microns). It has
maximum spectral sensitivity at 300 nm.
Absolute spectral response of the photodiode
0.025
sensitivity (A/W)
0.020
0.015
0.010
0.005
0.000
200 220 240 260 280 300 320 340 360 380 400 420 440 460 480 500
wavelength (nm)
The unit for ultraviolet irradiance is W/m2. Measurements can be recorded at three
levels using either a Slow or Fast response range.
• The slow response ranges are 0 - 500 mW/m2, 0 - 5 W/m2 and 0 - 50 W/m2
• The fast response ranges are 0 - 500 mW/m2, 0 - 5 W/m2 and 0 - 50 W/m2
The slow response is the most commonly used range and is suitable for use in
most ultraviolet investigations. The response has been smoothed to remove rapid
fluctuations of UV. If a slow range is selected it will be indicated by an S after the
range on the sensor axis e.g. UV 5W/m2S (W/m2).
The fast range is used to show mains frequency ultraviolet fluctuations. These
variations in UV intensity can be a source of interference for general work. If a fast
range is selected it will be indicated by an F after the range on the sensor axis e.g.
UV 5W/m2F (W/m2).
Smart
Q
Ultraviolet Sensor
TECHNOLOGY
The Smart Q Ultraviolet Sensor is equipped with a microcontroller that greatly
improves its accuracy, precision and consistency. The microcontroller contains the
calibration for the six ranges. The stored calibration for the selected range is
automatically loaded into EASYSENSE when the Ultraviolet Sensor is connected.
POWER
SERIAL
DATA HARVEST
EASY SENSE
Connecting
ENTER
METER
STOP
A
1
2
5
4
3
B
6
Input socket
•
•
•
•
TECHNOLOGY
Smart
DATA HARVEST
Q
Sensor cable
with locating
arrows facing
upwards
Ultraviolet
Sensor
Hold the Ultraviolet Sensor housing with the Smart Q label showing on the top.
Push one end of the sensor cable (supplied with the EASYSENSE unit) into the socket on the Sensor with the locating arrow on the cable facing upwards.
Connect the other end of the sensor cable to the input socket on the EASYSENSE unit (with the locating arrow facing upwards).
The EASYSENSE unit will detect that the Ultraviolet Sensor is connected and display values using the currently selected range. If the range is not suitable for your investigation, set to the correct range.
To set the range
•
•
•
•
•
Connect the Ultraviolet Sensor to the EASYSENSE unit.
Start the EASYSENSE program and select one of the
logging modes from the Home page e.g. EasyLog.
Select Sensor Config from the Settings menu.
Select the Ultraviolet Sensor from the list (it will be
listed using its current range) and click on the Change
Range button.
The current range will be highlighted. Select the
required range and click on OK.
Close Sensor Config. Click on New
and then
Finish for the change in range to be detected by the
logging mode.
The range setting will be retained until changed by the user.
With some EASYSENSE units it is possible to set the range from the unit. Please
refer to the EASYSENSE unit’s user manual.
Smart
Q
Ultraviolet Sensor
TECHNOLOGY
Background
Electromagnetic radiation is a transfer of energy through space via waves of
oscillating electromagnetic fields. What distinguishes the parts of the
electromagnetic spectrum is the frequency of the oscillation and consequently the
wavelength.
The Ultraviolet (UV) radiation band in the electromagnetic spectrum extends from
the very short wavelengths of 100 nm to 400 nm, which is just above violet light in
the visible region of the spectrum (Latin word for beyond is ultra). True ultraviolet
light is invisible.
Visible Light Region
Violet ~ 400 - 450nm / Blue 450 - 500nm /
Green 500 - 570nm / Yellow 570 - 590nm /
Orange 590 - 610nm / Red 610 - ~ 700nm
Ultraviolet Radiation Region
UV-C
Nm
100
200
UV-B
UV-A
380
400
280 315
300
500
600
700
The Ultraviolet spectrum is divided into four smaller bands according to the nature
of the radiation. UV-A is closest in wavelength to visible light. Vacuum or UV-C are
closer to the soft X-ray region of the electromagnetic spectrum.
Wavelength
Vacuum UV
(far UV)
100 - 200 nm
The energy in this band can only be transmitted in vacuum.
UV-C band
200 - 280 nm
UV-C radiation from the sun would be harmful but it is
completely absorbed by the ozone in the Earth’s upper
atmosphere and does not reach the surface.
UV-B band
280 - 315 nm
UV-B radiation from the sun is partly absorbed in the Earth’s
atmosphere, mainly by ozone. Also called actinic radiation,
since the high photon energy of the radiation induces chemical
processes including changes in biological systems
(photo-biological systems), which can induce cancer. This band
is the primary danger to humans.
315 - 400 nm
UV-A penetrates the Earth’s atmosphere readily - 99% of the
ultraviolet that reaches the Earth’s surface is UV-A. In general
this is the least harmful band of UV but with high exposure can
cause reddening of the skin (sunburn). UV-A rays are longer
and able to penetrate the skin more deeply. More responsible
for premature ageing and wrinkling of the skin. Increasingly
being linked to eye damage and the formation of skin cancer.
Actinic radiation
‘Burning rays’
UV-A band
(near UV)
‘Tanning rays’
Smart
Q
Ultraviolet Sensor
TECHNOLOGY
The cancer inducing properties of UV are proportional to its ability to damage cell
DNA. The longer you are exposed to UV, the more likely that damage will take place.
Sunburn is not connected with the sensation of heat. When we are exposed to
strong sunlight passing through glass in a window (that absorbs UV-B), despite the
sensation of heat, our skin does not burn. When exposed to sunlight in cold weather
at high altitudes, our skin can burn despite feeling cold.
The Smart Q Ultraviolet Sensor measures UV light intensity as irradiance in W/m2.
There are other ways that UV intensity and exposure are measured. E.g.
1. The Ultraviolet Index (UVI), which is a measure of the solar ultraviolet (UV) intensity at the Earth’s surface relevant to the effect on human skin. The higher the UV index number, the greater the penetrating power of the UV radiation and the more likely the damage to skin.
2. The Effective UV Dose is directly related to the onset of sunburn and is an
integral of the Effective UV Intensity over the exposure time. The dose unit is called MED or Minimal Erythemal Dose (minimum erythemal dosage units per hour).
Both the UVI and the MED/hour units take into account the erythemal response
curve for reddening of skin. The response curve follows the varying sensitivity of the
average person to different wavelengths. Skin sensitivity decreases rapidly over the
UV-B range (approximately 100 times less sensitive every 20 nm) and decreases
less rapidly over the UV-A range (approximately half as sensitive every 20 nm).
The Smart Q Ultraviolet Sensor does not have wavelength weighting corresponding
to the erythemal action spectrum so the readings cannot be converted to the UVI or
MED/hour units.
Practical information
•
•
•
•
•
Ordinary glass can cut off some UV that has a wavelength less than 300 nm.
An appropriate UV light source would be within the UV-A band because it’s the least hazardous UV radiation to work with. A risk assessment should be made on the type of UV light source used. Refer to local regulations or the school advisory service (e.g. SSERC, CLEAPSS) for guidance.
Use a screen around the UV lamp so that pupils are not exposed to its direct rays.
Even with UV-A care should be taken to reduce exposure to the source to as little time as possible.
We made use of a small, hand-held battery powered ultraviolet light source, which emits mainly UV-A radiation. These are supplied commercially as
security devices to identify markings made with a UV marker e.g. such as the 6V mini UV Fluorescent lantern with torch. The one we purchased was supplied without a risk assessment - check local regulations or the school advisory
service (e.g. SSERC, CLEAPSS) for guidance.
Smart
Q
Ultraviolet Sensor
TECHNOLOGY
•
•
•
•
The output from an ultraviolet lamp is normally made visible by emitting some violet light - true ultraviolet is invisible.
Fluorescent lamps produce UV light by the emission of low-pressure mercury gas. Fluorescence occurs when UV is absorbed by a phosphorescent coating on the inside of the tube and re-emitted as visible light.
The sun is a source of UV. UV in sunlight can, in some cases, penetrate clouds, mist and fog. Fresh snow can reflect up to 85% of the sun’s rays.
Halogen bulbs or lamps, which are not UV protected by a plastic or glass shield, are another source of UV.
Investigations
Using the Slow range:
• Absorption of ultraviolet by different types of clothing (not related to colour)
• Whether the colour of clothing affects absorption of UV
• Investigate the UV protection provided by sunglasses
• Investigate absorption of UV radiation by suntan lotion
• Investigate how different material like plastic, glass (auto glass comparison), clothes, soft drinks, etc. absorb or reflect UV light
• Direct or diffuse solar radiation - a considerable amount of UV does not come directly from the sun but is scattered by the atmosphere
• Fluorescent rocks
• Fluorescent dyes from washing powders that absorb UV and then emit light
• Different light levels produce different UV levels
Using the Fast range:
• Variation of UV along a fluorescent tube compared to light output
Investigate absorption of UV radiation by suntan lotion
The sun protection factor (SPF) was developed to rate the general effectiveness of
sunscreens and lotions to block UV-B rays. (Historically UV-A was not seen as
damaging and the ability to block this section of the UV spectrum was not included).
SPF ratings numbers are determined by dividing 100 by the percentage of UV-B
rays transmitted through the sunscreen. For example, if a sunscreen blocks 95% of
UV-B then it is allowing 5% through. Divide 100 by 5 = 20 therefore the SPF of this
sunscreen is SPF 20. A sunscreen that blocks 97% of UV-B would have a rating of
30 (100 ÷ 3 = 33). The actual difference between the effectiveness of an SPF of 20
and an SPF of 30 is 2%.
For this activity you would need a UV source. We used a small battery powered UV
fluorescent lantern supplied as a security device for identifying markings made with
a UV marker.
Smart
Q
Ultraviolet Sensor
TECHNOLOGY
Ultraviolet Lamp
Glass or plastic slide
Suntan
Suntan
Oil
Suntan Oil
Oil
Plasticine
or Blu-Tak
•
•
•
•
•
•
•
•
•
•
Ultraviolet
Sensor
Suntan lotions of varying
SPF’s (use the same carrier
types e.g. oil, cream or milk)
Arrange the UV source so it shines at the Ultraviolet Sensor at a distance of about 100 mm. Use a blob of plasticine to secure the Sensor in place.
Turn on the UV lamp about 5 minutes before the investigation starts to allow the tube to warm up and stabilise.
Make up a microscope slide for each SPF value
of suntan lotion. Label the slide with the name
and SPF value. Either smear a drop of the lotion
2. Pull
over the surface of the slide or use second slide
back
to drag the lotion across. You need to make sure 1. Push
the slide is coated evenly.
forward
Place another blob of plasticine about 20 mm in
front of the Sensor to hold the test slide.
Connect the Ultraviolet Sensor to the EASYSENSE.
Open the EASYSENSE program and select Snapshot from the Home page. If the Y-Axis doesn’t show a slow response range e.g. 50 W/m2S, change to a slow range. Select Test Mode from the Tools menu and check that the reading from the Ultraviolet Sensor is within range. If not change to a more suitable range (see page 2).
Click on Start to begin recording.
Position an untreated slide in front of the Sensor and click in the graph area to record the UV value for plain glass transmission. Type plain glass into the
Comment column.
Swap the plain glass slide for a lotion-coated slide. Click on the graph area
to record the UV value for this value SPF. Type the SPF value into the Comment column.
Repeat until all slides have been tested and click on Stop.
The investigation could be extended:
1. To test ‘home made’ lotions e.g. olive oil, bay oil, etc. to see if they have any
effect.
2. The slides could be swished around in water to simulate swimming and
retested.
Smart
Q
Ultraviolet Sensor
TECHNOLOGY
3. The slides could be retested after several hours to see if the effectiveness of the lotion decays with time.
4. Does the lotion loose effectiveness if kept for a year?
Warranty
All Data Harvest Sensors are warranted to be free from defects in materials and
workmanship for a period of 12 months from the date of purchase provided they
have been used in accordance with any instructions, under normal laboratory
conditions. This warranty does not apply if the Sensor has been damaged by
accident or misuse.
In the event of a fault developing within the 12-month period, the Sensor must be
returned to Data Harvest for repair or replacement at no expense to the user other
than postal charges.
Note: Data Harvest products are designed for educational use and are not intended for use in industrial,
medical or commercial applications.