1
HiQ User
Manual
for Macintosh and Power Macintosh
Version 2.1
Copyright 1993, 1994 National Instruments Corporation.
All Rights Reserved.
Part Number 320734B-01
August 1994
National Instruments Corporate Headquarters
6504 Bridge Point Parkway
Austin, TX 78730-5039
(512) 794-0100
Technical support fax: (800) 328-2203
(512) 794-5678
Branch Offices:
Australia (03) 879 9422, Austria (0662) 435986, Belgium 02/757.00.20, Canada (Ontario) (519) 622-9310,
Canada (Québec) (514) 694-8521, Denmark 45 76 26 00, Finland (90) 527 2321, France (1) 48 14 24 24,
Germany 089/741 31 30, Italy 02/48301892, Japan (03) 3788-1921, Netherlands 03480-33466,
Norway 32-848400, Spain (91) 640 0085, Sweden 08-730 49 70, Switzerland 056/20 51 51, U.K. 0635 523545
Limited Warranty
The media on which you receive National Instruments software are warranted not to fail to execute programming
instructions, due to defects in materials and workmanship, for a period of 90 days from date of shipment, as
evidenced by receipts or other documentation. National Instruments will, at its option, repair or replace software
media that do not execute programming instructions if National Instruments receives notice of such defects during
the warranty period. National Instruments does not warrant that the operation of the software shall be
uninterrupted or error-free.
A Return Material Authorization (RMA) number must be obtained from the factory and clearly marked on the
outside of the package before any equipment will be accepted for warranty work. National Instruments will pay
the shipping costs of returning to the owner parts which are covered by warranty.
National Instruments believes that the information in this manual is accurate. The document has been carefully
reviewed for technical accuracy. In the event that technical or typographical errors exist, National Instruments
reserves the right to make changes to subsequent editions of this document without prior notice to holders of this
edition. The reader should consult National Instruments if errors are suspected. In no event shall National
Instruments be liable for any damages arising out of or related to this document or the information contained in it.
EXCEPT AS SPECIFIED HEREIN, NATIONAL INSTRUMENTS MAKES NO WARRANTIES, EXPRESS
OR IMPLIED, AND SPECIFICALLY DISCLAIMS ANY WARRANTY OF MERCHANTABILITY OR
FITNESS FOR A PARTICULAR PURPOSE. CUSTOMER’S RIGHT TO RECOVER DAMAGES CAUSED
BY FAULT OR NEGLIGENCE ON THE PART OF NATIONAL INSTRUMENTS SHALL BE LIMITED TO
THE AMOUNT THERETOFORE PAID BY THE CUSTOMER. NATIONAL INSTRUMENTS WILL NOT BE
LIABLE FOR DAMAGES RESULTING FROM LOSS OF DATA, PROFITS, USE OF PRODUCTS, OR
INCIDENTAL OR CONSEQUENTIAL DAMAGES, EVEN IF ADVISED OF THE POSSIBILITY THEREOF.
This limitation of the liability of National Instruments will apply regardless of the form of action, whether in
contract or tort, including negligence. Any action against National Instruments must be brought within one year
after the cause of action accrues. National Instruments shall not be liable for any delay in performance due to
causes beyond its reasonable control. The warranty provided herein does not cover damages, defects,
malfunctions, or service failures caused by owner’s failure to follow the National Instruments installation,
operation, or maintenance instructions; owner’s modification of the product; owner’s abuse, misuse, or negligent
acts; and power failure or surges, fire, flood, accident, actions of third parties, or other events outside reasonable
control.
Copyright
Under the copyright laws, this publication may not be reproduced or transmitted in any form, electronic or
mechanical, including photocopying, recording, storing in an information retrieval system, or translating, in whole
or in part, without the prior written consent of National Instruments Corporation.
Trademarks
HiQ is a trademark of National Instruments Corporation.
Product and company names listed are trademarks or trade names of their respective companies.
Warning Regarding Medical and Clinical Use
of National Instruments Products
National Instruments products are not designed with components and testing intended to ensure a level of reliability suitable for use in treatment and diagnosis of humans. Applications of National Instruments products
involving medical or clinical treatment can create a potential for accidental injury caused by product failure, or
by errors on the part of the user or application designer. Any use or application of National Instruments products
for or involving medical or clinical treatment must be performed by properly trained and qualified medical personnel, and all traditional medical safeguards, equipment, and procedures that are appropriate in the particular
situation to prevent serious injury or death should always continue to be used when National Instruments products are being used. National Instruments products are NOT intended to be a substitute for any form of established process, procedure, or equipment used to monitor or safeguard human health and safety in medical or
clinical treatment.
CO N T E N T S
About the HiQ User Manual ............................................xi
Manual Organization .............................................................xi
Where to Go from Here .........................................................xi
Notation Conventions ............................................................xii
Chapter 1
Introducing HiQ ....................................................................1-1
In the Beginning… ................................................................1-1
And Now… ............................................................................1-1
Chapter 2
Getting Started .......................................................................2-1
System Requirements ...........................................................2-1
Installation Procedure ............................................................2-1
Installing on a Power Macintosh ....................................2-2
Installing on a 680x0 Macintosh......................................2-2
HiQ Files.................................................................................2-3
Quick Start .............................................................................2-3
The Problem ....................................................................2-5
Data Fitting Problem Solver ...........................................2-5
Problem Solver Basics ....................................................2-7
Setting Up the Input Data ...............................................2-7
Output .............................................................................2-12
The Symbol List .............................................................2-12
Rerunning the Analysis ...................................................2-18
Printing ...........................................................................2-20
Summary ................................................................................2-21
Chapter 3
The Worksheet .......................................................................3-1
Launching and Quitting HiQ ............................................. 3-1
Symbols ........................................................................... 3-2
Worksheet Basics ............................................................. 3-3
Tool Palette ............................................................... 3-3
The Create Menu ....................................................... 3-5
The Solvers Menu ...................................................... 3-5
Symbols and the Worksheet ........................................ 3-5
National Instruments Corporation
v
HiQ User Manual
Contents
Multiple Pages ........................................................... 3-11
Creating Symbols with the Tool Palette ............................. 3-12
Annotating the Worksheet ................................................. 3-15
Text Annotation ......................................................... 3-16
Shape Annotation ....................................................... 3-18
Worksheet Preferences ..................................................... 3-21
The Symbol List ............................................................... 3-22
Cut, Copy, Paste, and Undo .............................................. 3-28
Managing Your Data ........................................................ 3-29
Memory Management ....................................................... 3-30
Printing ............................................................................ 3-30
Chapter 4
The Data Editor .....................................................................4-1
Invoking and Quitting the Data Editor ..................................4-1
The Data Editor Workspace ..................................................4-3
Data Types .............................................................................4-3
Navigation ..............................................................................4-4
Editing a Cell .........................................................................4-5
Selection Methods .................................................................4-5
Formats ..................................................................................4-6
Cut, Copy, and Paste ..............................................................4-8
Cursors ...................................................................................4-9
Saving Your Data ...................................................................4-10
Printing ...................................................................................4-10
Preferences .............................................................................4-10
Chapter 5
Problem Solvers .....................................................................5-1
Starting a Problem Solver ......................................................5-1
General Features ....................................................................5-2
Inputs ..............................................................................5-4
Options ............................................................................5-4
Outputs ............................................................................5-5
Printing ...........................................................................5-5
Problem Solver On-Line Help ...............................................5-5
Functions & Tables Menu .....................................................5-6
Preferences .............................................................................5-8
Expression Evaluation ...........................................................5-9
Define Inputs ..................................................................5-10
Data Elements .................................................................5-10
Outputs ............................................................................5-12
Nonlinear Systems .................................................................5-17
HiQ User Manual
vi
National Instruments Corporation
Contents
Sample Problem ..............................................................5-18
Inputs ..............................................................................5-19
Options ............................................................................5-20
Outputs ............................................................................5-20
Numerical Integration ............................................................5-22
Sample Problem ..............................................................5-22
Inputs ..............................................................................5-23
Options ............................................................................5-23
Output .............................................................................5-25
Polynomial Roots ...................................................................5-25
Sample Problem ..............................................................5-26
Inputs ..............................................................................5-26
Options ............................................................................5-26
Output .............................................................................5-27
General Roots ........................................................................5-28
Sample Problem ..............................................................5-29
Inputs ..............................................................................5-29
Options ............................................................................5-29
Output .............................................................................5-30
ODE Initial Value ..................................................................5-31
Sample Problem ..............................................................5-32
Inputs ..............................................................................5-33
Options ............................................................................5-33
Output .............................................................................5-34
ODE Boundary Value ............................................................5-38
Sample Problem ..............................................................5-39
Inputs ..............................................................................5-40
Output .............................................................................5-41
Integral Equations ..................................................................5-43
Sample Problem ..............................................................5-44
Inputs ..............................................................................5-45
Options ............................................................................5-46
Output .............................................................................5-46
Optimization ..........................................................................5-48
Sample Problem ..............................................................5-49
Inputs ..............................................................................5-49
Options ............................................................................5-50
Output .............................................................................5-50
Data Fitting ............................................................................5-51
Sample Problem ..............................................................5-53
Line Fit ............................................................................5-53
Polynomial Fit ................................................................5-55
Methods ..........................................................................5-57
National Instruments Corporation
vii
HiQ User Manual
Contents
Chapter 6
The Graph Editor .................................................................6-1
Entering and Exiting the Graph Editor .............................. 6-1
Graph Editor Symbols ...................................................... 6-2
Preparing a New 2D Graph ............................................... 6-2
Adding a 2D Plot .............................................................. 6-3
Function Plot ............................................................. 6-3
Data Plot ................................................................... 6-5
Parametric Curve ....................................................... 6-7
Setting Up the Graph's Axes .............................................. 6-9
Setting Graph Options ...................................................... 6-10
Modifying the Graph View ............................................... 6-11
Lines, Markers, and Color ................................................. 6-16
Plot Rendering ........................................................... 6-16
Curve Tracking ................................................................ 6-19
Preferences ...................................................................... 6-19
Preparing a New 3D Graph ............................................... 6-20
Adding a 3D Plot .............................................................. 6-20
Function Plot ............................................................. 6-20
Data Plot ................................................................... 6-21
Parametric Plot .......................................................... 6-23
Graph Rendering .............................................................. 6-24
More Modifications Of the Graph View ............................. 6-27
Lighting .................................................................... 6-28
Perspective ................................................................ 6-30
Contour ..................................................................... 6-31
Animation ........................................................................ 6-33
Printing ............................................................................ 6-36
HiQ-Script Access To the Graph Editor ............................ 6-37
A 2D Graph with HiQ-Script ............................................ 6-37
A 3D Graph with HiQ-Script ............................................ 6-38
Chapter 7
The HiQ-Script Language .................................................7-1
Script Editor ...........................................................................7-1
Notation Conventions ............................................................7-2
Data Types .............................................................................7-2
Automatic Typing ...........................................................7-3
Variable Names .....................................................................7-3
Scope Of Variables ................................................................7-4
Form .......................................................................................7-6
Comments ..............................................................................7-6
Operators ................................................................................7-6
Operator Precedence ..............................................................7-8
HiQ User Manual
viii
National Instruments Corporation
Contents
Statements ..............................................................................7-8
Matrices and Vectors .............................................................7-9
Matrix Arithmetic ...........................................................7-11
Conditional Execution Statements .........................................7-12
If ......................................................................................7-12
Select ...............................................................................7-12
Iteration Statements ...............................................................7-13
For ...................................................................................7-14
While ...............................................................................7-14
Repeat .............................................................................7-15
Block Escape Statements .......................................................7-15
Next .................................................................................7-15
Exit ..................................................................................7-16
Strings ....................................................................................7-17
Utility Built-InFunctions .......................................................7-17
Message ..........................................................................7-17
Warning ..........................................................................7-18
getString ..........................................................................7-18
getNumber ......................................................................7-19
Function Definition ................................................................7-20
Call By Reference ...........................................................7-21
Calling HiQ Built-InFunctions .......................................7-21
Using Function Names as Arguments ............................7-22
Language Constants ...............................................................7-23
HiQ-Script Keywords ............................................................7-24
Chapter 8
The Script Editor ..................................................................8-1
Entering and Exiting the Editor .............................................8-1
Text Entering and Editing ......................................................8-3
Script Format .........................................................................8-6
Compiler Buttons and Status Messages .................................8-7
Compiled Scripts ...................................................................8-7
Saving Your Work .................................................................8-8
Printing a Script .....................................................................8-8
Preferences .............................................................................8-8
Script Editor ....................................................................8-8
Execution ........................................................................8-8
An Example ...........................................................................8-9
National Instruments Corporation
ix
HiQ User Manual
Contents
Chapter 9
The Text Editor ......................................................................9-1
Entering and Exiting the Editor .............................................9-1
On-Page Text Editing ............................................................9-1
Editing Text in a Separate Window ........................................9-1
Text Entering and Editing.......................................................9-2
Chapter 10
Import/Export ........................................................................10-1
Importing a File .....................................................................10-1
Exporting a Symbol ...............................................................10-3
Preferences .............................................................................10-4
Appendix A
Customer Communication ................................................A-1
Index ...........................................................................................I-1
HiQ User Manual
x
National Instruments Corporation
A BOUT THE H iQ U SER M ANUAL
MA N U A L OR G A N I Z AT I O N
To properly address all of HiQ's capabilities, in a manageable book format, two volumes are used:
•
User Manual: shows how to install the program on your Macintosh and introduces HiQ concepts.
•
Reference Manual: a full reference to all of HiQ's built-in functions including a discussion of their algorithms.
You are currently browsing the HiQ User Manual whose contents are as follows:
•
About the HiQ User Manual — How to find what you need (You are now reading this section.)
•
Introducing HiQ — A general overview of HiQ
•
Getting Started — System hardware and software requirements, software installation, how to get help from
National Instruments, and a quick start section for people who don't like to read manuals
•
The Worksheet — A description of the unifying element of HiQ, which is used to organize and display data
•
The Data Editor — A description of the spreadsheet-like interface to matrices, vectors and scalar values
•
Problem Solvers — An introduction to the ten graphical interfaces that call upon many of HiQ's most complex
built-in functions
•
The Graph Editor— A description of HiQ's ability to graphically portray both functions and tabular data in twodimensional (2D) and three-dimensional (3D) graphs
•
The HiQ-Script Language — How to write scripts to automate many of HiQ's functions
•
The Script Editor — A description of HiQ's integrated script editor
•
The Text Editor — A description of HiQ’s text editor
•
Import/Export — An explanation of how to move data between HiQ and other applications
WH E R E
TO
GO
F RO M
HE R E
If you are a very experienced Macintosh user, have previously used a variety of analysis packages, and have
some experience as a programmer, turn to the Quick Start section of Chapter 2. Installation is easy, and once
you have seen some examples of the Worksheet, Problem Solvers, and the HiQ-Script language, you should
be ready to begin with little further assistance.
If you have used the Macintosh a little and are somewhat familiar with engineering analysis software, you
may wish to read through all of the Worksheet chapter (Chapter 3) to get the flavor of how HiQ organizes and
manipulates data. When you feel comfortable with the way things work, go through the Problem Solver,
Graph Editor, and HiQ-Script chapters.
If you haven't programmed extensively in high order languages such as FORTRAN, Pascal, or C, it would be
a good idea to read through the HiQ-Script chapter. The entire HiQ-Script language is described in detail, and
you'll find examples to help you along.
National Instruments Corporation
xi
HiQ User Manual
About This Manual
If you are unfamiliar with the Macintosh, reread the manual that came with your machine. Pay particular
attention to file and folder organization and methods of controlling screen behavior with the mouse.
NO TAT I O N CO N V E N T I O N S
Notes and graphics in the left column are meant to call your attention to points of interest.
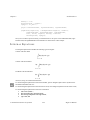
Examples of HiQ-Script code look like this:
function factorial(y)
x = y;
z = x;
while(x > 1)
x = x-1;
z = z*x;
end while;
return z;
end function;
Keywords are in bold. When HiQ-Script keywords such as while are referred to within text, they will be set in
the Courier typeface.
When you are asked to do something in tutorial sections, the required action is prefaced by a number and the
text will be set off in boldface.
!
The exclamation point marks a comment that will help you in using HiQ. It might be a time or space saving feature, or a warning. Associated text is in italics.
HiQ User Manual
xii
National Instruments Corporation
CHAPTER 1
I NTRODUCING H IQ
IN
THE
BE G I N N I N G …
Since the dawn of the computer era, engineers and scientists have been reliant upon the mainframe computer
to fulfill their numerical analysis requirements. They have been using large, unwieldy programs typically
written in FORTRAN by technical people such as themselves or outside groups of corporate programmers.
Where mathematical algorithms were needed, most such programs depended on either homegrown solutions,
public domain or commercial mathematical subroutine libraries which required extensive knowledge to integrate into the program and sometimes even to debug. Because most such in-house programs were developed
over time (often with minimal financial resources) by many different programmers, the resulting software
tended to be inflexible and poorly documented. The user interface normally consisted of a rich collection of
READ or INPUT statements, and output was funneled through fixed format numeric listings and inflexible
graphs. It was an unusual program indeed that provided for even marginally flexible input and output formatting.
AN D NO W …
HiQ is the next, natural, evolutionary step in the progression of analysis software, combining the computational power of mainframe programs with the personal computer’s intuitive human interface. In this one package you will find:
•
an analysis engine consisting of over 600 state-of-the-art mathematical and graphical functions,
•
a compiled scripting language which has been optimized to focus on the kind of work engineers and scientists
do and the way they do it,
•
script, data, and graphics editors which offer exceptional ability to manipulate HiQ’s underlying functionality,
and
•
a collection of Problem Solvers which offer intuitive access to many of HiQ’s most powerful mathematical
functions.
These powerful features are tied together by the Worksheet which provides a graphical means to organize and
present the input data, structure, and output data of a technical problem.
All components work together to provide an integrated environment that solves sophisticated problems from
National Instruments Corporation
1-1
HiQ User Manual
Introducing HiQ
Chapter 1
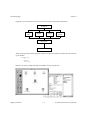
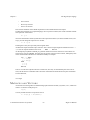
beginning to end. The hierarchy of how you will work with these components looks like this:
Worksheet
Numeric
Data
Graphs
Scripts
Problem
Solvers
HiQ-Script
Built-In Functions
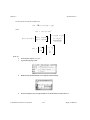
Where earlier-generation analysis programs might have “helped” you organize your data with a directory listing of variables,
$workspace
A
Radius
Velocity
HiQ lets you view the variables through a Worksheet as well as a Symbol List:
HiQ User Manual
1-2
National Instruments Corporation
Chapter 1
Introducing HiQ
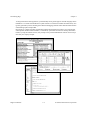
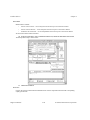
Where in the past you may have been forced to input data through a command line such as:
Input Radius Vector:
21934224., 2485939., 212445.
HiQ presents a spreadsheet-like data editor for your work:
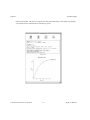
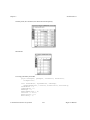
Traditional graphing methods may have required you to set up a graph using a script-like language:
Start3DGraph
Title (“Plot of sin(x)*cos(x)”)
AddPlot(sin(x)*cos(x),x->-3.14,3.14,y->-3.14,3.14)
Although HiQ’s script language allows you to build a graph from a script for automation purposes, you can
also use the Graph Editor, which is a fully interactive 2D and 3D graphics editor.
National Instruments Corporation
1-3
HiQ User Manual
Introducing HiQ
Chapter 1
To design and build a custom application, you traditionally need a general-purpose scientific language such as
FORTRAN or C and the documentation for a public domain or commercial scientific subroutine library. You
typically spend half your time decoding (and sometimes debugging) elements of the math subroutine libraries
and formatting input and output data.
HiQ-Script is a complete scientific programming language that eliminates the need for you to format input
and output data, dimensionalize variables, or construct any special data structures for tracking information.
Further, by using the Problem Solvers, many of HiQ’s most powerful mathematical routines can be incorporated into your script by example.
HiQ User Manual
1-4
National Instruments Corporation
Chapter 1
Introducing HiQ
Finally, the Worksheet, with which you organize your data and problem setup, is also capable of presenting
your complete analysis in both electronic and hard copy forms.
National Instruments Corporation
1-5
HiQ User Manual
CHAPTER 2
G E T T I N G S TA R T E D
This chapter leads you through getting HiQ up and running on your Macintosh. You will learn about the system requirements for HiQ and how to install HiQ on your computer. For those who don’t like to read manuals, we present a Quick Start section to get you started without having to read the rest of this manual.
SY S T E M RE Q U I R E M E N T S
This version of HiQ runs as a native application on both Power Macintosh and 680x0 Macintosh computers.
HiQ will run on any Power Macintosh computer. For 680x0 Macintosh computers, you must have a 68020 or
newer processor and a floating-point coprocessor.
!
68040 processors have a built-in coprocessor and can run HiQ; however, the 68LC040 processor has the built-in
coprocessor disabled and cannot run HiQ.
You also need at least 5 MB of RAM on your computer (8 MB recommended). HiQ also requires Macintosh
System 7 or newer. The relevant system requirements for HiQ are summarized as follows:
•
Power Macintosh or 680x0 Macintosh with floating-point coprocessor
•
At least 5 MB of RAM
•
System 7 or newer
IN S T A L L A T I O N PR O C E D U R E
All HiQ files are compressed in a self-extracting archive. To install HiQ 2.1 on your hard disk, perform the
following steps:
1. Insert the HiQ 2.1 Program Disk #1 into your disk drive.
2. Double-click on the HiQ 2.1 Program Installer icon and follow the instructions on the screen.
National Instruments Corporation
2-1
HiQ User Manual
Getting Started
Chapter 2
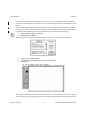
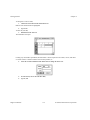
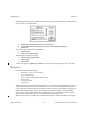
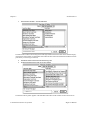
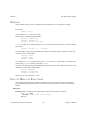
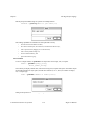
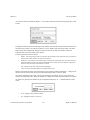
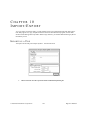
INSTAL LI N G ON A P OW ER M AC I N TOSH
If you are installing HiQ on a Power Macintosh, the following dialog box appears during the installation procedure:
You have three options to choose from:
•
680x0 - This option installs HiQ as a native 680x0 Macintosh application. Choose this option only if you have
purchased a multiple-user license for HiQ and your Power Macintosh is a server machine for other 680x0
machines. Do not choose this option if you plan to run HiQ from a Power Macintosh machine.
•
PowerPC - This option installs HiQ as a native Power Macintosh application. This is the preferred option for
Power Macintosh machines.
•
Universal - This option installs HiQ as a “Fat Binary” application that can run as a native application on either
a 680x0 or Power Macintosh machine. The “Fat Binary” includes code that is appropriate for both 680x0 and
Power Macintosh machines. This type of installation requires approximately twice as much disk space as the
processor specific options, but does not require any more memory to run. Choose this option only if you have
purchased a multiple-user license for HiQ and your Power Macintosh is a server machine for other 680x0 and
Power Macintosh machines.
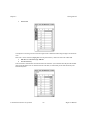
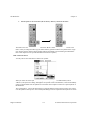
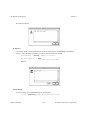
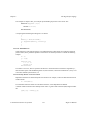
INST AL LI N G ON A 6 8 0 X 0 M A C I N TOSH
If you are installing HiQ on a 680x0 Macintosh, the following dialog box appears during the installation procedure:
HiQ User Manual
2-2
National Instruments Corporation
Chapter 2
Getting Started
You have three options to choose from:
•
680x0 - This option installs HiQ as a native 680x0 Macintosh application. This is the preferred option for 680x0
Macintosh machines.
•
PowerPC - This option installs HiQ as a native Power Macintosh application. Choose this option only if you
have purchased a multiple-user license for HiQ and your 680x0 Macintosh is a server machine for other Power
Macintosh machines. Do not choose this option if you plan to run HiQ from a 680x0 Macintosh machine.
•
Universal - This option installs HiQ as a “Fat Binary” application that can run as a native application on either a
680x0 or Power Macintosh machine. The “Fat Binary” includes code that is appropriate for both 680x0 and
Power Macintosh machines. This type of installation requires approximately twice as much disk space as the
processor specific options, but does not require any more memory to run. Choose this option only if you have
purchased a multiple-user license for HiQ and your 680x0 Macintosh is a server machine for other 680x0 and
Power Macintosh machines.
HI Q FI L E S
The HiQ 2.1 Program Installer creates a HiQ 2.1 folder on your hard disk. This folder contains the following items:
•
The HiQ 2.1 application
•
HiQ•Constants.68kMac - A text file containing useful HiQ-Script constants for 680x0 Macintosh
machines (See the Language Constants section in chapter 7, The HiQ-Script Language)
•
HiQ•Constants.PowerMac - A text file containing useful HiQ-Script constants for Power Macintosh
machines (See the Language Constants section in chapter 7, The HiQ-Script Language)
•
HiQ•Conversions - A text data file containing conversions used by the convertUnits built-in function (See
the convertUnits function in the Utility Functions chapter of the HiQ Reference Manual)
•
HiQ•Errors - The HiQ error file used by HiQ’s error reporting system
•
HiQ•Help - The HiQ help file used by HiQ’s on-line help system
•
HiQ Sample Worksheets - A folder containing a set of sample HiQ Worksheets
•
HiQ Sample Data Files - A folder containing a set of sample HiQ data files for use with some of the
sample HiQ Worksheets
QU I C K STA RT
This section is for those who don’t want to look at a user manual. You may wish to quickly browse the next
National Instruments Corporation
2-3
HiQ User Manual
Getting Started
Chapter 2
few pages, or to use HiQ first and then come back to pick up a concept that wasn't as clear as it should be.
If you haven't installed HiQ on your hard disk, do so now by following the procedures presented earlier in this
chapter.
We will use the Data Fitting Problem Solver to fit a curve through eleven years of rainfall data, modify the
resulting graph, build a script from the Problem Solver output, and finally arrange the data on the Worksheet
to explain the entire problem flow. Your part is indicated by the numbered steps in bolded type.
1.
2.
Open the folder in which you stored HiQ.
Double-click on the HiQ icon.
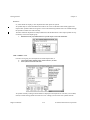
The first thing you will see is the standard file dialog box asking you to name your new Worksheet.
3.
4.
5.
Navigate to the destination folder,
Type the name of the Worksheet (we’ll use “First Problem”), and
Click on Save.
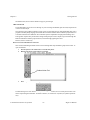
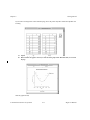
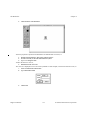
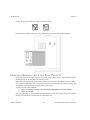
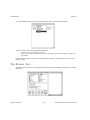
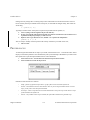
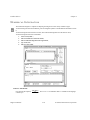
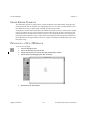
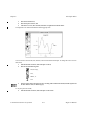
HiQ opens your Worksheet. The window shows part of an 8.5 by 11-inch page which can be used to organize
your data. The amount of working surface can be increased by using the Worksheet Size command under the
HiQ User Manual
2-4
National Instruments Corporation
Chapter 2
Getting Started
Worksheet menu, but for now the default one page is good enough.
T H E P ROBL EM
The problem before us is to fit a curve through 11 years of average rainfall data, plot the result, and present an
overview of the analysis.
One approach to the problem would be to create vectors incorporating the year and rainfall data, then write a
program in the HiQ-Script language to feed that data to a built-in function which would fit a polynomial curve
to the data and return the coefficients. We could then open the Graph Editor and graph the resulting curve.
This approach requires that you first learn enough of HiQ-Script to write a simple script, search through the
Reference Manual to find the proper function, and work through graphing the result.
However, there is a better way.
DATA F I T TI N G P ROB LE M S OLV E R
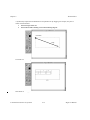
We’ll use the Data Fitting Problem Solver to lead us through data setup and build a graph of the results. To
open a Data Fitter:
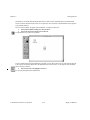
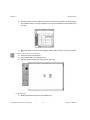
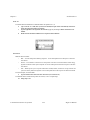
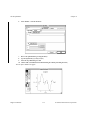
1.
2.
Move the pointer to the Problem Solver tool in the Tool palette.
Hold down the mouse button until the tool expands.
Problem Solver Tool
3.
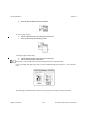
Move the pointer to the Data Fitting tool and release the button.
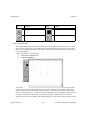
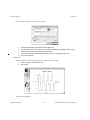
The Data Fitting tool is now selected. When you click in the Worksheet, an icon will be placed on the work
surface representing the Data Fitter. For future reference, we call the icon a Symbol (for symbol representation).
National Instruments Corporation
2-5
HiQ User Manual
Getting Started
Chapter 2
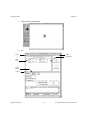
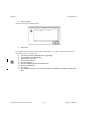
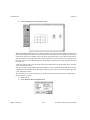
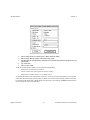
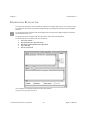
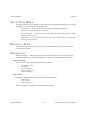
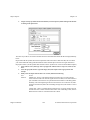
4.
Click somewhere on the Worksheet.
5.
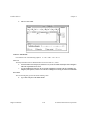
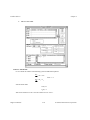
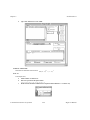
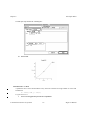
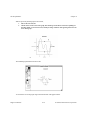
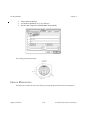
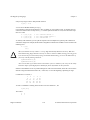
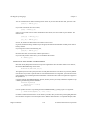
Double-click on the Symbol to open the Data Fitter.
Outputs
Run Button
Inputs
Data
Icon
Popup
Menu
Options
HiQ User Manual
2-6
National Instruments Corporation
Chapter 2
Getting Started
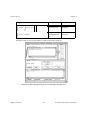
P RO B L E M S OLV E R BA S I C S
You can think of a Problem Solver as a specialized editor that collects inputs to powerful HiQ built-in functions, executes the functions, and organizes outputs according to your specifications. The Problem Solvers are
all similarly laid out: you specify inputs in the upper left corner and options in the bottom half, initiate the
execution by clicking on the run button (the right-facing arrow between Inputs and Outputs sections), and collect your results from the icons in the upper right.
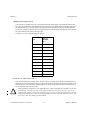
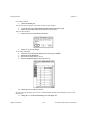
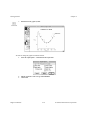
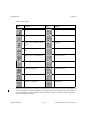
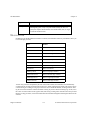
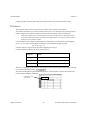
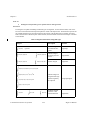
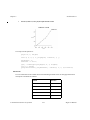
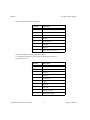
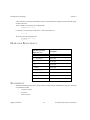
The data for our curve fitting problem is as follows:
Year
Average
Rainfall
(in.)
1980
16.5
1981
17.1
1982
15.4
1983
13.0
1984
12.9
1985
9.0
1986
7.6
1987
11.9
1988
15.4
1989
16.8
1990
15.3
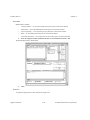
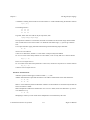
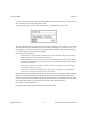
SE T T ING U P THE I N P U T DATA
We’ll enter the data in two column vectors. We have a choice of setting up the data from the Worksheet and
linking those vectors to the Problem Solver’s inputs or doing the whole thing from within the Problem Solver.
We’ll do the latter. The Data Fitter’s default input names (xVector0 and yVector0) aren’t very descriptive, so
we’ll change their names in the process.
!
Although dealing with Symbols on the HiQ Worksheet is similar to handling files and folders on the Macintosh desktop, you need to be aware of one important difference. In System 7, there are two ways of
changing a file’s name: you can either select the icon, press return on the keyboard, and edit, or you can
simply click within the file’s name. On the HiQ Worksheet, you must click on the Symbol to select it, then
press return. After that, editing proceeds normally.
National Instruments Corporation
2-7
HiQ User Manual
Getting Started
Chapter 2
To change the x vector’s name,
1.
Click on the xVector0 icon in the Data Points X box.
Both the icon and the name are highlighted.
2.
Type “Year”.
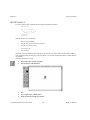
To enter the year data,
3.
Double-click on the Year icon.
The Data Editor will open.
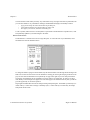
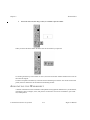
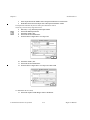
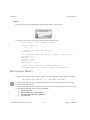
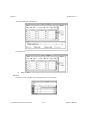
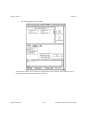
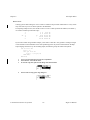
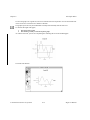
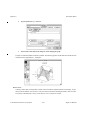
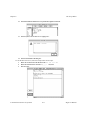
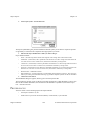
Looking very much like a spreadsheet, the Data Editor is used to input and view scalars, vectors, and matrices. We’ll need an 11-element column vector for this problem, so
4.
Select the Get Info command from the Matrix menu to change the matrix’s size.
5.
6.
Press the tab key once to select the Rows field,
Type 11, and
HiQ User Manual
2-8
National Instruments Corporation
Chapter 2
Getting Started
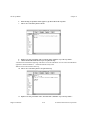
7.
Click on OK.
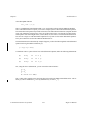
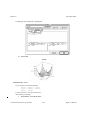
You may have to use the grow box in the lower right corner to make the window large enough to see all eleven
rows.
If the row 1 cell isn’t selected (highlighted as in the picture above), click in the cell. Enter 1980-1990.
1.
2.
With the row 1 cell selected, type 1980 and
Press the return key.
This action enters 1980 into the cell and selects the next cell down. (You could also have keyed in the number
then pressed the down arrow or clicked in the next cell down.) Continue this process until all eleven years
have been keyed in.
National Instruments Corporation
2-9
HiQ User Manual
Getting Started
Chapter 2
If you make a mistake,
1.
Click in the offending cell.
The contents of the cell appear in the edit area at the top of the window.
2.
3.
Correct the error using standard Macintosh editing methods in the edit area and
Click on the check mark to the left of the edit area (or press return).
When you have finished,
4.
Click on the close box at the left end of the title bar.
5.
Click on Yes to save your changes.
To set up the rainfall data,
6.
7.
8.
9.
Click on the yVector0 icon in the Measurements Y box and type “Rainfall”.
Double-click on the Rainfall icon.
Increase the size of the matrix to 11 rows.
Input the rainfall data using the same steps as for Year.
10. Click on the close box and save your data.
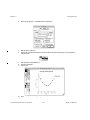
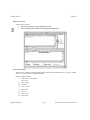
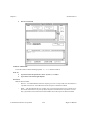
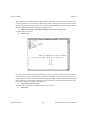
We want a polynomial degree 2 fit, so click on the Polynomial Fit button in the Estimation Type box in the
Options area.
11. Change the 1 to a 2 in the Polynomial Degree box in the Inputs area.
HiQ User Manual
2-10
National Instruments Corporation
Chapter 2
Getting Started
The Polynomial Fit routine requires a vector of weights of the same dimension as the input data. The Solver
automatically creates the weight0 vector to be of the proper dimension and sets all elements to 1. We’ll use
the default values for this example, but to be sure that the weight0 vector has been created,
1.
2.
Double-click on the weight0 icon in the Options area to check the weights.
When you have confirmed that all 11 cells are set to 1, click on the close box.
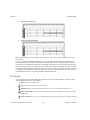
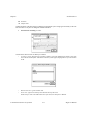
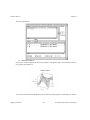
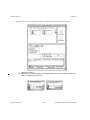
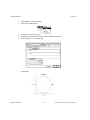
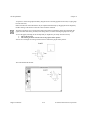
In addition to obtaining the equation’s coefficients, we also want to graph the results.
3.
If it is not checked already, click on the Graph option at the very bottom of the window (You may have to
scroll the window down to see the bottom).
With the Graph option selected, a Data Fit Plot Parameters box appears in the Options area. You have two
choices in your plotting:
•
Smooth Curve: plots the fitted curve using the specified number of data points and
•
Use Input Data: plots the fitted curve with the number of points in the input data.
Use a smooth curve with 256 points, which is the default.
4.
Press the run button.
National Instruments Corporation
2-11
HiQ User Manual
Getting Started
Chapter 2
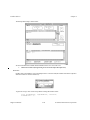
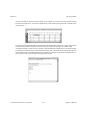
O UT P UT
So, where did all the output go? The output data have been placed in symbols.
All symbols may be viewed and edited in their editors: the vectors in the Data Editor and the graph in the
Graph Editor. Symbols which do not appear as icons in the Data Fitting Problem Solver are available through
the Symbol List which we’ll look at shortly.
The basic numerical output data is readily available from the Problem Solver. These output symbols are represented by icons in the Outputs group.
1.
Double-click on the polyCoefficients0 icon to open the output vector in the Data Editor.
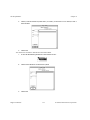
T H E SY M B OL LI S T
From here we’re going on to the Symbol List and the Graph Editor, so
2.
3.
Close the Data Editor and Data Fitter windows and save your data.
Select Symbol List from the File menu.
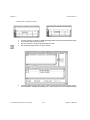
All symbols currently residing in the Worksheet are displayed in the Symbol List. From here you can delete,
rename, and edit existing symbols and create new ones. Though you will create some symbols from the
HiQ User Manual
2-12
National Instruments Corporation
Chapter 2
Getting Started
Worksheet as you did the Data Fitting Problem Solver, others will be created through script and Problem
Solver executions. With the Symbol List you can place the ones of interest on the Worksheet to help organize
your problem solutions.
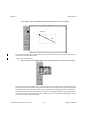
Since we want to display the graph on the Worksheet, we’ll place it there now.
4.
5.
Select polyFitGraph0 by clicking on its name in the list.
Click on the Place button and close the Symbol List.
The Worksheet now contains two Symbols:
The Tool palette at the left of the Worksheet is movable: you can drag it wherever you want with the drag bar
at the top. The Tool palette floats above the Worksheet and is always active; it only appears when the Worksheet is the active window.
6.
If the selection tool is not highlighted, click on it.
To open polyFitGraph0 in the Graph Editor,
National Instruments Corporation
2-13
HiQ User Manual
Getting Started
7.
Chapter 2
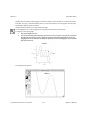
Double-click on the graph’s Symbol.
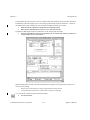
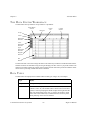
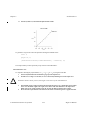
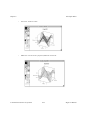
We need to change the graph’s axis labels and title.
1.
Select the Graph Options… command from the Graph menu.
2.
3.
Edit the graph title to read “Average Annual Rainfall.”
Click on OK.
HiQ User Manual
2-14
National Instruments Corporation
Chapter 2
Getting Started
4.
Select the Axis Options… command from the Graph menu.
5.
6.
Edit the title to read “Year”.
Click on the Axis menu and hold down the mouse button. When the menu pops up, move the pointer to
select the Y-Axis.
7.
8.
9.
Edit the title to read “Rainfall (in.)”.
Click on Vertical Title.
Click on OK.
10
Close the Graph Editor, saving changes.
National Instruments Corporation
2-15
HiQ User Manual
Getting Started
Chapter 2
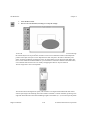
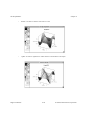
Now we’ll go back to the Worksheet and create a display of the year and rainfall data with the graph.
11.
12.
13.
14.
15.
Open the Symbol List.
Select Year and click on the Place button.
Select Rainfall and click on the Place button.
Close the Symbol List.
With the selection tool active drag the Symbols around until your Worksheet looks something like:
16. While holding down the option key, double-click on the Year Symbol.
17. Select Fit to Contents from the Worksheet menu (be sure the Year Symbol is selected as indicated by the
appearance of scroll bars and grab handles).
18. Repeat steps 16 and 17 with the Rainfall Symbol.
HiQ User Manual
2-16
National Instruments Corporation
Chapter 2
Getting Started
If you need to rearrange items on the Worksheet page, move the pointer anywhere within the expanded view
and drag.
19. Expand the graph by <option> double-clicking on its Symbol.
20. Resize and move the graph as necessary to make the entire graph visible. Remember that you can scroll
the page.
With the graph selected,
National Instruments Corporation
2-17
HiQ User Manual
Getting Started
Chapter 2
21. Select the Hide Name command from the Worksheet menu.
Our final task is to add a title at the top of the page.
22. Select the Text tool and drag out a rectangle near the top of the Worksheet. Don’t worry about the exact
size; we’ll change it later.
23. You’re already in insert mode, so type “Rainfall Analysis”.
24.
25.
26.
27.
28.
Choose Select All from the Edit menu
Change the font to something presentable (like 14 point Times) with the Font menu
Select Bold from the Style menu.
Click outside the text Symbol.
Place the text in an appropriate area at the top of the Worksheet. (You may have to change the size of the
bounding box.)
RE RUNN I N G THE A NA LY S I S
There is one final consideration before we leave this problem: what if this is preliminary data which is probably going to change? As it stands, to rerun the problem is simple enough: edit and save the data, then open the
Problem Solver and click on the run button. The graph will update after execution.
There is a slightly easier way, which conveniently also illustrates another use of the Problem Solver. We’ll
have the Data Fitter generate a HiQ-Script program which we can use to rerun the problem.
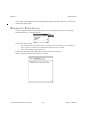
1.
2.
Double-click on the Problem Solver icon.
Select Save Script and deselect Execute.
3.
Click on the Run button.
Instead of the script results window, you will see the HiQ-Script program generated by the Data Fitter.
To prepare the script to be run independently of the Data Fitter,
HiQ User Manual
2-18
National Instruments Corporation
Chapter 2
Getting Started
4.
Click on Compile.
You’ll see a message proclaiming success.
5.
Click on OK.
The compiled script has been placed in a symbol called DataFit1_script_Run. To place this symbol on the
Worksheet for more convenient access:
6.
7.
8.
9.
10.
11.
12.
13.
14.
Close the script window and the Data Fitter, saving changes.
Select Symbol List from the File menu.
Select DataFit1_script1_Run.
Click on the Place button.
Close the Symbol List.
Move the compiled script icon below the Data Fitter.
Select the compiled script.
Press return.
Type “DoRainfall” (no space between the word Do and the word Rainfall) to change the compiled script’s
name.
National Instruments Corporation
2-19
HiQ User Manual
Getting Started
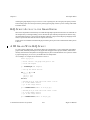
Chapter 2
The final setup looks like this:
Suppose you notice that the rainfall for 1986 doesn’t match your recollection of the weather that year. You
check the original data and find that the correct rainfall for 1986 was 17.6 inches, not 7.6! You can make the
change and rerun the analysis as follows.
15.
16.
17.
18.
19.
20.
Double-click on the Rainfall symbol to open it for editing.
Click on 7.6 in row 7.
Click to the left of the 7 in the edit area at the top
Type “1” and press return.
Close the window, saving the data.
Double-click on the DoRainfall Symbol.
The graph will be redrawn in place on the Worksheet.
P RINT IN G
To print the Worksheet,
1.
Select Print from the File menu.
HiQ User Manual
2-20
National Instruments Corporation
Chapter 2
Getting Started
SU M M A RY
In this simple rainfall analysis, you have seen:
•
the Worksheet and its Tool palette,
•
icon and expanded views of symbols on the Worksheet page,
•
Problem Solvers,
•
the Data Editor,
•
the Graph Editor,
•
the Symbol List,
•
Worksheet annotation, and
•
compiled scripts on the Worksheet page.
This example barely scratches the surface of HiQ’s power and flexibility. The remainder of this manual covers
the Worksheet, symbol editors and the HiQ-Script language. The Reference Manual covers the wide range of
mathematical and utility built-in functions.
National Instruments Corporation
2-21
HiQ User Manual
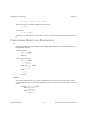
CHAPTER 3
THE WORKSHEET
The Worksheet provides a graphical and intuitive means of managing the wide range of HiQ’s functionality.
Worksheet
Numeric
Data
Graphs
Scripts
Problem
Solvers
HiQ-Script
Built-In Functions
You’ll start with a blank worksheet page. By adding icons representing numeric values, graphs, Problem
Solvers, compiled scripts and textual annotations, you can organize your data and problem solutions. By
expanding selected items to display their contents on the worksheet page, you can:
•
•
•
•
prepare a thorough record of your analysis for yourself and others,
develop an analysis road map for others to use,
create an interactive solution to use repeatedly, and
create a detailed report for publication in electronic and hard copy forms.
LAU N C H I N G
AND
QU I T T I N G H I Q
To launch HiQ, select its icon, then choose Open from the File menu. As a shortcut, you may simply double-click on the HiQ icon. If you wish to launch directly into a previously created Worksheet, double-click on
the icon of the Worksheet.
National Instruments Corporation
3-1
HiQ User Manual
The Worksheet
Chapter 3
Starting HiQ without specifying a document (Worksheet) will bring up the standard file save dialog box, asking you to name your new Worksheet.
1.
2.
3.
Navigate to the destination folder (in this case, “First Project”).
Type the name of the Worksheet (We’ll use “Project1” in the examples in this chapter).
Click on Save.
If you wish to open a previously-saved Worksheet,
4.
5.
Click on Cancel.
Select Open from the File menu.
When the Open File dialog box appears,
6.
7.
8.
Navigate to the appropriate folder.
Select your file.
Click on Open.
To exit the program, select Quit from the File menu. You will be given the opportunity to save your work.
SY M B O L S
In HiQ, data entities are called symbols:
•
•
•
•
•
•
•
numeric data—scalars, vectors, and matrices,
text—scripts and strings,
graphs—graphs and plots,
PICTs—pictures in standard Macintosh PICT format,
Problem Solvers,
Compiled scripts, and
User functions.
All these symbols are stored as part of the Worksheet. They are accessible through the Symbol List, and most
symbols may be placed directly on the Worksheet page in an icon view or in an uneditable expanded view.
Every symbol has a dedicated editor used to modify the symbol’s contents. The Graph Editor edits plots and
graphs; the Data Editor handles scalars, vectors and matrices; and the Script Editor creates and modifies
scripts. There is a separate Text Editor for text. Problem Solvers can be viewed as editors which organize
input and output data for many of the most complex mathematical built-in functions.
With certain exceptions, any symbol may be created and modified as a variable in the HiQ-Script language.
HiQ User Manual
3-2
National Instruments Corporation
Chapter 3
The Worksheet
The HiQ-Script chapter explains the relationship between symbols and variables.
As you work through this chapter, keep in mind that the Worksheet is HiQ’s focal point, where you organize,
manipulate, and present the symbols which form the solution to your problem.
WO R K S H E E T BA S I C S
The HiQ Worksheet is a standard Macintosh document file, easily identifiable by its desktop icon.
You can open up to eight Worksheets concurrently in one HiQ session. The Window menu lists all open windows, sorted by Worksheet name.
TO O L PA LE TT E
When you first start HiQ, you will be presented with an empty document window called the Worksheet. Off to
the left is a floating Tool palette used to create symbols and manipulate them on the Worksheet.
The Tool palette floats over the Worksheet window. You can move it as you would any other window by dragging the drag bar at the top. To remove the Tool palette, click on the close box at the left end of the drag bar.
The Show Palette command in the Worksheet menu resurrects a dismissed palette.
The Tool palette is always active; something happens whenever you click in it. (You don’t have to click once
to get the window’s attention, then click again to perform some action.)
To activate a tool, click on it once, then click anywhere on the Worksheet to place a new Symbol. After placing a Symbol on the Worksheet, the default selection tool will be activated. To create more than one Symbol,
double-click on the appropriate tool to lock it; you will then have to select another tool by clicking on it.
The active tool is highlighted. For example, when you first start HiQ, the selection tool (the arrow in the upper
left corner) is active. The second example below shows the matrix tool active:
Selection Tool Active
Matrix Tool Active
Many tools include a right-facing arrow to indicate that there is additional functionality associated with the
tool. For example, to create a matrix, you might want to set the type (integer, real, or complex) first.
1.
Click on the matrix tool and hold down the mouse button.
National Instruments Corporation
3-3
HiQ User Manual
The Worksheet
2.
Chapter 3
Slide the pointer to the second choice (the one that says “REAL”), and release the button.
The matrix tool is now selected and contains the word “REAL” which reflects your wish to create a real
matrix. Until you change the matrix type, all future matrices generated with the Tool palette will be of type
real. (See the sections called “Creating Symbols with the Tool Palette” and “Annotating Your Worksheet”
later in this chapter for more specific information about the Tool palette.)
T H E CR EAT E ME N U
You may also use the Create menu to make a new symbol.
When you select one of the symbol choices, HiQ creates a symbol, gives it a default name (such as
“Matrix1”) and opens it for editing. Although the new symbol will be in the database, it will not immediately
appear on the Worksheet. See the Symbol List section later in this chapter to learn how to place Symbols on
the Worksheet.
The Create Symbol… item in this menu brings up a separate dialog box from which you have more control
over the Symbol creation process. The Create Symbol dialog box is also explained in the Symbol List section.
HiQ User Manual
3-4
National Instruments Corporation
Chapter 3
The Worksheet
T H E SO LV E R S ME N U
The Problem Solvers and the Script Editor are listed in the Solvers menu.
SYM B O L S A N D T HE WOR KS HEE T
To help you visualize how you can use the Worksheet to organize and manipulate your data and problem solutions, we will create a simple problem flow which includes an input vector, a HiQ-Script to process the data,
and an output vector.
You will read about the Data Editor and Script Editor briefly in this section. For more detail, see those chapters later in this manual.
To begin, we will create an integer vector named A.
1.
Click on the column vector tool.
National Instruments Corporation
3-5
HiQ User Manual
The Worksheet
2.
Chapter 3
Click somewhere on the Worksheet.
You have just placed a symbol on the Worksheet. The default name is incorrect, so
3.
4.
5.
With the selection tool active, click on the Symbol to select it.
Press the return key to select the name under the Symbol.
Type “A” to change its name.
To fill in the values in vector A,
6.
Double-click on the vector icon.
The vector A is displayed as a two-cell vector by default. For this example, we need a five element vector, so
7.
8.
Select Get Info from the Matrix menu.
Type 5 into the Rows field.
9.
Click on OK.
HiQ User Manual
3-6
National Instruments Corporation
Chapter 3
The Worksheet
10. Click in the top cell of A, press 1 and the return key to set A[1] equal to 1 and make row 2 the selected cell.
Press 2 and the return key to set A[2] to 2 and move on to cell 3. Proceed until the vector looks like the picture below.
11. Click on the window’s close box. An alert will appear asking whether you wish to save the vector. Click on
Yes.
To make a simple script to process the data,
12. Click on the Script tool in the palette.
13. Click on the Worksheet to the right of vector A.
14. With the script icon selected, press return and type “TestScript.”
To edit TestScript,
15. Double-click on the TestScript icon to open a blank script.
National Instruments Corporation
3-7
HiQ User Manual
The Worksheet
Chapter 3
16. Type the following script, which creates a vector containing the squares of the values in A:
for i=1 to 5 do
B[i] = A[i]^2;
end for;
Don’t forget the semicolons at the end of lines two and three.
17. Click on the Run button.
18. Click on the TestScript window’s close box. An alert will appear asking whether you wish to save the
script. Click on Yes.
To complete our visual problem setup, we will place a Symbol representing the output vector B on the Worksheet page.
19. Select Symbol List… from the File menu.
HiQ User Manual
3-8
National Instruments Corporation
Chapter 3
The Worksheet
If your Worksheet has been used for nothing but this example, the Symbol List looks like this:
See “The Symbol List” later in this chapter for a full description.
20. Select B in the list of symbols.
21. Click on the Place button.
22. Close the Symbol List.
Your Worksheet should now contain three icons representing the input and output vectors and the script. Since
they may not be in the positions you would like, you may drag them about with the mouse.
23. If the selection tool is not selected, click on it.
24. Click on an icon you wish to move and (while holding down the mouse button) drag it to the desired location.
You may also cut, copy, and paste Symbols using commands in the Edit menu. As in the example above, you
may rename a Symbol on the Worksheet page by editing the name appearing below the icon.
There are two ways to view a symbol on the Worksheet page:
•
•
icon view,
expanded view—a snapshot view of the data in the symbol
To display a Symbol in expanded view, select the Symbol, then select Expanded View from the Worksheet
menu (or <option>-double-click on the Symbol). To return to icon view, select Icon View. You may also
<option>-double-click on the Symbol to toggle back and forth between the icon and expanded views. Let’s try
it:
1.
2.
Move the script TestScript and vector B icons off to the right a bit to make some room.
Select the vector A symbol.
National Instruments Corporation
3-9
HiQ User Manual
The Worksheet
3.
Chapter 3
Select Expanded View from the Worksheet menu.
With the expanded Symbol selected, notice the grow handles at the corners and sides and the scroll bars along
the bottom and right side. With the corner grow handles you can change the size in both horizontal and vertical directions; with the grow handles in the center of the left and right sides, you can adjust the size horizontally; and with the grow handles in the center of the top and bottom, you can adjust the size vertically. Scroll
bars work as they do in any Macintosh window. Deselecting the Symbol removes the grow handles and scroll
bars from view.
To hide the symbol’s name, select the Symbol, then choose Hide Name from the Worksheet menu. The Show
Name command puts it back.
You can bypass the manual method of sizing the window to view its contents by selecting the Fit to Contents
command from the Worksheet menu. The Symbol will be resized to show all its contents with the upper left
corner anchored in position.
The expanded view of A in the picture above is enclosed by a frame. You have the option of modifying that
frame or deleting it entirely.
1.
2.
Select vector A.
Select Adornment from the Worksheet menu.
HiQ User Manual
3-10
National Instruments Corporation
Chapter 3
The Worksheet
Click on whichever items strike your fancy. Any combination of top, left, right, and bottom is permissible, and
you can add a shadow to any combination. Rectangle and Rounded Rect(angle) are mutually exclusive.
•
•
•
Apply puts the changes into effect without dismissing the dialog box,
Cancel dismisses the dialog box without making any changes, and
Done applies your selections, then dismisses the dialog box.
To edit a symbol, double-click on it. If the Symbol is represented on the Worksheet in expanded view, it will
be dynamically updated as you make changes in the editor.
M ULT IP L E PAGE S
The Worksheet is a window-sized view of a large data space. To control the size of your Worksheet, select
Worksheet Size from the Worksheet menu.
To change the number of pages in the Worksheet, key the desired numbers into the Pages Wide and Pages Tall
fields. You can also use the mouse to size the Worksheet. Clicking just to the right of the page indicator in the
grey box will cause the Worksheet to be expanded by one page to the right. If you now click just below the
second page, the Worksheet will be expanded to two pages wide by two pages high. To return to one page,
click directly on the rectangle at the upper left corner. If the pages to be excised contain any data, you will be
given the opportunity to cancel the operation.
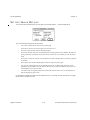
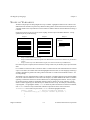
Page height and width reflect the current setting in the Page Setup dialog box. The default is portrait style, 8.5
inches wide by 11 inches tall. To change to landscape style (11 inches wide by 8.5 inches tall), select Page
Setup under the File menu.
National Instruments Corporation
3-11
HiQ User Manual
The Worksheet
Chapter 3
Click on the appropriate button for portrait or landscape format.
Portrait
Landscape
If the Worksheet contains more than one page, dashed lines are drawn to indicate page boundaries.
CR E AT I N G SY M B O L S
WITH THE
TO O L PA L E T T E
In this section you will learn how to use the script, scalar, vector, matrix, graphics, and Problem Solver tools.
Annotation tools will be described in the following section.
Many of the tools in this group expand to allow choice of type (notice the little right-facing arrows). Whichever type (for example integer, real, or complex for a vector) is selected becomes the default for that tool. (See
Tool palette in the Worksheet Basics section earlier in this chapter.)
To place a Symbol on the Worksheet:
1.
2.
Select a tool (changing type if necessary by moving the pointer until the correct tool is selected).
Click in the Worksheet.
After every placement of a Symbol on the Worksheet, the tool selection reverts to the selection tool. Double-clicking on a tool locks the selection until you select another tool.
HiQ User Manual
3-12
National Instruments Corporation
Chapter 3
The Worksheet
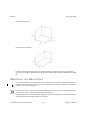
A Symbol may be placed on the Worksheet in its expanded view by dragging. For example, let’s place a
matrix on the Worksheet:
3.
4.
Select the Integer Matrix tool.
Click on the Worksheet and drag as shown in the following diagram:
Click here
Drag
The result is a matrix in expanded view:
If the border is too large, select Fit to Contents from the Worksheet menu.
National Instruments Corporation
3-13
HiQ User Manual
The Worksheet
Chapter 3
A table of tools follows.
Tool
Symbol
Tool
Symbol
HiQ-Script
Polynomial Roots
Integer, real, or complex scalar
Nonlinear Systems
Integer, real, or complex column
vector
Integrator
Integer, real, or complex row vector
General Roots
Integer, real, or complex matrix
ODE Initial Value
2-dimensional graph
ODE Boundary Value
3-dimensional graph
Integral Equations
Image (PICT)
Data Fitting
Expression Evaluation
Optimization
All the tools that expand (the ones with the small triangle) are tear-off tools. By clicking on and dragging the
tool, the expanded tool choices will be drawn in a window which floats over the Worksheet. For example, if
you were planning on creating a number of matrices of different types, it would be convenient to have the
matrix tool available at all times.
HiQ User Manual
3-14
National Instruments Corporation
Chapter 3
The Worksheet
5.
Click on the matrix tool, then drag to where you would like to place the window.
When you release the mouse button the matrix tool will be left where you placed it.
Use the drag bar at the top of the window to move it, and close the window with the standard close box at the
left end of the drag bar.
The main Tool palette will reflect any selections made in the floating tool window. You can still use the main
palette; selections made there will be reflected in the floating window.
AN N O TAT I N G
THE
WO R K S H E E T
A number of annotation tools are available to add explanations and graphical clarifications to your Worksheet,
including text, lines, rectangles, circles, and pictures. You also have control over line thickness, pen orientation, and fill pattern.
National Instruments Corporation
3-15
HiQ User Manual
The Worksheet
Chapter 3
Tool
Symbol
Tool
Symbol
Text annotation
Pattern
Shape
Line weight
T E XT A N N OTATI ON
Text in HiQ is manipulated with text symbols and is placed on the Worksheet with Symbols. As you learn
how to use text in this section, keep in mind that behind each element of text on the page is a text symbol
which can be manipulated just like any other symbol: it appears in the Symbol List and is not deleted when
cut from the Worksheet.
To add text annotation to your Worksheet,
1.
2.
Click on the text annotation tool.
Click on the Worksheet.
A text symbol is placed on the Worksheet ready for editing. Text is treated slightly differently from other
symbols, since it is much more likely that they will be used in expanded form. By default a text Symbol
appears in expanded form with neither a border nor a name. You can always add a border or the Symbol’s
name by selecting Adornment… or Show Name from the Worksheet menu. As with other symbol types, you
can place a text Symbol of a desired size on the page by dragging as explained earlier in this section.
Text may be entered into the confines of the Symbol as though you were working in the Text Editor (see the
HiQ User Manual
3-16
National Instruments Corporation
Chapter 3
The Worksheet
chapter by that name). Text will be wrapped at the edge, and scroll bars will appear if the text goes below its
lower border.
3.
Type the following (or anything else that is a couple of lines long).
You can change the size of the Symbol by dragging the grow handles around its periphery.
Change height
Change width
Change both height and width
from upper right corner
Drag entire symbol to another location
The text wraps to the width of the open symbol.
While editing text, two new choices appear in the menu bar: Font and Style. Other Worksheet menus are also
active.
To exit the input mode and save your data,
National Instruments Corporation
3-17
HiQ User Manual
The Worksheet
4.
Chapter 3
Click anywhere on the Worksheet (including on another Symbol).
If you click in another window while in edit mode, then return to the text, you will still be in edit mode.
To edit existing text, select the Text tool from the Tool palette and click on the text Symbol. As soon as the
Symbol is selected you may edit it in the standard Macintosh manner.
Should you wish to edit the text in a separate window, double-click on the Symbol just as you would with any
other symbol type (see the Text Editor chapter).
Although by default there is neither a border nor a name visible,
5.
6.
To add a border, be sure you’re not in edit mode, then select the Symbol and select Adornment from the
Worksheet menu. Choose a border type and click on Done.
To show the text Symbol’s name, select the text and select Show Name from the Worksheet menu.
SH AP E A N N OTAT I ON
HiQ also provides a set of shapes for annotation, including lines, arrows, rectangles, rounded rectangles, and
ovals.
We’ll draw a couple of objects on the Worksheet.
1.
Click on the shape tool (hold the mouse button down long enough for the menu of shape choices to
appear.
2.
3.
Select the open rectangle tool.
Click on the Worksheet and drag. An expanding box with the original point and the current pointer loca-
HiQ User Manual
3-18
National Instruments Corporation
Chapter 3
The Worksheet
tion as opposite corners will form. Release the mouse button to fix the size of the rectangle.
Click here
Drag
You can adjust the size and move the rectangle just as you did with the text in the previous section. Next we
will create an oval filled with a pattern.
Change the current fill pattern,
4.
Click on the pattern tool. (Hold the mouse button down long enough for the Pattern palette to appear.)
The Pattern tool is a tear-off palette. You can use it the normal way by clicking on the tool, then moving the
pointer to the desired pattern and releasing the mouse button. If you will be repeatedly performing this chore,
it might be handier to have the pattern choices always available. To tear off the palette, click on the pattern
tool, and drag to wherever you wish to place it. An empty box will follow the pointer to let you gauge the size.
Clicking on a pattern will cause the pattern tool to reflect your choice. To delete the floating palette, click on
the close box at the left end of the drag bar.
National Instruments Corporation
3-19
HiQ User Manual
The Worksheet
1.
2.
Chapter 3
Select the filled oval tool.
Place an oval on the Worksheet, then drag it to overlap the rectangle.
To move the oval behind the rectangle, select Move to Back from the Worksheet menu. Move to Front brings
the selected object to the top of the stack, and Move Closer to Front and Move Further to Back adjust the
position of the object one layer at a time. HiQ tracks the stack of objects in the order in which they were
drawn. Consider a Worksheet containing five items, of which number one was drawn first and number five
last. To move number five behind number two, you would have to select Move Further to Back three times,
even if numbers three and four were not visually overlapping the other two objects of interest.
The line weight tool is also a tear-off palette.
The selections down the diagonal are square, which result in a rectangle with both horizontal and vertical
sides of equal weight. The remaining choices have either a horizontal or vertical orientation, producing a rectangle with horizontal and vertical sides of differing weights. The numbers (N…5) across the top of the palette
HiQ User Manual
3-20
National Instruments Corporation
Chapter 3
The Worksheet
refer to a line of zero height and increasing width. Similar numbers along the left side refer to a line of zero
width and increasing height.
WO R K S H E E T P R E F E R E N C E S
There is a complete preferences facility which allows you to tailor the program to your way of working.
Select Preferences for… from the File menu:
You have two choices in where to apply your preferences:
•
•
HiQ: sets new defaults for the program. Your new preferences will be active whenever you relaunch HiQ, or
open or create a new worksheet. The new defaults will not affect the current worksheet.
Project: sets the defaults for this Worksheet only.
In either case, new settings will not take effect in editors which are currently open.
When you first open the Preferences window, you will see:
National Instruments Corporation
3-21
HiQ User Manual
The Worksheet
Chapter 3
To see the Worksheet preferences, activate the Subject pull-down menu and select Worksheet.
You have control over the following Worksheet attributes:
•
•
Worksheet size: pages tall and pages wide; and
printing options: option to display document name in the heading, a date and time heading, page border, and
page numbers.
Using the subject menu, you may peruse and modify other preferences. New defaults are active as soon as
they are selected.
TH E SY M B O L LI S T
The Symbol List presents a list of all symbols currently stored in the Worksheet and contains tools to manipulate them.
HiQ User Manual
3-22
National Instruments Corporation
Chapter 3
The Worksheet
There are three areas in the Symbol List window:
•
•
•
Display control,
Scrolling list of symbols, and
Control buttons.
When you first start HiQ the Symbol List will look as it does above, with all display options checked and no
symbols in the list area.
By using the checkboxes in the Show Types group, you can control the contents of the Symbol List. As you
begin to use HiQ, the Symbol List will become extensive, and you will make use of the check boxes to filter
out those symbols of less interest.
To easily get to one end of the spectrum or the other, click on All or None.
The Show Other group provides a means of further filtering the choices you have made in the Show Types
group. If, for example, you have checked Scalar and Vector and choose Script Results, only those scalars and
vectors modified since the start of the most recent script execution would be listed. Deselecting (clicking on
the checkbox a second time) Script Results returns the list to its previous state of including all scalars and vectors in the Worksheet.
•
•
•
Script Results—includes only symbols modified since the start of the most recent script execution.
Invalid Script Variable Names—includes symbols with names that may not be used in HiQ-Scripts (See “Variable Names” in the HiQ-Script chapter).
Name contains:—includes symbols whose name contains the specified string. To edit the search string, click on
Name Contains.
To create a new symbol, click on the New button. The Create Symbol dialog box will be presented as below:
Click on the item you wish to create and type a name. Legal symbol names start with an alphabetic character
National Instruments Corporation
3-23
HiQ User Manual
The Worksheet
Chapter 3
and may otherwise consist of any combination of the characters a-z, A-Z, 0-9, and the underline character, _.
If you use an illegal name (for example one including a space), you will be alerted by a dialog box.
Illegal symbol names may be viewed in the Symbol List by checking Invalid Script Variable Names.
You have the choice of simply creating the symbol or immediately launching the editor to initialize the data
item. In either case, if you duplicate an existing symbol name, you will be warned about the duplication.
Click on the dialog box’s OK button and provide a different name.
The Create Symbol window will contain options appropriate to the symbol type selected; for example, if you
were to create a matrix, you would wish to specify data type (integer, real, or complex) and matrix dimensions:
You may use the up and down arrow keys to move the selection up and down in the left column: Option-up
and -down arrows move the selection in the right column, and the tab key cycles through the edit fields
(including the Name field).
HiQ User Manual
3-24
National Instruments Corporation
Chapter 3
The Worksheet
Once you’ve built up a collection of symbols the Symbol List might look like this:
Notice that in the Show Types collection of checkboxes, Vector is underlined to indicate the type of the
selected symbol (“initVector0”).
The Delete, Rename, Place, and Edit buttons described below operate on whichever symbol is selected. Multiple symbols may be selected by holding down the shift key or command key while clicking on symbol
names:
•
shift-click—adds to the current selection
Starting with
this selection
Shift-Click
National Instruments Corporation
3-25
HiQ User Manual
The Worksheet
Chapter 3
To decrease the selected range, click on the last symbol to be included:
Starting with
this selection
Shift-Click
•
Command-click—adds discontinuous selection
Starting with
this selection
Command-Click
Command-Click
Command-Click
By dragging with the command key held down you can select discontinuous ranges:
Starting with
this selection
Command-Click
Drag
To remove symbols from the selected set, command-click (or drag) selected items; those symbols will be deselected.
Clicking on the Delete button deletes the selected symbol(s) from the project file. Once deleted, it's gone, so
be sure before you click on OK in the confirmation dialog box. Clicking on Cancel takes you back to the
Symbol List without deleting the symbol. You can also press <delete> to delete selected symbols.
HiQ User Manual
3-26
National Instruments Corporation
Chapter 3
The Worksheet
Clicking on the Rename button allows you to type a different name for the selected symbol:
You can also access this dialog box by selecting Rename Symbol from the File menu.
You may have difficulty locating a Symbol on a multi-page Worksheet. First, select the Symbol in the Symbol
List, then click on the Find button to scroll the Worksheet to the appropriate location and highlight the Symbol of interest. From the Worksheet, you can also use Find on Worksheet in the File menu, which brings up
the following dialog box:
Type the symbol’s name and click on Find Symbol.
Clicking on the Place button places a Symbol or Symbols on the Worksheet.
Compiled scripts represent a special case of symbols which may be placed on the Worksheet. A compiled
script acts like an application on the Macintosh desktop: you double-click on it to run the program (or highlight it, then select Run from the Worksheet menu). The way to place one of these on the Worksheet is to first
compile a program in the Script Editor, then use the Place command in the Symbol List. See the Script Editor
chapter for a full explanation
Clicking on the Edit button or double-clicking on the symbol's name allows you to edit the symbol’s data in a
separate window. Individual editors are described in other chapters in this manual.
The only Preferences control you have for the Symbol List is whether or not to display internal symbols
(those symbols that HiQ generates during script execution).
National Instruments Corporation
3-27
HiQ User Manual
The Worksheet
Chapter 3
CU T, CO P Y, PA S T E ,
AND
UN D O
When you use Cut, Copy, and Paste from the Edit menu to manipulate symbols, you must keep in mind HiQ’s
approach to handling data: the Symbol icon on the Worksheet is merely an iconic representation of the symbol and its data.
To protect against inadvertent loss of data, the only way to Cut or Clear a symbol and its data from the Worksheet is by doing so from the Symbol List. Deleting a Symbol from the Worksheet page merely removes the
Symbol’s icon.
Copying a Symbol places a copy of the symbol on the clipboard.
What happens during a Paste operation depends on the target location and the contents of the clipboard.
Worksheet 1
Cut/Copy
Worksheet 2
Paste to
Action
Symbol icon
(on the worksheet)
Worksheet
Symbol icon is placed on page and symbol is
added to the Symbol List
Symbol List
Symbol is added to Symbol List, but the Symbol icon is not placed on the worksheet.
Symbol
(from the Symbol List)
Worksheet
Symbol is added to Symbol List and Symbol
icon is placed on the worksheet
Symbol List
Symbol is added to Symbol List
The Paste mechanism, since it carries the symbol with it, includes safeguards to prevent overwriting a symbol
of the same name.
Your choices include:
HiQ User Manual
3-28
National Instruments Corporation
Chapter 3
The Worksheet
•
•
•
•
Unique Names—the names of pasted symbols which conflict with existing
symbols will be modified with “_n” where n is a unique integer
Replace—symbols with conflicting names will overwrite the existing symbols
Don’t Replace—the paste is cancelled for those symbols without unique names. (If you are pasting just one
symbol, this selection is the same as Cancel; if you are pasting multiple symbols, those symbols with unique
names will be pasted, those without unique names will not.)
Cancel—make no changes to the target Worksheet
When you paste a Symbol on a second Worksheet, it will appear at the same location on the page as it did in
the source document. If necessary, the target Worksheet will be expanded to fit.
Bringing text and graphics into the HiQ Worksheet from other applications is a relatively easy process. Material is always pasted into an expanded Symbol view on the Worksheet. The result is a symbol which may be
reduced to icon view, opened into its editor, or manipulated within the Symbol List.
Text will become a text symbol, editable in the Text Editor (see Text Annotation earlier in this chapter), and
graphics become picture symbols. The Picture Editor is used only to provide a consistent approach to viewing
symbols; its editing capabilities are limited.
One level of undo is generally available throughout HiQ. “One level” means that an action may be reversed
until the next “undoable” action takes place. For example, if you clear a Symbol from the Worksheet, then cut
another item, the clear is no longer undoable.
MA N A G I N G YO U R DATA
HiQ has some of the characteristics of a programming language that controls data files without your intervention. Unlike programs such as a word processor or spreadsheet, in which you explicitly control when data is
written to disk or read into main memory, HiQ manages symbols which exist in these states:
•
Saved on disk—until you overwrite the file on disk, you can always get back to this state.
•
Residing in main memory—may be the same as currently stored on disk or not, depending on whether it has
been modified by execution of a script
•
Loaded into an editor—data is loaded into an editor from main memory, so any modifications made by a script
execution will be included.
These three possible states are important to the next two sections which describe saving your data to disk and
reverting it to a previously saved state.
Whenever you select the Save command in the File menu, whether it be Save Worksheet while in the Worksheet or Save Symbol while in an editor, data is saved to disk. Once you have saved a symbol to disk, all
existing states are the same.
It is often convenient to recover the original data after making some modifications, whether by execution of a
script or typing changes from within an editor.
From within the Worksheet, you can choose Revert Worksheet from the File menu. This command makes the
Worksheet and all symbols stored in it reflect data saved on disk. All changes made since the last Save will be
lost.
National Instruments Corporation
3-29
HiQ User Manual
The Worksheet
Chapter 3
From within an editor you can choose Revert Symbol to return the symbol to its state when last saved. Revert
Symbol does automatically what you can do manually by closing the editor’s window, declining to save
changes, then reopening the symbol for editing.
ME M O RY MA N A G E M E N T
Though HiQ requires that a symbol must completely fit in your computer’s main memory, the total size of a
Worksheet file is limited only by the size of your hard disk. The program loads into main memory only those
symbols which are necessary and writes out to disk unused symbols if there is a need for more memory. This
activity is independent of the Worksheet file, being involved exclusively with a HiQ-managed temporary
swap file. Because the swap file may become as large as the current Worksheet file, you will have to be sure
that there is at least that much free space on your hard disk when you start HiQ. If you will be using multiple
Worksheet files, there will be multiple swap files, and you will have to consider the aggregate hard disk space.
Where the temporary files are located on your hard disk depends on the version of Apple system software you
are using:
•
System 6.0.5 through 6.0.7—temporary files are located in the System Folder of your startup device (the disk
you boot from) in a folder called “HiQ Temp Files.”
•
System 7—temporary files are located on the startup device in a file at the root level named “Temporary Items.”
This is a hidden file, so you won’t actually see it on the desktop.
HiQ removes temporary files when you quit the program. If execution is interrupted, HiQ will remove the
temporary files when it is next launched.
PR I N T I N G
To print your Worksheet, select Print…from the File menu.
If you wish to print less than the entire document, type the page range. A multiple page Worksheet prints in
the following order:
HiQ User Manual
1
3
2
4
3-30
National Instruments Corporation
CHAPTER 4
T H E D ATA E D I T O R
The Data Editor provides an intuitive facility for creating, viewing, and editing all of HiQ's numeric symbols,
including scalars, vectors, and matrices. The editor automatically handles all data types (integer, real, and
complex) and is easily accessible from other editors and the Symbol List.
Worksheet
Numeric
Data
Graphs
Scripts
Problem
Solvers
HiQ-Script
Built-In Functions
IN V O K I N G
AND
QU I T T I N G
THE
DATA ED I T O R
You can use the following methods to create a new numeric symbol and open it for editing.
From the Worksheet, place a numeric data symbol icon on the Worksheet and double-click on it.
From the Create Menu,
1.
select the Create Symbol… command in the File menu (or click on New in the Symbol List) to bring up the
Create Symbol Dialog Box.
National Instruments Corporation
4-1
HiQ User Manual
The Data Editor
2.
3.
4.
5.
6.
Chapter 4
click on Scalar, Row Vector, Column Vector or Matrix in the left column,
click on Integer, Real, or Complex in the Numeric Type group,
type the number of rows and columns (scalar and vector selections will produce the appropriate row and
column fields),
type a name, and
click on Create & Edit.
To edit an existing numeric symbol, use one of the following methods:
•
double-click on the Symbol on the Worksheet,
•
select the symbol’s name in the Symbol List and click on Edit, or
•
double-click on a numeric symbol’s icon in a Problem Solver.
To quit the Data Editor, click on the window’s close box. An alert provides the opportunity to save your data
if there have been any changes since the editor’s contents were written to disk. Clicking on Yes saves the symbol, clicking on No throws away changes made since the last save, and clicking on Cancel dismisses the dialog box and returns you to the Data Editor.
HiQ User Manual
4-2
National Instruments Corporation
Chapter 4
The Data Editor
T H E D ATA E D I T O R W O R K S PA C E
The Data Editor has a presentation concept similar to a spreadsheet.
Whole Matrix
Selector
Edit Area
Current
Cell
Column
Selector
Accept
Cancel
Rectangular
Selection
Lower
Rectangular
Selection
Upper
Rectangular
Selection
Diagonal
Selection
Row
Selector
The main data area in the center arranges the data in cells which may be edited in normal Macintosh fashion.
Standard scroll bars are available to help you navigate through your data. At the very top of the window is the
data entry area which contains the contents of the currently selected cell and accept and cancel buttons. Below
that are icons representing available data selection methods.
DATA TY P E S
The Data Editor can display all the available numerical data types: integer, real, and complex.
Type
Display
Integer
All digits are displayed.
Real
Real numbers are displayed in either fixed format (12.453) or scientific
notation (1.345e+12). The Numbers menu is used to select one of these
options, as well as specifying the number of digits to the right of the decimal point. Input infinity as Inf, +Inf, or -Inf (not case sensitive). Input
Nan as Nan or Nan followed by a number between 0 and 255 in parentheses [Nan(27)]. NaN is not case sensitive.
National Instruments Corporation
4-3
HiQ User Manual
The Data Editor
Chapter 4
Type
Display
Complex
Complex numbers are displayed as ordered pairs (1,2), as the sum of real
and imaginary parts (1+2i), or as polar values (2.236@ 63.435˚). To
specify the complex number format, select Ordered Pair, Sum, or Angular from the Numbers menu.
NAV I G AT I O N
In addition to the standard Macintosh window scroll bars, the Data Editor offers key commands to allow you
to scroll through your data.
Key
Motion
Return
Move one cell down
Shift-Return
Move one cell up
Tab
Move one cell right
Shift-Tab
Move one cell left
Up Arrow
Move one cell up
Down Arrow
Move one cell down
Right Arrow
Move one cell right
Left Arrow
Move one cell left
Shift-Up Arrow
Move to top edge of matrix
Shift-Down Arrow
Move to bottom edge of matrix
Shift-Right Arrow
Move to right edge of matrix
Shift-Left Arrow
Move to left edge of matrix
To allow long selections unimpeded by the size of the visible window, the Data Editor will automatically
scroll the data as you drag beyond the edge of the screen. Think of dragging beyond the edge of the screen as
a switch turning on scrolling. As long as you leave the cursor outside the window, scrolling continues. Moving the cursor back inside the window terminates scrolling. If you have allowed scrolling to go too far, move
the cursor out of the window on the opposite side, thus forcing scrolling in the return direction. Keep in mind
that this is a drag procedure, so the mouse button must be held down throughout. Releasing the button sets the
selection.
HiQ User Manual
4-4
National Instruments Corporation
Chapter 4
The Data Editor
ED I T I N G
A
CE L L
Editing the contents of a cell (whether for initial insertion of data or subsequent modification) occurs in the
edit area at the top of the Data Editor window. Revisions to the data are not reflected in the cell until you
explicitly accept the changes.
Contents of the currently selected cell (or the first cell of a multiple cell selection) are always repeated in the
edit area. Standard Macintosh editing facilities are available including cut, copy, and paste.
To register your changes in the target cell:
•
click on the accept button—registers edited data, and the current cell remains selected
•
use any navigation command—registers edited data, and the cell resulting from the navigation command is
selected.
To throw away editing changes
•
click on the cancel button—all changes made in the editing area are dismissed without affecting the current cell
SE L E C T I O N ME T H O D S
In addition to the standard single cell and rectangular selection options, the Data Editor allows diagonal and
triangular selections.
Selection is chosen by clicking on one of the four icons in the left margin of the editor window.
The rectangular selection method is the default. Its icon will be highlighted when you first open the editor. To
select one cell, click within it. To select a rectangular group of cells, click in one corner cell, and drag diagonally to the opposite corner cell or click in one corner cell and shift click in the opposite corner cell.
Click on this icon to perform a diagonal selection. Click on the first cell, then drag along the desired diagonal
to the last cell. The diagonal band may be more than one cell deep.
The triangular selection highlights either the upper or lower triangle of what would otherwise be a rectangular
selection. Click and drag from the upper left corner to the lower right corner of the rectangle enclosing your
desired triangle. The dark portion of the triangle selection icon indicates whether the upper or lower triangle
will be selected.
To select an entire row or group of rows, click in the row tag (when the cursor changes to
) and drag to
select more than one row. To select an entire column or group of columns, click in the column tag (when the
cursor changes to
) and drag to select more than one column.
Click in the whole matrix selector above the first row tag and to the left of the first column tag to select the
entire matrix (or use the Select All command in the Edit menu).
To extend a current selection, shift click in the desired extension cell. For example, if cells a, b, and c had previously been selected, shift click in cell e to add both cells d and e to the selection. This scheme also works in
reverse: if, after selecting cells a through e, you decided that you really only wanted cells a-c after all, shift
click in cell c to eliminate cells d and e from the selection.
a
National Instruments Corporation
b
c
4-5
d
e
HiQ User Manual
The Data Editor
Chapter 4
Clicking anywhere in the data area reduces the current selection to the cell at the pointer’s location.
FO R M AT S
The Data Editor offers control over font and size as well as type of numeric representation.
The Numbers menu allows you to select scientific format (1.23e+10) or fixed point (123.45) along with the
number of digits to the right of the decimal. The General menu item displays data as it thinks best:
•
integers and real numbers with no significant digits to the right of the decimal will be displayed as integers,
•
reals will be displayed in fixed point if all digits can be displayed with the current precision setting, otherwise
the display will be switched to scientific
Use the Numbers menu to display complex numbers as ordered pairs (1,2), the sum of real and imaginary
parts (1+1i), or as polar values (1@45°). In summation form, the following inputs are equal:
1+2i, 1+2I, 1+2j, 1+2J.
A number with zero real part may be input as the imaginary part only (2i).
Complex numbers in angular form may be input as follows:
Angle in:
Form
Radians
1@1r, 1@1R
Degrees
1@1d, 1@1D, 1@1° (Option-shift-8 produces °)
Grads
1@1g, 1@1G
Whenever a number will not fit within the cell boundary, it will be truncated with a trailing ellipsis. The number 123456787654 might look like:
The chosen format attribute applies to all selected cells. To reformat all data, select the entire matrix, then
proceed with the formatting commands.
Click here to select
entire matrix
HiQ User Manual
4-6
National Instruments Corporation
Chapter 4
The Data Editor
You may change the size of any combination of rows and columns. To adjust row height, move the pointer to
the bottom of the row’s tag cell. The cursor will change to
. Drag up or down until the desired row height
is attained .
To adjust the height of multiple rows, first select the desired rows, then position the cursor over the row
divider of any of the selected rows. When the cursor metamorphoses into the aforementioned
, drag to
attain the desired row height. All selected rows will take on the new dimension.
To adjust a column width, move the pointer to the right edge of the column’s tag cell. The cursor will change
to
. Drag left or right until you get the right column width. Multiple columns may be resized using the
same technique as with rows.
Having adjusted the cell sizes to your liking, you may wish to adjust the location of text within each cell with
the justification commands in the Text menu. The chosen attribute applies to all selected cells. To reformat all
data, select the entire matrix, then proceed with the formatting commands.
To insert one or more rows, select the row immediately below the new row (or rows). Select Insert Rows…
from the Matrix menu. In the dialog box that appears, edit the number of new rows and click on OK.
To insert one or more columns, select the column which will be immediately to the right of the new column
(or columns). Select Insert Columns… from the Matrix menu. The new column(s) will appear to the left of
the selection.
To add a row below all existing rows or a column to the right of all existing columns, use Get Info… to
change the matrix’s dimensions as described below.
To delete one or more rows, make your selection, then select Delete Rows from the Matrix menu. You will be
asked to confirm your action.
To delete one or more columns, make your selection, then select Delete Columns from the Matrix menu.
National Instruments Corporation
4-7
HiQ User Manual
The Data Editor
Chapter 4
To change the dimensions of a matrix or vector select Get Info … item from the Matrix menu.
The matrix type field is a popup menu which allows you to choose from Integer, Real, or Complex. Increasing dimensions will cause the matrix to be padded with zeroes. Decreasing a dimension will cause loss of
data. Potential data loss will be met with a confirmation dialog box.
The left- and topmost cells contain row and column labels, or tags. To edit these tags select the Edit Tags
command under the Matrix menu. When this menu item is selected (as indicated by a check mark), you may
edit the tag cells to be any combination of alphanumeric characters. Keyboard navigation methods do not
work in the tag areas; you must use the mouse to select tag cells. You can still edit matrix elements when Edit
Tags is active.
CU T, CO P Y,
AND
PA S T E
Cut, copy, and paste work as they do throughout the rest of HiQ with one notable exception. To paste a multicell selection, you must select the target range to be the same size as the source range.
Let’s copy cells [1,1], [1,2], and [1,3] to another location starting at cell [3,3]:
1.
Select the three source cells.
2.
Select Copy from the Edit menu.
HiQ User Manual
4-8
National Instruments Corporation
Chapter 4
The Data Editor
3.
Select the three target cells.
4.
Select Paste from the Edit menu.
Had you selected only cells [3,3] and [3,4], only the first two source cells would have been pasted into the
new location.
Cut, copy, and paste work between applications, so if you had data in a Microsoft Excel spreadsheet, you
could copy all or part of it and paste the numbers into a HiQ matrix. Keep in mind that the paste portion of
this procedure is controlled by the application; where HiQ requires that you select the entire range of target
cells before pasting, in Excel you need only select the first cell. Triangular and diagonal selections work fine
from HiQ to another application. Pasting data into a word processor works as well: data elements in each row
are separated by tabs, and the last element is followed by a carriage return (except for the last row). In diagonal and triangular selections, non-selected elements are filled with zeroes.
CU R S O R S
As you move the pointer over the Data Editor's window, the cursor will change shape to remind you of the
myriad possibilities you have at any moment.
Edit: the cursor is over editable text
Cell: the cursor is over a cell, row tag or column tag
Default cursor: the cursor takes this form whenever it is not over an area which has a special cursor
Adjust column width: the cursor is over a column divider within the column tags area, allowing you to adjust
column width.
Adjust row height: the cursor is over a row divider within the row tags area, allowing you to adjust row height.
National Instruments Corporation
4-9
HiQ User Manual
The Data Editor
Chapter 4
Row Selection: The cursor is within a row tag area. Click to select the entire row.
Column Selection: The cursor is within a column tag area. Click to select the entire column.
SAV I N G YO U R DATA
You will be reminded to save or discard your data when you close the Data Editor. For more control, the following choices are available under the File menu:
•
Save Symbol As…—saves the symbol with the name specified in the standard file dialog box.
•
Save Symbol—saves the symbol with the current name.
•
Save Copy of Symbol…—saves the contents of the editor under a new name, but the editor remains loaded with
the original symbol.
•
Revert Symbol…— returns the editor’s contents to the state at last save. Before reading in the old data, HiQ
allows you to change your mind.
PR I N T I N G
To print the current contents of the Data Editor, select Print from the File menu.
PR E F E R E N C E S
Select Preferences for… under the File menu to set preferences for future use of the Data Editor. (See “Worksheet Preferences” in the Worksheet chapter for a description of the global preferences system.)
You have control over the following defaults in the Data Editor:
•
•
•
•
•
font: typeface and size;
horizontal and vertical justification;
row height;
default format for integer, real, and complex numbers, and
column width.
HiQ User Manual
4-10
National Instruments Corporation
CHAPTER 5
P R O B L E M S O LV E R S
Problem Solvers allow intuitive access to many of the most complex HiQ functions. You may use a Problem
Solver to immediately execute the solution or to produce a script which you can then use in your own HiQScript functions. There is nothing about this process that you cannot do yourself; the Problem Solver simply
generates a call to one or more of HiQ's built-in functions, complete with all necessary input parameters.
Worksheet
Numeric
Data
Graphs
Scripts
Problem
Solvers
HiQ-Script
Built-In Functions
Before looking at each of the ten Problem Solvers in detail, we'll get an idea of their general capabilities by
considering the Nonlinear Systems Solver as an example.
STA R T I N G
A
PR O B L E M SO LV E R
A Problem Solver is a graphical user interface in HiQ that you use to solve mathematical problems. A Problem Solver is a symbol, so you can display it on a Worksheet in icon view. Unlike data, text, graphic, and
script symbols, Problem Solvers do not have an expanded view.
You can access Problem Solvers through the Solver menu or through the Problem Solvers on the Tool palette.
However, in the first steps of this exercise you will access the Problem Solver through the Create menu.
1.
2.
3.
4.
Select Create Symbol… from the Create menu,
click on Problem Solver in the left column,
click on Nonlinear Systems in the right column,
type a name or use the default name provided by HiQ such as NonlinSys1, and
National Instruments Corporation
5-1
HiQ User Manual
Problem Solvers
5.
Chapter 5
click on Create & Edit.
In this example, a Problem Solver window with the name NonlinSys1 is opened, ready for setting up and
solving a problem.
GE N E R A L FE AT U R E S
The problem solvers are all arranged similarly, with three basic sections:
•
inputs,
•
options, and
•
outputs.
HiQ User Manual
5-2
National Instruments Corporation
Chapter 5
Problem Solvers
Inputs
Run button
Outputs
Popup
Menu
Edit
Fields
Data
Icon
Options
Views within windows: each of the views inside the Nonlinear System Solver window has most of the features
of a standard Macintosh window, including a title bar, a zoom box, and scroll bars. Where more than one item
may be input (e.g., equations or variables) there is also an edit field in the title bar where you may specify a
number.
Edit fields: where a number or expression is required, standard Macintosh editing controls work as you would
expect. You can tab between them, or go directly by clicking inside the desired field.
Run button: clicking on this button causes the actions specified in the execution options to take place.
Popup menus: fields that look like
National Instruments Corporation
5-3
HiQ User Manual
Problem Solvers
Chapter 5
in the Nonlinear Systems Solver are popup menus that expand to look like
when the mouse button is held down. When expanded, the current selection is highlighted, so if you do nothing besides releasing the mouse button, no change will be made.
Icons: input and output scalars, vectors and matrices are represented by icons, as in the vector icon to the left.
Double-click on the icon to view the data from within the Data Editor. To rename the item, click on its icon to
select it, then press the return key and type the new name. Where the icon represents input values, doubleclick on the icon to bring up the Data Editor for input. To use an existing symbol for input, change the name
to match that of the existing symbol.
Tabbing from field to field: in addition to clicking in the field you wish to deal with, you may also press the tab
key to move from one field to another.
INP UT S
The type of input will be indicated by an appropriate graphical construct: for example, if more than one equation is expected, each equation will be separated from the others by a dashed line. If an equation rather than
an expression is necessary, an “= 0” will be presented. Text will wrap within the expression view and input
areas which will expand as necessary to encompass all your data. The zoom box is available to expand the
window to full screen size.
In cases where multiple items may be input, there will be an edit field where you may specify the desired
quantity.
O P T IO N S
The options area includes those items appropriate for the current Problem Solver. In the Problem Solvers that
support multiple algorithms, input parameters such as tolerances and number of iterations will tend to vary
with the algorithm selected.
In addition to options relating to the problem's mathematical solution, this section allows you to control how
the Problem Solver behaves during execution.
Where appropriate you may have the Solver automatically create a graph of the results by selecting the Graph
checkbox. If this button is dimmed, this option is not available.
Rather than obtaining the result in numerical form, you may choose to have the Problem Solver create a script
for later use. Clicking on the Save Script button causes HiQ to store the script generated by the Problem
Solver in a symbol. The normal version of the script contains only the minimum necessary HiQ-Script code
to describe the problem setup. Checking the Verbose option inserts comments into the script.
It is not necessary to compute a numerical solution in order to generate a script from a Problem Solver. For
example, if your Problem Solver successfully completes a lengthy execution and then you decide to generate
a script, you can deselect Execute, select Save Script, and rerun the Problem Solver. The Problem Solver will
generate a script, without performing the mathematical analysis.
HiQ User Manual
5-4
National Instruments Corporation
Chapter 5
Problem Solvers
O UT P UT S
The Outputs section contains icons representing the values computed by the Problem Solver. The name
appearing under the icon is a default moniker and may be changed as described in the inputs section just
above. To view an individual output symbol, double-click on its icon.
P RINT IN G
To print the contents of the current Problem Solver window, select Print from the File menu.
PR O B L E M SO LV E R ON - LI N E HE L P
Help is available for the problem solvers by selecting Help… from the Apple () menu.
To bring up a help screen for the solver of interest:
1.
click on the appropriate line and
National Instruments Corporation
5-5
HiQ User Manual
Problem Solvers
2.
Chapter 5
click on Examine and press Return, or double-click on Examine.
When present, the right arrow allows you to see the next screen, and the left arrow takes you to the previous
screen. The help windows are non-modal, so you may leave them open for reference while working in other
windows. Dismiss the help system by closing the windows.
FU N C T I O N S
&
TA B L E S ME N U
To help you use the many built-in functions available in HiQ, the Functions & Tables… command in the Edit
menu presents a list of all functions, broken down by category. In addition to providing a handy reference to
the form of built-in functions, this facility may be used to insert a prototype function call in your Problem
Solver setup or script.
For example, in a Problem Solver setup you wish to multiply the third row of the matrix A by the matrix B,
but you don’t remember the arguments to the built-in function which returns a row of a matrix.
HiQ User Manual
5-6
National Instruments Corporation
Chapter 5
Problem Solvers
1.
Select Functions & Tables… from the Edit menu.
The left window contains a list of categories and the right window lists the functions in the selected category.
At the bottom of the window is a field which will contain the form of the selected function. With the insertion
point where you wish to type a function,
2.
Select Basic Matrix Functions from the Function Type list.
3.
Scroll the Function list down until you can select getRow.
The function call for getRow appears in the edit field at the bottom of the window. You have the choice of
National Instruments Corporation
5-7
HiQ User Manual
Problem Solvers
Chapter 5
making necessary changes here or waiting until you have inserted the text into the final location. Since we
haven’t actually called up a Problem Solver at this point, we will make the changes locally, then cancel the
whole thing.
v = getRow( A, k );
Typically, a Problem Solver will require an expression input rather than an equation, so,
4.
5.
6.
select everything to the left of getRow and press the delete key.
We also won’t need the semicolon at the end of the expression for a Problem Solver (the semicolon’s use is
explained in the HiQ-Script chapter), so delete it as well.
Replace k with 3 to get the third row of A, and add “* B” to perform the multiplication.
getRow( A, 3 ) * B
Were we ready to actually use this expression the next step would be to press OK. In this case,
7.
click on Cancel.
PR E F E R E N C E S
To tailor the general Problem Solver setup to your needs, select Preferences for… from the File menu. Select
HiQ if you want these preferences to be standard every time you launch HiQ or Worksheet if you wish to limit
these preferences to just subsequent Problem Solvers on this Worksheet.
1.
2.
Select Preferences for… from the File menu and select Project from the submenu.
Select Problem Solvers from the Subject menu.
Default run mode choices are as follows:
•
Graph—generate a graph of the output values. A graph symbol will be stored in the Symbol List.
•
Execute—run the Problem Solver to obtain numeric values. If you are using this Problem Solver to create a
script, you may wish to leave this option unchecked.
•
Save Script—create a script which will recreate the Problem Solver setup. The script will be stored in a script
symbol available in the Symbol List.
•
Verbose—only available if Save Script is checked, this option adds comments to the generated script.
HiQ User Manual
5-8
National Instruments Corporation
Chapter 5
Problem Solvers
EX P R E S S I O N EVA L U AT I O N
The Expression Evaluator is used to evaluate an expression for a single input value or over a range of values.
The expression may include any legal HiQ-Script statements, including built-in functions and user defined
functions.
To start the Expression Evaluator from the Worksheet place an Expression Evaluator Symbol on the Worksheet and double-click on it,
To start the Expression Evaluator from the Solvers menu, select Expression Evaluation.
To start the Expression Evaluator from the Create Menu:
1.
2.
3.
4.
5.
select Create Symbol…,
click on Problem Solver in the left column,
click on Expression Evaluation in the right column,
type a name, and
click on Create & Edit.
As an example, let's calculate and plot the results of the function
sin(x)cos(x) as x goes from zero to 4π.
National Instruments Corporation
5-9
HiQ User Manual
Problem Solvers
Chapter 5
DE F INE I N P U TS
Define inputs as follows:
1.
2.
Enter the expression into the Expression input area, and
click on the Define Inputs button between the Inputs and Options areas.
DATA E L EM E N T S
There are three columns in the data elements window to describe each variable: status (“??” above), variable
name (“x”), and description (“Undefined symbol”).
Status possibilities include:
??
variable hasn't yet been defined
•
local variable
IC
integer constant
RC real constant
CC complex constant
IV
integer vector
RV real vector
CV complex vector
IM integer matrix
HiQ User Manual
5-10
National Instruments Corporation
Chapter 5
Problem Solvers
RM real matrix
CM complex matrix
Clicking anywhere in the line brings up a dialog box which allows you to assign type and value(s) to the variable. You can do so any time to change the variable's definition.
1.
Click in the line containing “x” to see:
You have three choices in how to define your variable:
•
Use numeric symbol: This option lets you equate a variable to a previously defined project variable. Click on the
icon to the left of Find Symbol. When the list of numeric symbols appears, highlight the one you want and click
on OK.
•
Hold constant value: type the constant value.
•
Iterate value: type the start and stop values and either the step value or the
number of steps. Click on the radio button next to your choice; the other option is dimmed.
National Instruments Corporation
5-11
HiQ User Manual
Problem Solvers
Chapter 5
In this example, we will go from 0 to 4π in 100 steps.
2.
3.
4.
5.
6.
Click on the radio button to the left of the Iterate Values area.
Type the values as shown above (note that π is available as the HiQ-Script Language Constants <pi>).
Click on OK to return to the Expression Evaluator window.
Check the Graph button at the bottom of the Options area to ask for graphics output, then
click on the run button.
O UT P UT S
Graphics output is stored in a symbol named eval_graph. To view the graph,
1.
2.
select eval_graph in the Symbol List and
click on Edit.
To view all the data points,
HiQ User Manual
5-12
National Instruments Corporation
Chapter 5
Problem Solvers
3.
4.
choose ExprEval1 from the Window menu to bring the Problem Solver to the front and
double-click on the icon in the Outputs area of the Expression Evaluator window.
The Expression Evaluator may also be used to plot 3D functions such as
sin(x)cos(y) as each x and y range from 0 to 2π.
5.
6.
7.
8.
9.
Enter sin(x) * cos(y) into the Expression Input window.
Click on the Define Inputs button.
Click in the variable x line.
Click on the Iterate Variable button.
Set the iteration to range from 0 to 2π in steps of 0.3.
10. Click in the variable y line.
11. Click on the Iterate Variable button.
12. Set the iteration to range from 0 to 2π in steps of 0.3. Click on OK.
To differentiate the new results,
13. Click on the output icon and change its name to “Results3D”.
National Instruments Corporation
5-13
HiQ User Manual
Problem Solvers
Chapter 5
The setup looks like this:
14. Click on the run button.
If you haven’t closed the graph from the previous example it will update in place, otherwise double-click on
eval_graph in the Symbol List.
To see how the Problem Solver handles expressions containing existing symbols, we'll multiply two matrices
HiQ User Manual
5-14
National Instruments Corporation
Chapter 5
Problem Solvers
A and B which are defined as follows:
1.
2.
3.
4.
Create the two integer 3x3 matrices A and B using the Data Editor as described in the Data Editor chapter.
Create an Expression Evaluator and open it.
Enter the expression A * B into the Expression input area, then
click on the Define Inputs button to set up the variables.
5.
A and B are understood to be existing project variables. You have the option of using A and B as they are
currently defined, or modifying them. Clicking on A or B in the Options area causes a confirmation dialog
National Instruments Corporation
5-15
HiQ User Manual
Problem Solvers
Chapter 5
box to appear:
If you wish to modify individual elements of a matrix, click on Edit. Clicking on Override allows you to redefine the symbol as described in the previous example. In this instance, we will use the current definitions, so
if you have brought this dialog box up, click on Cancel.
6.
7.
Uncheck the Graph option.
Click on the run button.
An “Execution Completed” dialog box will appear.
8.
Click on OK.
To view the answer in the Data Editor,
9. bring the Expression Evaluator to the front and
10. double-click on the Outputs icon (in this example evalRes_a1) in the Outputs section.
HiQ User Manual
5-16
National Instruments Corporation
Chapter 5
Problem Solvers
NO N L I N E A R SY S T E M S
Use this Problem Solver to solve the nonlinear system of equations:
f1(x 1, x2 , ... , x n) = 0
f2(x 1, x2 , ... , x n) = 0
•
•
•
fn(x 1, x2 , ... , x n) = 0
or in equivalent vector form:
f(x1, x2, … , xn) = 0
where
f = (f1,, f2, … ,fn)T
To start the Nonlinear System Solver from the Worksheet, place a Nonlinear Systems Symbol on the Worksheet and double-click on it.
To start the Nonlinear System Solver from the Solvers menu, select Nonlinear Systems from the Solvers
menu.
To start the Nonlinear System Solver from the Create Menu:
1.
2.
3.
select Create Symbol…,
click on Problem Solver in the left column,
click on Nonlinear Systems in the right column,
National Instruments Corporation
5-17
HiQ User Manual
Problem Solvers
4.
5.
Chapter 5
type a name, and
click on Create & Edit.
SAM P L E P ROB LE M
Let's consider the following system of equations:
x21 + 2x22 –x2 –2x3= 0
x21 – 8x22 + 10x3 = 0
x21
=1
7x2x3
HiQ User Manual
5-18
National Instruments Corporation
Chapter 5
Problem Solvers
with initial estimates:
x1 = 0.3
x2 = 0.3
x3 = 0.3
INP UT S
The Nonlinear System Solver's default number of equations happens to be 3, so no change is required to set
up the equations. For problems involving other than three equations, type the number into the “n=” field;
when you tab out of the field, the input view automatically reformats to accept the appropriate number of
equations.
1.
Type the equations. All the Problem Solvers expect to see variables in the form x[1], x[2], etc.)
The problem setup should look like this:
National Instruments Corporation
5-19
HiQ User Manual
Problem Solvers
Chapter 5
O P T IO N S
Method choices include:
•
Newton — See SysNewton function description in the Reference Manual.
•
Quasi-Newton — See SysQuasiNewton function description in the Reference Manual.
•
Brent — See SysBrent function description in the Reference Manual.
We choose the Newton method in this case.
2.
3.
Double-click on the initial estimate vector icon to bring up the input form:
Type the initial conditions vector and close the window.
4.
Use default values for maxIterations, fTolerance, and xTolerance.
Local substitutions may be used to minimize typing in the equation input area above. For example, if there
were a constant
m1 = 23429.674537845
appearing throughout the system of equations you would most certainly prefer to type m1 rather than that
number.
To do so, type the constant in the Local Substitutions window, replacing the arg_a = 1.0 default. To use more
than one local substitution, tab to or manually select the number in the Local Substitutions view title bar and
insert the desired number of local substitutions. The appropriate number of lines will appear. Tab from one
field to the next, filling in your values.
5.
Click on the run button (the right-facing arrow between the input and output areas).
O UT P UT S
HiQ places the results in the Outputs area. In this case the output is a three-component vector (solnVector0)
HiQ User Manual
5-20
National Instruments Corporation
Chapter 5
Problem Solvers
which looks like:
To generate a script, click on Save Script before running the Problem Solver:
project nonlinEqns0, solnVector0, initVector0;
local maxIterations, xTolerance, fTolerance;
maxIterations = 100;
xTolerance = 1.0e-6;
fTolerance = 1.0e-6;
Function nonlinEqns0(index, x)
arg_a = 1.0;
select (index)
case 1:
return
case 2:
return
case 3:
return
from
x[1]^2+2*x[2]^2-x[2]-2*x[3] - (0);
x[1]^2-8*x[2]^2+10*x[3] - (0);
(x[1]^2/(7*x[2]*x[3])) - (1);
end select;
return 0;
end function;
solnVector0 = SysNewton(nonlinEqns0, maxIterations,
xTolerance, fTolerance, initVector0);
You can set up the initial estimate vector in the Data Editor or you can add the following line above
the call to the SysNewton function.
initVector0 = {.3;.3;.3};
Before going too far into working with your own scripts, refer to HiQ-Script and Script Editor chapters.
National Instruments Corporation
5-21
HiQ User Manual
Problem Solvers
Chapter 5
NU M E R I C A L IN T E G R AT I O N
The Numerical Integrator is capable of computing the integral of a wide variety of function types.
To start the Integrator from the Worksheet, place an Integrator Symbol on the Worksheet and double-click on
it,
To start the Integrator from the Solvers menu, select Numerical Integration from the Solvers menu,
To start the Integrator from the Create Menu:
1.
2.
3.
4.
5.
select Create Symbol…,
click on Problem Solver in the left column,
click on Numerical Integration in the right column,
type a name, and
click on Create & Edit.
SAM P L E P ROB LE M
Let's integrate the equation
constant <pi>.
HiQ User Manual
sin(100πx)
πx
from x=0.1 to 1.0. Remember that π is available as the language
5-22
National Instruments Corporation
Chapter 5
Problem Solvers
INP UT S
6.
Tabbing between input fields, type the equation and lower and upper limits.
O P T IO N S
The Integrator is capable of handling 14 different types of integrands. To select between them, click on the
Previous or Next button until the required equation is visible in the Options area. The table below presents all
the available integrand types, their descriptions as they appear in the Problem Solver, and their associated
built-in function. For a full description of each function, see the Problem Solver Functions chapter in the Reference Manual.
Table 1: Integral Problem Solver Integrand Types
Integral
b
f(x) dx,
f general
a
b
b
sin( αx) f(x) dx
cos(αx) f(x) dx
a
a
∞
Description
Function
Definite integral of
a continuous integrand
integAdapt
Definite integral
involving sine and
cosine
integOscillate
Fourier integral
integFourier
∞
sin( αx) f(x) dx
cos(αx) f(x) dx
b
b
b
f(x) ln(x-a) ln(b-x) (x-a)α (b-x) β dx
a
b
f(x) ln(b-x) (x-a)α (b-x) β dx
Definite integral of
integrand with logarithmic singularity
at endpoints
a
b
f(x) ln(x-a) (x-a)α (b-x) β dx
intAlgLogSingular
a
b
f(x) (x-a)α (b-x) β dx
a
f(x) dx
f(x) dx
b
∞
b
∞
-∞
National Instruments Corporation
f(x) dx
-∞
5-23
Indefinite integral
with one or two
unbounded limits
integInfinite
HiQ User Manual
Problem Solvers
Chapter 5
Integral
xi
b
f(x) dx +
a
xi
x1
f(x) dx, x i ⇐ ...
xn
Function
Definite integral
with break points
integBkPts
Integral of integrand
with high differentiality
b
f(x) dx,
Description
f smooth
a
integGauss
The default options are used for this problem. The final setup should look like this:
7.
Click on the run button (the right-facing arrow between the input and output areas).
HiQ User Manual
5-24
National Instruments Corporation
Chapter 5
Problem Solvers
O UT P UT
HiQ places the results in the Outputs area. In this case the output is a scalar, answer1:
To generate a script, click on Save Script before running the Problem Solver:
project answer1, error1, numEval1, integFct1;
function integFct1(x)
arg_a = x;
return ((sin(100*<pi>*x)/(<pi>*x)));
end function;
local lowerLimit, upperLimit, absError, relError, maxEvaluations;
lowerLimit = 0.1;
upperLimit = 1.0;
absError = 1.0e-6;
relError = 1.0e-6;
maxEvaluations = 1000;
[answer1, error1, numEval1] = IntegAdapt(integFct1,
lowerLimit, upperLimit, absError, relError, maxEvaluations);
PO LY N O M I A L RO O T S
Use this Solver to determine all the real and complex roots of the general nth-degree complex polynomial:
(an + ib n)x n + (an-1 + ib n-1 )xn-1 + • • • + (a1 + ib1 )x1 + (a0 + ib 0)
To start the Polynomial Root Solver from the Worksheet, place a Polynomial Root Solver Symbol on the
Worksheet and double-click on it,
To start the Polynomial Root Solver from the Solvers menu, select Polynomial Roots from the Solvers menu,
To start the Polynomial Root Solver from the Create Menu:
1.
2.
3.
4.
select Create Symbol…,
click on Problem Solver in the left column,
click on Polynomial Roots in the right column,
type a name, and
National Instruments Corporation
5-25
HiQ User Manual
Problem Solvers
5.
Chapter 5
click on Create & Edit.
SAM P L E P ROB LE M
Let's find the roots of the following equation: x4 + 8x3 + 24x2 – 32x + 16 = 0
INP UT S
The Polynomial Root Solver's default number of non-zero terms is 1, so first
6.
7.
tab to the number of terms input (k=) and insert 5. As you tab out of that cell, the input area is changed to
reflect the requirement for five terms.
Type the coefficients of each term. Be sure to input something for each part of the term, including real,
imaginary and exponent, even if it is zero. The solver will flag an error if any part of the term is left blank.
O P T IO N S
The real and imaginary parts of the initial estimate go here.
8.
Type 1.0 for both parts of the initial estimate
HiQ User Manual
5-26
National Instruments Corporation
Chapter 5
Problem Solvers
The full problem setup looks like this:
Scrolling the input field to show the remaining term…
9.
Click on the run button (the right-facing arrow between the input and output areas.
O UT P UT
Double-click on the compRt1 icon in the Outputs area to view the results:
National Instruments Corporation
5-27
HiQ User Manual
Problem Solvers
Chapter 5
To generate a script, click on Save Script before running the Problem Solver:
project compRt0;
local a, f;
a = (1.0, 1.0);
f = { (16,0),(-32,0),(24,0),(-8,0),(1,0) };
compRt0 = RootPolynomial(f, a);
GE N E R A L RO O T S
Use this Problem Solver to determine a real zero of a single variable real-valued function f(x) (find the solution of the equation f(x)=0) in a specified closed interval [a, b]; or compute a real or complex root of the function f(z) (find a complex solution of the equation f(z)=0).
To start the General Root Solver from the Worksheet, place a General Root Solver Symbol on the Worksheet
and double-click on it.
To start the General Root Solver from the Solvers menu, select General Roots from the Solvers menu.
To start the General Root Solver from the Create Menu:
1.
2.
3.
select Create Symbol…,
click on Problem Solver in the left column,
click on General Roots in the right column, type a name, and
HiQ User Manual
5-28
National Instruments Corporation
Chapter 5
Problem Solvers
4.
click on Create & Edit.
SAM P L E P ROBL EM
Let us find a real root of the following equation: e–x – x = 0 between 0 and 10.
INP UT S
5.
6.
Type the left side of the equation above in the “f(x) in f(x) = 0” window.
Type 0 and 10 as the left and right endpoints.
O P T IO N S
Method choices include:
•
Bisection — the modified Dekker's method for computing a real root of a single variable real-valued function in
a specified closed interval. See RootBisection function description in the Reference Manual.
•
Muller — This algorithm finds the real or complex roots of a general complex function f(z) by utilizing an iteration formula formed from a three-point Lagrangian interpolation formula and direct interpolation. It is essentially a generalization of the Secant method. See RootMuller function description in the Reference Manual.
National Instruments Corporation
5-29
HiQ User Manual
Problem Solvers
Chapter 5
The final problem setup is shown below:
We choose the Bisection method with the default tolerance of 1.0e-6 in this case.
7.
Click on the run button (the right-facing arrow between the input and output areas).
O UT P UT
Double-click on the realRoot1 icon in the Outputs area to view the result (the number of iterations required to
attain the solution is stored in iterations1):
To generate a script, click on Save Script before running the Problem Solver:
local leftEndPoint, rightEndPoint, tolerance;
leftEndPoint = 0;
HiQ User Manual
5-30
National Instruments Corporation
Chapter 5
Problem Solvers
rightEndPoint = 10.0;
tolerance = 1.0e-6;
project rootFct0;
function rootFct0(x)
arg_a = 1.0;
return (exp(-x)-x);
end function;
[realRoot0,iterations0] = RootBisection(rootFct0,
leftEndPoint, rightEndPoint, tolerance);
ODE IN I T I A L VA L U E
The ODE Initial Value Problem Solver is designed to solve:
dx
------ = f ( t, x ) ,
dt
with x(a) = x
( a ≤ t ≤ b)
0
where x and f are n-dimensional functions defined on the subsets of R1 containing [a,b] and Rn+1 respectively.
To start the ODE Initial Value Problem Solver from the Worksheet, place an ODE Initial Value Problem
Solver Symbol on the Worksheet and double-click on it.
To start the ODE Initial Value Problem Solver from the Solvers menu, select ODE Initial Value from the Solvers menu,
To start the ODE Initial Value Problem Solver from the Create Menu:
1.
2.
3.
4.
select Create Symbol…,
click on Problem Solver in the left column,
click on ODE Initial Value in the right column,
type a name, and
National Instruments Corporation
5-31
HiQ User Manual
Problem Solvers
5.
Chapter 5
click on Create & Edit.
SAM P L E P ROB LE M
Let us consider the solution of the following system of differential equations:
dx1
= 3x1 + 2x2
dt
dx2
= 4x1 + x2
dt
for 0 ≤ t ≤ 1
with the initial values:
x1(0) = 0
x2(0) = 1
We'll use an absolute error of 1.0e-9 and a relative error of 1.0e-11.
HiQ User Manual
5-32
National Instruments Corporation
Chapter 5
Problem Solvers
INP UT S
The Initial Value Problem Solver's default number of equations is 3, so
6.
7.
8.
type a 2 into the “n=” field; when you tab out of the field, the input window automatically reformats to
accept the appropriate number of equations.
Type the right sides of the equations. The left sides (x'[1], etc.) are set up to denote dxi/dt and are not
editable.
Double-click on the Initial Conditions icon to input the initial conditions.
O P T IO N S
Method choices include:
•
RKF — nth order Runge-Kutta-Fehlberg integration. See the OdeIvpRKF function description in the Reference Manual.
•
Smooth — This method is a translation of an extrapolation code which is based on the Bulirsch-Stoer-Gragg
algorithm combined with the explicit midpoint rule. See the OdeIvpSmooth function description in the Reference Manual.
•
Stiff — Based upon the cyclic composite method due to Tendler, Bickart, and Picel for solving nonlinear stiff
systems of ordinary differential equations. See the OdeIvpStiff function description in the Reference Manual.
For this example, we choose RKF.
9.
Type the absolute and relative tolerances cited above (1.0e-9 and 1.0e-11).
The default values of start and stop times are correct; to see 11 output steps,
10. change Step to 0.1.
National Instruments Corporation
5-33
HiQ User Manual
Problem Solvers
Chapter 5
The final problem setup is shown below:
11. Click on the run button (the right-facing arrow between the input and output areas).
O UT P UT
HiQ places the results in the Outputs area. In this case the output is a matrix (ivpMatrix0) containing the time
history of x[1] and x[2] and the corresponding vector ivpVector0 which contains the 11 equally spaced times
between 0 and 1:
HiQ User Manual
5-34
National Instruments Corporation
Chapter 5
Problem Solvers
If the Graph checkbox was marked when you ran this Problem Solver, you will have generated a graph of the
solution. Notice that you can control which solutions are plotted by using the Graph Options windows.
National Instruments Corporation
5-35
HiQ User Manual
Problem Solvers
Chapter 5
To view the graph:
12. from the Symbol List, double-click on the graph’s name (ivpGraph0, for example).
To generate a script, click on Save Script before running the Problem Solver:
project ivpEqns0, initVector0, ivpMatrix0;
local start, finish, stepSize, relError, absError;
start = 0;
finish = 1;
stepSize = .1;
relError = 1.e-11;
absError = 1.e-9;
Function ivpEqns1(t, x)
arg_a = 1.0;
dxdt[1] = 3*x[1] + 2*x[2];
dxdt[2] = 4*x[1] + x[2];
return dxdt;
end function;
[ivpMatrix0,ivpVector0,finalAbserr0] = OdeIvpRKF(ivpEqns0,
initVector0, start, finish,
stepSize, relError, absError);
You can set up the initial conditions in the Data Editor or you can add the following line above the call
HiQ User Manual
5-36
National Instruments Corporation
Chapter 5
Problem Solvers
to the OdeIvpRKF function.
init_cond = {0,1};
There is a mathematical transformation that is very useful when working with the ODE IVP Problem
Solver. The Problem Solver requires you to enter a coupled system of first-order differential equations.
This means that each equation may include references to the other unknown functions (coupled) but that
it may only contain the first derivative of any one of them (first-order). It is often the case that a differential equation will contain higher order (second, third, etc.) derivatives. The transformation described
here converts a single nth-order differential equation into a system of n first-order differential equations.
This system can then be used in the ODE IVP Problem Solver.
The transformation is best described by example. Suppose you have the following third-order differential
equation involving the unknown function y(t):
y′′′ – 2yy′ + 3y′′ = sin ( t )
To transform it into a system of three first-order differential equations, make the following substitutions:
(1)
x1 ≡ y
⇒
x1 '
= y'
(2)
x 2 ≡ y'
⇒
x2 '
= y''
(3)
x 3 ≡ y''
⇒
x3 '
= y'''
Now, using the above substitutions, you can rewrite the ODE as follows:
x1' = x2
x2' = x3
x3' = 2 x1 x2 - 3 x3 - sin(t)
This is a first-order coupled system: the form that can be used in the ODE IVP Problem Solver. The solution y(t) will be contained in x1 since by substitution (1) we have x1 = y.
National Instruments Corporation
5-37
HiQ User Manual
Problem Solvers
Chapter 5
ODE BO U N D A RY VA L U E
The ODE Boundary Value Problem Solver is used to solve
dx
----dt
= f ( t, x ) , a < t < b
with
g ( x ( a) , x ( b) )
= 0
where x, f, and g are n-dimensional functions defined on the subsets of R1 containing [a,b], Rn+1 and R2n,
respectively.
In the case both f and g are linear, we have the linear problem
dx = A(t)x + C(t), a < t < b
dt
with BClx(a) + BCrx(b) = RHS
where A(t), BCl, and BCr are n by n matrices and C(t) and RHS are n-dimensional vectors.
To start the ODE Boundary Value Problem Solver from the Worksheet, place an ODE Boundary Value Problem Solver Symbol on the Worksheet and double-click on it,
To start the ODE Boundary Value Problem Solver from the Solvers menu, select ODE Boundary Value from
the Solvers menu,
To start the ODE Boundary Value Problem Solver from the Create Menu:
1.
2.
3.
4.
5.
select Create Symbol…,
click on Problem Solver in the left column,
click on ODE Boundary Value in the right column,
type a name, and
click on Create & Edit.
HiQ User Manual
5-38
National Instruments Corporation
Chapter 5
Problem Solvers
The opening view looks like this:
SAM P L E P ROB LE M
Consider a problem described by the one dimensional ordinary differential equation:
d (p(t)dx ) – q(t)x = f(t)
dt
dt
A specific example is a string that is stretched in the transverse direction. We have p = tension = constant, q =
0, f = (orthogonal) force distribution along the string, and we solve for y = transverse displacement at t.
We thus can describe the problem by the linear system:
dx1
= x2
dt
dx2 q
dp
= x –1 x + f
dt p 1 p dt 2 p
National Instruments Corporation
5-39
for 0 < t < 1
HiQ User Manual
Problem Solvers
Chapter 5
subject to the boundary conditions:
x1(0) = 0
x1(1) = 0
In vector matrix form:
dx = A(t)x + C(t), 0 < t < 1
dt
with BClx(0) + BCrx(1) = RHS
where x = (x1, x2)T;
A(t) =
C(t) =
0 1
q p′
p p
= 01
00
0
f
p
BCl = 1 0
00
BCr = 0 0
10
x(0) = (x1(0), x2(0))T
x(1) = (x1(1), x2(1))T
RHS = 0
0
INP UT S
6.
The default number of equations is 3, so select the number of inputs field (n=…) and edit the 3 to 2.
7.
8.
Type the equation coefficients A and C, where f/p = t2.
Type the values of left and right boundary condition matrices and the right hand side vector (RHS) by
double-clicking on each input icon.
HiQ User Manual
5-40
National Instruments Corporation
Chapter 5
Problem Solvers
All of the default values in the Options section are correct.
The setup looks like:
9.
Click on the run button.
O UT P UT
After executing the problem solver,
1.
double-click on the Outputs icons to view the results. bvpMatrix0 contains the time history of x[1] and x[2]
National Instruments Corporation
5-41
HiQ User Manual
Problem Solvers
Chapter 5
corresponding to the 11 equally spaced time steps contained in bvpVector0.
To generate a script, click on Save Script before running the Problem Solver:
function bvpFct0(t)
arg_a = 1.0;
A[1,1]
A[1,2]
A[2,1]
A[2,2]
=
=
=
=
0;
1;
0;
0;
return A;
end function;
function termFct0(t)
arg_a = 1.0;
C[1] = 0;
C[2] = t^2;
return C;
end function;
local
start, finish, stepSize, tolerance, maxStep,
shootAlgorithm, ivpType;
start = 0;
finish = 1;
stepSize = 0.1;
tolerance = 1.0e-6;
HiQ User Manual
5-42
National Instruments Corporation
Chapter 5
Problem Solvers
maxStep = 0.25;
shootAlgorithm = <simple>;
ivpType = <IV_bulr>;
project leftBoundConds0, rightBoundConds0, rightHandSide0;
[bvpMatrix0,bvpVector0] = OdeBvpGenLinear(bvpFct0, termFct0,
leftBoundConds0, rightBoundConds0, rightHandSide0,
start, finish, stepSize, maxStep, tolerance,
shootAlgorithm, ivpType);
Were you to run this script from scratch, you would first have to set up the vectors leftBoundConds0, rightBoundConds0, and rightHandSide0 in the Data Editor as shown earlier in this example.
IN T E G R A L EQ U AT I O N S
The Integral Equation Solver handles the following types of integrals:
Volterra of the First Kind:
t
K(t,s,f(s)) ds = g(t)
a
a≤t≤b
Volterra of the Second Kind:
t
f(t) –
K(t,s,f(s)) ds = g(t)
a
a≤t≤b
Fredholm of the Second Kind:
t
f(t) –
K(t,s,f(s)) ds = g(t)
a
a≤t≤b
where f, K, and g are n-dimensional functions.
To start the Integral Equation Solver from the Worksheet, place an Integral Equation Solver Symbol on the
Worksheet and double-click on it.
To start the Integral Equation Solver from the Solvers menu, select Integral Equations from the Solvers menu,
To start the Integral Equation Solver from the Create Menu:
1.
2.
3.
4.
select Create Symbol…,
click on Problem Solver in the left column,
click on Integral Equations in the right column,
type a name, and
National Instruments Corporation
5-43
HiQ User Manual
Problem Solvers
5.
Chapter 5
click on Create & Edit.
SAM P L E P ROB LE M
Solve the Volterra integral equations of the first kind:
∫
t
e
0
( s – t)
f 1 ( s)
2
t
0
HiQ User Manual
–t
2
t
2
+ f 2 ( s ) ds = 1 – e + ---
(t - s) f22(s)
1 + f12(s)
ds =
5-44
t4
24
National Instruments Corporation
Chapter 5
Problem Solvers
We may express the system of equations by
f ( t)
– ∫ K ( t, s, f ( s ) ) ds =
g ( t)
where
f ( s)
K ( t, s, f ( s ) ) ds
=
= ( f 1 ( s) , f 2 ( s) )
K 1 ( t, s, f ( s ) ) ds
K 2 ( t, s, f ( s ) ) ds
e
=
T
( s – t)
f 1 ( s)
2
+ f 2 ( s)
( t – s) f 2 ( s)
----------------------------2
1 + f 1 ( s)
2
2
g ( t)
=
g1 ( t)
g2 ( t)
1
=
– e –t + t--2
4
t
--24
INP UT S
6.
7.
Set the number of inputs (“n=”) to 2:
Type the following expressions:
8.
Double-click on the Initial Estimate icon to input the initial conditions.
9.
Set the left end point to 0.0, the right end point to 1.0 and the number of mesh points to 11.
National Instruments Corporation
5-45
HiQ User Manual
Problem Solvers
Chapter 5
O P T IO N S
Method choices include:
•
Volterra of the First Kind — see the IntEqnVolt1 function description in the Reference Manual.
•
Volterra of the Second Kind — see the IntEqnVolt2 function description in the Reference Manual.
•
Fredholm of the Second Kind — see the IntEqnFredholm function description in the Reference Manual.
We choose the Volterra of the First Kind.
10. Set the error tolerance to 1.0e-11, maximum iterations to 12, and do not check Deferred Correction.
The final problem setup is shown below:
11. Click on the run button.
O UT P UT
Click on the icons for solnPoints0 and meshPoints0 to view the computed solution and the corresponding
equally spaced mesh.
HiQ User Manual
5-46
National Instruments Corporation
Chapter 5
Problem Solvers
Solution points (for convenience, the matrix has been transposed);
Mesh Points:
The script generated by the Problem Solver looks like:
project kIntEqns0, gIntEqns0, solnPoints0, meshPoints0,
intEqnVector0;
local leftEndPoint, rightEndPoint, numOfEqns,
numUnifMeshPoints, tolerance, maxIterations, defCorrFlag;
leftEndPoint = 0;
rightEndPoint = 1;
numOfEqns = 2;
numUnifMeshPoints = 11;
tolerance = 1.0e-11;
maxIterations = 12;
defCorrFlag = 0;
National Instruments Corporation
5-47
HiQ User Manual
Problem Solvers
Chapter 5
function kIntEqns0(i, t, s, f)
arg_a = 1.0;
select i from
case 1:
return (exp(s-t)*f[1]*f[1]+f[2]);
case 2:
return ((t-s)*f[2]*f[2]/(1+f[1]*f[1]));
end select;
end function;
function gIntEqns0(i, t)
arg_a = 1.0;
select i from
case 1:
return (1-exp(-t)+t*t/2.0);
case 2:
return (t^4/24.0);
end select;
end function;
[ solnPoints0, meshPoints0 ] = IntEqnVolt1(kIntEqns0,
gIntEqns0, leftEndPoint, rightEndPoint, numOfEqns,
numUnifMeshPoints, tolerance, maxIterations, defCorrFlag,
intEqnVector0);
OP T I M I Z AT I O N
The Optimizer is used to solve mathematical programming problems including linear programming, unconstrained linear and nonlinear problems, and constrained linear and nonlinear problems.
To start the Optimizer from the Worksheet, place an Optimizer Symbol on the Worksheet and double-click on
it,
To start the Optimizer from the Solvers menu, select Optimization from the Solvers menu,
To start the Optimizer from the Create Menu:
1.
2.
3.
select Create Symbol…,
click on Problem Solver in the left column,
click on Optimization in the right column,
HiQ User Manual
5-48
National Instruments Corporation
Chapter 5
Problem Solvers
4.
type a name, and click on Create & Edit.
SAM P L E P ROBL EM
Determine the minimum of the function 100 ( x2 – x 12 ) 2 + ( 1 – x 1 ) 2
INP UT S
In the Inputs area,
5.
6.
edit the number of variables to 2.
Enter the expression in the Inputs window.
7.
Double-click on the Initial Conditions icon to input the initial conditions x1=-1.2 and x2=1.0).
100*(x[2]-x[1]^2)^2+(1-x[1])^2
National Instruments Corporation
5-49
HiQ User Manual
Problem Solvers
Chapter 5
O P T IO N S
Method choices include:
•
Conjugate Gradient — see the OptConGradient function description in the Reference Manual.
•
Nelder-Mead — see the OptNelderMead function description in the Reference Manual.
•
Linear Programming — see the OptLinProg function description in the Reference Manual.
•
BFGS — see the OptBFGS function description in the Reference Manual.
•
Constrained Optimization— see the OptNonLinCon function description in the Reference Manual.
8.
Select the Conjugate Gradient with default tolerance 1.0e-10 and maximum iterations = 200.
The final problem setup is shown below:
9.
Click on the run button.
O UT P UT
To inspect the output, click on each of the three output icons.
HiQ User Manual
5-50
National Instruments Corporation
Chapter 5
Problem Solvers
HiQ places the results in optVector0.
The value of the function is 1.064156282444496546e-27 (found in minValue0), and the solution was found in
39 iterations (optIterations0)
To generate a script, click on Save Script before running the Problem Solver:
project optFct0, initVector0;
local tolerance, maxIterations;
tolerance = 1.0e-10;
maxIterations = 200;
function optFct1(x)
arg_a = 1.0;
return (100*(x[2]-x[1]^2)^2+(1-x[1])^2);
end function;
[minValue0,optVector0,optIterations0] =
OptConGradient(optFct0, initVector0, tolerance, maxIterations);
DATA FI T T I N G
The Data Fitter finds the best fit of a function to a set of data; it fits data by least squares.
To start the Data Fitter from the Worksheet, place a Data Fitter Symbol on the Worksheet and double-click on
it,
To start the Data Fitter from the Solvers menu, select Data Fitting from the Solvers menu,
To start the Data Fitter from the Create Menu:
1.
2.
select Create Symbol…,
click on Problem Solver in the left column, click on Data Fitting in the right column,
National Instruments Corporation
5-51
HiQ User Manual
Problem Solvers
3.
Chapter 5
type a name, and click on Create & Edit.
The Data Fitter problem solver enables you to fit data with two basic methods: linear estimation (line fit,
polynomial fit, and general fit) and nonlinear estimation.
HiQ User Manual
5-52
National Instruments Corporation
Chapter 5
Problem Solvers
SAM P L E P ROBL EM
Consider the following data:
X
Y
1880
50.2
1890
62.9
1900
76.0
1910
92.0
1920
105.7
1930
122.8
1940
131.7
1950
151.1
1960
179.3
1970
203.3
1980
226.5
L INE F IT
Let's use the Data Fitter to fit a curve to these data. To fit a line (i.e., f(x)=c1 + c2x),
1.
2.
3.
4.
5.
6.
7.
8.
!
click on the xVector0 icon to change its name. With the icon and name highlighted, type “X”.
Double-click on the X icon to input the year data.
Select Get Info… from the Matrix menu and change the number of rows to 11.
Click on OK.
Type the data for X.
Click on the Data Editor’s close box and click on Yes when asked whether to save the data.
Click on the yVector0 icon and type “Y” to change its name.
Double-click on the Y icon, change its row dimension to 11, type the measurement data, and close the editor
window.
xVector and yVector must be of the same dimension.
When you generate a graph, you have two choices. “Smooth Curve” allows you to choose how many points
will be used to draw the fitted curve. The default number of 256 will produce a reasonably smooth line. “Use
National Instruments Corporation
5-53
HiQ User Manual
Problem Solvers
Chapter 5
Input Data” draws a curve using the same number of points as contained in the input data vector.
9. Click on the run button.
10. Double-click on the lineFitCoefficients0 and lineFitResidual0 icons to view the coefficients and the sum
squares of residuals of the resultant line.
HiQ User Manual
5-54
National Instruments Corporation
Chapter 5
Problem Solvers
11. From the Symbol List, select lineFitGraph0 and click on Edit.
To generate a script, click on Save Script before running the Problem Solver:
local i;
project X, Y;
[lineFitCoefficients0,lineFitResidual0] = lineFit(X, Y);
The script assumes you have previously set up X and Y in the Data Editor .
P O LYNOM I A L F I T
To compute a third degree polynomial fit (i.e., c1 + c2x + c3x2 + c4x3) using the same data:
1.
2.
!
Click on Polynomial Fit in the Estimation Type group in the Options area.
We'll fit a curve of degree 3 to the data, so set m=3 in the Polynomial Degree box in the Inputs area.
Remember that the xVector, yVector, and weights vector must be of the same dimension.
3.
4.
Polynomial fit requires weights associated with each input data point (X,Y), so double-click on the weight0
icon to view the default weights. The weights vector will be of the same dimension as the inputs and a
default value of one will be assigned to each cell. We’ll use the default weights for this example.
Be sure that the Graph checkbox at the bottom of the window is checked to generate a graph of the data
National Instruments Corporation
5-55
HiQ User Manual
Problem Solvers
Chapter 5
and the fitted line.
5.
6.
Click on the run button.
Double-click on the polyCoefficients and polyResidual icons to view the coefficients and the sum squares
of residuals of the resultant polynomial fit.
HiQ User Manual
5-56
National Instruments Corporation
Chapter 5
Problem Solvers
7.
From the Symbol List, select polyFitGraph0 and click on Edit.
The script from this problem is:
project X, Y, weight0;
local A, b, U, V, S, polyDegree, tolerance, i, j;
polyDegree = 3;
tolerance = 1.0e-11;
[A,b] = formPolyFit(polyDegree, X, Y, weight0);
[U,S,V] = SVD(A);
[polyCoefficients0, polyResidual0] = SVDfit(U, V, S, b,tolerance);
METHODS
For more information on the methods used in the Data Fitting Problem Solver see the appropriate function
descriptions in the Reference Manual:
Method
Function
Linear Estimation
Line fit
lineFit
Polynomial fit
formPolyFit
General fit
formLSFit
Nonlinear Estimation
National Instruments Corporation
5-57
genFit
HiQ User Manual
CHAPTER 6
T HE G RAPH E DITOR
HiQ's Graph Editor is a fully interactive 2-dimensional (2D) and 3-dimensional (3D) plotting facility. You can
control the graph environment including axes, labels, and plot types. Once a graph has been generated, you
may use your mouse to change the graph's orientation, perspective, size, and rendering mode. Presentation
quality printing is available, and most Graph Editor functionality is available through the HiQ-Script language.
Worksheet
Numeric
Data
Graphs
Scripts
Problem
Solvers
HiQ-Script
Built-In Functions
EN T E R I N G
AND
EX I T I N G
THE
GRAPH EDITOR
As with the other editors, you have a choice of three methods to create a symbol and load it into the Graph
Editor:
•
place a graph Symbol on the Worksheet, then double-click on it;
•
click on New in the Symbol List to bring up the Create Symbol dialog box, or
•
select the Create Symbol… command from the File menu to bring up the Create Symbol dialog box.
You can have multiple Graph Editor windows open simultaneously, and closing the Graph Editor window
exits the editor.
National Instruments Corporation
6-1
HiQ User Manual
The Graph Editor
Chapter 6
GRAPH EDITOR SY M B O L S
The Graph Editor operates on graph symbols. A graph encompasses axes and their labels, the graph’s title,
rendering attributes such as orientation, size, and lighting, and one or more plots. A graph symbol stores all
the information necessary to build a graph, including all plots associated with it.
In HiQ there is an entity called a plot symbol, which holds only the data necessary to render a plot on a graph;
hence a plot symbol can only be viewed when used in the context of a graph. Though you will not use plot
symbols directly in the Graph Editor, the last two sections in this chapter explain how to use HiQ-Script to
build a plot which is added to a graph. A graph constructed in HiQ-Script may subsequently be loaded into
the Graph Editor for viewing and editing. Conversely, a graph constructed in the Graph Editor may be modified within a script.
PR E PA R I N G
A
NE W 2D GR A P H
To set up a new 2D graph,
1.
2.
3.
4.
select the 2D graph tool, then
click on the Worksheet to place the Symbol.
With the Selection tool active, click on the graph’s Symbol and press Return.
Edit the name to something appropriate, like “TestGraph.”
5.
Double-click on the TestGraph icon.
HiQ User Manual
6-2
National Instruments Corporation
Chapter 6
The Graph Editor
You will see the Graph Editor open onto a default 2D graph.
The controls along the left side of the Graph Editor window allow you to manipulate the graph (see Modifying the Graph Editor View, later in this chapter).
AD D I N G
A
2D PL O T
In this section we will see how to create a plot of a function, a vector (or row or column of a matrix), and parametric curve.
F UNCT I ON P L OT
Let's plot the function
sin(x) * cos(2*x)
from -π to π.
National Instruments Corporation
6-3
HiQ User Manual
The Graph Editor
Chapter 6
6.
Select Add Plot… from the Plot menu.
7.
8.
9.
10.
Move to the equation field by pressing the tab key.
Type the equation for y(x): sin(x)*cos(2*x)
Tab to the Steps field and type in 100.
Click on Add. (Cancel dismisses the Add Plot dialog box without performing an action.)
The new plot is added to the graph.
HiQ User Manual
6-4
National Instruments Corporation
Chapter 6
The Graph Editor
DATA P L OT
Creating a plot of data residing in a vector or matrix is similar to the procedure outlined above. x and y values
may come from any vector or matrix symbols in the Worksheet.
To keep things simple for now, let's assume we have a vector x which represents the domain, and a matrix y
one column of which represents the range:
x=
1
2
3
4
5
y=
1 4 9 16
4 9 16 25
9 16 25 36
16 25 36 49
25 36 49 64
25
36
49
64
81
If you wish to follow along with this example, you’ll need to create the x and y symbols. Creating an integer
vector and matrix in the Data Editor is the most expedient approach. If you have looked ahead to the HiQScript language and want to try out something simple, the following script will create both symbols:
for i=1 to 5 do
x[i] = i;
for j=1 to 5 do
y[i,j] = (i+j-1)^2;
end for;
end for;
1.
2.
3.
Create a new 2D graph and open it into the Graph Editor.
Select Add Plot… from the Plot menu.
To select the range data, pull down the Range menu and select Data.
4.
Click on Select to bring up the range dialog box.
National Instruments Corporation
6-5
HiQ User Manual
The Graph Editor
Chapter 6
5.
Click on y in the list of numeric symbols. Since y is a matrix, you must select a row or column, so enter 4
in the Row field.
6.
Click on OK.
You cannot insert a number in both the Row and Column fields.
7.
To select the domain data, pull down the x menu and select Vector.
8.
Click on Select and choose x from the list of symbols.
9.
Click on OK.
HiQ User Manual
6-6
National Instruments Corporation
Chapter 6
The Graph Editor
The final plot setup should look something like:
10. Click on Add.
PARAM E TR I C C U RV E
A parametric curve is one in which both the x and y values are a function of a single variable. A circle could
be defined as
x = sin(t) and y = cos(t)
as t goes from -π to π.
1.
Create a new 2D graph and open it into the Graph Editor.
National Instruments Corporation
6-7
HiQ User Manual
The Graph Editor
Chapter 6
2.
3.
Select Add Plot… from the Plot menu.
Select P-Curve as the Plot Type
4.
5.
6.
Type sin(t) for x(t) and cos(t) for y(t).
Be sure Interval is selected for t (the other choice is to define t from a vector).
Set the range of t to -π to π with 256 steps.
7.
Click on Add.
HiQ User Manual
6-8
National Instruments Corporation
Chapter 6
The Graph Editor
SE T T I N G UP
THE
GR A P H ' S AX E S
Selecting Axis Options… from the Graph menu allows you to control
•
•
•
•
axis title,
range,
scaling, and
label notation and placement.
The Axis Options dialog box appears as follows:
The axis name is a pull down menu which allows you to select the x, y, or (in the case of a 3-dimensional
graph) the z axis.
The Range group allows you to specify the range of values covered by the axis. If the Auto Clip graph option
is active (see the next section), the From and To specifications are dimmed, since you have specified no manual control of these parameters. Divs allows you to modify the grid to your liking (See the next section for
grid control). The number specified here inserts minor grid lines between the major grid lines. Hence, if major
grid lines fell at 0, 2, 4, etc., setting Divs to 1 would force minor grid lines at 1, 3, 5, etc.
You can select either Linear or Log scaling.
Label notation can be either scientific or decimal.
In the case of a 2D graph, normal axis label placement has the y-axis labels along the left side of the graph
and x-axis labels at the bottom. Should you wish to place the x-axis labels along the top of the graph or the yaxis labels along the right side, select Reverse in the Placement group.
Select Vertical Title and Vertical Labels to rotate the axis title and labels 90 degrees.
Clicking on Cancel dismisses the dialog box without making any changes that you may have specified. Apply
makes your changes without dismissing the dialog box, and OK makes changes and dismisses the dialog box.
National Instruments Corporation
6-9
HiQ User Manual
The Graph Editor
Chapter 6
SE T T I N G GR A P H OP T I O N S
To control the more general aspects of your graph, select Graph Options… from the Graph menu.
Any or all of the following items may be chosen:
•
Graph Title: specifies the title shown at the top of the graph.
•
Show Title: if you don't want a title to appear, click to remove the “x.”
•
Show Axes: when turned off, both axes and grids disappear.
•
Show Grids: select this item to turn on grids. Both major and minor grid lines will be added to the graph with
spacing specified by Axis Options (see previous section). If Show Axes is not selected, you can't select Show
Grids.
•
Show Labels: controls the existence of text and numeric axis labels. This button does not control the graph title
or plot labels.
•
Show Legend: when selected a legend appears in the lower right corner of the graph.
•
Auto Clip: this selection limits the axes to bound the plot(s) as they are defined. The graph's axes will be
adjusted for any plots added or removed. With this item selected, you may not modify axis ranges in the Axis
Options dialog box (see previous section).
•
Auto Scale: (Only for 3D graphs) when selected, Auto Scale causes the three axes to be scaled separately to
make the clipping box appear a cube.
For example, the default 3D graph's axes are scaled from -2 to 2. Consider the auto scale effects on a graph
whose x-axis is rescaled to -4 to 4:
HiQ User Manual
6-10
National Instruments Corporation
Chapter 6
The Graph Editor
with auto scale selected:
with auto scale not selected:
Clicking on Cancel dismisses the dialog box without applying any changes that you may have specified.
Apply sets your changes without dismissing the dialog box, and OK applies changes and dismisses the dialog
box.
MO D I F Y I N G
THE
GR A P H VI E W
The controls along the left side of the Graph Editor window allow a wide range of manipulation possibilities.
Clicking on the Selection tool allows you to select an individual plot. Holding the shift key down while clicking allows you to select multiple plots.
The Zoom tool is used to scale the graph while maintaining the current aspect ratio. Zooming does not affect
the size or style of any text labels or the placement of the graph title.
Changing the graph size is accomplished by dragging towards the top of the graph (decreases graph size) or
towards the bottom of the graph (increases size of graph).
National Instruments Corporation
6-11
HiQ User Manual
The Graph Editor
Chapter 6
With the previously defined graph in the window,
1.
2.
click on the Zoom tool, and
with the mouse near the center of the graph, click and drag towards the title. Notice the expanding box
becoming smaller as you move the mouse, and the percentage of full size value appearing in the lower left
corner of the graph.
The modified graph should be similar to this:
To increase the size of the graph, drag towards the bottom of the graph window.
HiQ User Manual
6-12
National Instruments Corporation
Chapter 6
The Graph Editor
To return the graph to its original size, select Fit to Window from the Graph menu. You can also double-click
on the zoom tool to execute the Fit to Window command.
The graph's aspect ratio may be modified both vertically and horizontally with the Scale tool.
To decrease the height of the graph,
1.
2.
click on the Scale tool and
click and drag vertically, towards the top of the graph.
As with the Zoom tool, you will see a expanding box indicating the size of the modified graph.
The result looks like this:
National Instruments Corporation
6-13
HiQ User Manual
The Graph Editor
Chapter 6
To expand or contract the graph horizontally, drag the mouse to the left (graph becomes wider) or right (graph
becomes narrower).
Both horizontal and vertical dimensions may be adjusted simultaneously by dragging the mouse diagonally.
Double-clicking on the Scale tool executes a Fit to Window command.
The Move tool allows you to reposition the graph in the window. Annotations directly associated with the
graph (axis labels and values, plot label) move along with it, but others including the graph title stay put.
To move the graph (assuming for this example that you might have previously decreased its size),
1.
2.
click on the Move tool,
click and drag the mouse from the center of the graph to another position.
You will see a rectangle move along with the mouse to indicate the graph's future position.
The result should look like this:
HiQ User Manual
6-14
National Instruments Corporation
Chapter 6
The Graph Editor
Holding down the shift key while dragging constrains the direction to the first motion: if your first direction is
horizontal, as long as you hold the shift key down, you will only be able to move the graph to the left or right.
Releasing the shift key lifts the constraint.
Double-clicking on the Move tool will recenter the graph.
Use the Magnify tool to center the graph about a specific point and zoom in on that point.
To magnify an area of the graph:
1.
2.
click on the Magnify tool, then
click on at an interesting point and drag to increase the size of the zoom box. We'll center the zoom about
the [0,0] point, then increase the box to include the nearest local maximum and minimum. Notice that
dragging the mouse outwards from the click point expands the zoom box, and dragging it closer to the click
point contracts the box.
The magnified view follows:
National Instruments Corporation
6-15
HiQ User Manual
The Graph Editor
Chapter 6
Double-clicking on the Magnify tool will recenter the graph and reset it to its original size.
The remaining graph view controls are not appropriate to 2D graphs and will be discussed when we move to
the third dimension later in this chapter.
Remember that you can reset the graph to its default view by selecting Default View in the Graph menu.
LI N E S , MA R K E R S ,
AND
CO L O R
In this section, we'll see how to change a plot's markers, line type and color, and other features. Previous
examples have used a plot which was rendered with 100 points for smoothness; now we'll create the same
plot, but with only 20 points, thus providing a better view of the underlying structure.
To follow along on your own graph,
1.
2.
3.
4.
5.
open the TestGraph symbol into the Graph Editor,
select Plot1 using the Selection tool,
select Change Plot… from the Plot menu,
enter 20 in the Steps field,
click on OK.
P L OT RE N D ER I N G
The plot may be drawn in one of three modes:
•
•
•
Curve: line segments between points, no markers at individual data points (default),
Point: markers drawn at data points without connecting line segments, and
Segment: markers and line segments.
To experiment with these options,
HiQ User Manual
6-16
National Instruments Corporation
Chapter 6
The Graph Editor
1.
2.
3.
click on the Selection tool,
click on the plot to select it, and
select Show as Curve, Show as Points, and Show as Segments from the Plot menu.
The Segments view should resemble the following graph view:
You can control colors for fill, lines, markers, and text associated with the plot. To change the color of one of
these items,
1.
2.
with the Selection tool active, click on the plot to select it,
click on one of the following tools:
Fill (3D only),
Line,
Marker, or
Text
3.
Click on a color in the color palette (If you're working with a monochrome monitor, the little squares will
be either black or white, or shades of gray.)
To vary the plot's line width,
4.
with the Selection tool active, click on the plot to select it and
National Instruments Corporation
6-17
HiQ User Manual
The Graph Editor
5.
Chapter 6
choose the desired width from the line width menu.
To vary the plot's line type,
6.
with the Selection tool active, click on the plot to select it and
7.
choose the desired type from the line type menu.
To change the plot's marker shape,
8.
9.
with the Selection tool active, click on the plot to select it and
click on the desired marker shape button.
This palette is only available when a 2D plot is displayed in Point or Segment format.
Colors, line widths, and marker type choices are also available through the Plot Options… entry in the Plot
menu.
The Hide Edges and Hide Backfaces options are not appropriate for 2D plots and are thus dimmed.
HiQ User Manual
6-18
National Instruments Corporation
Chapter 6
The Graph Editor
CU RV E TR A C K I N G
There may be a time when you wish to know the coordinates of a point on the plot. To activate the Graph Editor's curve tracking facility,
1.
2.
3.
4.
select a plot,
click on the Trace tool,
click anywhere on the plot, and
drag left or right.
As you move the mouse, the cursor's x-coordinate and the plot's corresponding
y-coordinate are displayed at the bottom of the window.
PR E F E R E N C E S
The preferences dialog box under the Graph menu affords you the opportunity to specify how the graph is to
be drawn.
The popup menu offers three offscreen drawing choices:
•
•
•
Automatic Depth: HiQ does its best to render the graph as smoothly as possible and provides dithering for use
with monochrome monitors. This is the slowest rendering method; you will see redraws occur as though a curtain were being drawn from the top of the Graph Editor window to the bottom.
8-Bit Pixel Depth: The graph is drawn to an off-screen bitmap and updates are significantly faster if the graph
hasn't changed. It also uses less memory than Automatic Depth.
Off: This method requires a full redraw of the graph every time the window needs to be updated, even if the
graph hasn't changed. Significantly less memory is used.
National Instruments Corporation
6-19
HiQ User Manual
The Graph Editor
Chapter 6
You can set the offscreen drawing level for subsequent graphs by selecting Preferences For… from the File
menu.
PR E PA R I N G
A
NE W 3D GR A P H
To set up a new 3D graph,
1.
2.
3.
select the 3D graph tool, then
click on the Worksheet to place the Symbol.
Press the return key and edit the default name to something appropriate, like
“Test3DGraph.”
4.
Double-click on the Test3DGraph icon.
AD D I N G
A
3D PL O T
In this section we will see how to create a plot of a function, matrix, and parametric surface.
F UNCT I ON P L OT
Let's plot the function
sin(x) * cos(y)
for both x and y going from -π to π.
1.
Select Add Plot… from the Plot menu
HiQ User Manual
6-20
National Instruments Corporation
Chapter 6
The Graph Editor
2.
Type the equation for z(x,y) as shown.
3.
Click on Add. Cancel dismisses the dialog box without changing the graph.
The plot is rendered in hidden line mode by default. The following pictures assume that Show Grids has been
deselected in the Graph Options… dialog box.
DATA P LOT
Creating a surface plot of existing data is similar to the 2D situation explained earlier in this chapter, except
that you need to define a vector for the x- and y-axis values and a matrix defining the surface value for each x
and y. Keep in mind that the x- and y-vectors may be rows or columns of a matrix.
National Instruments Corporation
6-21
HiQ User Manual
The Graph Editor
Chapter 6
Creating a matrix with enough data points to generate a meaningful surface would require a lot of effort in the
Data Editor. The solution is to write a script and let HiQ do most of the work. You may wish to postpone following this example until you have become familiar with HiQ-Script and the HiQ-Script Editor.
Let's plot the data generated by the following script:
for i=1 to 20 do
x[i] = i;
y[i] = i;
for j=1 to 20 do
z[i,j]=(i-10)^2*(j-10)^2;
end for;
end for;
Assuming you have created x, y, and z as defined above,
1.
2.
3.
4.
5.
6.
7.
8.
9.
10.
11.
Create a new 3D graph and open it into the Graph Editor.
Select Add Plot… from the Plot menu.
To select the range data, pull down the range menu and select Data.
Click on Select.
Click on the z matrix in the list of numerical symbols and click on OK.
To select the x-axis domain data, pull down the x menu and select Vector.
Click on Select.
Click on x in the list of numeric symbols and click on OK.
To select the y-axis domain data, pull down the y menu and select Data.
Click on Select.
Click on y in the list of numeric symbols and click on OK.
HiQ User Manual
6-22
National Instruments Corporation
Chapter 6
The Graph Editor
The final plot setup should look something like:
12. Click on Add.
PARAM E TR I C P LOT
To plot a sphere, we'll use the equations
x(u,v) = sin(u) * cos(v)
y(u,v) = sin(u) * sin(v)
z(u,v) = cos(u)
as u goes from 0 to π and v goes from 0 to 2π.
After creating a new graph,
1.
Select Add Plot… from the Plot menu.
National Instruments Corporation
6-23
HiQ User Manual
The Graph Editor
Chapter 6
2.
3.
Select P-Surface for Plot Type.
Type the above equations for x(u,v), y(u,v), and z(u,v).
4.
Type the u and v ranges and a reasonable number of steps (like 20).
The resulting graph should resemble:
GR A P H RE N D E R I N G
The graph may be rendered in any of four modes by selecting the appropriate item from the Graph menu:
HiQ User Manual
6-24
National Instruments Corporation
Chapter 6
The Graph Editor
•
Wire Frame - all lines are visible.
•
Hidden Line - from the viewer's perspective, hidden lines are removed.
National Instruments Corporation
6-25
HiQ User Manual
The Graph Editor
Chapter 6
•
Shaded - color shade is a function of the surface's z-value.
•
Lighted - the surface is lighted from a variable direction as described later in this chapter.
HiQ User Manual
6-26
National Instruments Corporation
Chapter 6
The Graph Editor
MO R E MO D I F I C AT I O N S
OF THE
GR A P H VI E W
The controls in the 2-dimensional graphing section are available here and are supplemented by several controls specifically geared towards 3-dimensional graphs. Select, Zoom, Scale, Move, Magnify, and Trace work
essentially the same as for 2-dimensional graphs.
Use the Rotate tool to view the graph from a different vantage point.
1.
2.
Click on the Rotate tool and
click and drag the mouse from the center of the graph towards the left.
A box will follow the mouse to indicate the graph's future orientation. You'll notice that the mouse seems
attached to the front of the graph: moving the mouse to the right rotates the box in a counterclockwise direction, and moving the mouse up rotates the front of the box up.
After this rotation, the graph ends up in the following orientation.
National Instruments Corporation
6-27
HiQ User Manual
The Graph Editor
Chapter 6
If you don't like the new orientation of the graph, you have several choices:
•
•
•
select Default View from the Graph menu,
double-click on the Rotate tool, or
select Undo from the Edit menu. Undo is capable of reversing only one action, so if you rotate the graph to orientation one, then rotate to orientation two, then select Undo, the graph will be returned to orientation one.
Holding the shift key down while using the rotate tool will constrain the rotation to the initial motion of the
mouse, either left and right (rotation about the current vertical axis) or up and down (rotation about the current horizontal axis).
L IG H T IN G
Point source lighting is available by selecting the Lighted option from the Graph menu. Changing lighting
options may be accomplished through the Lighting… item in the Graph menu and the Lighting tool.
Selecting Lighting... from the Graph menu displays the following dialog box:
The default lighting direction is latitude 45 deg and longitude 0 deg. This corresponds to light coming from a
position looking along the x-axis towards the origin and 45 degrees up from the x-y plane.
To light the surface from a direction similarly 55 degrees above the horizontal, but this time from the x-z
plane,
1.
select Lighting… from the Graph menu,
HiQ User Manual
6-28
National Instruments Corporation
Chapter 6
The Graph Editor
2.
3.
set Latitude to 55,
set Longitude to 90, and
4.
click on OK.
The other method of setting the lighting angle is to use the Lighting tool.
1.
2.
click on the Lighting tool,
click on somewhere (anywhere) in the graph area and hold down the mouse button. In a moment, you will
see a globe lighted from the current lighting direction. (The lighting globe may not appear instantly.)
National Instruments Corporation
6-29
HiQ User Manual
The Graph Editor
Chapter 6
If you move your mouse around, you'll notice that the black dot moves about on imaginary latitude and longitude lines. When the dot is solid, lighting is on the near side of the globe; when the dot is hollow, the lighting
is on the hidden side of the globe. With some experimentation, you should be able to move the dot to any
position on the globe. The dot represents where the light will be coming from, assuming the graph is in the
center of the globe.
When you have moved the dot to a new location, release the mouse button to see the new lighting scheme.
With Lighting turned on, you also have the option of rendering the graph as a transparent surface. With the
graph selected, select Transparency from the Graph menu. along with the degree of transparency from 0 to
100%,
P E RSP E C TI V E
To turn on perspective,
1.
select Perspective from the Graph menu.
Once perspective is activated, you may modify the focus point by using the Focus tool.
2.
3.
Click on the Focus tool, then
click near the center of the graph and drag up and to the right.
A 3D outline will indicate the future perspective of the graph.
HiQ User Manual
6-30
National Instruments Corporation
Chapter 6
The Graph Editor
4.
Release the mouse button to reveal:
This new view of the graph may be modified with all the previously described controls.
CO NTO U R
To display a plot as a series of contour lines, make sure the plot is selected and select Show as Contour…
from the Plot menu. Choose the contour parameters when this dialog box appears:
You can specify the range of contours and the number of contours in terms of step size or number of steps.
National Instruments Corporation
6-31
HiQ User Manual
The Graph Editor
Chapter 6
The example below is rendered in hidden line mode; the other three rendering methods work as well.
To project contour lines onto one of the three planes, select Project to X-Plane, Project to Y-Plane, or Project
to Z-Plane from the Plot menu. Selecting No Projection turns off the projection.
The surface may be displayed in any desired mode including surface, contour or points with any of the available rendering methods. The following example shows a surface in hidden line mode with the grids turned
off. Projection is to the Z-Plane.
HiQ User Manual
6-32
National Instruments Corporation
Chapter 6
The Graph Editor
AN I M AT I O N
The Graph Editor’s animation facility enables you to string a series of graph views into a movie. This works
for both 2- and 3-dimensional graphs, and the movie can be recorded in black and white or color.
Movie controls are located on the Animation palette.
•
Rewind—positions the movie at the first frame.
•
Fast Reverse—if no animation is currently playing, this button rapidly decrements the frame counter. If an animation is in progress, the movie is played backward as fast as possible, skipping frames as specified in the Animation Options dialog box.
•
Reverse Play—plays the animation backward at standard play speed
•
Stop—terminates the replay of the movie.
•
Play—plays the movie
•
Fast Forward—Fast Forward rapidly increments the frame counter if no movie is currently playing. If an animation is in progress, the movie is played as rapidly as possible skipping frames as specified in the Animation
Options dialog box.
•
Pause—pauses playback of an animation sequence. While the movie is paused the button will blink until it is
clicked on again to restart the movie.
•
Record—initiates recording of an animation sequence. While a sequence is being recorded, the Record button
remains highlighted and every change to the graph causes a new frame to be recorded. Press Record a second
time to stop the recording.
•
Frame—while a recording is in progress and paused, the Frame button causes the current state of the graph to be
captured as a frame in the animation sequence. This allows more than one change to the graph to be included in
one frame. During playback, the Frame button advances the movie one frame at a time.
To see how the recording process works, let’s follow through a short recording session with a two-dimensional graph.
1.
Create a new graph and add the plot (sin(x)*cos(2*x) from -π to π.)
National Instruments Corporation
6-33
HiQ User Manual
The Graph Editor
2.
Chapter 6
Select New Movie from the Animation menu.
The movie is stored in a symbol which is named using the contents of the Title field.
Type is partially under your control and partially a function of the type of equipment you are using.
!
•
Bit Map (B&W)—can be chosen from any monitor. Once the movie is recorded in this mode, all color information will be lost. Bit map movies take up the least amount of storage and are the fastest of the three to replay.
•
Pix Map (256 colors)—color information will be captured. Pix Map movies tend to consume large amounts of
storage but are relatively fast to replay.
Playing a color movie on a black and white monitor may result in unexpected results unless the Dithered
option is set (see below).
•
PICT—movie data is stored in standard PICT format. PICT movies store complete color information, use a
medium amount of storage, and are slow to replay.
The other options are:
•
Snapshot Offscreen—movies are recorded in one of two places, either directly from the screen or from an offscreen buffer. Movies taken from the screen will retain the current monitor’s resolution, while off screen recording is done with “perfect” resolution. Of course, an offscreen recording will take on the resolution of the
playback monitor.
HiQ User Manual
6-34
National Instruments Corporation
Chapter 6
The Graph Editor
•
Dithered—if the Dithered option is selected at record time, a color movie played back on a monochrome monitor will be dithered.
Dithered
Not Dithered
•
Always Spool—as much of the movie as possible is kept in the computer’s memory when this option is not
selected. Always Spool means that every frame will be stored on disk (and read from disk when the movie is
replayed), which will make for a relatively slow playback.
3.
4.
5.
Type a title for your movie,
select black and white or color for the movie type, and
click on OK.
To start the recording,
6.
click on the Record button.
HiQ is waiting for you to make a change to the graph. Any action which changes the state of the graph will be
recorded as a frame in the movie. Zooming, panning, adding another plot, changing a title, or modifying the
grid will be recorded, but clicking on a tool will not cause a frame to be recorded.
Start with moving the graph towards the right side of the window:
7.
8.
Click on the Drag tool, then
in three steps move the graph to the right.
Each time you release the mouse button to set the graph’s new position, there is a delay while the frame is
recorded and the frame counter is incremented.
9. In several steps move the graph back to the center of the window.
10. Select Graph Options from the Graph menu and change the graph’s title. Click on OK.
11. Select Axis Options from the Graph menu and change the x-axis title to “Time” and the y-axis to “Radius.”
Click on OK.
12. In three steps move the graph to the right.
13. click on the Record button to stop recording.
To rewind the movie,
14. click on the Rewind button.
The frame counter is reset to zero.
15. Click on Play.
The frames you recorded are played back.
National Instruments Corporation
6-35
HiQ User Manual
The Graph Editor
Chapter 6
16. Click on the Stop button to turn off play mode.
If you want to start the movie from a specific frame, select Go To Frame… from the Animation menu.
To change the speed of movie playback change the Frame Rate in the Movie Options dialog box (Movies
menu). A reasonable rate is between 1 and 20.
To play the movie over and over, select Loop from the Animation menu, then click on the Play button. Stop
the playback at any time with the Stop button.
Saving and restoring your work may be accomplished with the following commands from the Animation
menu:
•
Save Movie As…—saves the movie to a new symbol name. You are left editing the movie under the new name.
•
Save Movie—saves the current state of the movie.
•
Save Movie Copy…—saves the movie to a new symbol. You are left editing the original movie.
•
Revert Movie—recalls the last saved version of the movie.
Since a movie is a symbol just like a matrix or graph, you can access it as you would any other symbol.
To place a Symbol on the Worksheet,
1.
2.
click on the movie’s name in the Symbol List and
click on Place.
To view a movie,
3.
4.
click on the movie’s name in the Symbol List and
click on Edit.
5.
double-click on the movie’s Symbol on the Worksheet.
or
The movie window is used for playback only; no editing is possible. The Animation menu from the Graph
Editor is present with only playback features accessible.
PR I N T I N G
To print the current contents of the Graph Editor, select Print from the File menu.
When you print a HiQ graph with the File menu Print command, a dialog box appears for specifying print
options. The option that allows you to choose black & white printing versus color/grayscale printing greatly
influences both the appearance of the printed graph and the time it takes to print the graph.
If you are displaying graphs on a color monitor or grayscale monitor, the color/grayscale print option produces output more closely matching what you see on the screen, but is relatively slow to print. The black and
white print option produces acceptable draft-quality printouts in many cases, but only if you select the graph
option “Automatic Depth”. The “Automatic Depth” option, which activates a dithering algorithm, has no
effect on the displayed graph. You cannot display a black and white version of the graph, because you are
working with a color/grayscale monitor.
If you are displaying graphs on a black and white monitor, you should set your default graphics editor preference to “Automatic Depth”. Dithering is necessary to get acceptable-looking graphs on a black and white
monitor. When printing graphs, the black & white print option provides acceptable draft-quality printouts,
HiQ User Manual
6-36
National Instruments Corporation
Chapter 6
The Graph Editor
matching the graph displayed on your screen. At a cost in printing time, the color/grayscale option produces
better-looking output. You cannot preview the printed grayscale graph, because you are working with a black
and white monitor.
HI Q- SC R I P T AC C E S S
TO THE
GRAPH EDITOR
Most of the Graph Editor's functionality is available through HiQ-Script built-in functions. The remainder of
this chapter takes you through building 2- and 3-dimensional plots with HiQ-Script functions. Before using
the Graph Editor functions, you'll need to be familiar with basic concepts of the HiQ-Script language and its
editor, so spend some time with the next two chapters, then return.
In this section we will build a 2-dimensional graph consisting of two plots and a 3-dimensional surface plot of
a data set.
A 2D GR A P H WI T H HI Q- SC R I P T
To create a graph in HiQ-Script, you will first define a plot and modify it to your requirements, then define a
graph context, and finally add the plot to the graph. Plots and graphs can be project variables, which means
that they will be listed in the Symbol List and graphs may be placed on the Worksheet. Once you have created
a graph in HiQ-Script, you can view your handiwork in the Graph Editor.
As an example, we will plot the two functions 4*x and x^2.
Local x,y1,y2,i;
// First create a 2D graph and give it the
// title "2D Graph"
g = new2DGraph("2D Graph");
// Set up the three vectors
for i = 1 to 20 do
x[i] = i;
y1[i] = i^2;
y2[i] = 4*i;
end for;
// Define plot p1 with the title "Plot of x^2"
// x is the domain vector
// y1 is the range vector
p1 = new2DDataPlot("Plot of x^2",x,y1);
// Define plot p2 with the title "Plot of 4x"
// x is the domain vector
// y2 is the range vector
p2 = new2DDataPlot("Plot of 4x",x,y2);
National Instruments Corporation
6-37
HiQ User Manual
The Graph Editor
Chapter 6
// Add plot p1 to graph g
addPlot(g,p1);
// Add plot p2 to graph g
addPlot(g,p2);
The graph, g, and plots p1 and p2 are project variables which will show up in the Symbol List. To view the
graph,
1.
2.
3.
open the Symbol List by choosing Symbol List from the File menu,
select the graph (g), and
click on Edit.
A 3D GR A P H
WITH
HI Q- SC R I P T
3-Dimensional graphs work the same as the 2D variety: you create the 3D graph, define the data for your
plots, then add the plots to the graph.
local x,y,z,i;
// First create a 3D graph and give it the
// title "3D Graph"
g3d = new3DGraph("3D Graph");
// Set up the x and y vectors
HiQ User Manual
6-38
National Instruments Corporation
Chapter 6
The Graph Editor
for i = 1 to 21 do
x[i] = (i-1)*<pi>/20;
y[i] = x[i];
end for;
// and the matrix which defines the surface
for i = 1 to 21 do
for j = 1 to 21 do
z[i,j] = sin(x[i]*y[j]);
end for;
end for;
// Create a new 3D data plot with the title
// "sin(xy)"
p = new3DDataPlot("sin(xy)",x,y,z);
// Render the graph as a hidden line graph. Other
// choices include wireFrameGraph, heightShading,
// and lightSourceShading
hiddenLineGraph(g3d);
// Add the plot to the graph
addPlot(g3d,p);
The graph, g3d, and plots p are project variables which will show up in the Symbol List. To view the graph,
1.
2.
3.
open the Symbol List by choosing Symbol List from the File menu,
select the graph (g3d), and
click on Edit.
You can do a lot more with Graph Editor functions from HiQ-Script. See the Graphics Functions section in
the Reference Manual.
National Instruments Corporation
6-39
HiQ User Manual
CHAPTER 7
T HE H IQ -S CRIPT L ANGUAGE
HiQ-Script has been designed to help the engineering and science professional automate complex and repetitive analysis tasks. Although previous experience with high order languages is useful, it is not necessary. HiQScript draws from the most useful features of FORTRAN, Pascal, and C, and adds access to the depths of the
HiQ compute engine to present a language system that is powerful and flexible, yet intuitive.
Worksheet
Numeric
Data
Graphs
Scripts
Problem
Solvers
HiQ-Script
Built-In Functions
To this point you have dealt with aspects of the graphical user interface in HiQ. In fact, when you typed an
expression in the Expression Evaluator Problem Solver, or a set of equations into the ODE Problem Solver,
you were preparing parts of a script in HiQ. Whenever you select the Save Script option at the bottom of a
Problem Solver window, the text fields you type and buttons you select are preserved in HiQ-Script language.
SC R I P T ED I T O R
If you elect to follow along by typing in the example script fragments or looking at sample scripts, you may
wish to skip ahead to the next chapter, “The Script Editor.” If you'd rather go off on your own, keep in mind
the following basics.
•
To start the editor, place a script Symbol on the Worksheet and double-click on it.
•
To exit the editor, click on the editor window's close box.
Standard Macintosh text editing features are present including cut, copy, and paste from the Edit menu. In
general, follow your Mac intuition and you'll be OK.
National Instruments Corporation
7-1
HiQ User Manual
The HiQ-Script Language
Chapter 7
NO TAT I O N CO N V E N T I O N S
In the following pages, scripts are presented in Courier typeface:
if i < 3 then
a = sin(x);
end if;
Script items buried in sections of text appear in Courier typeface. For example, discussion of the HiQ-Script
if statement should be easy to identify.
DATA TY P E S
HiQ-Script is not a strongly typed language, which relieves you of the need to explicitly define a variable as
integer, real, or complex. Data types are determined by the types of the symbols in the expression at the time
the script is executed. For example, if you wish to evaluate x = 2*i, where i is an integer, x will automatically be typed as an integer. If i were a real number, x would be real. It is always possible to lock a variable's
type manually, however.
Numeric data types are divided into two categories: the data representation's atomic type (integer, real or
complex) and the dimension type (scalar, vector, or matrix). The default dimension category is scalar.
Type
Integer
Atomic
Types
Dimension
Types
680x0 Macintosh
Power Macintosh
32-bit signed integer. Range: -2147483648 to 2147483647
Real
80-bit floating point numbers
Range: -1.1897314953572231765e+4932
to 1.1897314953572231765e+4932
64-bit floating point numbers
Range: -1.7976931348623159e+308
to 1.7976931348623159e+308
Complex
two 80-bit floating point numbers
two 64-bit floating point numbers
Scalar
a single numerical value
Vector
an array of numerical values: row or column
Matrix
a 2D array of numerical values
There is no intrinsic logical type. The logical type is implemented by representing false as an integer zero,
and true as any non-zero integer. In addition, the keywords true and false evaluate to 1 and 0.
All the remaining types are non-numeric.
HiQ User Manual
7-2
National Instruments Corporation
Chapter 7
The HiQ-Script Language
Type
Description
String
a string of any length (“This is a string.”)
Plot
graphical representation of a single function or data set
Graph
graphical representation of a collection of plots
Script
an executable script
Movie
a stored sequence of graphs
PICT
a picture stored in standard PICT format
The types associated with plots and graphs allow you to manipulate graphs and their forms. You'll learn how
to do this in the Graph Editor chapter.
AUTO M ATI C TY P I N G
Unless you explicitly lock a variable's type, the variable will take on the type of the data assigned to it. Thus
the statement
i = 3;
will set the symbol i to be an integer variable with value 3. If you later set i to 3.1, its type will be changed to
real.
Automatic data typing is applicable only within numeric data types. If you attempt to assign the value 25 to
the variable p which had previously been defined as a plot, you'll generate an error.
VA R I A B L E NA M E S
Variable names start with an alphabetic character and may otherwise consist of any combination of the characters a-z, A-Z, 0-9, and the underline character, _. Spaces are not allowed.
When working inside the Script Editor, these rules are enforced by the syntax checking mechanism, but since
a symbol created at the Worksheet level is by definition available to a script as a project variable (See the
next section “Scope of Variables”), you must mind the legal definition of a variable when naming HiQ symbols. For example, if you named an imported matrix “Measurement Data” (two words) you would see a warning that the matrix could not be used in a script. Naming the matrix “Measurement_Data” (one word) would
satisfy HiQ-Script and still incorporate a descriptive title.
Variable names are case sensitive, so myVariable and MyVariable are unique.
National Instruments Corporation
7-3
HiQ User Manual
The HiQ-Script Language
SC O P E
Chapter 7
VA R I A B L E S
OF
Variables in HiQ-Script are either project in scope or local. A project variable can be visible to userdefined functions and other scripts and is by definition a HiQ symbol, which will be listed in the Symbol List.
A local variable exists only within the context in which it is defined. When its function finishes executing, it
is deleted.
In HiQ-Script, there are only two levels of user scripting: external scripts and callable functions. A script
symbol may be any of the following:
Script 1
Script 2
Script 3
function
end function
function
end function
•
•
•
Script 1 contains an external script only.
Script 2 contains both an external script and a user-defined function (more than one function may be defined in
a script).
Script 3 contains only a user-defined function (again, more than one function may be defined here).
Once these scripts are compiled, the user functions in Scripts 2 and 3 may be called by any script in the Worksheet.
For a variable in a function to take on the same value as a variable with the same name defined in an external
script or in an editor, the variable must be declared project in the function. (In some languages, declaring a
variable as project or global in the calling routine means that it is visible to all subordinate routines—not
so in HiQ-Script.)
The default scope of a variable depends on where it is declared. A variable appearing inside a function definition (see the “Function Definition” section later in this chapter) is by default local to that function. Variables
appearing in statements external to a function definition are by default project variables. You may explicitly declare a function variable as a project variable to make it visible to any script. Similarly, you may
declare a variable appearing in an external script as local to limit its scope. For example, in the following
script fragment, a is a project variable, const is visible only within the function in which it was defined,
and const1 is visible not only in statements within this script but also in the context external to
testFunction and in other scripts in which const1 is declared a project variable.
const1 = 26.89;
/* Project variable by default */
a = testFunction(x,y,z);/* Project variable by default */
•
•
•
HiQ User Manual
7-4
National Instruments Corporation
Chapter 7
The HiQ-Script Language
function testFunction(a,b,c)
project const1;/* Project variable, explicitly
set. Takes the value 26.89
from the external script */
const = 3.1245;
/* Local variable by default */
z = const*a/b + c*const1;
return z;
end function;
You may declare a variable the first time it is used, rather than on a special line at the top of the script.
local a = b;
M = project x + a;
In fact the declaration is effective no matter where it appears in the script. For readability we advise declaring
variables prior to referencing them, but doing so is not required.
Multiple declarations are not legal, so if the following appeared in your script,
project a;
...
local a;
the second declaration of a would be flagged as an error. A script may, however, define multiple functions,
each of which may declare a local variable “a.” A local definition of a variable within a function does not
conflict with a local definition of the same variable name in a calling script or in another function even if
they are compiled together.
The following line would also be flagged as a compilation error:
project a,a;
To change the default scope of variables, use the assume statement. assume affects the default variable
scope only at the level at which it is used. If you place the statement
assume local;
in an external script all variables not explicitly declared project would be local in scope, but there would
be no effect on any functions defined within that script. Similarly, if you placed the statement
assume project;
in a function, all variables not explicitly declared local would be project in scope, but the external script
would not be touched.
Project variables are HiQ symbols and are treated just as symbols you define at the Worksheet level.
Local variables do not appear in the Symbol List and exist only during execution of the script in which they
are defined. Local variables defined within a function are destroyed when the function returns.
National Instruments Corporation
7-5
HiQ User Manual
The HiQ-Script Language
Chapter 7
FO R M
As with most modern languages, HiQ-Script is essentially free of line-oriented restrictions. Because of the
language's combination of required keywords and the semicolon statement terminator, statements may start
anywhere on a line and may span multiple lines. Where a space is required between words, any number of
spaces will do. Empty lines are acceptable.
All compound keywords in HiQ-Script may be written without the optional white space between them.
Hence, endif works the same as end if. However, compound keywords must appear on the same line.
Built-in functions and HiQ-Script keywords are not case sensitive; variables and user-defined function names
are. Some obvious ramifications of this are:
•
•
•
the matrix A and the variable a are unique;
if you define a function SIN, it will be ignored in favor of the built-in function sin;
you don't have to remember how we capitalized the built-in function
new3DDataGraph, but you will probably remember how you handled your own function myOwNfunCtIon.
CO M M E N T S
Comments may be included in the script as either single line comments or delimited comments.
The single line comment begins with two slashes and concludes at the end of the line. All text to the end of
the line is ignored by the HiQ-Script compiler.
// This is a single line comment.
// It ends with the end of the line.
Delimited comments allow you to spread a single comment over several lines or add comment text to a line
containing executable HiQ-Script code. A delimited comment starts with '/*' and ends with '*/'.
/* This is a delimited comment. It continues
until the asterisk-slash combination is encountered.
*/
for i = 1 to 10 do
x = i * x; /* You can put this kind of comment
anywhere */
/* even here */ z = x/i;
end for;
OP E R AT O R S
HiQ-Script includes the standard set of operators expected in any modern language plus a few that are tailored to HiQ.
The following operators are supported for integer, real, and complex data types, as appropriate.
HiQ User Manual
7-6
National Instruments Corporation
Chapter 7
The HiQ-Script Language
Numerical operators include the following:
Operator
Description
+
addition
-
subtraction
*
multiplication
/
division
^ or **
exponentiation
%
remainder
!
factorial
’
matrix or vector transpose
Operator precedence is discussed in the next section.
x! is supported for factorial of x, and A’ delivers the transpose of matrix A.
Logical operators are:
National Instruments Corporation
Operator
Description
and
logical and
not
logical not
or
logical or
<
less than
>
greater than
=
equal
!=
not equal
<>
not equal
<=
less than or equal
>=
greater than or equal
7-7
HiQ User Manual
The HiQ-Script Language
Chapter 7
A few of the most commonly used attribute operators are included in the language, and the remainder appear
as built-in functions
To set a variable to the real part of a complex scalar:
realPartofZ = z.r;
Conversely, to set the real part of the scalar z to the current value of a:
z.r = a;
The same goes for the imaginary part:
imagPartofZ = z.i;
z.i = b;
OP E R AT O R PR E C E D E N C E
Operator Precedence
Higher to Lower
Description
([
left to right
’ ! + - not (unary)
right to left
^ **
left to right
*/%
left to right
+ - (binary)
left to right
< <= > >= != <>
and
left to right
or
left to right
=
STAT E M E N T S
Statements in HiQ-Script may take a variety of forms, but each must be terminated by a semicolon. The range
of possibilities includes:
•
Assignment statement
•
If statement
•
Iteration statement
HiQ User Manual
7-8
National Instruments Corporation
Chapter 7
The HiQ-Script Language
•
Select statement
•
Block Escape statement
•
Function call statement
Each of these statements will be further explained in sections further ahead in this chapter.
The HiQ-Script language is a compiled language, not an expression evaluator, thus it will not handle a standalone expression. A line such as
x + y^3
cannot be evaluated as it stands anywhere but in the Expression Evaluator (one of the Problem Solvers). In a
script, you must assign the expression to a variable,
a = x + y^3;
assuming that x and y have previously been assigned values.
All statements require termination by a semicolon. This is true for simple assignment statements such as a =
3; as well as complex statements such as if ... then ... end if.
As the HiQ-Script explanation unfolds, pay particular attention to how the semicolon is used in block constructs such as if and repeat. The semicolon only appears at the end of the construct, although any statements contained within the block are terminated normally. For example:
if i > 5 then
a = cos(x);
b = sin(y);
else
a = 0;
b = 0;
end if;
There is no semicolon required in the first or fourth lines, since they are intermediate parts of the if construct, but the last line is terminated with a semicolon. Each statement inside the block requires termination.
The null statement,
;
is not legal.
MAT R I C E S
AND
VE C T O R S
An element of an existing matrix is identified using square brackets. Element (3,4), that is, row 3, column 4 of
matrix a is referred to in HiQ-Script as
a[3,4]
You may use that element in an expression such as
z = 4*a[3,4] + sin(theta);
National Instruments Corporation
7-9
HiQ User Manual
The HiQ-Script Language
Chapter 7
and you may assign a value to that particular element:
a[3,4] = 2.5;
A vector can be handled similarly, as in v[1].
It is sometimes convenient to initialize all or part of a matrix or vector within a script. To initialize an array,
enclose the element values in curly braces {}. A comma separates elements of a row, and a semicolon separates rows. Thus
a = {1,1,1,1};
a = {1;1;1;1};
a = {1,1;1,1};
/* is a 1x4 row vector */
/* is a 4x1 column vector */
/* is a 2x2 matrix */
As with any other statement, you can split the expression across multiple lines; just keep the commas and
semicolons straight. For example, the third matrix assignment would be more readable if it were written in the
following form:
a = {1,1;
1,1};
!
When you initialize an array within a for loop, HiQ automatically dimensions the array. With automatic dimensioning, HiQ reallocates the array as each new element is added, slowing processing speed
by as much as 20 percent! Instead of relying on automatic dimensioning, you can set the dimensions of
your array with the following statements:
symbolSetRows(a,n);
symbolSetCols(a,n);
where a is the name of your matrix and n is the number of rows or columns in your array. See the Utility
Functions chapter of the HiQ Reference Manual for further information on these functions.
Subvector and submatrix access is provided through use of the colon and asterisk, where the colon is used to
describe a range and the asterisk means “all,” “to the end,” or “from the beginning” depending on usage.
Consider the 5 x 5 matrix, a:
1
6
11
16
21
2
7
12
17
22
3
8
13
18
23
4
9
14
19
24
5
10
15
20
25
To refer to a submatrix consisting of the first two rows and columns of a, use:
a[1:2,1:2]
The result is
1
6
HiQ User Manual
2
7
7-10
National Instruments Corporation
Chapter 7
The HiQ-Script Language
A submatrix consisting of the last three rows and columns of a could be defined using the asterisk as follows:
a[3:*,3:*]
The resulting matrix is
13
18
23
14
19
24
15
20
25
In general, matrix and vector indices may be expressions, thus:
a[expr:expr,expr:expr]
If an expression evaluates to a real number, the result is truncated to the next lowest integer. If that number
does not make sense in the current context or is outside the valid index range (<1), you will get a runtime
error.
Let's explore automatic typing and matrix dimensioning with the following simple statement:
A = B;
where A and B are matrices.
A takes on B's dimensions, whether A is a new matrix or had previously been defined.
If b is a row vector with as many elements as A has columns, a row of A may take on B's values as follows:
A[4,*] = b;
Row 4 of A now equals vector b.
If b is a column vector with as many elements as A has rows, a column of A may take on B's values as follows:
A[*,4] = b;
Column 4 of A now equals vector b.
M AT RIX A R I T HME TI C
Arithmetic operators which apply to matrices include +, -, *, and /.
Addition and subtraction require that the matrices to be added or subtracted be of the same dimensions.
C = A + B;
D = A - B;
Matrix C is the element-by-element summation of matrices A and B. Matrix D is the element-by-element difference of matrices A and B.
Matrix multiplication follows the standard rules: if A is an m x n matrix, and B is of dimension n x p, then C
is of dimension m x p.
C = A * B;
Multiplying a matrix by a scalar results in the multiplication of each element by the scalar.
National Instruments Corporation
7-11
HiQ User Manual
The HiQ-Script Language
Chapter 7
D = A*s; /* where s is a scalar */
The division operator (/) denotes multiplication by an inverse:
F = A/B;
is the same as:
F = A * inv(B);
If the divisor is a scalar, then the resulting matrix consists of each element of the dividend divided by the scalar.
CO N D I T I O N A L EX E C U T I O N STAT E M E N T S
IF
HiQ-Script provides the full functionality of the if-then-else-if construct. The if statement must be
terminated with end if.
A simple example:
if i < 3 then
a = sin(x);
end if;
A more complex example:
if i < 3 then
a = sin(x);
b = cos(y);
else if i > 5 then
a = cos(x);
b = sin(y);
else
a = 0;
b = 0;
end if;
SE L E CT
The select statement allows you to select a variable from a list of values and to execute a block of code
associated with that value. The path taken depends upon the current value of the select expression. The basic
form is
select expression from
case expression:
statements
case expression:
statements
•
•
•
HiQ User Manual
7-12
National Instruments Corporation
Chapter 7
The HiQ-Script Language
default:
statements
end select;
Let's take a simple example to see how the select statement works. Suppose that depending on the value of
the variable i, you wish to assign the following possibilities to the variable z:
i
z
1
sin(theta)
2
cos(theta)
3
sin(theta)*cos(theta)
Everything else
0
The script for this example is:
select i from
case 1:
z = sin(theta);
case 2:
z = cos(theta);
case 3:
z = sin(theta)*cos(theta);
default:
z = 0;
end select;
Depending on the current value of i, one and only one of the case blocks is executed, then control is transferred to the statement following end select. If i=2, z would be calculated as cos(theta), and nothing else
within the select block would happen. If i is not 1, 2, or 3, the default block would be executed, setting z
to zero.
The select expression is evaluated each time a comparison is made.
!
IT E R AT I O N STAT E M E N T S
Three looping constructs are available:
•
•
•
for ... end for;
while ... do ... end while;
repeat ... end repeat when ;
National Instruments Corporation
7-13
HiQ User Manual
The HiQ-Script Language
Chapter 7
FOR
The most powerful and probably most used looping construct is the for statement. HiQ-Script's for construct looks like this in general form:
for identifier = expr1 to expr2 step expr3 do
statements
end for;
The expressions defining the beginning, ending and step conditions may be any valid integer or real HiQScript expression. The end and step expressions are evaluated once at the beginning of the loop.
Loops may proceed in a negative direction by assigning start, end, and step values appropriately. To run the
loop from i=10 to i=5, the form would be:
for i=10 to 5 step -1 do
statements
end for;
The HiQ-Script compiler always adds the step expression value. If start, end, and step conditions are defined
by expressions which evaluate to inconsistent conditions, you will see a runtime error and script execution
will stop.
The index identifier is data-locked at the beginning of the loop to prevent you from inadvertently altering the
index variable during loop execution.
The for loop has been optimized for speed. An equivalent while or repeat loop can be significantly
slower depending on the number of statements in the loop.
See the Block Escape Statements section below for methods of breaking out of the for loop.
W H IL E
The general form of the while statement looks like this:
while expression do
statements
end while;
where expression is any valid HiQ-Script logical expression. A simple example is:
while i < 5 do
x = sin(theta);
i = i + 1;
end while;
Note that while checks the logical expression before executing the statements within the loop; if the logical
expression is tests true immediately, the statements inside the loop are never executed. You can think of the
logical condition as a “continue loop if true” test.
See the Block Escape Statements section below for methods of breaking out of the while loop.
HiQ User Manual
7-14
National Instruments Corporation
Chapter 7
The HiQ-Script Language
RE P E AT
Repeat works similarly to the while construct, except that it checks the validity of the logical expression
after executing the statements within the loop. A Repeat statement will always execute at least once.
repeat
statements
end repeat when logical_condition;
An example is:
repeat
x = sin(theta);
i = i + 1;
end repeat when i>5;
Again, the expression (in this case “i > 5") may be any legal logical expression.
In addition, there is the following construct:
repeat forever
statements
end repeat;
To prevent the compiler from flagging an error, there must be an exit or return statement inside the repeat
loop.
See the Block Escape Statements section below for methods of breaking out of the repeat loop.
BL O C K ES C A P E STAT E M E N T S
The next and exit statements are available to provide an exception mechanism to break from program
structures.
NE XT
The next statement is used to conveniently go on to the following iteration within a loop structure. It may be
used with the while, repeat, and for loops. Also, the next case statement may be used to skip to the
next case in select statements.
National Instruments Corporation
7-15
HiQ User Manual
The HiQ-Script Language
Chapter 7
In a for loop, you can execute a specified section of code for only certain values by using the following
setup:
for i=1 to 1000 do
if (sin(i/1000)>0.5 then
next for;
end if;
statement;
statement;
•
•
•
statement;
end for;
In this situation, an if…then…else construction would be just as clear, but a more complex example might
well use the next option.
next iteration is equivalent to next for, next while, and next repeat.
E XIT
Exit allows you to escape entirely from a specified loop. Further, you may escape from more than one loop
with one invocation of exit.
For example, the following script fragment contains three nested for loops with an exit which breaks to the
outer for loop.
for i=1 to 100 step 2 do
for j=1 to 10 do
for k=1 to 20 do
theta = j*k*r/200;
if theta > 0.5 then
exit 2 fors;
end if;
•
•
end for;
end for;
end for;
You may break out of all of one type of block with:
exit all fors;
or
exit all repeats;
You may escape from any kind of block with:
exit 2 blocks
or
exit all blocks
HiQ User Manual
7-16
National Instruments Corporation
Chapter 7
The HiQ-Script Language
ST R I N G S
String variables may be set to any combination of ASCII characters up to 255 characters in length.
For example:
string = "HiQ";
sets the variable string to the value "HiQ."
Strings may be concatenated (added together):
string1 = "Numerical";
string2 = "Analysis";
string3 = string1 + string2;
string3 would be set to “NumericalAnalysis.” If you want a space between the words, you must explicitly
place it there.
string3 = string1 + " " + string2;
You can compare strings using the standard ASCII sequence and the HiQ-Script comparison operators (see
"Operators” earlier in this chapter):
string1 = "abc";
string2 = "def";
string3 = "ABC";
In a comparison, string2 would be greater than string1 because “d” is greater than “a.” Because of the
ASCII coding, string1 would be greater than string3.
You can access substrings through the standard HiQ-Script array notation. (See “Matrices and Vectors” in the
“Statements” section earlier in this chapter.)
string = "abcdef";
string1 = string[2:4];
string2 = string[3:*];
String1 is set to “bcd” and string2 = “cdef.”
UT I L I T Y BU I LT- I N FU N C T I O N S
Several HiQ built-in functions are available to facilitate interaction with the user during script execution.
These and other language-related functions are described in the Utility Functions section of the Reference
Manual.
M E SSAGE
message displays a modal alert box which requires clicking on the OK button to continue.
if a > 500 then
message ("Input value is too large");
end if;
National Instruments Corporation
7-17
HiQ User Manual
The HiQ-Script Language
Chapter 7
The message looks like:
WARNIN G
If you wish to display a message which elicits an OK or Cancel response, use warning. This statement
returns a 1 if the OK button is selected or a 0 (zero) if the Cancel button is selected.
warningResult = warning ("Erase all data?");
if warningResult = 1 then
// proceed with erasing data
end if;
G E T ST R I N G
To retrieve a string input, use getString. The general form is:
string = getString(prompt_string,default_string);
HiQ User Manual
7-18
National Instruments Corporation
Chapter 7
The HiQ-Script Language
Both the prompt and default strings are optional. An example follows:
userName = getString("What is your name?","");
Some editing capabilities are available in the text input field. You may:
•
insert text at the insertion marker's location,
•
move the text insertion point (the vertical line) with the mouse and arrow keys,
•
select a portion of text by dragging over it with the mouse,
•
select a word by double-clicking on it,
•
erase text with the delete key, and
•
replace selected text by typing.
G E T NUM B ER
To retrieve a single number, use getNumber. The input value can be integer, real, or complex.
number = getNumber(prompt_string,
default_number_string);
Notice that if you display a default value, it must be in string form, complete with quotes. The number keyed
into the edit field does not require quotes, and the value returned (number, above) is a number of integer,
real, or complex type.
nodes = getNumber("Number of nodes?","100");
Editing of the input text is the same as in getString.
National Instruments Corporation
7-19
HiQ User Manual
The HiQ-Script Language
Chapter 7
FU N C T I O N DE F I N I T I O N
There will be many times when you wish to reuse portions of your scripts. In HiQ-Script you can encapsulate
such modular portions of code in “functions.” Once a function has been compiled, it becomes a HiQ symbol
and is available to any script or Problem Solver in the Worksheet.
A function may be defined in the same script in which it is called, or in some other script. There is no HiQimposed limit to the number of functions which may be defined in any particular script, but you may not
define a function inside another function.
The general form of a function is
function fname(x,y,z)
statements
•
•
•
return expr;
end function;
where expr is a single-valued expression. Following our standard rules of syntax, the expression can range
from a constant, to a previously-defined variable, to a multi-line expression, and can represent a scalar, vector,
matrix, or any other symbol. A user-defined function may return only a single value: only HiQ built-in functions can return multiple values (see “Calling HiQ Built-in Functions” later in this chapter). If you need to
define a function that returns more than one variable, you can achieve a similar result by allowing the function
to return values in some of its input arguments. (See “Call by Reference” later in this chapter.) It is not necessary to return a value; if there is no return, the function acts like a procedure.
The calling form looks like:
t = fname(a,b,c);
Variables inside the function are implicitly local unless declared project in scope. Therefore the names
of variables in the calling line (in this case a, b, and c) need not be identical to those appearing in the function
definition (x, y, and z).
An aerospace engineer calculating aerodynamic loads on an expendable booster during atmospheric flight
will need to find dynamic pressure, Q, which is defined as:
1
Q = --- ρv 2
2
where ρ is local atmospheric density and v is the booster's relative velocity.
The function definition would look like:
function dynpress (ro,v)
q = ro*v^2/2;
return q;
end function;
HiQ User Manual
7-20
National Instruments Corporation
Chapter 7
The HiQ-Script Language
In an example as simple as this, you could just put the defining expression on the “return” line:
function dynpress (ro,v)
return ro*v^2/2;
end function;
A script fragment illustrating the calling line is as follows:
•
•
•
density = dens(altitude);
Q = dynpress(density, velocity);
•
•
•
CAL L B Y R E F ER EN C E
Unlike functions in some other languages, User-defined functions in HiQ-Script can modify the arguments
passed to them; that is, parameters passed to user functions are called by reference. Consider the following
example:
x = 2;
y = f(x);
function f(a)
a = a + 1;
return a^2;
end function;
The variable x is set to 2, then it is passed to the function f. The function first increments its argument by 1,
then returns the square of the modified argument. So, after execution, x has been incremented to 3, and y is set
to the value returned by the function, or 9.
CAL L IN G HI Q BU I LT-I N F U N C TI ON S
HiQ built-in functions are called exactly like user functions. For example, a call to the built-in function sin
would look like:
x = sin(theta);
For information about the extensive list of built-in functions, see the HiQ Reference Manual.
A number of built-in functions have multiple return values. A generic built-in function (BIF) might look like
this:
[A,B,C,D] = BIF(x,y,z);
National Instruments Corporation
7-21
HiQ User Manual
The HiQ-Script Language
Chapter 7
You can call this function without returning all four values. If you don't need the last value, just leave it off:
[A,B,C] = BIF(x,y,z);
If you don't need the last two return values,
[A,B] = BIF(x,y,z);
and so on. If you don't need one of the intermediate return values, leave the commas as place holders. The
function calls
[A,B,,D] = BIF(x,y,z);
[A,,,D] = BIF(x,y,z);
return A, B, and D in the first instance and A and D in the second.
In general, undesired trailing variables may be dropped, and undesired intermediate variable places must be
held by commas.
If you forget the comma in the following call,
[A,B,D] = BIF(x,y,z);
the third return value, not the fourth, would be placed into D.
If you need only the first return value, you can eliminate the brackets:
A = BIF(x,y,z);
USING F U N C T I ON NA ME S A S A R GU M E N T S
More than twenty HiQ built-in functions accept as an argument the name of another function. For instance,
the function derivative() has the form:
derivative(function,n,h,a)
The argument function must specify the name of a HiQ built-in function or the name of a previously defined
user function. If you want to pass the name of a user-defined function as an argument, you must have written
and compiled a script containing the function definition. The function name will be recognized if it appears in
the Symbol List.
Using the example of the derivative() function, assume you have previously edited and compiled a script
containing the following function definition:
function myfunc(x)
return 3*x^3 - 2*x^2;
end function;
It is now possible to write a script calling the function derivative(), passing myfunc as a argument:
y = derivative(myfunc, 2, 0.01, 4.0);
If a function reference like the above occurs within a procedure, then you must also provide a project statement to tell the compiler to access the Symbol List to find the named function. A completed example, build-
HiQ User Manual
7-22
National Instruments Corporation
Chapter 7
The HiQ-Script Language
ing on the previous two, shows the correct code for referring to a user-defined function within another userdefined function:
function calls_myfunc(y)
project myfunc;
return derivative(myfunc, 2, 0.01, y);
end function;
If the project statement were omitted, the call to function myfunc() would cause an alert to be issued, stating that argument 1 to function derivative() was of the wrong type.
Note that HiQ-Script provides no method for changing the foregoing example so that function myfunc() has a
local scope.
It should be clear after perusing the Worksheet chapter with its icons and tools, that scripts are symbols. Functions, too, become symbols. Compiling a script named “aScript” in which are defined two functions, “f” and
“g” would result in three new symbols in the Symbol List.
A function isn’t like other symbols in that you can’t edit it directly (you have to edit the script in which it is
defined) and you can’t place a function on the Worksheet. However, functions are stored separately in the
Worksheet and are available to other symbols including scripts, Problem Solvers and built-in functions. For
example, you could use the Expression Evaluator Problem Solver to evaluate your function over a range of
input values.
LA N G U A G E CO N S TA N T S
It's often handy to have numeric (or other) constants at your fingertips without having to explicitly define
them before every use. Language constants are stored in an editable text file named
HiQ•Constants.PowerMac on a Power Macintosh or HiQ•Constants.68kMac on a 680x0 Macintosh.
You can access this file from within HiQ by importing it into the Script Editor (see the “Import/Export” chapter). If you wish to modify the file to add your own constants, do so as described below, then export the file to
the same name as text.
Each constant is defined by a name enclosed in angle brackets, the constant's type, and its value. For example,
pi is defined as
<pi>
real
3.14159265358979323846
Language constants entries must be separated by a space, tab, or comma. You may refer to this value anywhere that HiQ-Script may be used including scripts, Problem Solvers, and the Graph Editor. For example, a
line in a script might read:
x = 2 * <pi>*freq;
!
Don't change the values of the predefined constants that ship with HiQ. Doing so could result in scripts
that don't run properly.
National Instruments Corporation
7-23
HiQ User Manual
The HiQ-Script Language
Chapter 7
HI Q- SC R I P T KE Y W O R D S
HiQ User Manual
all
exitif
nextrepeatiteration
and
exitrepeat
nextwhile
assume
exitselect
nextwhileiteration
block
exitwhile
not
blocks
false
or
case
for
project
default
forever
repeat
do
foriteration
repeatiteration
else
fors
repeats
elseif
from
return
end
function
select
endfor
if
selects
endfunction
ifs
step
endif
iteration
then
endrepeat
local
to
endselect
next
true
endwhile
nextcase
when
exit
nextfor
while
exitall
nextforiteration
whileiteration
exitblock
nextiteration
whiles
exitfor
nextrepeat
7-24
National Instruments Corporation
CHAPTER 8
T HE S CRIPT E DITOR
The Script Editor is used to create scripts in HiQ. From within the editor you can:
•
automatically enter language block constructs;
•
accept function calls built from graphical problem solvers;
•
check syntax; and
•
execute a script.
Worksheet
Numeric
Data
Graphs
Scripts
Problem
Solvers
HiQ-Script
Built-In Functions
EN T E R I N G
AND
EX I T I N G
THE
ED I T O R
To create a script and open it for editing from the Worksheet, place a script Symbol on the Worksheet and double-click on it.
To create a script and open it for editing from the Create menu:
National Instruments Corporation
8-1
HiQ User Manual
The Script Editor
Chapter 8
1.
select Create Symbol…,
2.
3.
4.
click on Script in the left column,
type a name if you wish to replace the default name, and
click on Create & Edit.
To edit an existing script,
•
double-click on the Symbol on the Worksheet, or
•
select the symbol’s name in the Symbol List and click on Edit
The Script Editor window takes the following form:
HiQ User Manual
8-2
National Instruments Corporation
Chapter 8
The Script Editor
To exit the editor, click on the window's close box. You will be prompted with a request to save your work:
Clicking on Yes saves the contents of the editor and closes the window, No exits the window without saving
the contents, and Cancel returns you to the editing session.
TE X T EN T E R I N G
AND
ED I T I N G
The main area of the editor window is used for text entry and editing.
The Script Editor is always in “insert” mode, so typing produces added text at the insertion point. You can
move the insertion point by clicking or using the arrow keys.
Skeletons of HiQ-Script block constructs are available from the Insert palette to the left of the text entry area
and from the Insert menu. For example, if you needed a for construct in your script, clicking on for in the
Insert palette would result in:
for 1Var = 1FirstValue to 2LastValue step 3Value do
end for;
being inserted in your script at the cursor's location. (See the example at the end of this chapter.)
The left arrow key moves the insertion point one character to the left. If pressed at the left end of a line, the
insertion point will be moved to the right end of the preceding line. The right arrow key moves the insertion
point to the right by one character. From the right end, the pointer is moved to the beginning of the next line.
The up and down arrow keys move the insertion point up and down one row.
Pressing Option and the left arrow key moves the pointer to the end of the previous variable, keyword, or
number. Similarly, pressing option-right arrow moves the pointer to the beginning of the next variable, keyword, or number to the right.
Select text by dragging over the words you wish to edit. You can select one word by double-clicking anywhere
within the word. To select an entire line, click on the line number if it is present, or click at the beginning of
the line, then drag down.
Cut, copy, and paste under the Edit menu are standard. Clear deletes the selected text without first placing it in
the clipboard for later retrieval. Pressing the delete key is the same as Clear.
You have one level of Undo available. Once you have selected Undo from the Edit menu, the Undo menu item
changes to Redo.
Undo captures everything since the last editing command. For example, if you have just used the Clear command to delete some text, Undo will change into Undo Clear, which gives you some indication of what you
National Instruments Corporation
8-3
HiQ User Manual
The Script Editor
Chapter 8
are about to undo. Once you have selected Undo, the menu item becomes Redo, allowing you to go back and
forth. Any new activity such as typing resets the Undo.
To go directly to a specific word or words, select the Find… command from the Utility menu.
The editor will find the next occurrence of the text in the “Find what string?” field. Unless you have selected
Entire Word, the text may be embedded in a word. For example, searching for “on” will turn up “only,” “ton,”
and “telephone,” as well as “on.” If you search for multiple words, everything counts, so be sure of the number of spaces between words as well as exact spelling.
There are four options available:
•
Search Backwards—searches from the current location of the pointer backwards to the beginning of the file,
where it stops unless you have selected Wrap-Around Search.
•
Wrap-Around Search—searches forward to the end, then from the beginning to the current pointer position, or
backward to the beginning, then from the end to the current position, depending on whether you have specified
forward or backward search.
•
Entire Word—only finds the search string if it constitutes an entire word (specifying “on” with Entire Word
selected would find “on” but not “only”).
•
Case Sensitive—by default, the Find command is not case sensitive, so specifying “Case” would find both
“case” and “Case.” Selecting Case Sensitive requires an exact match.
The Find button causes the pointer to move to the next occurrence of the search string, with that string highlighted. The search proceeds from the current location of the pointer forward or backward, depending on
whether you have selected Search Backwards. If Wrap-Around Search is not selected the search stops at the
end of the script. If Wrap-Around Search is selected the search continues in the same direction until it reaches
the current pointer location. If the search string is not found, you are informed by a beep.
Cancel dismisses the Find dialog box.
Find Again under the Utility menu searches for the current search string.
HiQ User Manual
8-4
National Instruments Corporation
Chapter 8
The Script Editor
An extension of the Find command, Replace... in the Utility menu finds a specified string and replaces it with
another.
The Replace command searches for the target string with the same methods used by the Find command. Once
the target string is found, it is replaced by whatever is in the “Replace with what string?” field, even if that
field is empty. Search Backwards, Wrap-Around Search, Entire Word, and Case Sensitive options are
explained in the Find section earlier in this chapter.
The four action buttons work as follows:
•
Replace—if the target string is found, it is replaced by the replacement string. If the target string is not found, no
action is taken, and the pointer is left at the current location.
•
Replace All—all occurrences of the target string are replaced by the replacement string. The search direction is
forward toward the end of the script unless Search Backwards is selected. The search ends at the beginning or
end of the script unless Wrap-Around Search is selected.
•
Find—finds the search string, leaves that string highlighted.
•
Cancel—dismisses the Replace dialog box, taking no further action.
Replace Again under the Utility menu performs the action currently specified in the Replace… dialog box for
the next occurrence of the target string. If it cannot find the target string, no action is taken.
As an aid to debugging errant scripts, you may wish to display line numbers. To do so, select Show Line
Numbers from the Utility menu. When line numbers are visible, that command becomes Hide Line Numbers.
Navigation to a particular line number may be accomplished with the Go To… command under the Utility
menu.
•
Go To—highlights the specified line number.
•
Top—highlights the first line of the script
National Instruments Corporation
8-5
HiQ User Manual
The Script Editor
Chapter 8
•
Bottom—highlights the last line.
•
Cancel—dismisses the Go To… dialog box, taking no further action.
Built-in functions may be inserted into your scripts by selecting the Functions Menu… from the File menu.
(See “Functions Menu” in the Problem Solver chapter for a full explanation of this facility.)
SC R I P T FO R M AT
The appearance of the Script Editor window may be changed in several ways.
Indenting lines to provide a visual clue to the script’s structure is good programming practice. To let the
Script Editor take care of that chore, select Auto Indent from the Utility menu. There are two varieties of automatic indentation: with and without language awareness. Selecting Language Indent forces block structures
to be indented properly. With Language Indent turned off, the current line will be indented at the same level as
the preceding line. In either case you may manually modify the indentation.
Consider the example of typing three lines of script with Auto Indent turned on:
With Language Indent:
for i=1 to 5 do
A[i]=i^2;
end for;
// Auto indent
// end for matches for
Without Language Indent:
for i=1 to 5 do
A[i]=i^2;
end for;
// Manual indent
// Automatically matches previous
// line
With the Indentation… command under the Utility menu you can control the entire indentation process.
The Automatic Indentation choices provide the same functionality described above:
•
Language Sensitive—preserves block structure;
•
Auto Indent New Lines—indents current line the same as previous line; and
•
Off—no automatic indentation.
HiQ User Manual
8-6
National Instruments Corporation
Chapter 8
The Script Editor
Clicking on Re-Indent applies your current choices to the entire script, otherwise changes made in this dialog
box apply only to subsequent lines added to the script. Cancel dismisses the dialog box without making any
changes.
To further enhance the readability of the script you may choose to highlight HiQ-Script keywords by selecting
Highlight Keywords from the Utility menu. This command immediately affects the entire script: selecting it
causes all keywords to be changed to bold face, deselecting it changes the keywords back to standard font.
If you don’t want to see the Insert palette, select Hide Insert Palette from the Utility menu. When the palette is
not visible the command changes to Show Insert Palette.
The font and font size may be changed with the Font and Size menus. Although any font in your system may
be used to display a script, non-proportional fonts such as Courier or Monaco work best for programming languages.
C O M P I L E R BU T T O N S
AND
STAT U S ME S S A G E S
There are four control buttons across the top of the Script Editor window.
Click on the Syntax button to check the syntax without compiling the script. Errors will be presented in a
Compiler Errors window.
Click on the Compile button to compile the script without executing it. Errors will be presented in a Compiler
Errors window.
Click on Run to initiate a compilation and, if there are no compiler errors, an execution of your script. Compiler errors will be presented in the Compiler Errors window. If there are no errors, the results of the execution
will be presented in a Script Results window.
XRef presents a cross reference listing of all variables used in the script along with the lines in which each
variable appears and the line in which each variable is first defined.
!
If a script attempts to change a symbol currently loaded into an editor, one of two things will happen: 1)
if no changes have been made in the editor since the last save, the script will execute normally, but 2) if
there are unsaved changes, the script will fail. Since any symbol can be manipulated by HiQ-Script, it
would be wise to close editors before executing a script.
To stop script execution, press the command key and the period key (.) together.
CO M P I L E D SC R I P T S
Once a script has been compiled, it can be placed on the Worksheet and rerun by simply double-clicking on its
Symbol or selecting Run from the Worksheet menu with the Symbol highlighted. A compiled script is by
default named with “_Run” added to the script name, so the compiled script for “TestScript” is
“TestScript_Run.” To place the Symbol on the WorkSheet, open the Symbol List, select the compiled script,
then click on the Place button.
National Instruments Corporation
8-7
HiQ User Manual
The Script Editor
Chapter 8
SAV I N G YO U R WO R K
You will be reminded to save or discard your script when you close the HiQ-Script Editor. For more control,
the following choices are available under the File menu:
•
Save Symbol As…—saves the symbol with the name specified in the standard file dialog box,
•
Save Symbol—saves the symbol with the current name,
•
Save Copy of Symbol…—saves the contents of the symbol under a new name, but the editor remains loaded
with the original symbol, and
•
Revert Symbol…— returns the editor’s contents to the state at last save. Before reading in the old data, HiQ
allows you to change your mind.
PR I N T I N G
A
SC R I P T
To print a script, select Print from the File menu. Line numbers and bold key words are printed if those
options have been selected.
PR E F E R E N C E S
Select Preferences for… under the File menu to set preferences for future use of the Script Editor. (See
“Worksheet Preferences” in the Worksheet Chapter for a description of the global preferences system.)
SCRIP T E D I TOR
You have control over the following defaults in the Script Editor:
•
•
•
•
•
Font: typeface and size;
Line numbers;
Keyword highlighting;
Show insert palette; and
Automatic indentation.
E XE CUT I ON
In addition to editor controls, you may also wish to set execution defaults:
•
•
•
Results summary;
Saving of results
completion notification.
The Results Summary is explained in the example section following.
HiQ User Manual
8-8
National Instruments Corporation
Chapter 8
The Script Editor
AN EX A M P L E
Let's use a simple script to demonstrate most of the Script Editor's features.
project A;
for i = 1 to 5 do
for j = 1 to 5 do
A[i,j] = i+j;
end for;
end for;
With this script we can go through:
•
basic text entry and editing,
•
using the Insert palette to enter block constructs,
•
using the cross reference listing,
•
error recovery, and
•
script execution.
We'll name the script SampleScript and the five-by-five matrix A. If either of these symbol names conflicts
with something already existing in your list of symbols, you can either change these names or delete the existing symbols.
Assuming that the way is clear,
1.
Click on the Script tool in the tool palette.
2.
Click somewhere on the Worksheet.
3.
4.
5.
With the script Symbol highlighted, press Return to select the symbol’s name.
Type “SampleScript” (without quotes).
Double-click on the resulting script Symbol.
National Instruments Corporation
8-9
HiQ User Manual
The Script Editor
Chapter 8
6.
7.
When the empty Script Editor window appears, type the first line of the script, then
click on “for” in the Insert palette to the left.
8.
9.
Replace 1Var with i, 1FirstValue with 1, 2LastValue with 5, and delete “step” and “step 3Value.”
Click in the blank line inside the for loop to set up the inner loop.
A tab has been inserted at the beginning of the line to act as auto indentation. You can control the indentation
appearance with the Indentation… command under the Utility menu.
With the cursor now inside the outer loop,
10. click on “for” in the Insert palette to set up the inner loop.
11. Replace 1Var with j, 1FirstValue with 1, 2LastValue with 5, and delete “step” and “step 3Value.”
HiQ User Manual
8-10
National Instruments Corporation
Chapter 8
The Script Editor
12. Click in the blank line inside the for loop to add the assignment statement.
13. Click on Syntax to be sure there are no typing errors.
14. Click on OK to dismiss the dialog box.
To see the effect of an error, we'll add a couple to the current script.
1.
2.
3.
Delete “do” from the end of the line that reads for i=1 to 5 do
Delete the semicolon at the end of the A[i,j] = … line, then
click on Syntax.
National Instruments Corporation
8-11
HiQ User Manual
The Script Editor
Chapter 8
The compilation errors window appears, listing all bugs in your script. To track down a bug, click anywhere
in the error explanation to select the error, then click on Locate. The Script Editor window will be brought to
the front and the pointer will be located as close as possible to the problem area in the script. The contents of
the error window may be saved in a symbol by clicking on Save.
4.
Replace the missing “do” and semicolon and click on Syntax just to verify the script.
To further analyze your script,
5.
Click on XRef
The cross reference consists of a numbered listing of the script, and a list of all variables along with the line
numbers where they appear and an indication of where the variable was defined. The results of the cross reference analysis are placed in a text Symbol named “ScriptName_XRef.” A number is appended to the symbol
name each time the cross reference is executed. You can view the cross reference record at any time by double-clicking on the symbol’s name in the Symbol List.
6.
Click on Run to execute the script.
If all goes well you should see an indication that there were no errors.
7.
Click on OK.
HiQ User Manual
8-12
National Instruments Corporation
Chapter 8
The Script Editor
All project variables in the script become symbols. In our example A, i, and j are all project variables and will
be listed in the Symbol List. To view them, double-click on their names in the Symbol List to load them into
the Data Editor.
If you have selected Generate a HiQ-Script Summary in the Script Editor preferences, a results string variable
is created which contains a summary of activity caused by execution of the script. The variable, titled
“ScriptName_Results” will be stored in a symbol. It will automatically be displayed in a Text Editor window
at completion of script execution. Contents include execution time, a list of all current symbols and a separate
list of symbols created or modified during the script execution. A number is appended to the symbol name, so
each execution of the script will generate a unique results symbol.
National Instruments Corporation
8-13
HiQ User Manual
C HAPTER 9
T HE T EXT E DITOR
The Text Editor is used whenever text in the form of Worksheet annotations or script output messages need to
be viewed or edited. Because text is so frequently used to annotate a Worksheet, the Text Editor has a unique
feature that allows you to do on-page editing.
EN T E R I N G
AND
EX I T I N G
THE
ED I T O R
The mode in which you use the Text Editor depends on how you invoke it.
O N- PAG E T E X T E D I T I N G
To create a new text Symbol and edit it directly on the Worksheet page:
1.
Place a text Symbol on the Worksheet by selecting the Text tool and clicking on the Worksheet.
HiQ creates a text Symbol in expanded view that you can edit in place. Notice that the menus at the top of the
screen change to reflect the fact that you are now using the Text Editor.
To edit existing text on-page:
1.
2.
Select the Text tool in the Tool palette.
Click on a text Symbol that is in expanded view.
An insertion point appears in the text. You can now edit on-page and use the Text Editor menus.
To exit from on-page edit mode, click anywhere outside the text Symbol you are editing. Even though you
may have changed this Symbol, you will not be asked to save your changes. On-page edits are not saved to
disk until the next time you choose Save Worksheet from the File menu.
E DIT ING T E X T I N A S E PA R ATE W I N DOW
To edit text in a separate window:
1.
Double-click on an existing text Symbol on the Worksheet.
1.
Select Create Symbol… from the File menu or click on New in the Symbol List to bring up the Create
Symbol dialog, and
Type in a name, select String, and click on Create & Edit.
or
2.
or, finally
1.
Select an existing text Symbol in the Symbol List and click on Edit.
National Instruments Corporation
9-1
HiQ User Manual
The Text Editor
Chapter 9
After using one of these methods, you will see a text entry window.
Remember that if you elect to have the optional Script Results window appear after every script execution, the
data will be presented in the Text Editor, which means that in addition to viewing the data, you may also edit
it and save it for future use.
To exit from the Text Editor window, click in the window's close box or select Close from the File menu.
When editing from a Text Editor window, you will be prompted to save any changes.
TE X T EN T E R I N G
AND
ED I T I N G
Text entering and editing is the same when working on-page or in a Text Editor window. The editor is always
in “insert” mode, so typing produces added text at the insertion point defined by the cursor's current location.
You can move the insertion point by clicking or using the arrow keys.
Select text by dragging over the words you wish to edit. You can select one word by double-clicking anywhere within the word. Clicking at the beginning of a line, then dragging down will select the entire line.
Cut, copy, and paste under the Edit menu are standard. Clear deletes the selected text without first placing it in
the clipboard for later retrieval. Pressing the delete key is the same as Clear.
You have one level of Undo available. Once you have selected Undo from the Edit menu, the Undo menu item
changes to Redo.
Undo captures everything since the last editing command. For example, if you have just used the Clear command to delete some text, Undo will change into Undo Clear, which gives you some indication of what you
are about to undo. Once you have selected Undo, the title become Redo, allowing you to go back and forth.
Any new activity such as typing resets the Undo.
The Text Editor supports text font, font size, and style formatting. Attributes chosen from the Font, Size, or
Style menu apply to selected text. If no text is chosen when a format attribute is changed, the new format will
be considered the default for subsequent input.
Text in the Text Editor will be wrapped to the size of the window. To change line length at any time, simply
adjust the width of the window.
Text in an expanded text Symbol on the Worksheet will wrap to the size of the Symbol, and it will do so inde-
HiQ User Manual
9-2
National Instruments Corporation
Chapter 9
The Text Editor
pendently of the size of the Editor window.
To print the contents of the Text Editor, select Print from the File menu.
National Instruments Corporation
9-3
HiQ User Manual
CHAPTER 10
I M P O RT / E X P O RT
As you go about your analysis tasks, you will probably need to move data between HiQ and other applications. HiQ supports cut, copy, and paste functions to and from other Macintosh programs, and for small
amounts of data that approach may suffice. But for larger data sets, you will find that transferring by file is a
much faster process.
IM P O RT I N G
A
FI L E
To import a file into HiQ, select Import Symbol… from the File menu.
1.
Click on Select File. You will be presented with the standard file input dialog box.
National Instruments Corporation
10-1
HiQ User Manual
Import /Export
Chapter 10
2.
Navigate to the proper folder and select the data file you wish to import by double-clicking on the file name
or clicking on the Open button.
The name of your file is now listed in the File Name box and information about that file is displayed directly
below.
HiQ assumes that the symbol name of the imported file will be the same as that of the file; edit it to match
your needs. Remember that typical Macintosh file names include spaces which are not legal characters in
HiQ symbol names. (See the symbol name discussion in the “Symbol List” section of the Worksheet chapter.)
3.
4.
5.
Select Numeric as the symbol type. This is a popup menu with four choices: Script, Text, Numeric, and
PICT.
Select the appropriate numeric type from Integer, Real, and Complex. Real is appropriate for this
example.
Finally, select the import method. Choices are currently limited to the following:
Text
TEXT
Numeric
Tabbed Text—there is a tab character between each item in a row and a carriage
return at the end of the row. Each tab signals the end of a field, so two tabs between a
pair of numbers will result in a zero placed between the numbers in the HiQ symbol.
Similarly, a tab at the beginning of the line will result in a zero in the first cell, and a
tab at the end of the line (before the concluding carriage return) will result in a zero at
the end.
Comma Text—there is a comma between each item in a row and a carriage return at
the end of the row. Commas work the same as tabs: each comma flags a cell, which is
filled with zero if there is no number before the comma.
HiQ User Manual
10-2
National Instruments Corporation
Chapter 10
Import/Export
Space Text—there is a space between each item in a row and a carriage return at the
end of the row. Multiple spaces are treated as a single space separating numbers.
Spaces at the beginning and end of the line are thrown away.
General—you are unsure of the format of the file. This method reads the input text file
and saves everything that “looks” like a number. It is useful for reading data that isn’t
in one of the other formats. When there are fewer numbers on one row than in other
rows, all trailing numbers in that row are set to zero.
PICT
!
A picture file in PICT format (Not available when importing numeric data.)
If you tell HiQ that you are importing tab-delimited text and the data is separated by commas, results are
unpredictable, and no message will appear to warn you of possible confusion. It's always best to carefully check your data once it has been imported into HiQ.
6.
Click on Import. Your data will be imported into a HiQ symbol which will be opened in the appropriate
editor.
Numeric data from programs like Microsoft Excel needs to be saved using the “Text” option. If you create
your own file from a program written in FORTRAN or other language, separate the items in a row with tabs,
commas, or spaces and end each line with a carriage return. Without the carriage return HiQ has no idea of the
dimensions of your matrix.
Text data must be saved in standard ASCII format. The only difference between the input types Script and
Text is what HiQ does with the data, since each is simply ASCII text.
Scripts generated in another program should use tabs as the indenting character, rather than spaces, since that
is the scheme that will be implemented in the Script Editor.
The Import Symbol window is not modal; that is, any time you wish to dismiss it, click on the close box at the
left end of the title bar. In the meantime, you can continue importing files.
EX P O RT I N G
A
SY M B O L
To export data from a HiQ symbol:
1. select the symbol to be exported in the Symbol List or on the Worksheet.
As an example, we will use the same symbol imported in the previous section, renamed “OuttaHere.”
National Instruments Corporation
10-3
HiQ User Manual
Import /Export
2.
Chapter 10
Select Export Symbol… from the File menu.
The Export Symbol dialog box presents information about the symbol you are about to export and provides
an opportunity to select the form of output file most appropriate to your needs.
3.
Pull down the Export Method menu to make your choice of file type.
Export methods include:
•
TEXT—(text and script) data are stored on the target file with a carriage return at the end of each line.
•
Tabbed Text—(numeric data) a tab is placed after each element of a row and a carriage return at the end of the
row. In the case of a scalar or column vector, each element is followed by a carriage return.
•
Comma Text—(numeric data) a comma is placed after each element of a row and a carriage return at the end of
the row. In the case of a scalar or column vector, each element is followed by a carriage return
•
Space Text—(numeric data) a space character is placed after each element of a row and a carriage return at the
end of the row. In the case of a scalar or column vector, each element is followed by a carriage return
•
Macintosh PICT—standard PICT format
•
HiQ Notebook Doc—(any data) a HiQ file is created and the selected symbol(s) written to it. This is the equivalent of your creating a new Worksheet and using Copy and Paste to duplicate symbols onto the new Worksheet.
4.
Click on the execute button.
The standard file dialog box appears, allowing you to name and place the file.
The export facility operates on just one file at a time unless the target file is a HiQ Worksheet. To move more
than one file to another Worksheet, select the files from the Worksheet or Symbol List, then select Export
File… from the File menu.
PR E F E R E N C E S
You have control over the following import and export attributes:
•
Decimal places (default is 18); and
•
default numeric export format: tab delimited (default), comma delimited, or space delimited.
HiQ User Manual
10-4
National Instruments Corporation
APPENDIX A
C U S T O M E R C O M M U N I C AT I O N
For your convenience, this appendix contains forms to help you gather the information necessary to help us
solve technical problems you might have as well as a form you can use to comment on the product documentation. Filling out a copy of the Technical Support Form before contacting National Instruments helps us help
you better and faster.
National Instruments provides comprehensive technical assistance around the world. In the U.S. and Canada,
applications engineers are available Monday through Friday from 8:00 a.m. to 6:00 p.m. (central time). In
other countries, contact the nearest branch office. You may fax questions to us at any time.
National Instruments
Corporate Headquarters
6504 Bridge Point Parkway
Austin, TX 78730-5039
(512) 794-0100
Technical support fax: (800) 328-2203
(512) 794-5678
Branch Offices
Australia
Austria
Belgium
Denmark
Finland
France
Germany
Italy
Japan
Netherlands
Norway
Spain
Sweden
Switzerland
U.K.
National Instruments Corporation
Phone Number
03 879 9422
0662 435986
02 757 00 20
45 76 26 00
90 527 2321
1 48 65 33 00
089 7 14 50 93
02 48301892
03 3788 1921
01720 45761
03 846866
91 640 0085
08 730 49 70
056 20 51 51
0635 523545
or 0800 289877 (in U.K. only)
A-1
Fax Number
03 879 9179
0662 437010 19
02 757 03 11
45 76 71 11
90 502 2930
1 48 65 19 07
089 7 14 60 35
02 48301915
03 3788 1923
01720 42140
03 846860
91 640 0533
08 730 43 70
056 20 51 55
0635 523154
HiQ User Manual
H i Q Te c h n i c a l S u p p o r t F o r m
Photocopy this form and update it each time you make changes to your software or hardware, and use the completed copy of
this form as a reference for your current configuration. Completing this form accurately before contacting National Instruments for technical support helps our applications engineers answer your questions more efficiently.
If you are using any National Instruments hardware or software products related to this problem, include the configuration
forms from their user manuals. Include additional pages if necessary.
Name _______________________________________________________________________________________________
Company ____________________________________________________________________________________________
Address _____________________________________________________________________________________________
____________________________________________________________________________________________________
Fax (___) ___________________ Phone (___) ___________________
Computer brand ________________ Model ________________ Processor __________________
Operating system (include version number) _________________________________________________________________
Clock speed ______MHz RAM _____MB Display adapter ___________________________________________________
Mouse ___yes ___no
Other adapters installed ____________________________________________________________
Hard disk capacity _____MB
Brand ____________________________________________________________________
Boards installed (include revision and configuration) _________________________________________________________
____________________________________________________________________________________________________
____________________________________________________________________________________________________
Describe your application _______________________________________________________________________________
____________________________________________________________________________________________________
HiQ Version _________________________________________________________________________________________
____________________________________________________________________________________________________
The problem is: ______________________________________________________________________________________
____________________________________________________________________________________________________
____________________________________________________________________________________________________
List any error messages: ________________________________________________________________________________
____________________________________________________________________________________________________
The following steps reproduce the problem:_________________________________________________________________
____________________________________________________________________________________________________
____________________________________________________________________________________________________
____________________________________________________________________________________________________
Documentation Comment Form
National Instruments encourages you to comment on the documentation supplied with our products. This information
helps us provide quality products to meet your needs.
HiQ User Manual for Macintosh and Power Macintosh, version 2.1
Title:
Edition Date: August 1994
Part Number: 320734B-01
Please comment on the completeness, clarity, and organization of the manual.
________________________________________________________________________________________
________________________________________________________________________________________
________________________________________________________________________________________
________________________________________________________________________________________
If you find errors in the manual, please record the page numbers and describe the errors.
________________________________________________________________________________________
________________________________________________________________________________________
________________________________________________________________________________________
________________________________________________________________________________________
________________________________________________________________________________________
Thank you for your help.
Name____________________________________________________________________________________
Title ____________________________________________________________________________________
Company ________________________________________________________________________________
Address __________________________________________________________________________________
________________________________________________________________________________________
________________________________________________________________________________________
Phone (____) _________________
Mail to:
Technical Publications
National Instruments Corporation
6504 Bridge Point Parkway, MS 53-02
Austin, TX 78730-5039
Fax to:
Technical Publications
National Instruments Corporation
MS 53-02
(512) 794-5678
INDEX
A
aborting script execution, 8-7
animating a graph, 6-33
atomic type, 7-2
Auto Clip
definition, 6-9
turning on and off, 6-10
auto scale, 6-10
automatic typing, 7-3
axis label, 6-9
axis options, 6-9
row and column sizing, 4-7
selecting an entire row or column, 4-6
text formats, 4-7
throw away editing changes, 4-5
default variable scope, 7-4
deleting a symbol
from the Symbol List, 3-26
from the Worksheet, 3-28
E
editing a symbol
from the Symbol List, 3-27
from the Worksheet, 3-11
equipment required, 2-1
C
case sensitivity of variable names, 7-3, 7-6
comments in HiQ-Script, 7-6
compiled scripts, 3-27, 8-7
compound keywords, 7-6
contour plot, 6-32
Create menu, 3-5
Create New Symbol dialog, 3-24
Customer Communication, A-1
cut, copy, paste between Worksheets, 3-28 to 3-29
F
Functions & Tables menu, 5-6 to 5-8
G
graph labels, 6-10
graph legend, 6-10
graph options, 6-10
graph rendering
hidden line, 6-25
lighted, 6-26
shaded, 6-26
transparency, 6-30
wire frame, 6-25
graph title, 6-10
Graph Editor tools
animation, 6-33 to 6-36
color, 6-17
lighting, 6-29
line width, 6-17, 6-18
magnify, 6-15
marker type, 6-18
move, 6-14 to 6-15
perspective, 6-30 to 6-31
D
Data Editor
autoscrolling, 4-4
cell selection, 4-5 to 4-6
clearing a selection, 4-7
cut, copy, paste, 4-8 to 4-9
data labels (tags), 4-8
deleting rows or columns, 4-7
editing a cell, 4-5
extending a selection, 4-6
inserting rows or columns, 4-7
keyboard navigation, 4-4
list of cursors, 4-9 to 4-10
moving data to and from other applications, 4-9
number formats, 4-6
preferences, 4-10
National Instruments Corporation
I-1
HiQ User Manual
Index
M
scale, 6-13 to 6-14
select, 6-11
trace, 6-19
zoom, 6-11 to 6-13
grid setting, 6-9
turning on and off, 6-10
movie
playback in movie window, 6-36
playback in the Graph Editor, 6-35
recording, 6-35
symbol, 6-36
movie playback speed, 6-36
multiple page worksheet, 3-11
H
HiQ-Script
block escape statements, 7-15 to 7-16
comments, 7-6
data types, 7-2
for statement, 7-14
if statement, 7-12
language constants, 7-23
matrix and vector notation, 7-9 to 7-11
matrix arithmetic, 7-11 to 7-12
matrix initialization, 7-10
operator precedence, 7-8
repeat statement, 7-15
scope of variables, 7-4 to 7-5
select statement, 7-12 to 7-13
semicolon at end of statement, 7-9
strings, 7-17
user functions, 7-20 to 7-23
variable names, 7-3
while statement, 7-14
HiQ-Script Editor (See Script Editor)
N
names of variables, 7-3
non-numeric types, 7-2 to 7-3
numeric data types, 7-2
numerical operators, 7-6 to 7-8
O
operator precendence, 7-8
P
parametric curve, 6-7 to 6-8
parametric surface, 6-23 to 6-24
plot colors, 6-17
plot types, 6-16
plotting a function (2D), 6-3 to 6-20
plotting a function (3D), 6-20 to 6-32
plotting a parametric curve, 6-8
plotting data (2D), 6-5
plotting data (3D), 6-21
preferences
Data Editor, 4-10
Graph Editor, 6-19
HiQ-Script Editor, 8-8
Problem Solvers, 5-8
program vs. current Worksheet, 3-21
script execution, 8-8
Worksheet, 3-21
printing the Worksheet, 3-30
Problem Solver
expression evaluation, 5-9
Problem Solvers
data fitting, 5-51
from the Create menu, 3-5
general features, 5-2 to 5-5
general roots, 5-28
I
installation, 2-1 to 2-3
intrinsic data types, 7-2
K
keyword list, 7-24
keywords, 7-7
L
language constants, 7-23
launching HiQ, 3-1 to 3-2
local variables, 7-4
logical operators, 7-6 to 7-7
logical type, 7-2
HiQ User Manual
I-2
National Instruments Corporation
Index
integral equations, 5-43
nonlinear systems, 5-17
numerical integration, 5-22
ODE boundary value, 5-38
ODE initial value, 5-31
online help, 5-5
optimization, 5-48
polynomial roots, 5-25
Save Script, 5-4
project variables, 7-4 to 7-5
legal names, 3-23 to 3-24
plot defined, 6-2
Symbol List
control of displayed symbols, 3-23 to 3-27
creating a new symbol, 3-23
deleting a symbol, 3-26
editing a symbol, 3-27
find, 3-27
introduced, 3-22 to 3-23
multiple selection, 3-25 to 3-26
placing a Symbol on the Worksheet, 3-27
renaming a Symbol, 3-27
symbol names, 3-23 to 3-24
Symbols in HiQ
adornment, 3-10 to 3-11
definition, 3-2
expanded view, 3-9
hiding the name, 3-10
loading into an editor, 3-11
resizing the expanded view, 3-10
Undo, 3-29
R
range, 6-9
renaming a symbol
from the Symbol List, 3-27
from the Worksheet, 3-6
Revert, 3-29
Revert to last Save
from the Worksheet, 3-30
S
scope of variables, 7-4 to 7-5
Script Editor
auto-entry of blocks, 8-3
automatic indentation, 8-6
compilation errors window, 8-12
compiling a script, 8-7
cross reference, 8-7, 8-12
find, 8-4
fonts, 8-7
functions menu, 8-6
Insert palette, 8-3
keyboard navigation, 8-3
line numbers, 8-5
preferences, 8-8
reverting to a saved version, 8-8
running a script, 8-7
script results stored in text symbol, 8-12
terminating script execution, 8-7
Solvers menu, 3-5
symbol
creating with the tool palette, 3-12 to 3-15
definition, 3-2
graph defined, 6-1
National Instruments Corporation
T
terminating script execution, 8-7
tool palette
creating a symbol, 3-12 to 3-15
default numeric type, 3-4
floating window, 3-3
list of tools, 3-14
shape annotation, 3-18 to 3-21
text annotation, 3-16 to 3-18
transparency in graphs, 6-30
U
undo, 3-29
V
variable names, 7-3
W
Worksheet
annotations, 3-15 to 3-21
multiple pages, 3-11 to 3-12
visible page boundaries, 3-12
I-3
HiQ User Manual