1
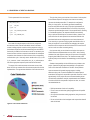
Accellera’s UVM...page 6
Accellera is working on a
verification base class library
and methodology. This article
sheds some light on where we
came from, where we are, and
where we’re going...more
A publication of mentor graphics JUNE 2010—Volume 6, ISSUE 2
Single Performance,
Multiple Locations.
By Tom Fitzpatrick, Editor
SystemVerilog Packages in
Real Verification Projects page 8
... use packages to organize your code, making
it easier to reuse and share. more
Formal Property Checking page 18
... a straightforward 7-step process for getting
started. more
Multi-method Verification of SoC
in an OVM Testbench page 22...OVM
serves as a verification platform that enables
block-to-top reuse of verification infrastructure
more
Reusable OVM Sequences Boost
Verification Productivity page 28
... the advantages of some sequence
extensions provided by MVCs more
Using an MVC at Multiple
Abstraction Levels page 33... shows
how the MVC makes it easier to debug at the
transaction level more
Accelerated Debug page 39
...an example of Vennsa Technologies’
OnPoint automated debugging tool running
in concert with Mentor’s 0-In more
From Testplan Creation to
Verification Success page 46
...PSI Electronics showing us how they
accomplished Verification of a Complex
IP Using OVM and Questa more
Agile Transformation in Functional
Verification page 51... a feature-based
approach to verification planning more
Simulation-Based FlexRay™
Conformance Testing page 55...
OVM’s flexibility being used to implement
multiple levels of abstraction in a constrainedrandom environment more
Making OVM Easier for HDL Users
page 60... some practical rules and guide-
lines to help the “HDL designer” community
enter the wonderful world of OVM more
SW Debug Using ARM’s VSTREAM
with Veloce™ page 65... much greater
performance than you’d expect from using an
emulator more
and Verification Technologist
We recently bought our 12-year-old son, David,
a drum set. He already plays piano and saxophone,
but drums have lately become something of a passion
for him. He’s been taking lessons for a few weeks,
and it was either buy him a drum set or replace the
cushions on the couch and possibly the kitchen
counters, because he was drumming on everything.
His 9-year-old sister, Megan, is also quite musical,
playing the piano and recorder. Next year, she plans to take up the flute. Much of this
musical talent comes from their mother, and obviously skipped a generation on their father’s
side of the family.
The day after we bought the drums was Mother’s
Day here in the U.S., and David and Megan decided
to perform a concert for their mom. The finale of the
concert was a duet of “The Entertainer,” by Scott
Joplin, with Megan on the piano and David on the
drums. The problem was that the piano is in the
“music room” on the first floor and David’s drums
are in his bedroom on the second floor. In order to
perform, the children were going to have to figure
out how to work together from different locations.
“How does a team
apply new approaches
to a problem, especially
when the team is
geographically
dispersed?”
—Tom Fitzpatrick
Sound familiar?
In this issue of Verification Horizons, we’ll see how many of our users and partners have
applied Mentor technology and tools to address a similar problem that we often see in our
industry. How does a team apply new approaches to a problem, especially when the team is
geographically dispersed? As we’ll see, it requires an understanding of the existing structure,
the new technology, and sometimes just a little bit of common sense and cooperation.
We start off this issue with “Accellera’s Universal Verification Methodology (UVM): The
Real Story,” by your humble correspondent and my colleague, Dennis Brophy. Having been
embroiled in standards efforts for longer than either of us would care to admit, it’s easy
sometimes for us to think that the minutiae that consume our time in committees are therefore
of the highest concern to everyone else in the industry as well. Of course, that’s not always
the case, but for those of you who have heard that Accellera is working on a verification base
class library and methodology, we hope this article sheds some light on where we came from,
where we are, and where we’re going. Besides, since I’m the editor, I get to put my article first.
Staying in the standards arena, our friend Kaiming Ho, of Fraunhofer IIS in Germany, shares
his experiences in “Using SystemVerilog Packages in Real Verification
Projects.” You’ll find some really useful recommendations on how best
to use packages to organize your code to make it easier to reuse and
share. The article concludes with an interesting discussion of how
to use classes and packages together to achieve some very useful
results.
Our friends at XtremeEDA follow up their “Agile Transformation in IC
Development” article from our February 2010 issue with the other side
of the coin in “Agile Transformation in Functional Verification.” In part
one, they lay out a feature-based approach to verification planning,
with emphasis on prioritization and incremental planning. In our next
issue, they’ll share some practical results from an actual project.
For those of you who have been “banging on the countertops” about
formal verification, our next article by our colleague Harry Foster will
show you that it’s “Time to Adopt Formal Property Checking.” Harry
gives three reasons that it is indeed the right time to adopt, and gives
you a straightforward 7-step process for getting started. With the
technology maturing to the point where you don’t need to be a formal
expert, there’s really no reason not to check it out.
Our next article is “Simulation-Based FlexRayTM Conformance
Testing – an OVM success story” from our partner Verilab. Here we
see a good example of OVM’s flexibility being used to implement
multiple levels of abstraction in a constrained-random environment.
Their work was used as part of the FlexRay Consortium effort to
produce a SystemC executable model and a conformance test
specification – all made possible by OVM and some knowledgeable
folks at Verilab.
In “Multi-method Verification of SoC Designs in an OVM Testbench,”
a team takes you through many of the issues you’ll encounter in
verifying a typical SoC design, in this case using the AMBA interconnect with multiple peripherals and one or more CPU cores.
The article shows, once again, how OVM serves as a verification
platform that enables block-to-top reuse of verification infrastructure,
including pre-packaged interface-specific VIP in the form of Questa
Multi-view Verification Components (MVCs). You’ll also see how this
infrastructure enables you to adopt formal property checking using
assertions built into the MVCs and also provides the flexibility to use
Intelligent Testbench Automation and ultimately software running
on the processor model to augment the stimulus and coverage of
your verification efforts. Another example of combining different
“instruments” in perfect harmony!
We next take a more in-depth look at MVCs in “Reusable OVM
Sequences Boost Verification Productivity” and “Faster Verification
and Debugging Using an MVC at Multiple Abstraction Levels.” First we
show you the advantages of some sequence extensions provided by
MVCs, enabling you to write sequences at a higher level of abstraction,
and how to use the existing OVM infrastructure to control which
sequence runs on a particular MVC. The second article shows how the
MVC makes it easier to debug at the transaction level and plan your
verification efforts to ensure protocol compliance.
Our Partners’ Corner section, as always, includes several articles
from our Questa Vanguard partners. We continue the discussion of
debugging with “Accelerated Debug: A Case Study” from our friends
at Vennsa Technologies. This article provides an example of their new
OnPoint automated debugging tool running in concert with Mentor’s
0-In to quickly diagnose the cause of failing assertions. Next, we find
PSI Electronics showing us how they accomplished “Verification of
a Complex IP Using OVM and Questa: From Testplan Creation to
Verification Success.”
2
Our final Partners’ Corner article lets you take advantage of
the excellent insight John Aynsley of Doulos offers in “Making OVM
Easier for HDL Users.” This article includes some practical rules and
guidelines to help those of you in the “HDL designer” community
enter the wonderful world of OVM.
We close this issue with a collaboration between Mentor’s
Emulation Division and our friends at ARM in “Accelerating Software
Debug Using ARM’s VSTREAM with Veloce™ Hardware Emulation.”
This article shows Veloce’s TestBench XPress technology, TBX,
being used with ARM’s VSTREAM debug transactor to connect a
software debugger directly to an ARM-based design in the same way
the debugger can be used with Questa, but with the much greater
performance you’d expect from using an emulator.
Now I know you’re wondering how David and Megan managed
to pull off a concert from two different rooms on two different floors.
Fortunately, David’s drums were loud enough that Megan could hear
them downstairs. For David to hear Megan, they used our walkietalkies! Megan’s was broadcasting from the piano and David had
his up in his room so he could hear the piano. The concert was a
smashing success – it even brought a tear to their mom’s eye.
I couldn’t have been a prouder dad.
Have a great DAC, and be sure to drop by the Mentor booth
to say hello.
Respectfully submitted,
Tom Fitzpatrick
Verification Technologist
Mentor Graphics
Hear from
the Verification
Horizons team
weekly online at,
VerificationHorizonsBlog.com
3
Table of Contents
Page 6...Accellera’s
Universal Verification
Methodology (UVM): The Real Story
by Tom Fitzpatrick and Dennis Brophy, Mentor Graphics
Page 8...Using
SystemVerilog Packages
in Real Verification Projects
by Kaiming Ho, Fraunhofer IIS, Erlangen, Germany
Page 18...Time
to Adopt
Formal Property Checking
by Harry Foster, Chief Scientist, Verification, Mentor Graphics
Page 22...Multi-Method
Verification
of SoC Designs in an OVM Testbench
by Ping Yeung, Mike Andrews, Marc Bryan and Jason Polychronopoulos,
Product Solution Managers, Verification, Mentor Graphics
Page 28...Reusable
Sequences Boost
Verification Productivity and Reduce
Time to Market for PCIe
by Rajender Kumar Jindal and Sharat Kumar,
Lead Members Technical Staff, Mentor Graphics
Page 33...Advanced/Faster
Verification
and Debugging Using Multi Abstraction
Level PCIe MVC
by Yogesh Chaudhary, Lead Member Technical Staff, Mentor Graphics
4
Partners’ Corner
Page 39...Accelerated Debug: A Case Study
Verification Horizons is a publication
of Mentor Graphics Corporation,
all rights reserved.
by Sean Safarpour and Yibin Chen, Vennsa Technologies Inc.
Editor: Tom Fitzpatrick
Program Manager: Rebecca Granquist
Page 46...Verification
of a Complex IP
Using OVM and Questa: From Testplan
Creation to Verification Success
by Julien Trilles, verification engineer, PSI-Electronics
Page 51...Agile
Transformation
in Functional Verification, Part 1
by Neil Johnson, Principal Consultant and
Wilsonville Worldwide Headquarters
8005 SW Boeckman Rd.
Wilsonville, OR 97070-7777
Phone: 503-685-7000
To subscribe visit:
www.mentor.com/horizons
To view our blog visit:
VERIFICATIONHORIZONSBLOG.COM
Brian Morris, Vice President Engineering, XtremeEDA
Page 55...Simulation-Based
FlexRayTM
Conformance Testing—an OVM
Success Story
by Mark Litterick, Co-founder & Verification Consultant, Verilab
Page 60...Making
OVM Easier for HDL Users
by John Aynsley, CTO, Doulos
Page 65...Accelerating
Software Debug
Using ARM’s VSTREAM with Veloce™
Hardware Emulation
by Javier Orensanz, ARM and Richard Pugh, Mentor Graphics
5
Accellera’s Universal Verification Methodology (UVM): The Real Story
by Tom Fitzpatrick and Dennis Brophy, Mentor Graphics
“The very essence of leadership is that you have to have vision.
You can’t blow an uncertain trumpet”
- Theodore Hesburgh
Once upon a time, there were three verification methodologies.
One was too hard. It was based on a language that only one vendor
supported and, while it had some good ideas, the language and lack of
multi-vendor support limited its use. One was too closed (and wasn’t all
that easy, either). It was based on SystemVerilog, a standard language
that almost everyone supported, but its vendor tried to keep customers
locked in and competitors locked out. And one methodology, based
on Mentor Graphics’ vision that a methodology should be made from
an open base class library that all of the “Big-3” EDA vendors could
support, was just right.
The first vendor eventually realized that they would have to support
SystemVerilog, and joined Mentor in developing the OVM. The OVM
incorporated some ideas from the Cadence® eRM and aligned them
with Mentor’s AVM to provide the first open-source, multi-vendor
SystemVerilog verification methodology. And the crowd went wild.
In just over a year, OVM established that Mentor’s vision was indeed
“just right” in that it quickly challenged and then overtook the VMM
as the de facto standard verification methodology.
This, of course, caused a certain amount of consternation in many
corners of our industry, both among VMM users, who no longer
wanted to be locked into a proprietary methodology, and among
VMM-based IP suppliers, who now had to create both OVM and
VMM versions of their IP to meet their customers’ demands. Perhaps
nowhere was this consternation greater than among our friends at
Synopsys®, who realized that their vision of a proprietary methodology
tied to VCS was not what customers wanted.
As usually happens when things like this come to such a point,
the industry turned to Accellera to try and resolve things, and the
Verification Intellectual Property Technical Subcommittee (VIPTSC) was born. Its first job was to develop a standard solution so
that OVM and VMM IP could work together. This standard, with an
accompanying library, was released in September, 2009.
6
It was during this effort that Synopsys finally relented and released
VMM in open-source form, from which it was learned that VMM (tied
as tightly as it was to VCS) included non-standard SystemVerilog
code. This then allowed Mentor and Cadence to release a version of
VMM that complied with the standard and, for the first time, allowed
users to run VMM code on Questa and Incisive. Combined with the
interoperability library, VMM users now had the ability to migrate to
OVM and away from VCS. And the crowd went wild.
After the completion of this short-term goal, the VIP-TSC moved
on to its longer-term goal: Develop a single base class library
for verification that all vendors would support and all users could
embrace. In other words, Accellera took on the task of fulfilling
Mentor’s vision. This vision was further justified when the TSC chose
OVM2.1.1 as the basis for what is now called the Universal Verification
Methodology (UVM).
In May, 2010, the TSC released an “Early Adopter” version of the
UVM. Here’s how the UVM 1.0EA kit was created:
1.The TSC took OVM2.1.1 and ran a script to change “ovm” to “uvm”
and “tlm” to “uvm_tlm.” 1
2.We enhanced the callback and objection mechanisms to add
a bit more functionality. Note that these are not fully backwardcompatible with the OVM2.1.1 implementation of these features,
but everything else is backward-compatible.
3.We added a new “message catching” feature that lets you add
callbacks to control the processing and printing of messages.
Keep in mind that this is not an official Accellera standard, but it
is nonetheless a great opportunity for folks to try it out and provide
feedback to the TSC. We’ve already received word from several users
who have run the conversion script on their existing code (as a test we don’t recommend you convert to UVM in the middle of a project)
and run it with the UVM-EA kit successfully, proving that UVM is, for
all intents and purposes, about 99 & 44/100% pure OVM. Because of
this, all existing OVM training material, including Mentor’s Verification
Academy and the Open Verification Methodology Cookbook still serve
as great resources to get you started with OVM/UVM. We will continue
to work with the other members of the TSC to add functionality to UVM
to ensure that the UVM1.0 release, when it becomes available, will
satisfy user requirements while keeping “code-bloat” to a minimum.
So what should you do now? First of all, relax. UVM1.0EA works
today in Questa so you can take a look at UVM at your leisure. Mentor
is committed to your success, and when UVM 1.0 gets officially
released, we will support it fully and will continue to do so. If you’re
an OVM user today, you can continue using OVM and switch to UVM
when you’re comfortable doing so.
While it may be the case that some VMM concepts eventually
become part of UVM, given the two different code bases it is almost
certain that VMM code will not be incorporated, nor will UVM be
backward-compatible with VMM. So, if you’re a VMM user, you’re
going to have to switch at some point. We recommend you do it sooner
rather than later and Mentor offers UVM-compatible VIP and skilled
consulting services to facilitate your transition to UVM. Meanwhile, you
can use the Accellera interoperability library to begin moving to OVM
while keeping some of your VMM IP during the transition.
What began with Mentor’s release of the open-source AVM has now
reached the point of industry-wide cooperation to realize the vision
of a single open-source verification class library and methodology,
supported by the three major EDA vendors and endorsed by many
other vendors and users. Four years ago, such a story might have
seemed like a fairy tale, but now, we can all live happily ever after.
The “seed kit” used for UVM development was, in fact, OVM2.1.1
with this script run on it. This task was done by Synopsys, which is the
reason that the files in the UVM1.0EA kit have a Synopsys copyright
on them, in accordance with the Apache license.
1
All trademarks and registered trademarks listed are the property
of their respective owners.
7
Using SystemVerilog Packages in Real Verification Projects
by Kaiming Ho, Fraunhofer IIS, Erlangen, Germany
This paper details some of the key features and frustrations of using
the package construct in SystemVerilog. The package construct is
compared to similar features in other languages such as the identically
named construct in VHDL and namespaces in C++. Valuable lessons
learned over the course of multiple projects in the development
of verification environments are described, and the paper makes
recommendations for basic DOs and DONTs for SystemVerilog
package use. The theme of code reusability is always important, and
tips on how packages can be used to achieve this are discussed.
Users of languages such as VERA, which does not have the
package construct, are more accustomed to using include files, which
provide some but not all the features packages provide. The paper
discusses why the continuance of this approach, while possible in
SystemVerilog, is not recommended and why the package construct is
superior.
Finally, the paper discusses how SystemVerilog allows packages
and classes to be mixed in interesting ways not seen in other
languages.
I. INTRODUCTION
The package construct is one of the many incremental
improvements added to SystemVerilog that Verilog notably lacked.
With its introduction, all users of SystemVerilog, from RTL designers
to verification engineers, now have an encapsulation mechanism
that VHDL users have had for many years. Since SystemVerilog
also added the class data type many interesting usage models for
packages are possible as a consequence, some of which are not
applicable to VHDL since VHDL does not provide classes.
This paper is divided into three sections. The first summarizes the
properties of the package construct, highlighting important features
that underpin the rationale for using packages. Similar constructs in
other languages, such as VHDL packages and C++ namespaces are
discussed and compared. Important changes to the semantics of the
construct made between IEEE 1800-2005 [1] and 1800-2009 [2] that
are of interest to verification engineers are highlighted.
The second section describes practical issues that arise from the
deployment of SystemVerilog verification environments. Problems that
we have encountered in recent projects are described and the pros
and cons of various solutions discussed. The last section explores
8
advanced things one can achieve with packages. The discussion
centres on how packages and classes can be used together to
implement common design patterns, solving problems such as
bridging hierarchical boundaries.
II. PROPERTIES OF SYSTEMVERILOG PACKAGES
SystemVerilog (SV) packages are a top-level design element that
provides an encapsulation mechanism for grouping together data
types (including classes), tasks/functions, constants and variables.
Additionally, assertion related constructs such as sequences and
properties can be encapsulated, which is of particular interest to
verification engineers. Once encapsulated into a named package,
the contents are available for use in other design elements (such as
modules, programs, interfaces or other packages) irrespective of
module or class hierarchy.
Surprisingly, this construct is unavailable to Verilog (1364-1995
and 1364-2001) users, who often resort to using modules to emulate
package behaviour. Modules also serve as an encapsulation
mechanism, and when left uninstantiated, become a top-level module
whose contents are accessible through hierarchical reference. It is
common in FPGA libraries to have global definitions and/or variables,
and it is informative to note that the VHDL version of these libraries
use the package construct while the equivalent library in Verilog
uses modules [6]. Caution must be exercised to ensure that the
module must never be instantiated more than once since variables
encapsulated inside will then exist multiple times. The use of
packages avoids this problem, since packages are not instantiated,
thereby guaranteeing that all variables inside are singletons (with
exactly one instance in existence).
Packages can be considered as stand-alone elements, dependent
only on other packages and not on anything in the context they
are used. Thus, they can be compiled separately into libraries of
functionality, pulled in only when required. One can view this to be
conceptually equivalent to how ‘C’ libraries are organised and used.
This stand-alone property means that code inside packages cannot
contain hierarchical references to anything outside the package,
including the compilation unit. Other encapsulation mechanisms such
as modules and classes do not require this, so a module/class meant
to be reusable must rely on the discipline of the writer to avoid these
external dependencies. Thus packages represent a much better
mechanism for encouraging reuse, since external dependencies are
explicitly disallowed and checked at compile-time. Users of purchased
verification IP should insist that their vendors provide the IP in the form
of a package.
lessons learned from the previous mistakes refine the implementation
choices made going forward. This section discusses some selected
lessons from this experience.
While the stand-alone property of packages may make it seem that
it is impossible to tightly integrate outside code with package code, this
is not the case. By using callbacks and abstract base classes, this is
possible. A subsequent section describes this further.
A. COMPILE PACKAGES BEFORE USE. While this may
sound obvious, it is sometimes not as trivial as it seems. Nicely written
packages are good reuse candidates and may be referred to by other
packages, bringing up the issue of inter-package dependencies.
Large projects typically have many packages with complex interdependencies, with some packages reused from other projects and
others reused from block to cluster to chip level environments. The
mechanism which controls how all the files for a particular simulation
are compiled, be it one file at a time, or all files together, must infer the
dependency structure of the packages and generate an appropriate
compile order. This is most easily done by a tree graph with each
node representing a package. From the resultant tree, the packages
furthest away from the root must be compiled first. As the project
evolves, careless modifications can lead to the formation of circular
dependencies, resulting in no suitable compile order. This is most
likely to occur in projects with a large set of packages and multiple
environments that use different subsets of packages.
SV packages were inspired by and share many commonalities
with similar constructs in other languages. Namespaces in C++ are
similar, providing a scope for encapsulating identifiers. Explicit access
is given through the :: scope operator, identical in both SV and C++.
Importation of namespace symbols in C++ with the using keyword
mirrors the use of the import keyword in SV. A notable difference is
that nested C++ namespaces can be hierarchically referenced using
multiple :: operators. A user which imports a SV package, top_pkg,
which imports another package, bottom_pkg, does not automatically
have access to any of the symbols in bottom_pkg, and access through
multiple :: operators is not possible. This lack of package “chaining”,
and the closely related export statement, is described in more detail in
a subsequent section.
VHDL packages also share many common features with SV
packages. One notable feature of packages in VHDL absent in SV is
the explicit separation of the package header and body. The header
represents the publically visible interface to the package, giving access
to type definitions and function prototypes. The body implements
the various functions described in the header, and are invisible and
irrelevant to the user.
SystemVerilog allows the collection of files defining a simulation
to be broken into compilation units, the definition of which is
implementation dependent. This is often a function of the compile
strategy implemented by the tool, with an “all-in-one” command line
defining one large compilation unit for all files, and an “incrementalcompile” strategy defining compilation units on a per file basis.
Various issues ranging from visibility to type compatibility are linked
to compilation units, leading to unpleasant surprises when switching
compile strategies. Using packages avoids this problem, since the
rules of visibility and type compatibility surrounding package items are
independent of compilation unit. The problems described later in III-E
do not occur when packages are used.
III. PRACTICALITIES IN PACKAGE USE
Over the past several years, we have deployed SV environments
using packages in multiple projects. With each passing project,
The following guidelines are suggested to minimize the chance of
circular dependencies among packages as well as promote better
reuse.
• Prefer smaller packages to larger ones.
• Don’t let the entire team modify packages.
• Adequately document the contents of every package and what
each package item does. It is also important to document which
projects and environments use a particular package.
• Categorize packages into two types: those reused from other
projects, and those reused from block to cluster to chip levels.
Finer grained package structuring reduces the possibility of
unintended dependencies. Packages designed to be reused
over multiple projects should be as flat and dependency free as
possible. This allows re-users of the package to not pull in additional
dependencies, which may cause problems. A typical package
structure involves separate packages for each block level, which are
brought together to form packages for higher-level environments.
The direction of reuse should start from block environments and
move upwards. Monolithic environments are particularly at risk
of introducing downward dependencies as code evolves, creating
potential circular dependencies.
9
When circular compile dependencies do occur, they can be resolved
by repartitioning code between packages. The extreme solution of
creating one huge package, guaranteed to have no circular compile
dependencies, is always an option if one gets desperate.
different vendors. Package chaining has been addressed in the
SV-2009 LRM, which states that such chaining does not occur
automatically. The new export statement was added to allow users of
packages explicit control on which symbols are chained and visible at
the next level up.
B. IMPORTING PACKAGES. The easiest way to use
packages is through a wildcard import, with the “import pkg::*”
statement. This gives the importing scope access to all identifiers
inside the package without having to use explicit imports for each
desired identifier, or prefixing each identifier with the package name.
While the latter two methods of package use are legal, they can be
overly verbose and unpractical. Prefixing at each use has the added
disadvantage of making it difficult to quickly determine package
dependencies. Thus, using wildcard imports while understanding their
disadvantages is the most practical strategy. These disadvantages
are discussed below.
The addition of the export statement alone does not satisfactorily
solve all the issues surrounding package chaining and imports. It does
not give the author of a package any control over which items may
be imported. The local keyword, which currently can only be applied
to class items, can be adopted for packages to provide this access
control functionality. This optional qualifier can be applied to package
items such as tasks, functions, and data types. We urge that this
enhancement, which can be viewed as complimentary to the export
statement be added to the next revision of the SV LRM. The example
below shows how a helper function, for use only inside the package,
can be hidden from the user of the package.
When a package is wildcard imported, the importer’s namespace
is widened to include every possible symbol from the package, even
the undesired ones, or the ones that the package designer had no
intention of making externally visible. Noteworthy is that the labels of
enumerated types are also added. Thus, special care must be made
to avoid naming conflicts, when possible. This is sometimes difficult
with packages containing a lot of code, or where the code has been
split out into multiple sub-files.
Purchased IP may be in package form, but encrypted, meaning
that the user has no way of knowing what a wildcard import will bring.
When the user imports multiple packages, the risk of naming conflicts
between the various packages or with the importing scope is even
higher. While naming conflicts are legal in some situations, the rules
defining how these are resolved are lengthy and complex. Following a
naming convention using reasonable and relatively unique names can
greatly reduce the changes of naming conflicts, thus avoiding the task
of having to learn SV’s name resolution rules.
The various importing mechanisms lack a form which compromises
between explicit importing of individual items and wildcard importing of
all items. Work has begun on the next revision of the SV LRM and we
urge that a new importing form, which accepts regular expressions, be
added. This allows the user to remain explicit in what is to be imported
while being more expansive to cover multiple items per import line.
When one package imports items from a second package, the
question of whether importers of the first package see the second
package’s items is referred to as package chaining. The SV-2005
LRM was silent in this regard, which has led to the unfortunate
situation of diverging behaviour between implementations from
10
package my_pkg;
// both public_func1() and public_func2()
// call helper_func(), using the type
// data_t as input
function void public_func1(); ... endfunction
function void public_func2(); ... endfunction
local typedef struct { ... } data_t;
local function int helper_func (data_t din);
...
endfunction
endpackage
Being able to use the local qualifier allows the public and private
portions of packages to be clearly separated. This partitioning is
exactly what is provided in VHDL through the use of package headers
and bodies.
Package items that are local may not be imported, regardless of
which importation method is used. The package’s author makes this
decision. In contrast, the use of the export statement controls which
items, once imported, may be imported by the next level up. Here,
the package’s user decides which items are chained. It is interesting
to note that using the export statement in combination with a wrapper
package can emulate the effect of specifying certain package items as
local.
C. USING SUB-INCLUDES. When many large classes are
defined in a package, the sheer amount of code can lead to very large
and difficult to maintain files. It is tempting to separate the package
contents into multiple files, then have the package definition consist
simply of a list of `include statements. This solution is seen often, but
several dangers need to be managed, as discussed below.
By separating package code out into other files, the original context
can be easily forgotten. Allowed dependencies owing to the fact
that multiple files make up the compilation unit, as well as disallowed
ones are not readily evident. A further problem is that the file could
be included in multiple places, resulting in several packages with
the same definition. These packages could then be used together,
causing problems at import. Specifically, identical type definitions
included into two different packages may not be compatible. One must
remember that with packages, it is no longer required or appropriate to
implement reuse at the file level using `include statements.
The context loss problem can be easily addressed by having a clear
warning comment at the top of the file indicating that only the intended
package may include the file. An example is shown below.
file: my_huge_pkg.sv
package my_huge_pkg;
`include “my_class1.svh”
sub-files. Each included file would check that the symbol is defined
and trigger an error if it is not. The previous example, modified to
incorporate this, is shown below.
file: my_huge_pkg.sv
package my_huge_pkg;
`define _IN_MY_HUGE_PKG_
`include “my_class1.svh”
endpackage
file: my_class1.svh
`ifndef _IN_MY_HUGE_PKG_
** ERROR
ERROR
ERROR
** This file is meant to be used only by
** “my_huge_pkg.sv”. DO NOT directly include
** in any other context.
`error “SV doesn’t have this”
`endif
class my_class1;
...
endclass
`include “my_class2.svh”
endpackage
Since the SV pre-processor does not have the `error directive,
inserting text which will cause a compile syntax error can be used to
do the same thing.
file: my_class1.svh
// WARNING:
// This file is meant to be used only by
// “my_huge_pkg.sv”. DO NOT directly include
// in any other context.
class my_class1;
...
endclass
A more robust mechanism, for people who don’t read comments, is
to use an #ifdef check with an #error clause to trigger an immediate
compilation error in cases of unintended inclusion. Modelled after
the mechanism used by ‘C’ include files, the main package file would
define a unique pre-processor symbol, then include the various
D. THE PARAMETER PROBLEM. Parameters can be
used to define constants. They can also be used to facilitate generic
programming, where the parameterized values can be varied. The
usage of constant parameters in packages is problem free and a
recommended replacement for pre-processor `defines for constants.
This effectively gives a namespace to constants and avoids the
potential problem of multiple (and/or conflicting) pre-processor
symbols in the same compilation unit.
The second usage, for generic programming, causes a serious
problem when used in the context of a package. When a function
defined in a package uses a parameter, one might think a template
function is defined. However, since packages are not instantiated,
there is no way to vary the parameter to create different specializations
of the function. The example below shows the problem for both type
11
and value parameters. The same function defined in a module does
not suffer this problem, since many instances of the modules may be
created, with varying parameterizations.
package utils_pkg;
virtual class colour_trans#(int win=8);
localparam wout = win+1;
static function void do_rct(
package utils_pkg;
parameter type T = int;
input bit signed[win:1] rgb[3],
typedef T T_list[];
output bit signed[wout:1] ycbcr[3]);
endfunction
// extend ‘n’ samples right
endclass
// extend ‘m’ samples left
endpackage
function T_list dwt_extend(T sin[],int n,m);
T sout[$] = sin;
int unsigned size = sin.size();
for (int i=0; i<m; i++)
import utils_pkg::*;
initial
begin
sout = {sout[2*i+1], sout};
bit signed [18:1] rgb[3];
for (int i=1; i<=n; i++)
bit signed [19:1] ycbcr[3];
sout = {sout, sout[$-(2*i)+1]};
colour_trans#(18)::do_rct(rgb, ycbcr);
return sout;
end
endfunction
parameter win = 8;
localparam wout = win+1;
function void do_rct(
input bit signed[win:1] rgb[3],
output bit signed[wout:1] ycbcr[3]);
endfunction
endpackage
To overcome this problem, a static class can be used to wrap
the function. The class can be parameterized, and access to the
function is through the class resolution operator along with the
parameterization. This, however, leads to unsynthesizable code,
a problem if the code is to be used for RTL design. We have found
that this problem occurs often in modelling mathematical algorithms
meant for a DSP where the bit-depth of the operands is parameterized.
An example of the solution is shown following.
E. DEFINING CLASSES AT TOP-LEVEL. Class definitions
may appear in various design elements, but packages remain by far
the best place for classes. Alternatives such as modules or program
blocks suffer from problems such as poor accessibility or reusability
issues due to hierarchical references.
Users with a VERA background often do not appreciate the
multitude of choices where classes may be defined. In VERA, all
classes are typically defined in separate files, included when required
and exist in a single global scope — in other words, “floating” at
top-level. The code example below illustrates this, with each box
representing a separate file and compile.
class logger {
integer curr_sev;
task put_msg(integer lvl, string msg);
}
task logger::put_msg(integer lvl, string msg)
{ ... }
12
#include “logger.vrh”
class ahb_trans {
logger log_obj;
task new(logger l) { log_obj = l; }
}
#include “logger.vrh”
#include “ahb_trans.vrh”
class ahb_write_trans extends ahb_trans {
task new(logger l) { super.new(l); }
}
#include “logger.vrh”
#include “ahb_trans.vrh”
#include “ahb_write_trans.vrh”
program top {
logger log_obj;
ahb_trans
a1;
ahb_write_trans a2;
log_obj = new;
a1 = new(log_obj);
a2 = new(log_obj);
}
While an equivalent structure is possible in SV, this usage style is
not recommended. Not only are these potentially non-reusable, the
rules governing such structures (compilation-units) have changed
between SV-2005 and SV-2009.
When class (or other) definitions do not appear in a module,
package or program block scope, these “floating” definitions are part
of the compilation unit scope (also called $unit). SV-2005 specifies
that $unit behaves as an anonymous package. The consequences
of this are significant and negative. Since the package is unnamed,
there is no way to refer to any of its contents outside the compilation
unit. Additionally, having to adhere to the rules governing packages
means the code in $unit may not have hierarchical references. Unable
to enjoy the advantages of package membership but still subject to its
restrictions, the anonymous package concept is overall a bad idea and
should be avoided.
SV-2009 has completely eliminated the term “anonymous package”
from the LRM and changes the semantics of compilation-units to allow
hierarchical references. The reasoning behind this is that compilationunits are not considered stand-alone, but rather always considered
within some other context. This allows for the use of top-level
classes with hierarchical references (consistent with the VERA usage
described above), but the code cannot be reasonably considered
reusable.
Notwithstanding the relaxation of rules in SV-2009, we recommend
against the use of “floating” code in compilation- unit scopes. As
previously mentioned, situations may arise where the definition of
compilation unit boundaries is dependent not only on the way the
source files are specified on the command-line to the compiler, but
also compiler implementation decisions allowed by the LRM and
outside the control of the user.
Further complicating the issue is the inconsistent application of the
rules among different simulators. One product strictly enforces the
SV-2005 hierarchical reference rule for compilation units even as the
LRM has changed to allow for it. Surveying the releases over the past
3 years of another product shows that early versions falsely allowed
hierarchical references in packages, with later versions corrected
to produce a compile error, compliant with SV-2005. The latest
revision adopts SV-2009 rules, reallowing hierarchical references in
compilation units.
Another important issue is the type compatibility rules in SV (both
2005 and 2009 versions) surrounding compilation units. User-defined
types and classes residing in the compilation-unit scope, as will be
the case when top-level include files are used, are not equivalent
to another type with the identical name and contents in another
compilation-unit. Using the same include file for both compiles,
ensuring that the type’s name and contents are identical, does not
make the types equivalent. An “all-in-one” compilation strategy with
one large compilation-unit solves this problem, but this precludes
the advantages of using separate compile, including the creation of
libraries of reusable code. Using packages for these user-defined
types is a superior approach, independent of compilation strategy
adopted or how any tool implements compilation-units.
The type checking that an SV simulator performs occurs after all the
source files are compiled, at the elaboration (linking) stage. In other
words, the problem described above passes compile, but fails to link.
One may wonder why the same approach in “C” does not encounter
this problem. The key difference lies in the nature of the object file,
which is low-level assembly code for the case of a “C” compiler.
The type information is long gone, and the linker resolves symbols,
reporting an error when symbols are not found or duplicated.
13
IV. ADVANCED USE CASES (CLASSES
AND PACKAGES)
Packages and classes may be mixed together to implement
interesting and useful things.
package ebcot_pkg;
// define callback function interface that
// ‘ebcot_enc’ will use.
A. SINGLETON IMPLEMENTATION. The pure nature
of its specification means that packages are singletons, or objects
with exactly one instantiation. One can use classes with a private
constructor to also implement the singleton design pattern and both
approaches are equally effective.
// (pure not in SV-2005)
Singletons find several uses in testbenches, from the encapsulation
of global variables to the creation of testbench services such as
logging objects and abstract factories. While ultimately a question of
style, the author has the flexibility to choose between package- and
class-based implementations. We find the package-based approach
more lightweight, suitable for global variables such as error counters.
The class-based approach is more suitable when the singleton is used
as part of another design pattern, such as factories.
function ebcot_enc(data, state,
B. CALLBACKS AND ABSTRACT BASE CLASSES.
The value of packages being standalone is its reusability.
However, each reuse situation might have slightly different
requirements in its interaction with package code. Hierarchical
references from package code are not allowed and a workaround
using DPI and strings with paths, suggested in [5], violates the spirit of
the rule. We strongly recommend against it. A better solution, using
callbacks, is recommended.
Well-defined and placed callbacks provide a mechanism for
customization while at the same time keeping the package code
closed. This technique is well proven in multiple verification
methodologies and found in software libraries such as the standard
C library. It is instructive to illustrate from there the signal() function,
shown below.
virtual class ebcot_encoder_cb;
pure virtual task push(...);
endclass
ebcot_encoder_cb cb=null);
// iterate over rows/cols, calling ‘doit’
for (int r=0; r<nrows; r+=4)
for (int c=0; c<ncols; c++)
begin
partial = doit(data,state);
// execute callback, if it exists
if (cb!=null) cb.push(partial);
end
endfunction
endpackage
// Application which uses ebcot_pkg::ebcot_enc
module enc(clk, data, data_valid);
import ebcot_pkg::*;
// customize callback for this application
class my_enc_cb extends ebcot_encoder_cb;
task push(...); ... endtask
endclass
my_enc_cb cb = new;
signal(int sig, void (*func)(int));
always @(posedge clk)
// call encoder, passing in callback
This allows the user to register a callback, func, to be called when
the named event occurs. Here, the callback is a function pointer,
reminding us that an object-oriented language is not required for
implementations. SV has no function pointers, so implementations
using abstract base classes are used. The example below illustrates
this.
14
if (data_valid) ebcot_enc(data,state,cb);
endmodule
An abstract base class with a pure virtual method is defined in the
package alongside all the other contents. In each use situation, this
base class is extended to concretely implement what the function is
to do. An object of this extension is then indicated when the package
code is used. The example above provides the callback procedurally
as part of the entry point to the package code. Many other techniques
of “registering” the callback are possible.
C. CONNECTING TESTBENCH COMPONENTS
WITH ABSTRACT BASE CLASSES. The SV language
unifies a hardware description language, with its statically elaborated
module hierarchy with features from object-oriented programming, with
dynamic elements such as class objects. It is sometimes necessary
to merge the two worlds together in a testbench. The combination of
classes and packages, along with abstract base classes is one way to
achieve this.
When testbench components (such as transactors), written
as SV modules need to interface to other class-based testbench
components, a bridge needs to be created. The interface that the
module wishes to expose needs to be written as a set of tasks/
functions forming an API. The class-based component may assume
this API in its abstract base class form. The module-based component
implements the concrete class extended from this virtual base. The
abstract base class needs to be globally visible and thus must be
implemented in a package. The concrete extension is normally local
and defined in the module, since access to the variables/ports in the
module’s scope is required. A handle to an instance of the concrete
extension class is obtained through an accessor function, which can
then be bound to the class-based world.
This technique, an extension of the one described in [4], allows
testbench components, regardless of their hierarchical relationship, to
communicate with each other. This is done without the use of hardcoded XMRs (cross-module references), or virtual interfaces. While
the motivation in [4] centered around BFMs, our treatment is more
general, abstracting the communication with an API embodied in an
abstract base class. Not only a class object and module instance can
be bridged, but also two modules can also be bridged. One recent
project uses this technique to embody the API of a module-based
testbench-top (test harness), of which there were several varieties
including multiple block levels to chip level harnesses. This API was
then passed to a series of testcases (scenarios), which could be
implemented either as top-level modules or classes.
An example of this technique is following. A module-based memory
with a set of backdoor tasks exists in the statically elaborated world.
The API for these tasks can be exported and connected to any other
component, be it another module (as shown) or another class (not
shown). All components are independent, with only a single place (in
‘harness’) where everything is tied together.
The package that holds the abstract base class representing the API
is shown below:
package mem_access_pkg;
virtual class mem_access;
pure virtual function bit [7:0]
backdoor_read(bit [31:0] addr);
pure virtual function void
backdoor_write(bit[31:0] a, bit[7:0] d);
endclass
endpackage
The module based memory model, ‘ddr’, implements backdoor
memory access functions. The module-based version of the functions
may be called using hierarchical reference. The class-based version
may be used by any component regardless of hierarchy, once a handle
to the API object has been obtained.
module ddr;
bit [7:0] mem_array[bit[31:0]];
// backdoor memory access functions
function bit [7:0] backdoor_read(
bit [31:0] addr);
return mem_array[addr];
endfunction
function void backdoor_write(
bit [7:0] d, bit[31:0] addr);
mem_array[addr] = d;
endfunction
// implement class-based version
import mem_access_pkg::*;
class my_mem_access extends mem_access;
function bit[7:0] backdoor_read(
bit[31:0] addr);
15
return ddr.backdoor_read(addr);
endfunction
The top level testbench module ties everything together and is the
only place where the hierarchical relationships (u_ddr and u_oth) are
used.
// NB:arguments swapped for illustration
function void backdoor_write(
bit [31:0] a, bit [7:0] d);
ddr.backdoor_write(d,a);
module harness;
ddr u_ddr();
sister_module u_oth();
endfunction
endclass
initial
begin
// definition of object, with accessor
my_mem_access _obj;
function mem_access get_mem_access();
// this triggers u_oth to do mem accesses
u_oth.put_mem_access(u_ddr.get_mem_access);
#10;
if (_obj==null) _obj=new;
// again, but with hierarchical reference
return _obj;
// to functions in u_ddr
endfunction
endmodule
u_ddr.backdoor_write(8’h45, 100);
$display (“read=%x”,
u_ddr.backdoor_read(100));
end
The module below shows how the class-based API enables the
backdoor access functions to be used, without knowledge of the
hierarchical relationship between the two modules. Only the package
holding the abstract base class is required.
module sister_module;
import mem_access_pkg::*;
mem_access ma_handle;
function void put_mem_access(mem_access a);
ma_handle = a;
endfunction
initial
begin
wait (ma_handle != null);
ma_handle.backdoor_write(100, 8’h2b);
$display (“read=%x”,
ma_handle.backdoor_read(100));
end
16
endmodule
Without the use of packages to store the abstract base class, this
technique becomes hard to implement. One can use an include file for
the class, including it in each place that requires it. However, this runs
into the type compatibility problems described previously.
Alternatives to this approach include using hard-coded XMRs from
the class to module in question. Not only is this not reusable due to
the hard-coded XMRs, this is not even legal when the class is defined
in a package or program block scope.
D. BINDS, PACKAGES, AND WHITE-BOX TESTING.
The combination of the SV bind construct along with a package
implementing a global symbol-table allows verification code to
be deeply embedded in a DUT with no hard-coded hierarchical
references. A module or interface with the verification code, be it
assertions, a monitor, or coverage collector is bound to the DUT
module in question. Access to the results of the monitor or coverage
collector is normally problematic, requiring hierarchical references
through the DUT module hierarchy to reach the target.
By using packages, each monitor can define an API and register
it in a global symbol table implemented in the package. The enduser of the monitor/coverage result can access the API through the
package. The symbol table acts as a drop-box and avoids the need
for hierarchical references.
E. POOR MAN’S INHERITANCE. Packages containing
variables and tasks/functions can be compared to classes with data
and methods. However support for inheritance of packages is not
as flexible as that in classes. A so-called poor man’s inheritance
mechanism is possible, allowing for static (compile-time) polymorphism
but not the dynamic polymorphism that classes can implement. A
wrapper package can be created which redefines some of the
functions in the underlying package, provided the prototypes are
identical. In the extreme case where all functions are redefined
a complete substitute package can be made, with a different
implementation of all functions provided by the package.
REFERENCES
[1]
“IEEE Standard for SystemVerilog – Unified Hardware Design, Specification,
and Verification Language,” IEEE Std 1800-2005, 2005.
[2]
“IEEE Standard for SystemVerilog – Unified Hardware Design, Specification,
and Verification Language,” IEEE Std 1800-2009, 2009.
[3]
“IEEE Standard Verilog Hardware Description Language,” IEEE Std 13642001, 2001.
[4]
D. Rich, J. Bromley. “Abstract BFMs Outshine Virtual Interfaces for
Advanced SystemVerilog Testbenches”. DVCon 2008.
[5]
“XMR in Testbench-to-DUT or Top-Module Tasks.” $VCS_HOME/doc/
UserGuide/pdf/VCSLCAFeatures.pdf, p179. Version C-2009.06. June 2009.
[6]
Xilinx library code. $XILINX/vhdl/src/simprims/simprim_Vcomponents.vhd
and $XILINX/vlog/src/glbl.v. Release v11.1i. Apr. 2009.
It is interesting to note that VHDL, a non object-oriented language, is
capable of this by strictly separating the package implementation from
its declaration. Modules from ordinary Verilog can be said to have the
same capability.
F. MIXED USE OF VHDL AND SV PACKAGES. Mixed
language simulation is sometimes a necessary evil. The combination
that we see most often is an SV testbench verifying a VHDL design.
Often, a rich set of records, types and functions on the VHDL side
is defined in packages. Unfortunately, neither SV nor VHDL LRMs
specify how these definitions can be mapped across the language
boundary, even though most package items have exact parallels in SV.
Tool specific implementations, often as simple as adding an additional
compile-line switch, are available.
V. CONCLUSION
We have given an overview of the SystemVerilog package construct,
from its motivation to the characteristics that make it an important
feature of the language.
Practical issues that arose when using packages in real projects
were described. Suggestions to avoid or overcome these issues were
made. We further discussed how packages and classes could be
used together to implement interesting constructs.
17
Time to Adopt Formal Property Checking
by Harry Foster, Chief Scientist, Verification, Mentor Graphics
There are three reasons the time is right for formal property
checking, even for design teams whose project schedules are
measured in months instead of years. First, the technology has
matured. Second, standards now exist to express interesting functional
properties. And third, formal property checking is well-suited to today’s
problem domain.
Technology has matured: About twenty years ago, the state of
the technology was such that formal property checking could reliably
handle about two hundred state elements. Today, formal property
checking can handle tens of thousands of state elements. You might
ask, don’t today’s designs have many more than tens of thousands of
state elements? Well yes, but that’s not the point when you consider
that a formal tool only needs to consider the design state elements
that are covered by a specific functional property. In fact, because
formal technology has matured, it is now possibly to specify practical
functional properties about today’s design that can be reliably proved.
Another longtime limitation of formal property checking was that the
technology required lots of manual interactions, generally performed
by a formal expert, to simplify and complete a proof. In contrast,
today’s tools are architected with multiple specialized proof engines,
whose execution is orchestrated in such a way to automatically
partition and apply abstractions to a complex design, all under-thehood. Thus, the mainstream user can apply the technology.
Finally, formal technology that automatically extract functional
properties and then formally verify them, has begun to show up underthe-hood of many different functional verification tools, such as clockdomain checking, reset verification, and other automatic-applications.
Thus, the user no longer has to be a formal expert in either writing
functional properties or running formal tools to get value out of
applying formal technology.
Standards exist: The arrival of standards has been another huge
benefit, one that’s accrued both to tool users and developers. Seven
years ago, industry assertion language standards didn’t exist—a
situation that created confusion. Fears of lock-in loomed as each tool
vendor had its own proprietary language.
Today we have the IEEE 1850 Property Specification Language
standard and the IEEE 1800 SystemVerilog standard. Together, these
standards are creating an ecosystem of tools and solutions around
functional properties. For example, a number of EDA vendors are
now delivering assertion-based IP based on these new standards. In
18
addition, several new startups are exploring new solutions based on
these standards, such as advanced debugging techniques. Finally,
we are now seeing an emerging pool of skilled consultants providing
application services and training on how to use these standards.
The bottom line is that users now feel confident that they can adopt
a standard that will be supported by multiple verification tools and
vendors.
Good fit for today’s problems: Formal property checking is
increasingly well suited for today’s problem domain, especially project
teams doing SOC designs, which is a majority of the market. In fact,
the Collett International Research “IC/ASIC Functional Verification
Study” published in 2004 found that about one-third of all designs
at that point in time had an embedded processor, and thus an SOC.
Today that percentage has doubled. In addition, when you look at
today’s SOC designs, your find that the makeup (on average) consists
of about 33 percent internally developed IP and 13 percent purchased
IP. These IP blocks are generally connected using standard bus
protocols, such as AXI and AHB. This natural partitioning of the design
into IP with well-defined interfaces connected to busses lends itself
to a formal property checking methodology. For example, assertionbased IP can either be purchased or developed for the bus interfaces,
and then reused in multiple blocks to prove interface compliance. This
use of formal generally requires minimal skills. Furthermore, the same
set of functional properties can be reused as constraints on many IP
blocks to prove additional internal or end-to-end properties about the
block. Not surprisingly, companies that are doing SOC design and that
have adopted this methodology have identified productivity benefits
achieved by reducing the debugging time due to bugs found sooner
in the flow, as well as quality benefits of delivering formally verified
blocks for integration.
Getting started: So the time for formal property checking is now. Yet,
one of the first questions I’m generally asked concerning implementing
a formal methodology is: How do you get started? Here are my
thoughts.
There’s an ancient proverb that states “he who fails to plan, plans
to fail.” Yet in the disciplined, process-oriented world of verification,
failure is more likely to stem from confusion about how to best plan
the integration of formal property checking into an existing simulationbased flow than from a failure to plan in the first place.
Some projects set the bar too low when first evaluating formal
property checking. Engineers might throw a design with a set of ad
hoc assertions at a formal property checking tool, just to see what
value the process has to offer. The problem with this approach is that
all assertions are not created equal. Many lower-level assertions,
while they are ideal for reducing simulation debugging time, provide
little or no value as formal proofs when considered in the context of a
project’s overall verification objectives. In such cases, it’s natural – and
inaccurate – to declare that formal proofs deliver too little return on the
project team’s investment.
Projects teams’ first attempts at formal property checking can just
as easily fail due to overreach, particularly when the team’s ambition
far surpasses its skill set. An inexperienced project team that selects
a complex design block beyond the push-button capability of today’s
formal verification technology will likely be stuck until they acquire
sufficient advanced skills required to manually assist in completing
the proof. (This problem is not unique to formal property checking.
Consider the likely outcome when a team that lacks object-oriented
programming skills first attempts to construct a contemporary
constrained-random, coverage-driven testbench.)
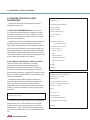
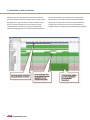
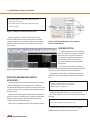
Figure 1: Sequential paths
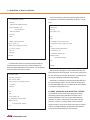
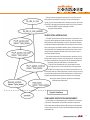
Concurrent design blocks (Figure 2) deal with multiple streams of
input data that collide with each other. An example is a multi-channel
bus bridge block, which essentially transports packets unchanged from
multiple input sources to multiple output sources.
Of course many design blocks do lend themselves to formal
property checking and require minimum or no advanced skills. In
the following section, we outline a testplanning process that helps to
identify such blocks and nurture the organization’s current skill set.
Turing Award winner Fred Brooks once quipped that “even the
best planning is not so omniscient as to get it right the first time.”
Notwithstanding Brooks’ wisdom, there are a few preliminary steps
which if followed help to build a good test plan. First among these
is identifying the design blocks that are most suitable for formal
verification in the first place.
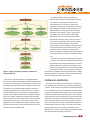
Step 1: Identify suitable design blocks for formal. The key criterion
for choosing design blocks suitable for formal: whether the block is
mostly sequential (that is, non-concurrent) or mostly concurrent.
Sequential design blocks (Figure 1) typically operate on a single
stream of input data, even though there may be multiple packets at
various stages of the design pipeline at any instant. An example of
this sequential behavior is an instruction decode unit that decodes a
processor instruction over many stages. Another example is an MPEG
encoder block that encodes a stream of video data. Formal verification
usually faces state explosion for sequential designs because generally
the most interesting properties involve a majority of the flops within the
design block.
Figure 2: Concurrent paths
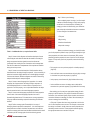
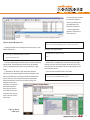
As a rule of thumb, when applying formal, choose blocks that are
control-oriented or perform data transport with high concurrency.
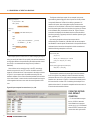
Now, which candidate blocks are easy and require no (or minimal
formal skills), and which candidate blocks are difficult and require more
advanced skills and additional manual work to complete the proof? In
Table 1 we attempt to answer these questions, listing a broad class
of design blocks. Our commonsensical advice: if your organization
has no prior formal experience, then start with a candidate block that
requires minimal skills and gradually work to grow the organization’s
skill set over time.
19
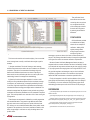
Step 7: Select a proof strategy.
After completing steps 1 through 6, our final step is
to define an effective strategy to verify each property
we defined in our formal testplan. Generally, the
strategy you select is influenced by your verification
goals and project schedule and resource constraints.
The four strategies I recommend are:
1.Full proof
2.Bug-hunting
3.Interface formalization
4.Improved coverage
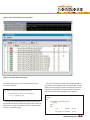
Table 1: Candidate blocks vs, required formal skills
Step 2: Create a block diagram and interface description. Create
a block diagram and table that describe the details for the design’s
design component interface signals that must be referenced
(monitored) when creating the set of assertions and coverage items.
Use this list to determine completeness of the requirement checklist
during the review process.
Step 3: Create an overview description. Briefly describe the key
characteristics of the design’s design component. It is not necessary to
make the introduction highly detailed, but it should highlight the major
functions and features. Waveform diagrams are useful for describing
temporal relationships for temporal signals.
Step 4: Create a natural language list of properties. In a natural
language, list all properties for the design’s design component. A
recommended approach is to create a table to capture the list of
properties. For each property, use a unique label identifier that helps
map the assertions back to the natural language properties.
Step 5: Convert natural language properties into formal properties.
Convert each of the natural language properties into a set of
SystemVerilog Assertions or PSL assertions or coverage properties,
using any additional modeling required for describing the intended
behavior.
Step 6: Define coverage goals. Essentially this is a step of
identifying formal constraints or assumptions. It is critical that these
assumptions are verified in simulation as assertions, and sufficient
interface coverage goals have been identified and added to the overall
verification plan as coverage goals for the blocks being proved.
20
Before you select a strategy, you should first order
your list of properties (created in step 4) to help you identify the highvalue properties with a clear return-on-investment (ROI) and the
potential high-effort properties in terms of proof or lack of designer
support. To help order your list of properties, answer the following
questions:
• Did a respin occur on a previous project for a similar property?
(high ROI)
• Is the verification team concerned about achieving high coverage
in simulation for a particular property? (high ROI)
• Is the property control-intensive? (high likelihood of success)
• Is there sufficient access to the design team to help define
constraints for a particular property? (high likelihood of success)
After ordering your list, assign an appropriate strategy for each
property in the list based on your project’s schedule and resource
constraints. Your verification goals, project schedule, and resource
constraints influence the strategy you select. We recommend you
choose a strategy from the following:
a. Full proof. Projects often have many properties in the list that
are of critical importance and concern. For example, to ensure that
the design is not dead in the lab, there are certain properties that
absolutely must be error-free. These properties warrant applying
the appropriate resources to achieve a full proof.
b.
Bug-hunting. Using formal verification is not limited to full
proofs. In fact, you can effectively use formal verification as a bughunting technique, often uncovering complex corner cases missed by
simulation. The two main bug-hunting techniques are bounded model
checking, where we prove that a set of assertions is safe out to some
bounded sequential depth, and dynamic formal, which combines
simulation and formal verification to reach deep complex states.
c.
Interface formalization. The goal here is to harden your
design’s interface implementation using formal verification prior to
integrating blocks into the system simulation environment. In other
words, your focus is purely on the design’s interface (versus a focus
on internal assertions or block-level, end-to-end properties). The
benefit of interface formalization is that you can reuse your interface
assertions and assumptions during system-level simulation to
dramatically reduce integration debugging time.
d.
Improved coverage. Creating a high-fidelity coverage model
can be a challenge in a traditional simulation environment. If a corner
case or complex behavior is missing from the coverage model, then
it is likely that behaviors of the design will go untested. However,
dynamic formal is an excellent way to leverage an existing coverage
model to explore complex behaviors around interesting coverage
points. The overall benefits are improved coverage and the ability to
find bugs that are more complex.
Summary
In this article I outline a simple set of steps for getting started with
formal. So, why adopt formal now? The technology behind formal
property checking has matured to the point where it can now handle
many functional properties on today’s designs without the need for a
formal expert. With the recent standardization of assertion languages,
an entire assertion-based technology ecosystem is emerging. With the
rapid adoption of IP and bus-based SOC design practices, there are
many ideal candidate blocks that lend themselves to formal. Finally,
SOC designs provide an opportunity for functional property reuse for
compliance checking of standard interfaces.
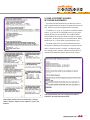
Formal Property Checking Success Stories
“By using an implementation inside a model checking tool (0in)
from Mentor Graphics, we successfully prove properties on all
possible initial states and avoid false negatives..”
— Xiushan Feng, et al., AMD,
published at MTV 2009
“Clearly, FPC improved quality with an engineering effort
similar to that for simulation at the block level.”
— Richard Boulton, et al., Icera,
published at DVCon 2009
”A quality set of assertions provides a means for effective
measurement of functional coverage in simulation and
enhancement of coverage using formal methods to counter
the declining success rate of silicon design teams.”
— Jim O’Connor, et al., iVivaty,
published at DVCon 2007
“The bug was eventually isolated and reproduced through
a process of formal verification based on model checking. In
particular, we used an approach based on targeting sets of
conditions called waypoints, which are hypothesized by the
user to necessarily occur en route to the bug in question.”
— C. Richard Ho, et al., DEShaw,
published at DAC 2008
21
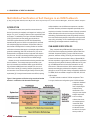
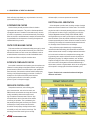
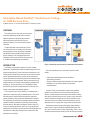
Multi-Method Verification of SoC Designs in an OVM Testbench
by Ping Yeung, Mike Andrews, Marc Bryan and Jason Polychronopoulos, Product Solution Managers, Verification, Mentor Graphics
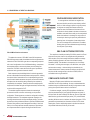
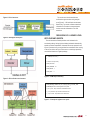
Introduction
The demand for smarter, more powerful consumer electronics
devices is increasing the complexity and integration of underlying SoC
designs. This, in turn, is making it harder to build a comprehensive test
environment. The availability of the Open Verification Methodology
(OVM) [1] has helped to at least partially ease the burden on
verification engineers. Based on the IEEE 1800 SystemVerilog
standard and fully open, the OVM is non-vendor-specific and works
with multiple languages and simulators. OVM provides a library of
base classes as building blocks for creating modular and reusable
verification environments that support a constrained random stimulus
generation methodology. With OVM, verification IPs (VIP) can be
developed with a well defined structure to help make them simple to
use and re-use. Such VIPs are already available to target common
interfaces, such as AHB, AXI3 and AXI4 in the AMBA family [2].
However, the use of constrained random stimulus generation does
have its limitations. The coverage state space continues to grow
due to the inexorable move towards a flexible, power efficient and
high performance AMBA interconnect; multiple CPU cores, such
as the Cortex-A series [3]; increasing numbers of peripherals; and
the introduction of new and more stringent Quality-of-Service (QoS)
requirements [4]. Coverage closure becomes more difficult, requiring
Figure 1: Heterogeneous verification using constrained random
stimulus in combination with advanced methodologies
22
multiple simulation runs with different test sequences, constraints
and seeds. Simulation performance degrades exponentially as the
complexity and number of constraints increase. Although constrained
random techniques will continue to be a key part of the verification
methodology, sophisticated design teams are gradually introducing
even more advanced technologies to help achieve coverage closure
more quickly and reliably. Two such methodologies are static formal
verification [5] and intelligent testbench automation [6].
OVM-based verification IPs
Today, companies doing ARM-based SoC designs depend on
VIP for block-level and system-level validation. Mentor’s Multi-View
Verification Components (MVCs) [7] support OVM with stimulus
generation, reference checking, monitoring, and functional coverage.
In March 2010 Mentor announced that its library of Questa® MVCs
has been expanded to support phase one of the AMBA 4 specification,
recently announced by ARM. Introduced by ARM more than 15 years
ago, the AMBA specification is the de-facto standard for on-chip
interconnects. Unlike other solutions, MVCs combine transactionbased protocol debugging and abstraction adaptation, enabling
designers to connect to any level of design and testbench abstraction.
For AMBA, MVCs are available to support the APB, AHB, AXI3 and
AXI4 interfaces.
Each MVC includes a number of OVM test components. There
is an agent, interface and configuration typical of OVM verification
components. Additional
components range
from a simple analysis
component to log
transactions to a file
through to more complex
analysis components,
such as coverage
collectors that ensure
the complete protocol
is exercised. MVCs
are also supplied with
scoreboards that can
be used as is for simple
memory models, or
extended to incorporate more complex DUT functionality. With MVCs,
users can build a consistent and reusable verification environment
to verify that the design adheres to internal and external protocols
throughout the verification process.
Formal Verification [8] is one such tool using formal property checking
to improve design quality and to complement dynamic verification.
Figure 3: Block-level constrained random
and formal property checking
Figure 2: Verification IP: AXI Multi-view Verification Components
Each MVC has an agent that can be configured to be in active or
passive mode. For generating stimulus the agent operates in active
mode. It instantiates the sequencer, driver, monitor, and analysis
components such as a transaction logger or coverage collector.
For system-level simulation, transactions might be driven between
two user devices, such as the processor or a DMA controller and the
interconnect. In this scenario, the agent can operate in passive mode,
allowing the coverage and scoreboard from block level tests
to be re-used.
Block-level verification
One way to verify a block such as a memory controller is to build
a simulation environment with the MVCs and OVM components to
perform a mixture of directed and constrained random tests. This type
of environment is suitable for verifying many types of functionality.
However, once the state space reaches a level of complexity that
is moderate by today’s standards, it can become very inefficient at
uncovering all corner case behaviors. Diligence in investigating such
corner cases and ensuring robust functionality is key, especially if the
block being verified is a good candidate for reuse in multiple designs.
The need to discover and diagnose design flaws and to accelerate
coverage closure often leads to the usage of static verification. Static
verification is a collection of verification technologies including RTL
lint, static checks, formal checks, and formal property checking.
Stimulus is not required to exercise the design. Mentor Graphic’s 0-In
Formal property checking analyzes the functionality of a block
in the context of its environment (such as operational modes and
configurations). Initialization sequences can be incorporated as well.
It represents how the design will operate clock cycle by cycle and
hence can determine whether various scenarios are even possible. We
recommend performing checks relating to the following areas at the
block level:
Coverage closure checks
Most blocks have dead code, unreachable statements and
redundant logic. This is especially true for IP or reused blocks, which
often have unneeded functionality that is a vestige of earlier designs. If
passive coverage metrics (line coverage, FSM coverage, or expression
coverage) are part of the closure criteria, then this unused functionality
will have a negative impact on the coverage grade. Coverage closure
checks can be used to identify these unreachable statements and
redundant logic so they can be excluded from the coverage grade
calculation.
Clock domain crossing (CDC) checks
CDC signals continue to be a trouble spot for functional verification,
especially as these problems often do not cause simulations to fail;
instead they commonly manifest themselves as intermittent postsilicon failures. To ensure CDC signals will be sampled correctly by
the receiving clock domain, they need to be synchronized before use.
23
Static verification helps identify any unsynchronized or incorrectly
synchronized CDC signal early.
X-propagation checks
Another class of potential post-silicon failures is related to
x-generation and consumption. The goal is to eliminate pessimistic
x-propagation as seen in simulation and to make sure any unknown
or x-state is not generated or consumed unintentionally in the design.
When an unknown or uninitialized state is sampled, the resultant value
is unpredictable, thus the importance of ensuring that registers are
initialized before they are used.
Finite state machine checks
Finite state machines are fundamental building structures for control
logic. Simulation can verify the basic functionality of an FSM. Finite
state machine checks can catch corner case misbehaviors such as
unreachable states and transitions, and also live/deadlock states—
all of which are difficult to verify with simulation alone.
Interface compliance checks
Inter-module communication and interface protocol compliance are
infamous for causing design and verification failures. Leveraging the
protocol assertion monitors in the MVCs helps to catch problems in
these areas early. Such assertion monitors enable formal property
checking to be performed seamlessly on the block. Consider, for
example, the use of AXI and the DDR2 protocol monitors
to perform static verification on the memory controller
(shown in Figure 3 on the previous page).
Resource control logic
Computational resources, such as floating point
units; interconnections, such as the bus matrix; and
DMA channels and memories are among the structures
usually controlled by arbiters and complex control
logic. Simulation environments tend to focus on highlevel specifications, which all too often fail to consider
concurrency of operations. This is problematic given
that parallel processing and concurrency are common
characteristics of today’s devices and thus need to
be verified. Formal property checking has been used
successfully to verify such resource control logic. This
technology ensures that control logic can correctly
24
arbitrate multiple, concurrent requests and transactions.
Partition-level verification
At the subsystem or partition-level, the design consists of multiple
masters and slaves connected via an AXI bus matrix. The AXI MVC
may also be used in active mode generating stimulus to replace any
AXI component. As shown in figure 4, other MVCs, such as HighDefinition Multimedia Interface (HDMI), DDR2 SDRAM, USB2.0
and Gigabit Ethernet, are used to provide inputs at, and validate, the
external interfaces. Since the possible combinations of legal activity
increase exponentially as the number of devices increase the chance
of achieving full coverage with constrained random stimulus alone is
low. Coverage closure at this level is a real challenge.
Many verification projects therefore rely on supplementing a
constrained random methodology with directed tests to handle the
random-resistant cases. Instead, an intelligent testbench automation
tool can be used to achieve more comprehensive coverage goals
by generating more complex verification scenarios for partitions or
subsystems of a design. An intelligent testbench, such as Mentor
Graphics inFact[9] tool, offers a more systematic approach allowing
such corner cases to be targeted and covered deterministically. It
allows users to maintain a single testbench which can be configured to
achieve specific coverage goals in the fewest simulation cycles.
Figure 4: Partition-level constrained random and intelligent
testbench verification
An intelligent testbench allows the specification of
application-specific stimulus to control individual interfaces,
or, to control the synchronization of activity on two or
more interfaces at once. This allows for a much more
comprehensive verification of the interrelation of the various
types of subsystem interfaces. A higher level graph can be
created that defines and helps to prioritize the interesting
combinations. For the design in Figure 4, a graph would
be created for each interface type (AXI, DDR2, HDMI,
USB, Ethernet), and a further high-level graph would be
responsible for coordinating activity across two or more of
the interfaces to produce higher level verification scenarios
to meet verification goals. Depending on the selected
coverage strategy, the same testbench could target coverage
of the high-level scenarios, the individual protocols, or the
combination of both. Once specific coverage goals are
achieved, the testbench automatically reverts to generation of
random transactions for as long as the simulation is allowed
to run.
Figure 5: A graph representing transaction parameters for
intelligent testbench
When used in conjunction with MVCs, an intelligent testbench
allows the user to define the interesting and relevant transaction types
in a simple and compact graph or rule-based format. Figure 5 shows a
partial graph presenting the transaction parameters of an AXI master.
The algorithms in the intelligent testbench will pick a combination
of transaction parameters to form a path for execution. To achieve
a certain verification goal, the user can add a coverage strategy to
the graph which controls the variables that are targeted for coverage
and/or cross coverage. A particular goal might require that multiple
masters connected via an AXI bus matrix should collectively produce
all interesting transaction types. This is simple to achieve, as the
algorithms in the tool can distribute the transaction types to multiple
AXI MVCs acting as masters. During simulation runtime, they will all
contribute to the same verification goal.
An example of a high level scenario that might be captured
in a graph is a stress test where combinations of transactions
are generated on each interface simultaneously to cause the
highest possible resource utilization in the system. Another
example, from a design team at one of our customers working
on a multiple-CPU design, is using the graph to ensure that
all combinations of simultaneous memory accesses from two different
CPUs are attempted. This was done to uncover issues when multiple
CPUs are accessing the cache at the same time.
System-level verification
Thorough block- and partition-level verification is a necessary but
often insufficient part of the effort to full vet and debug a design prior
to tapeout. This is because at the system-level, software/firmware that
runs on an ARM processor must be verified with the hardware before
the system on chip (SoC) product is ready to ship to the manufacturer
that will build the smart phone, table, MP3 player or other SoC-based
device. Much of the critical functionality of the SoC occurs at the HW/
SW interface. For example, the “bare metal” initialization code, power
control and state change management, interrupt control, and device
drivers, just to name a few, only work when embedded software and
hardware interact correctly. Of course, it is necessary to fix as many
bugs as possible in this area in simulation, well before the chip is
fabricated. Let’s look at a few ways to create a comprehensive systemlevel verification environment using an ARM CPU.
25
System-level
debug challenge
Figure 6: System-level hardware and software co-simulation
and debug
Early hardware/software integration
System-level verification can begin when the ARM processor,
some embedded software, and the hardware blocks that interact
with this embedded software, are available and connected. Once the
connections and register maps are made, the embedded software can
be loaded into the program memory and the design can be simulated.
The initial software program has to configure the virtual memory
and various devices in the system. Until this initialization is working
properly, efforts to verify the SoC feature set are impaired.
Real hardware stimulus
As shown in Figure 6, because the ARM processor is a bus master,
the instruction sequences executing on the embedded ARM CPU
act as stimulus to the design. Memory transactions, such as memory
reads caused by instruction fetches originated by the ARM CPU, will
start to happen when the ARM CPU comes out of reset, provided the
reset logic is working properly. Instruction fetches and memory read/
write instructions executing in the ARM CPU cause activity in the bus
matrix and connected bus slaves. The same embedded code running
on the ARM CPU can be used in simulation, emulation, hardware
prototypes, and the finished SoC.
26
Among the greatest challenges
of verifying the hardware using
the embedded software is figuring
out what happened when things
go wrong and verifying, when
things work, that they worked
as expected. Without proper
visibility into the execution of the
processor and other hardware,
diagnosing a problem can be
very difficult. The verification
engineer must concentrate on
very small details of the processor
execution behavior, such as
which processor register contains the result of a particular memory
read instruction. The verification engineer must also track all of
these details just to figure out what was happening in the processor
at the moment of the problem or even many instructions before the
problem. Logic waveforms are not an effective means to show the
state of the processor. The detailed processor execution behavior has
been automated by Mentor Graphics Questa Codelink[10] tool so the
verification engineer can see the behavior of the processor instructions
together with the logic waveforms.
Lots of software
Later in project design cycles when the SoC is complete from the
hardware logic perspective, there often is much additional relatively
untested software ready to run on the SoC. A hardware abstraction
layer can help in this task by isolating the large volume of software
from the hardware. For example, the project specification may
indicate that the SoC requires a Unified Extensible Firmware Interface
(UEFI) in order to be compatible with a standard UEFI-compliant
operating system. A robust hardware abstraction layer can make it
easier on those engineers working on system middleware and other
applications closely tied to the software-hardware interface. Verifying
the hardware-dependent software requires sufficient speed for
software execution, a high degree of visibility and control, and a short
turnaround time for fixing defects. Codelink offers a variety of means
to accelerate software execution, including executing printf and preverified memory read/write operations in zero simulation time. These
Codelink capabilities provide the tools needed to quickly verify the
hardware abstraction layer.
Summary
Starting with OVM, in this article we have attempted to describe
a few advanced verification technologies that expand the current
methodology of using directed and constrained-random stimulus
generation in simulation. We discussed use of OVM and available
verification IPs (from Mentor’s Questa MVCs [7]) to build up a
complete and reusable verification environment for simulation. We
then introduced additional advanced technologies including static
verification for the block-level (Mentor’s 0-in Formal Verification tool
[8]), intelligent testbench automation for the sub-system or partition
level (Mentor’s inFact tool [9]) and finally hardware/software debugging
for the system level (Mentor’s Codelink tool [10]). Each of these tools
enables project teams to improve the time to verification closure, and
as a result, deliver robust designs to meet market windows.
References
[1] Open Verification Methodology, www.ovmworld.org
[2] AMBA Open Specifications, www.arm.com/products/system-ip/amba/amba-openspecifications.php
[3] Cortex-A Series, www.arm.com/products/processors/cortex-a
[4] Traffic Management for Optimizing Media-Intensive SoCs, www.iqmagazineonline.
com/archive28/pdf/Pg32-37.pdf
[5] Static verification ¬- what’s old is new again,
www.scdsource.com/article.php?id=382
[6] Intelligent testbench automation boosts verification productivity, www.scdsource.
com/article.php?id=129
[7] Questa MVC, www.mentor.com/products/fv/questa-mvc
[8] 0-In Formal Verification, www.mentor.com/products/fv/0-in_fv
[9] inFact, www.mentor.com/products/fv/infact
[10] Questa Codelink, www.mentor.com/products/fv/codelink
27
Reusable Sequences Boost Verification Productivity
and Reduce Time to Market for PCIe
by Rajender Kumar Jindal and Sharat Kumar, Lead Members Technical Staff, Mentor Graphics
1) Introducing OVM Sequences
Today’s design process is increasingly dynamic due to smaller
manufacturing process technologies and the corresponding higher
gate counts. The tough economic climate also exacerbates matters for
verification engineers, who are driven to meet increasingly ambitious
time-to-market demands. One major source of help is efficient and
reusable stimulus, especially for use in random or constrained random
verification. OVM sequences enables a user to develop such stimuli
across a range of design activities. Based on OVM sequences,
the sequences in PCIe Multi-View Verification Component (MVC)
help verify the PCIe design in a simple yet elegant manner. (Mentor
Graphics Questa MVCs allow a verification team to connect to any
level of abstraction, from system to gates. For more details about
PCIe MVC please refer to the whitepaper “Tool improves PCI-E DUT
verification” at http://www.mentor.com/resources/techpubs/upload/
mentorpaper_55635.pdf.)
OVM sequences are used to build reusable stimulus generators.
Sequences are objects extended from ovm_objects that produce
streams of sequence items for stimulating a driver.The sequences are
channeled in/out and to/from the driver via an OVM component called
the sequencer.
Sequence flow through Sequencer and driver in OVM
environment
28
2) Flexible MVC sequence usage
with the DUT
A transaction with extra bookkeeping members, the MVC sequence
item is a parameterized class providing access to the transaction
parameters. The MVC sequence items help the user to generate
scenarios called MVC sequences.
An OVM component named MVC_AGENT arbitrates among
multiple sequences and then passes the selected sequence to the
driver through the sequencer. The MVC_AGENT also provides lots
of configurable parameters for sequence selection, arbitration and so
on. The 2009 “Open Verification Methodology Cookbook” provides
additional details on use of MVC_AGENT.
The MVC’s power lies in its sequence items and sequences. These
have all the features of OVM sequences while also making use of
design interface tasks to send and receive the transaction on the
physical interface.
The backbone of the MVC sequence items are two tasks – do_
activate and do_receive – that initiate the transaction on the driver.
These tasks are customized to run on the MVC interface but can be
modified as shown in the sample code.
Memory read sequence using sequence item pcie_device_end_
request.
The PCIE MVC package provides many sequence items to handle
all abstraction levels, such as from the transaction to the physical layer.
These sequence items provide controllability and observability for
all layers on all abstraction levels. Here are the sequence items of all
layers and the corresponding usage on layers:
pcie_device_end_request: this sequence item is for TL interface
request TLP, providing control of all request TLP-related fields like tc,
type.
pcie_device_end_completion: this sequence item is for TL
interface completion TLP, providing control of all completion-related
fields like cmpl_stts.
pcie_device_end_tlp_to_dll: this sequence item is for TL interface
TLP, providing control of all the TLP field as bit fields.
pcie_device_end_tl_to_dll: this sequence item is for DL interface
TLP, providing control of dll fields like sequence number and LCRC.
pcie_device_end_dllp_top: this sequence item for DL interface
DLLP, providing control of all the DLLP fields.
pcie_device_end_os_plp: this sequence item is for PL interface
OS, providing control of relevant fields of OS packets.
Code snippet showing how existing sequence item can be
modified for user dut interface.
pcie_device_end_tlp_dllp_to_mac: this sequence item is for PL
interface TLP/DLLP, providing control of all the TLP/DLLP fields as bit
fields.
So all the sequences bundled with MVC can also be used with user
design interface and hence reduces time to market. Also if any change
occurs in the DUT interface or the design itself there is no need to
modify entire sequence scenarios. The only changes required are in
the do_activate and do_recieve task of the sequence item or in the
sequence item parameters. Thus a scenario can be developed once
and used with multiple designs.
pcie_device_end_symbol: this sequence item is for PL interface
symbol packet, providing control of data, special/normal PL fields
Sequence items available at each layer of the PCIe MVC
.
3) MVC sequences and
their basic building blocks:
4) Sequence items usage
and scenarios available in PCIe MVC
The aforementioned sequence items have created lots of sequence
scenarios. Below listed are the ones available in PCIe MVC package.
pcie_tlp_msg_sequence: this sequence is for initiating the
message request; the user needs to provide the message code and
the corresponding routing fields; the rest of the request parameter is
taken care by the MVC.
pcie_tlp_interrupt_sequence: this sequence, depending on the
interrupt mechanism (which in turn depends on the configuration
space setting), initiates an msi or interrupt msg from the corresponding
device.
29
pcie_tlp_enumeration_sequence: this sequence is the most
commonly used sequence in PCIe verification and can only be initiated
from the root complex (RC); this sequence parses the whole PCIe
fabric to look for available devices on various bus numbers and then
configure them per the user input configuration.
The PCIe MVC package also includes commonly used scenarios for
verifying PCIe components, including:
pcie_random_requester_sequence: this sequence initiates the
scenarios – such as mwr followed by mrd, Iowr followed by IORD,
and so on – in random fashion; the sequence includes a provision to
control the randomness between various transfer categories, such as
Memory, Input-Output, and Configuration.
pcie_random_completer_sequence: when included in the
environment the sequence responds to the received request as per
the protocol specification (i.e., successful completion, unsupported
request, and so on).
pcie_plp_os_all_all_lanes_sequence: this sequence allows user
to send any type of ordered set packets on all available lanes of the
PCIe component.
Error scenarios for DUT recovery are also provided in the package
at all transaction layers. A user can develop customized error
scenarios if those provided do not meet his requirement.
pcie_coverage_tl_malform_requester_sequence: this sequence
is used to insert all types of transaction layer packet malformation
errors in directed and random order.
pcie_coverage_tl_malform_completer_sequence: this sequence
is used to insert all types of malformed responses for the valid
incoming requests in directed and random order.
pcie_coverage_dll_master_sequence: this sequence initiates the
subsequences with data link layer related error injection capabilities.
pcie_error_symbol_sequence: this sequence allows the user to
inject the symbol-level error at the physical-layer interface.
30
PCI-SIG, the governing body of PCIe, has provided the checklist
(see www.pcisig.com/specifications/pciexpress/technical_library/)
to which every PCIe component should be compliant before it is
introduced in the market. MVC has sequences for each layer i.e.
transaction layer, data link layer and physical layer thus these
sequences can be used for checklist-compliant functional testing.
Below is the list of sequences:
pcie_coverage_random_requester_sequence: this sequence
issues the random tlp transfers on the bus in random order.
pcie_coverage_random_completer_sequence: this sequence
responds to the incoming legal transaction layer requests.
pcie_coverage_tl_malform_requester_sequence: this sequence
inserts all types of tlp packet malformation errors in directed and
random order.
pcie_coverage_tl_malform_completer_sequence: this sequence
inserts all types of malformed responses for valid incoming requests in
directed and random order.
pcie_coverage_dll_master_sequence: this sequence injects
data link layer packet malformation errors and created illegal scenario
related to data link layer protocol.
pcie_coverage_rc_pl_sequence: this sequence inserts all type of
framing and 8b/10b errors along with illegal scenario (physical layer)
creation.
pcie_coverage_ep_pl_sequence: this sequence generates
directed scenarios (legal) related to the physical layer from endpoint;
(i.e., pcie_ep_pl_gen1_to_gen2_transition_sequence).
pcie_coverage_pmg_sequence: this sequence generates
directed scenarios (legal) related to power management; (i.e., pcie_
pmg_configure_l1_sequence).
The coverage sequences are configurable, providing control in
selecting the subsequences. In coverage sequences at various layers
there are subsequences for valid/invalid scenarios that can be chosen
in the top-level environment. By default the subsequences run in
random order but their execution can be controlled.
5) Using a different sequence
in the same environment
All previously described sequences are provided as open source
code and can be tweaked as necessary. The sequences are driven via
MVC_AGENT in the top-level configuration of the environment.
For example, m_rc_cfg, m_ep_cfg are the two configuration classes
where m_rc_cfg is for the root complex(RC) and m_ep_cfg is for the
endpoint (EP) device in the environment. Thus one MVC_AGENT
will be created for RC and the other will be for the EP. In the top-level
configuration, the testing sequence can be controlled via set_default_
sequence task: m_rc_cfg.set_default_sequence(sequence_type).
The sequence type can be any of those mentioned previously in
this document. Depending on the requirement, any sequence can be
used in a single environment. For example, if the sequence type is
pcie_coverage_random_requester_sequence then the random TLP
requests will be initiated for transaction-layer functional coverage.
Code snippet showing how user can plug/control different
sequence in the same testing environment.
Code snippet showing various use model of pcie_coverage_
random_requester_sequence in user sequence i.e. pcie_user_
sequence
31
Although the package contains many sequences, it is difficult to
meet everyone’s requirements. Given the flexibility, though, a user can
employ sequences or sequence items to develop the desired scenario
for testing DUT functionality.
Once the sequence is developed it is easy to plug in the OVM
environment using the MVC_AGENT in the top-level configuration
of the existing environment as follows: m_cfg.set_default_sequence
(user_sequence); where m_cfg is the configuration of available
component in the verification environment.
6) Multiple sequences arbitration
in the same environment
Where there are multiple sequences, the MVC_AGENT arbitrates
among the sequences. Below are the arbitration options available in
MVC_AGENT:
Example of arbitration order of multiple sequences available
in MVC agent.
32
SEQ_ARB_FIFO FIFO: FIFO ordering; this is the default arbitration
mode
SEQ_ARB_WEIGHTED: randomly chooses the next sequence;
uses weights specified by wait_for_grant() calls to bias the selection
SEQ_ARB_RANDOM: randomly chooses the next sequence
SEQ_ARB_STRICT_FIFO: all high priority requests are granted
in FIFO order
SEQ_ARB_STRICT_RANDOM: all high priority requests are
granted randomly
SEQ_ARB_USER: user supplies his own arbitration algorithm
7) Conclusion
In OVM2.0 sequence items and usage help the user develop
scenarios and migrate test bench components when changes occur
during the design process. This flexibility is further enhanced by
using MVCs. The MVC sequences can be extended to accommodate
changes at a higher abstraction level. The user need not be bothered
with low level protocol changes. The MVC is highly configurable, in
terms of which sequence should be used. This allows the user to drive
the stimulus and observe attributes that correspond to any abstraction
level. This helps in reducing the verification time, which in turn reduce
the time to market.
Advanced/Faster Verification and Debugging
Using Multi Abstraction Level PCIe MVC
by Yogesh Chaudhary, Lead Member Technical Staff, Mentor Graphics
This paper describes how incorporating multi-abstraction-level
BFM in PCIe verification intellectual property (VIP) can yield a host
of benefits, including faster, more flexible verification and easier
debugging. (One specific example that is discussed: how a transaction
GUI that links a top-level parent to its wire-level child is generally far
superior to a more traditional GUI when it comes to locating bugs.)
By providing methodology-based sequences, PCIe VIP speeds
verification by helping to structure primary and secondary test
sequences. Also discussed: how the combination of PCIe VIP based
on coverage-driven methodology and protocol-capturing XML plans
can boost verification completeness.
Overview
Verification IP (VIP) streamlines the path to compliance signoff.
In general, VIP enables reuse and multilevel abstraction. Other
features include layered verification methodology supported by highly
configurable and feature-rich transactors, a protocol assertions
monitor, advanced debug support, comprehensive functional coverage
and compliance checklist test suites. PCI Express (PCIe)-based
design IPs require a complex verification system.
A compliance checklist with standalone Verilog testing can kick
start verification planning, but is not sufficient to complete verification.
What’s needed is a well-planned and executed VIP and methodology
that addresses the following questions: Is the captured protocol
in design IP verified? What compliance items are verified? Have
you covered all required compliance scenarios? Can you provide a
progress report to your manager?
These challenges are not new for verification engineers, however
complex verification projects often force teams to do more planning.
If they don’t, their verification engineer can easily get lost in technical
detail, which slips the project schedule, jeopardizes the quality and
increases the risk of re-spin.
The combined use of PCIe Multi-View Component (MVC), Open
Verification Methodology (OVM), coverage-driven verification metrics
for all compliance items and the Questa GUI transaction view can
provide much needed predictability.
PCI Express Multi-View Component (MVC)
The PCIe MVC is a multi-abstraction-level VIP that provides fast
and flexible verification along with easy debugging of PCIe designs.
PCIe MVC is OVM-based verification IP. It is compliant with PCIe
protocol specification version 1.0a, 1.1, 2.0 and 3.0 draft revision 0.7
provided by the PCI-SIG.
PCIe MVC comes with the interoperable PCIe physical layer. It
provides the SystemVerilog interface for hooking up the design under
test (DUT) at various defined interfaces:
• serial interface
• 8-, 16- or 32-bit PIPE interface
• 8b/10b parallel interface up to the 2.0 version
The PCIe MVC implements the transaction, data link and physical
layers and its configuration space emulates the real RTL behavior. It
supports all device configuration switch ports, native end points and
root complexes and provides highly scalable bandwidth by way of
configurable link width, data path width and clock frequency.
PCIe MVC can be connected to either MAC or PHY designs through
the PIPE interface and supports all types of error injection capabilities
at all abstraction layers. It comes with the prerequisite sequences
mapped to messages at different levels required by any device to get
started with verification. And PCIe MVC is able to correlate the lowlevel pin wiggles to high-level functional occurrences.
Protocol tree of PCIe MVC
The figure below shows the structured approach to understanding
the PCIe protocol. The main focus is on the communication at all
levels of abstraction. All three layers of PCIe have separate levels of
message hierarchy and capture the protocol flow accordingly. The
last message of the first layer calls the first message of the second
layer, which in terms provides the information of the transaction
to be initiated to the lower layers. The different messages from a
given layer are exposed to the user so that they can be used to
initiate a transaction at that level of abstraction. This helps the user
to understand data corresponding to that abstraction level, which
provides the flexibility to hook up the DUT to various interfaces: TL to
DLL, DLL to PL, and so on.
33
More specifically, the figure to the right shows
the transaction layer tree flow of the PCIe protocol
along with the end interface of the layer. Note that
the top level message is transport and the lowest
level of message is tlp, which talks with the data link
layer by calling the message tlp_to_dll. Also it has a
message Update_FC, which calls the dll message
dllp_top.
The figure to the left shows the
data link layer tree flow of the PCIe
protocol along with the end interface
of the layer. The top level message
is dllp_top and the lowest level of
message is dllp, which talks with the
physical layer by calling the message
tlp_dllp_to_mac. Also note the
specific top level messages to initiate
the data link layer packets.
34
This figure shows the physical layer tree flow of the PCIe protocol
along with the end interface of the layer. The top level message is
tlp_dllp_to_mac and the lowest level of message is symbol, which talks
with the PHY by toggling the wires with respect to the type of interface.
Also note the specific top level messages to initiate
the physical layer packets.
Verification approaches
PCIe MVC provides the two kinds of verification environments. One
is the pure random sequence-based environment, which generates the
valid transaction traffic dynamically on the bus. Sequences randomly
provide all the fields and parameters of the transactions such as read/
write, burst lengths, byte enables, address, and so. Sequences ensure
that transactions are transmitted and received properly under various
timing conditions regardless of buffer size, status, type and order in
which each packet is arrived.
The second environment is the directed random approach, which is
mainly used for the error injection. With this approach, the sequences
are tightly constrained so as to generate only the predefined required
transaction either with valid values or erroneous cases.
PCIe MVC also facilitates the error configurations for direct
error injection, which can be used with any of the approaches.
PCIe MVC can be used in any one of these environments or in an
environment made up of both approaches. Consider, though, that using
only the random approach can mean increased time in reproducing a
bug while the directed random approach often hits the bug straight
away, which makes it easier to reproduce and ultimately
eliminate them at faster rate.
OVM based Verification environment
By facilitating use of SystemVerilog VIP, OVM allows for the writing
of structured, interoperable, and reusable verification components.
OVM creates and provides reusable OVM components and templates
to write specific scenarios. These provide standardized packages and
automated code.
35
Coverage driven Verification
In coverage-driven verification an engineer can
keep track of which part of the protocol being verified
in the run. With coverage in place for a given protocol,
an engineer can easily tell what tests need to be
written to cover all the features of the device. Since
verification is directly related to the time and resources
available, most teams focus mainly on the newly added
blocks and interfaces in the design. A major source of
uncertainty is those bugs in previously verified blocks
stemming from the integration of new design blocks.
The use of coverage-driven verification is an antidote,
showing when you have eliminated enough risks/bugs
from all parts of your design.
PCIe OVM Verification environment
The testbench structure of PCIe MVC uses OVM components.
PCIe MVC agents are made that stimulate the link and generate the
transactions. Each PCIe MVC agent has a corresponding sequence
with a set of configurations. Use of OVM methodology, components
and templates helps to structure the primary and secondary test
sequences. PCIe MVC comes with the three types of pre-defined
sequences: basic, general and scenario-based.
Basic sequences are the building blocks for stimulus generation
and are customizable. General sequences are layer-specific, initiating
the various kinds of transactions on to the bus depending upon the
layer. Scenario-based sequences are specific to the device behavior
and depend on the transaction being initiated by the requester or
completed by the completer. These also include coverage-specific
sequences that initiate the legal and illegal transactions, and thus help
to achieve full coverage of the DUT.
The random requester sequences issues the random legal
tlp transaction traffic on the bus continuously per the provided
configuration. These sequences can also be configured for initiating
the illegal transaction. The completer sequences respond to the
incoming transactions with the legal and illegal packets. The lower
physical layer also provides sequences to generate LTSSM-directed
scenarios along with the power management and Gen1, Gen2 and
Gen3 (or vice-versa) data rate transition sequences. Physical layer
error sequences allow for injection of all types of 8b/10b errors.
36
XML plan capturing protocol
The compliance checklist provided by PCI-SIG is ported in an Excel
sheet as the test plan; from this it’s straightforward to generate the
XML test plan, which can be easily linked to the simulation coverage
results provided by Questa in the form of the Unified Coverage
Database (UCDB). This database is the repository for all coverage
information – including code coverage, cover directives, cover points
and assertion coverage – collected during the simulation by the
Questa infrastructure. Questa provides the ability to merge the XML
test plan with all coverage results in the form of UCDB, which is
accessible both via log file and GUI.
Compliance checklist items
Mapping of English protocol definitions to a mechanism for
verification can be a major challenge. It’s easy to underestimate the
workload and get confused between checking a single scenario and
proving that a specific feature works in all scenarios.
Consider an example: a certain PCIe compliance checklist item
says that permitted Fmt[1:0] and Type[4:0] field values are shown in
the spec table. All other encodings are reserved. Fmt and Type fields
determine the type of transaction layer packet (TLP) and associated
decoding. Without a metric or indicator that reports the types of TLPs
generated and transmitted, the information from the DUT is almost
meaningless. Further complicating matters is the fact that there are
128 possible field values, while only 25 are valid.
Functional coverage is one solution. You can define functional
coverage to track the values of Fmt and Type for all transmitted and
received TLPs by the DUT. This in turn makes it easier to check the
validity of the field values and track all TLPs transmitted and received
by the DUT.
For complex PCIe problems, plan ahead and write the metrics
in such a way that can easily be converted to a verification plan.
Next, analyze the concerns in the verification plan and implement
the functional and code coverage infrastructure. Finally, map the
verification plan items to the implemented coverage infrastructure. The
result is a trackable, predictable verification plan environment that can
assess and refocus on the verification effort accordingly.
Verification holes and completeness
A successful coverage verification process can leverage UCDB to
identify bugs and automatically rerun the failed test during regressions.
The first step is to find and fix the root cause of the failure. From the
UCDB you find whichever item is not covered in the regressions and
straight away fix that issue; you don’t have to go through huge log
files. Progress toward completeness can be automatically tracked with
respect to the XML verification plan that comes with the PCIe MVC,
which can be used along with the Questa Verification Management
feature.
Efficient and faster simulation debugs
using parent-child hierarchy linking
Transaction-level modelling (TLM) describes the top to lowest level
extracted from design implementation. But this level of detail is often
not sufficient for today’s SOC designs. The Questa transaction view
provides enhanced detail by linking the top-level transaction to the
lowest level pin wiggles.
Here, we present our research and development efforts in the
development of multi-level adaptors and transformers, as well as a
more robust transaction view for analysis, visualization, and debug
facilities that resolve all the TLM issues. The Questa transaction view
displays information about the transaction at any abstraction level,
rather than the sequence of certain signal transitions at that level.
Errors detected in the transactions during simulation are highlighted
and recorded. As a result, the source of the error can be easily
tracked. All the relationships among each transaction are displayed
along with the concurrency (i.e., order/pipelined transactions). Simple
blocks defined by start and end times give the relative position of the
transactions, which makes it easier to find the out of order initiated
transactions due to the ordering rules of the protocol.
The Questa GUI transaction view shows the linking and relationship
of the top-level parent to its wire level child. It’s very hard to figure out
the issues in the PCIe serial interface because the data flows at every
The figure to the right
shows how simulation
transactions can be
presented in sequence
view for debugging.
37
edge of the clock. And the symbols and transactions are made only
after getting the correct data for the complete symbol. Finding an issue
that appears in the symbol bit stream can take an inordinate amount
of time. The Questa GUI packs the coming bit stream to provide
complete transaction information for both good and bad symbols,
which reduces debugging time. And it does the same for transactions
38
sent to the serial interface as a bit stream; that is, both good and
bad transactions are recoded as request and malformed requests
respectively. This figure below shows how the top-level transaction
is linked to the lower level wires. Once the top level transaction is
highlighted, then the corresponding wires automatically get highlighted.
Accelerated Debug: A Case Study
by Sean Safarpour and Yibin Chen, Vennsa Technologies Inc.
Debugging is one of the most painful and time consuming tasks
within the design and verification cycle. Day in and day out, engineers
trace signals in the design, stare at waveforms, and analyze lines of
code in order to understand why failures occur. In today’s advanced
design environments, debugging is one of the few tasks that has not
changed for decades. As result it has been reported that debug is the
fastest growing verification component and now takes as much as
52% of the total verification effort [1]. This article introduces, OnPoint,
the first and only automated debugging tool that analyzes failures
and returns the source of errors with no user guidance. Through a
case study we illustrate how 0-in and OnPoint can accelerate the
verification and debugging of assertions.
Introduction
The majority of project managers will identify verification as their
primary efficiency challenge. And among the various tasks associated
with verification, debug is generally the biggest contributor to long
verification times and release date uncertainties. It has been reported
that debug is that fastest growing verification component and now
takes as much as 52% of the total verification effort [1]. Debug tasks
are performed by engineers hundreds or thousands of times during
the lifespan of a project, and effort associated with many such tasks
can be especially hard to predict or estimate. Whether at the RTL
verification stage or at the post-fabrication validation stage, debug is a
time consuming process that must be addressed and accelerated.
The debugging process starts with the discovery of a failure. In
functional verification, a failure occurs when a specified expected
behavior is not observed. For instance, at the RTL stage, an assertion
may fire during simulation or through the analysis of a formal tool. In
this context, debugging the observed failure incorporates the following
tasks.
1.Understanding the conditions under which the failure occurs
2.Determining the root cause of the failure
3.Developing a fix that prevents the failure from occurring
Today, these tasks are performed manually by engineers with the
help of debug assistance tools such as waveform viewers, design
navigators and visualization tools. In other words, once a failure occurs
engineers must analyze the design and testbench source code, the
waveforms and the specifications to identify which components are
responsible for the problem. In this process, they traverse the design
and testbench codes, annotate simulation values onto the source code
and perform “what-if” analysis. The failure may be due to different
components such as an unexpected stimulus, a bug in the design, or
an error in the expected behavior of the design. The stimulus can be
39
a testbench data generation model, the design can be an RTL module,
and the expected behavior can be an assertion. With the complexity
and size of today’s design, such components are rarely designed by
the same engineers. As a result few engineers are equipped with
the adequate level of familiarity of the overall verification and design
environments to be able to effectively address the issues that may
arise. After undergoing a time consuming investigation process,
which may involve multiple engineers and may take hours or days,
certain lines of source code are found as the culprit of the failure and
are modified to correct the bad behavior. The described debugging
techniques are resource intensive and time consuming. There has to
be a better way.
This article introduces OnPoint, the first and only intelligent
debugging tool that automatically performs root cause failure analysis
to significantly eliminate much of the manual debug effort. To illustrate
the power of the tool we walk through a debugging case study of a
MIPS processor core with multiple bugs. We first find a number of
failing assertions using Mentor Graphics’ 0-in tool and debug and
correct the bugs using Vennsa Technologies’ OnPoint. The case study
shows that the seamless debugging environment offered by these
tools is a departure from the traditional debug process, providing
considerable time savings in the verification flow.
Design Overview
The design used in this case study is a MIPS processor [2] written
in Verilog that is composed of 142 modules totaling 5,378 lines of code
and approximately 92,000 synthesized gates. The implementation
consists of 5 pipeline stages: an instruction fetch/decoder stage (IF/
ID), a register fetch stage (RF), an execution stage (EX), a memory
stage (MEM), and a write back stage (WB). Pipeline operations are
coordinated by a device controller implemented using a finite state
machine (FSM). A diagram outlining the major system components is
outlined in Figure 1.
The IF/ID stage reads the instruction from memory based on the
program counter and decodes the instruction. The RF stage fetches
any required registers and generates the next program counter.
Branching instructions are also handled at this stage. The EX stage
that follows then executes the instruction as required. Finally, the MEM
and WB stages perform the remaining memory and register operations
based on the output of the EX stage and the instruction.
40
Figure 1: MIPS High Level Functional Block Diagram
Failing Assertions: we have bugs
A total of 54 assertions and 4 assumptions are written in System
Verilog by a verification engineer with no prior experience with this
IP core, based solely on the specification [2] of the design. The
process of becoming familiar with the specifications, writing the
assertions, setting up and running Mentor’s 0-in took approximately
9 days. During this time, easy bugs discovered by 0-in were fixed
as soon as they were found. The challenging debug process starts
with 4 out of the 54 assertions failing as their root cause cannot be
quickly determined. The firing assertions are discussed in detail in the
following sections. The 0-in results at this stage are shown in Figure 2.
Fixing the first bug: missing assumption
We begin our debugging process by first picking an assertion we
want to focus on. We pick the assertion mul_to_idle since it is a low
level assertion targeting only the device controller. This assertion
states that if the device controller is in the multiplier state (`MUL) for
33 consecutive clock cycles, then the FSM must transition into the idle
state (`IDLE) in the next clock cycle.
mul_to_idle: assert property(@(posedge clk) disable iff(!rst)
(CurrState == `MUL)[*33] |=> (CurrState == `IDLE));
OnPoint integrates easily with 0-in and we stitch the two tools
through a simple script to automatically diagnose all failures that
0-in discovers. Thus, to debug the assertion we can simply open the
OnPoint diagnose report as shown in Figure 3. OnPoint returns 8 RTL
suspects that could be the source of our problem.
Figure 2: 0-in Results with four failing assertions
Figure 3: RTL suspects for assertion mul_to_idle
Each suspect is ranked by priority with three stars being the most
likely source of the bug and zero stars being the least likely. The three
highest ranked RTL suspects in our case point to the main FSM of
the system controller. A code snippet of the FSM with the these three
suspects highlighted is shown on the next page.
41
always @ (posedge clk)
if (~rst) CurrState <= `RST;
else if (~pause)
CurrState <= NextState;
always @ (*)
begin
case (CurrState) /*Finite State Machine part2*/
...
`MUL:
begin
if (delay_counter==32) NextState = `__TP `IDLE;
else NextState = `__TP `MUL;
end
default NextState =`__TP `IDLE;
endcase
The highest ranked input suspect for our example is the pause
signal meaning that changing the value of pause can fix the problem.
One powerful feature of OnPoint is the ability to generate a “fix”
waveform for inputs, wires and register suspects that show what
values can correct the failure. In this case, the fix waveform suggests
that if the pause signal is low in the last three clock cycles (in contrast
to the simulated value), the assertion will not fail. Figure 5 shows a
screenshot that displays the simulated value that causes the failure
(the third signal mips_sys/pause) and the fix waveform (the last signal
mips_sys/pause_fix).
Upon seeing the pause as the top input suspect with its
corresponding the fix waveform, it became clear that an assumption
was needed to constrain pause. We went back to the specification and
collected all other instructions that required a similar constraint and
added the following assumption to the code.
end
sequence INST_MUL;
Each suspect points to a line in the RTL where changing the logic or
timing can rectify the failure. We can quickly rule out these statements
as they either adhere to the specification (the default transition should
be to IDLE) or our statements are simply correct (CurrState <=
NextState).
Since a failure can be caused by a bug in the RTL, assertion or
stimulus, we now look for non-RTL sources. In addition to the RTL
suspects, OnPoint also found 7 input suspects in the design as shown
in Figure 4 . Input suspects point to problems stemming from the
testbench stimulus or from under constrained problems in formal tools.
In the case of formal, it means that the counter-example found may be
a false negative that cannot occur under the normal operation of the
core.
Figure 4: Input suspects for assertion mul_to_idle
(inst_op == 0)
&& (inst_func == MULT||inst_func == MULTU
|| inst_func == DIV || inst_func == DIVU);
endsequence
assume property (@(posedge clk) disable iff(!rst)
INST_MUL |-> ~pause[*35]);
The assumption states that the pause signal cannot be asserted
for 35 clock cycles if any multiply or division instructions are being
processed. We rerun 0-in to verify that the assumption resolves our
assertion error, as shown in Figure 6. 0-in returns a bounded pass for
the instruction with a radius of 45. Considering that the depth of our
pipeline is less than 45 , this result is acceptable and we can move on
to resolve the other assertion failures.
Fixing the second
bug: default
condition
For the next failure we target
the inst_SYSCALL assertion
which states that the program
counter (zz_pc_o) is incremented
after a SYSCALL instruction (two
consecutive clock cycles where
42
Figure 5: Actual and fix waveform for pause signal
Figure 6: 0-in results after first correction
the operator instruction (inst_op) is 0 and the function instruction
(inst_func) is 6’b001100).
.
inst_SYSCALL: assert property (@(posedge clk) disable iff(!rst)
$rose(rst) ##0 ((inst_op==0 && inst_func==6’b001100)[*2])
|=> zz_pc_o == ($past(zz_pc_o)+4));
The top two 3-star suspects suggest that the problem lies with the
state transition of the FSM based on the CurrState variable. The third
suspect gives more insight as it points to an assignment in the same
case block as the first suspect. The code snippet for this statement
with the first and third suspect highlighted is given as follows:
always @ (*)
begin
The length of the counterexample is only three clock cycles so we
might be able to resolve this problem fairly quickly as well. Opening the
suspect view in OnPoint we find seven 3-star RTL suspects as shown
in Figure 7 on the following page.
case (CurrState) /*Finite State Machine part2*/
`IDLE:
begin
if (~rst)
NextState = `__TP `RST;
else if ((irq)&&(~riack)) NextState = `__TP `IRQ;
43
NextState = `__TP `NOI;
sequence inst_mul_1_1;
else if (id_cmd ==ID_NI)
else if (id_cmd==ID_CUR NextState = `__TP `CUR;
(inst_op==0) && (inst_ops==1)
else if (id_cmd==ID_MUL) NextState = `__TP `MUL;
&& (inst_opt==1) && (inst_func==MULTU);
else if (id_cmd==ID_LD)
endsequence
else if (id_cmd==ID_RET NextState = `__TP `RET;
// instruction: move from $LO to $r0
else
sequence inst_mflo_0;
NextState = `__TP `LD;
NextState = `__TP `RST;
end
(inst_op==0) && (inst_dest==0) && (inst_func==MFLO);
...
endsequence
It takes the processor a total of 40 clock cycles to
execute a multiply instruction. Of these 37 cycles 35 are
used to perform the actual multiply operation (inst_mul_1_1
holds) and two are used to move the product to register r0
(inst_mflo_0 holds). The assertion checks that the product of
operand registers rs and rt is correctly stored in cop_addr_o.
Figure 7: Suspects for assertion inst_SYSCALL
At first sight, everything looks okay, but upon a closer look we start
doubting the default state. When no instructions are available and not
interrupts are present, instead of transitioning to the `RST (reset) state
the FSM should transition to the `NOI (no instruction) state. We quickly
make the correction and rerun 0-in to confirm the fix. We find that only
one assertion remains, as shown in Figure 8.
Fixing the last bug: careless mistake
Finally, the last failing assertion, inst_MULTU_1, checks that
the multiply instructions operates according to specification. The
sequences inst_mul_1_1 and inst_mflo_0 used in the property are
defined as follows.
inst_MULTU_1: assert property (@(posedge clk) disable iff(!rst)
$rose(rst) ##0 inst_mul_1_1[*35] ##1 inst_mflo_0[*2]
|=> ##1 cop_addr_o==($past(rs,32))*($past(rt,32)));
// instruction: $LO = $r1 * $r1
44
Examining the OnPoint results for the last bug we find 11
3-star suspects. In this case, we use the tree suspect view
to look at OnPoint results. The tree view shows suspects
encapsulated within their modules and “always” blocks thus
allowing us to focus on the general location at a glance.
A screenshot of the 3-star suspects displayed using the tree view is
shown in Figure 9. Since the bug is related to the multiply instruction,
it’s probably a good idea to look at the multiplier/divider module first.
The first suspect points to a block of code in the reset logic of the
muldiv_ff module:
if(~rst_i)
begin
count
= 6’bx;
hilo
= 65’b0;
op2_reged
= 33’bx;
op1_sign_reged = 1’bx;
op2_sign_reged = 1’bx;
...
end
After a quick look, we confirm that the reset behavior of the block is
correct so we check the next suspect which is a statement within the
same always block as the previous suspect:
Figure 8: 0-in results after the second correction
This is a statement in the multiplier
implementation and the purpose of the
RTL is to shift the entire contents of the
register to the right. However, instead of
using the upper 64 bits of the hilo register,
the lower 64 bits are used. We correct the
the careless mistake as follows:
hilo = {1’b0,hilo[64:1]};
Rerunning 0-in indicates that all the
assertions now pass verification.
Conclusion
In this article we walked through a
debugging case study where 0-in and
OnPoint were used to locate a variety of
bugs in a MIPS core. We showed that
for each failure OnPoint automatically
generated a list of high likely error
sources where corrections could be
applied. As a result, all failing assertions
were resolved in a matter of minutes
with no manual tracing required. We
should emphasize that OnPoint does
not eliminate the need for conventional
debug techniques, but can significantly
reduce the amount of effort involved.
Figure 9: RTL suspects for module assertion inst_MULTU_1
[1] Harry Foster, “Ensuring RTL Functional Correctness in FPGA Design”, DAC.com
Knowledge Center Article, May 2010
[2] MIPS Technologies, MIPS32 Architecture, http://www.mips.com/products/
if (sign)
architectures/mips32/
begin
...
else begin
if(hilo[0]) hilo[64:32] = hilo[64:32] + op2_reged;
hilo = {1’b0,hilo[63:0]};
end
45
Verification of a Complex IP Using OVM and Questa:
from Testplan Creation to Verification Success
by Julien Trilles, verification engineer, PSI-Electronics
PSI-E Verification Flow
For flexibility and reuse concerns, PSI-Electronics verification flow
has been developed using open and standard solutions. XML was
chosen some years ago to describe plans, as it is easily processed
to generate documentation for a lot of tools like Microsoft Office or
OpenOffice or parsed to extract suitable information. The verification
plan is captured as XML files. For the first time the design features
and properties are listed and grouped by functionality to build the
verification plan. In a second time, testcases and functional coverage
are added and will allow the verification engineer to measure
completeness of his work.
As an OVM partner, PSI-Electronics has built an expertise in OVM
testbench and Verification IP development. The fact that OVM is now
supported by a lot of simulators, and in a permanent evolution (thanks
to many contributors and a large developer community) led us to use
it for almost all our IP verification activities. Last year, OVM register
packages appeared from Cadence and Mentor and they have provided
us a way to easily model and check registers and a quicker way to
write tests at a register level.
- One external interface called Debug Port, which is unique and has
been implemented as a JTAG-DP.
- One or more resource(s) interface(s) called Access Port, which is
resource protocol dependant and has been implemented to enable
JTAG and AHB connections. As an Access port is closely related
to resource, it can be integrated into the resource.
To verify ADI design, 2 verification components were created
using the Paradigm-Works template generator [2] to ensure their
homogeneity.
Each OVC is composed of an “agent” which can be configured to be
a slave or a master. An agent includes a sequencer that feeds a driver
and a monitor to get interface transactions.
We created a JTAG agent to drive and monitor both Debug Port and
Access Port when configured as a slave or a master. An AHB slave
agent is used to drive and monitor Access Port master AHB interface.
Beyond OVM reporting features, we have used Questa transaction
viewing capabilities to easily analyze sequences series and
transactions properties. Debug at this high level enables us to identify
bug source faster and provide quicker return to our designers. Finally
coverage and assertions counts are evaluated as achievement metrics
but we were facing trouble communicating with the large sets of data
we got when running regressions (set of tests). This article shows how
we solved this issue through an IP verification example.
In order to model the ADI registers, a register package was used [3]
[4]. This package permits the building of register accesses by name
or by address. It also monitors accesses to DUT registers, check their
consistency and add coverage on registers fields. As it is compliant
with IP-XACT, writing a XML register file is possible to automatically
generate register model SystemVerilog code.
Design and testbench example
presented in this article
Following the OVM methodology, the verification environment is
mainly composed of the testbench, the top testbench and the DUT.
Connection between DUT and drivers is done in the top testbench. All
the tests scenarios are included in the test library. These scenarios are
built by running some virtual sequencer sequences or directly register
package sequences. Those virtual sequences invoke subsequencers
sequences (Figure 3 – ADI verification environment, plain lines), i.e
here JTAG or AHB sequences.
Description of our verification methodologies will be illustrated with
the verification of a concrete example we designed last year. The
design under test is an implementation of the ARM Debug Interface
version 5 [1]. Its main goal is to give a user a way to debug System
on Chip components. A host can take full control of a microprocessor
with this implementation, access JTAG scan chains, trace accesses of
interconnect bus and so on.
46
ADI is divided in 2 parts:
The register sequencer is plugged on the JTAG Debug Port while its
database updates and compares by getting transactions from JTAGDP monitor.
Figure 1: ADI v5 structure
Figure 2: OVM Agent description
Top monitor and checker modules are
connected to agent monitors using analysis
ports (Figure 3 – ADI verification environment,
dotted lines). Top monitor collects transactions
information for functional coverage whereas
checker uses that information to run SVA
assertions.
Debugging at a higher level
with OVM and Questa
The environment we created provides much information for
accelerating debug. Having high level debug information dramatically
speeds up results interpretation. Almost all errors are captured in test
logs so it prevents us to go at signal level into waveforms. After running
a test we can look at its log to find out errors or warnings reported by
user-defined checkers or register package:
# --- OVM Report Summary --#
# ** Report counts by severity
# OVM_INFO :4078
# OVM_WARNING : 25
# OVM_ERROR : 7
# OVM_FATAL : 0
Figure 3: ADI verification environment
Figure 4 - OVM Report Summary
# OVM_ERROR @ 1786995: adi_mem_map.jtag_debug_port.CTRL_STAT
[OVMRGM] Mismatch : Following fields miscompared :
# [ 23: 12] ‘trnct’ : Exp=12’h0 Rcvd=12’h429 Mask=12’hfff
# [ 11: 8] ‘masklane’ : Exp=4’h2 Rcvd=4’h5 Mask=4’hf
# [ 3: 2] ‘trnmode’ : Exp=2’h0 Rcvd=2’h1 Mask=2’h3
Figure 5 – Example of register error report
47
# OVM_ERROR @ 1787195: reporter [AHB_PUSHED_VERIFY_SEQ]
STICKYCMP must be asserted
# OVM_ERROR @ 1787195: reporter [AHB_PUSHED_VERIFY_SEQ]
TRNCNT must be h0FF
Figure 6 – Example of user-defined checker report
Before going deeper into waveform signals we use Questa
transaction viewing feature to analyze transactions in a waveform
window. For example we can verify that a register access generates
AHB master port accesses with correct characteristics (size, type,
burst or single…).
Figure 8: PSI Verification Management Flow (adapted
from Questa User Manual)
Flow description:
1) Create verification plan. Use of Questa XML
Import Hint feature is the best way to avoid errors
with the item path. For example, all assertions
can be listed in this window and then linked into
the Verification plan. This is a crosscheck to
ensure each assertion or coverage is detailed
in the plan too.
Figure 7: Questa transaction viewing
Reporting and managing results
with Questa
Over the past few years we tried to find the proper way to measure
verification completeness against verification plan. The different
solutions were quite difficult to set up as they involved tools from many
providers, with the result that many datas were modified and even lost
during the process.
Questa Verification Management provides the flow we needed as it
allows us to import our verification plan in a UCDB (Unified Coverage
DataBase) format and merge it with all the verification datas like
coverages, test datas or assertions results.
Here is the way we adapted our flow from the Questa User Manual.
This work is done once and for all unless you
change your testbench architecture. However architecture and items
names are supposed to be frozen at this time of verification.
2) Import XML verification plan to a UCDB file using xml2ucdb
Questa script and a corresponding XSL stylesheet (gameplan.xsl
here):
% $QUESTA_HOME/linux/xml2ucdb -format GamePlan
verif_plan.xml -ucdbfilename verif_plan.ucdb -stylesheet
$QUESTA_HOME/vm_src/gameplan.xsl
3) Merge selected UCDB testfiles: This can be done with the
“vcover merge” utility and tests can be selected using UNIX wildcard
characters:
% vcover merge -out merged_tests.ucdb testdir/test_*.ucdb
UCDB files are saved when the test is finished. They contain
all information about coverage and assertions results.
48
Of course that report provides
the verification engineer a
quick way to identify errors
and weaknesses of his
verification achievement.
Questa commands to
generate a HTML report in
Unix console are:
Figure 9: Questa XML Import hint
% vsim -viewcov results/backannotated_vp.ucdb -c -do gen_html_report.do
4) Merge verification plan with merged tests: We use again “vcover
merge” utility like this:
% vcover merge -out results/backannotated_vp.ucdb verif
_plan.ucdb merged_tests.ucdb
This step automatically links verification plan sections with matching
merged results. Unlinked items are not lost and are still available
in their corresponding window (Cover Groups, Assertions, Toggle,
FSM…).
5) Generate a HTML report: HTML reports have improved
significalnty to give design engineers and project managers a clear
status of the verification, by including all results like tests pass/fail
criteria, functional, code coverage and assertions percentages.
Details are available to everyone by browsing the design and
testbench architecture or
the testplan. It is important
that people interested in
results only don’t have to
run an EDA tool they don’t
necessarily know, they just
have to use their common
web browser.
where gen_html_report.do file is:
coverage report -html -htmldir html_results
quit -f
Questa HTML Coverage Report is divided into four main areas,
where all coverage, tests and assertions results can be found. The
verification plan can be browsed at the left to read sections and see
their linked items results.
6) And-or open final results UCDB in view mode:
% vsim -viewcov reg_results/backannotated_vp.ucdb
Figure 10: Questa
HTML report
49
That verification flow is
more efficient and less time
consuming than our previous
one: we gained about 20%
of the overall project time for
6 months with 5 engineers
by reducing the verification
bottleneck.
CONCLUSION
Figure 11: Questa UCDB view mode
This view can be used for active result analyzing. One can exclude
some coverage item or modify a verification item weight or goal for
example.
7) Analyze result datas: Functional Coverage, code coverage,
assertions and tests are the metrics we use to measure our verification
completion. They tell us if we exercised all the design logic and
features and if additional tests have to be written. Importing all
these metrics into the verification plan allow us to use a plan driven
methodology instead of coverage driven methodology.
8) Speed up functional coverage completion: In order to avoid
running too many redundant sequences and to accelerate coverage
convergence, we introduced get_coverage SystemVerilog function
in our tests. High level sequences are generated and started until a
calculated functional coverage percentage reaches a threshold. The
selected coverage items fully depend on test goal and are typically a
combination of transaction parameters such as command or response
types. This technique allows us to save about 10% of time running the
full regression.
These 8 steps are automated in a Makefile to run daily regressions
with randomized seeds. They permits to get different sets of tests
and catch some corner cases bugs much quicker. After each new
RTL delivery, we run an identified small subset of tests called “smoke
regression” that provides us a first level of confidence. Based on this
status, we go deeply in verification or notify the design team of the
problem found.
50
OVM and Questa provided
us a reliable and complete
solution for our complex IP
verification. Adding OVM
register package eases
writing complex scenarios
and report high level
messages to get errors closer to their source, before checks at IP
outputs. This package also adds functional coverage for register fields
which gives new metrics to measure verification completeness.
Moreover Questa Verification Management feature was easy to
integrate inside our custom verification flow due to its flexibility. It helps
us to deal with the large amount of datas we get when verifying a large
IP by unifying results and merging them into a single UCDB file. It not
only provides engineers and managers a way to check verification
completion at a glance but also a nice interface to check precise
results like FSM covered states or assertions pass/fail counts.
Finally the integration in the SoC and the validation of the system
were quickly achieved thanks to the high quality level of our debug IP.
The efficiency of our new verification flow [5] based on plan driven
methodology has been proven with the first correct FPGA prototype.
REFERENCES
[1] Arm Debug Interface, http://infocenter.arm.com/help/index.jsp?topic=/com.arm.doc.
ihi0031a/index.html
[2] Paradigm template generator, http://svf-tg.paradigm-works.com/svftg/ovm_tg
[3] Mentor Graphics register package, http://www.ovmworld.org/contributions-details.
php?id=33&keywords=A_Register_Package_for_OVM_-_ovm_register-2.0_Release
[4] Cadence register package, http://www.ovmworld.org/contributions-details.
php?id=43&keywords=An_OVM_Register_Package_2.1.1
[5] PSI-Electronics verification flow 0.2, internal document.
Agile Transformation in Functional Verification, Part 1
by Neil Johnson, Principal Consultant and Brian Morris, Vice President Engineering, XtremeEDA
The potential for agile methods in IC development is large. Though
agile philosophy suggests the benefits of an agile approach are most
profound when applied across an entire team, reality often dictates
that new techniques and approaches are proven on a smaller scale
before being released for team wide application.
This article is the first in a two part series that describes how
a functional verification team may benefit from and employ agile
planning and development techniques while paving the way for use in
RTL design and ultimately, team wide adoption.
Part I of Agile Transformation in Functional Verification opens
with the limitations and consequences of big up front design (BUFD)
from the perspective of a functional verification engineer. It continues
with a discussion on how software engineers have overcome similar
limitations through the use of iterative planning and incremental
development. The summary includes a preview part II of Agile
Transformation in Functional Verification and its recommendations for
how functional verification engineers become more agile.
Big Up Front Design and Constrained
Random Verification
Big up front design (BUFD) is common in IC development. In BUFD,
a team attempts to build detailed plans, processes and documentation
before starting development. Features and functional requirements
are documented in detail; architectural decisions are made; functional
partitioning and implementation details are analyzed; test plans are
written; functional verification environments and coverage models are
designed.
While BUFD represents a dominant legacy process in IC
development, wide adoption of constrained random verification
with functional coverage presents a relatively recent and significant
shift in IC development. As has been documented countless times,
constrained random verification better addresses the exploding state
space in current designs. Relative to directed testing, teams are able
to verify a larger state space with comparable teams and resources.
But is constrained random verification with functional coverage
living up to its potential? Constrained random verification employed
with BUFD contains one significant flaw. From a product point of view,
a design of even moderate complexity is near incomprehensible
to a single person or even a team of people; the combination of
architecture and implementation details are just too overwhelming.
While the technique and associated tools may be adequate for
addressing all these details, the human brain is not!
The flaws of constrained random verification and the limitation of
the human brain are easy to spot during crunch time, near project end,
when the verification team is fully engaged in its quest toward 100%
coverage. Because of the random nature of stimulus, it is very difficult
for verification engineers to predict progress in the test writing phase
of a project. All coverage points are not created equal so the path
toward 100% coverage is highly non-linear in terms of time required
per coverage item.
To account for the unforeseen limitations in the environment,
it is common for verification engineers to rework portions of the
environment–or write unexpected and complicated tests–to remove
such limitations. This is particularly relevant as the focus of testing
moves beyond the low hanging fruit and toward more remote areas of
the state space.
Taking the opportunity to rework the environment is rarely
accounted for in the project schedule and can cause many small
but significant slips in schedule. Ever wonder why tasks sit at 90%
complete for so long? It is because those tasks are sucking in work
that was not originally accounted for in the first place.
What is truly amazing is not the fact that tasks sit at 90% for so long,
it is that it is always a surprise when it happens! This should not be a
surprise. It is impossible for people to understand and plan a coverage
model that will give you meaningful 100% coverage with BUFD. It is
also impossible to comprehend the requirements of the environment
and tests, especially when considering the random nature and
uncertainty of the stimulus. BUFD will not give a team all the answers;
rework of the environment will happen regardless of whether or not the
schedule says so!
It is this type of uncertainty that an agile approach to IC
development that includes functional verification can help address.
Uncertainty is an inherent part of functional verification and cannot
be eliminated. The extent to which it negatively influences delivery
objectives and product quality, however, can be mitigated significantly.
51
Other tools, such as intelligent testbench design and formal
analysis, can of course be used to supplement or even replace
constrained random verification. In the end, however, functional
verification is a process that critically depends on people and
teamwork for success. Functional verification must be seen as a
continuous, people centric process of understanding, refining, and
validating potential solutions. This as an alternative to trivializing
functional verification as a two step process of capturing, then
verifying a list of requirements.
An Agile Alternative to BUFD
Chess is a game that plays out through a combination of strategy
and tactics.
Strategy describes a player’s general approach to the game. Will
the player go for the win or play for a draw? How can they exploit
the weaknesses of their opponent? Will they choose a defensive or
attacking posture? Will attacks be launched through the center or on
the flanks? Which opening moves best support the strategy?
Good players strive for a well crafted strategy and then move their
pawns and pieces in support of that strategy. Throughout a game,
great players examine how successful their strategy has been and
change it if they perceive an advantage in doing so.
Tactics are described as short sequences of moves that either limit
the moves of an opponent or end in material gain (Wikipedia). They
are the tools that enable creation of a dominant position, or capture
of an opposing pawn or piece. They rely more on current positioning,
recognition and opportunism than planning. They are short term
execution based on a player’s immediate situation.
Up front planning in functional verification should be similar to
forming a strategy in chess. As part of a strategy, a team should have
a clear picture of what they want to accomplish with some general
guidelines for execution. A solid strategy should also acknowledge the
fluidity and unforeseen circumstances that await the team. A functional
verification strategy should start with identifying the following:
• a prioritized feature set;
• a methodology; and
• a high-level schedule.
Most teams already start functional verification with a feature list.
While some may resist prioritizing features because “all the features
are important”, prioritizing is almost guaranteed to happen anyway as
budget and delivery pressures intensify. Feature prioritization in initial
52
planning is the key to having a team focus on verifying high value
features early, making them less vulnerable to reduction in scope later
in the project.
Ignoring the more technical definitions normally associated with the
word methodology in functional verification, this article uses a grander
definition stated by Alistair Cockburn in Agile Software Development:
The Cooperative Game:
“everything you regularly do to get your [hardware] out.
It includes who you hire, what you hire them for, how they
work together, what they produce, and how they share. It is
the combined job descriptions, procedures, and conventions
of everyone on your team. It is the product of your particular
ecosystem and is therefore a unique construction of your
organization.”
Specific to functional verification, a methodology may include
identifying team members, skill-sets and suitable roles, where people
work and who they work with, modes of interaction with design and
modeling teams, reporting structure, coding standards, general
delivery requirements, verification libraries, bug-tracking systems,
documentation and anything else that governs daily operation within
the team. Methodologies need not supply strict rules but they should
be visible and universally accepted. A methodology is something that
a team can create in a day or less (Cockburn 2006) and should be
accessible to anyone with a stake in the functional verification effort.
The schedule produced in initial planning should be very high-level
and include feature-based delivery milestones. Most importantly, the
team should recognize that the first schedule that gets built is very
likely to be wildly optimistic, totally inaccurate and in desperate need of
continuous refinement.
With a strategy completed, a team may start identifying the tools–
tactics–that they are likely to use through the coarse of the project.
This would include things like:
• options for environment structure
• functional coverage methods
• test writing strategy
odirected
oconstrained random
ocombination of both
• use of formal verification
• stimulus modeling
• verification code reviews
• black-box/white-box assertions
• hardware/software co-simulation
• emulation/acceleration
• modeling and scoreboarding strategies
• exact/approximated response checking
• block or chip-level testing
• available 3rd party IP
• internal/external outsourcing
Early in the project, it is only important to identify tactics with the
teams’ strengths or deficiencies related to each. Ensure training
is arranged if necessary but also ensure training is delivered at an
appropriate time (i.e. as tactics are required as opposed to months
before hand).
Resist the urge to assume legacy tactics will be well-suited to new
development. While wild deviation may not be necessary–or even
recommended–the applicability of legacy tactics should at least be
assessed prior to use.
While it is not necessary to eliminate detailed discussion on when
and how certain tactics will be employed, detailed discussion should
be at least limited. Remember that tactics require recognition and
opportunism as opposed to detailed planning. Learn to recognize and
react to situations on the immediate horizon instead of planning for
situations that may never arise.
Chess players that are known strategists may not be great tacticians
nor are tacticians always great strategists. While the two are obviously
required, they are independent skills. The same is true in functional
verification. While strategies keep a complete but concise view into the
future, they are fluid and may change during a project given changing
conditions. Tactics are tools of high relevance in the short term that
cannot be accurately planned for in the long term. To minimize wasted
planning effort and enable accurate, high confidence decisions, teams
must understand the difference between the two. A team should also
understand their strengths and weaknesses and deliberately and
methodically work to improve both areas.
Growing Hardware
with an Agile Approach
Throughout a project, there are two techniques in particular that
can help a team differentiate between long term strategy and short
term tactics: iterative planning and incremental development. Both are
used extensively used in agile software development. In functional
verification, they can be used to promote analysis and refinement of
the teams’ verification strategy, perform just-in-time tactical decision
making with respect to implementation and provide objective metrics
for overall effectiveness.
Iterative Planning
Using iterative planning, the detailed planning and analysis is done
continuously through the life of the project. It is assumed that long
term planning is inaccurate at best so detailed planning is limited to the
immediate horizon; anywhere from 1 week to 3 months into the future
depending on the project circumstances. Long term planning is kept to
a very coarse level of detail to minimize the time spent updating and
maintaining the long term plan.
Agile teams see two advantages to iterative planning. First is that
details are limited to a period of time that developers can comprehend.
For example, it is relative easy to confidently plan one week of work
in great detail. One month of detailed planning, while not as easy as
one week, is also very realistic. When planning a year or more into the
future, however, it is impossible to have the same level of accuracy or
confidence. Changing project dynamics will surely obsolete planning
decisions and with time lost to rework the plan and/or implementation.
A second advantage seen in iterative planning is that past
experience can be used to plan future progress. This roughly equates
to delaying decisions to a time when it is more reasonable to expect
that those decisions will be correct. With more experience, subsequent
decisions can be made with increasingly greater confidence.
Incremental Development
With BUFD and defined process, progress is generally measured
as a completion percentage derived from the work breakdown
structure. For example, when half the tasks in the WBS are done,
a project is half done.
A problem with measuring progress relative to planned effort
identified in Cohn 2005 is that individual tasks have little correlation
to the end product and minimal value in the eyes of a customer.
Further, Cohn 2005 suggests features do hold value by virtue of being
demonstrable to a customer, so many agile teams develop products
incrementally and track feature based progress.
In Agile Transformation in IC Development (Johnson, Morris 2010),
we describe incremental development as:
“…an approach where functionality is built and tested as a
thin slice through the entire development flow, start to finish.
A product starts as a small yet functional subset and steadily
grows as features are completed. Progress is based on code
that works rather than code that’s written. Working code is a
great metric for measuring real progress and demonstrating
and clarifying implementation decisions.”
53
Features offer a far more objective metric to measure progress.
They are tangible and demonstrable to a customer. They also hold the
word completion to a higher standard in that to be complete, a feature
must be designed, implemented, tested, documented, etc. such that it
could theoretically be delivered to a customer.
Preview: Agile Transformation
in Functional Verification – Part II
Critical, objective analysis of a problem is key to implementing the
right solution. While the concepts in part I are somewhat abstract, they
are critical for motivating functional verification teams that crave an
agile alternative to BUFD.
In Agile Transformation in Functional Verification – Part II, we
look at the details of how a team actually uses agile planning and
development techniques.
The opening sections continue the discussion on distributed
planning as an alternative to BUFD. They include firm guidelines for
conducting up front planning and building a functional verification
strategy. The process of feature capture, prioritization and high-level
scheduling is also explained in greater detail. Planning discussion
continues to a method for iterative planning where past progress is
critiqued, the team’s verification strategy is analyzed and short term
detailed planning is done.
Part II continues with goals and recommendations for agile
functional verification teams at familiar stages of development.
Environment Development
Strive for a working code base as early as possible with an
environment that is functional from day one.
RTL Integration
Neither the design nor the verification environment need be
complete to warrant integration of the RTL. There is plenty that can
be done with partially completed RTL and a minimal yet functional
verification environment
Transaction Development
Transactions define communication mechanisms between adjacent
components in the DV and between the RTL and DV environment.
Ensure they are well designed and tested prior to wide spread use.
54
Component Development
Define and integrate all the components up front then incrementally
add functionality to each component on a feature-by-feature basis.
Block-level and Top-level Testing
Until features are integrated and verified at the top-level (aka the
customer perspective), they are not ready for production nor release,
and are therefore incomplete.
All of the above are described within the context of incremental
development where a functional verification team executes the iterative
planning approach to produce a growing subset of verified RTL.
Part II also includes case study examples from a real project to
illustrate how functional verification engineers can tailor an agile
approach to their particular project circumstances.
References
Beck, K., Extreme Programming Explained: Embrace Change (2nd edition), AddisonWesley Professional, 2004.
Cockburn, A., Agile Software Development: The Cooperative Game (2nd Edition),
Addison-Wesley Professional, 2006.
Cohn, M., Agile Planning and Estimating, Prentice Hall PTR, 2005.
Johnson, N., Morris, B., “Agile Transformation in IC Development”, Verification
Horizons, Mentor Graphics Corp, February 2010.
http://en.wikipedia.org/wiki/Chess_tactics, retrieved May, 2010.
Simulation-Based FlexRayTM Conformance Testing—
an OVM Success Story
by Mark Litterick, Co-founder & Verification Consultant, Verilab
Overview
This article presents a case study on how the Open
Verification Methodology (OVM) was successfully
applied to implement a SystemVerilog simulationbased conformance test environment for next
generation FlexRay™ 3.0 Communications System
controllers.
Complex application requirements and a need to
run conformance tests on multiple vendor simulators,
including Mentor’s Questa, with reliable, repeatable
and identical results provided the design team with
specific challenges. The OVM helped meet these
challenges and proved that OVM has achieved its goal
to “facilitate true SystemVerilog interoperability”.
Introduction
The FlexRay Communications System is a robust, scalable,
deterministic, and fault-tolerant serial bus system designed for use in
automotive applications [1]. Some of the basic characteristics of the
FlexRay protocol include: are synchronous and asynchronous frame
transfer, guaranteed frame latency and jitter during synchronous
transfer, prioritization of frames during asynchronous transfer, single
or multi-master clock synchronization, time synchronization across
multiple networks, error detection and signalling, and scalable fault
tolerance [2]. The next generation V3.0 of the FlexRay Protocol
Specification [2] supports new applications such as drive-by-wire,
through enhancements and additional features.
From a verification point of view FlexRay is a challenge since it
represents a complex and highly configurable protocol. This article
discusses how the OVM was effectively applied an application
typically handled by many directed tests implemented in hardware.
The requirement was to implement a simulation-based environment
capable of validating conformance of FlexRay Communications
Controller devices, described at the Register Transfer Level (RTL),
or clock-accurate behavioral level, with a set of very specific tests
developed by the FlexRay Protocol Conformance Test Working Group
and defined in an 800-page FlexRay Protocol Conformance Test
Specification document [3].
Figure 1: A basic top-level view of the conformance test structure
The main requirements for the conformance test environment
include:
• Deterministic repeatable operation across different
SystemVerilog simulators
• Support for different target implementations from multiple suppliers
• Capability to run all tests with different configurations
and modifications
In order to satisfy the requirement for identical and repeatable
operation across simulators we had to ensure that all aspects of
stimulus, including sequence and transaction field values and timing,
were tightly constrained during test runs. However, using constrained
random verification techniques and the OVM to implement such an
environment meant that a flexible and extensible solution could be
developed much more quickly than a large number of directed tests.
SystemVerilog interfacing and multi-language support made it a
natural choice to support the different Implementations Under Test
(IUT) which could be coded in Verilog, SystemVerilog, VHDL or clockaccurate SystemC behavioral models such as the FlexRay Executable
55
Model (FREM) used throughout the development
phase. Mapping from the test environment
Controller Host Interface (CHI) Abstract Physical
Interface (API) to the physical registers of the
IUT is provided by the CHI Adaption Layer shown
in Figure 1; this enables the conformance test
environment to remain independent of the IUT
but requires an IUT-specific adaption layer to be
implemented for each target device.
OVM built-in automation allowed the scope of
the test space to be easily managed. This was
particularly important, as FlexRay has more
than 60 node and cluster related configuration
parameters which for the purposes of testing are
organized into a set of basic configurations with
additional test-specific modifications requiring more than 10,000 total
test runs for the 430 tests specified in the conformance test suite.
Project Overview
The project plan was broken down into three main phases which fit
in with OVM environment development goals and customer deliverable
expectations:
• Phase 1: develop the main testbench architecture with all major
building blocks in place. Demonstrate operation with both SystemC
and RTL IUTs. Implement stimulus and checks for a small number
of tests.
• Phase 2: implement 80% of the tests against the evolving
Conformance Test Specification, including stimulus and checks but
with allowances for unimplemented features and checks as well as
failing tests.
• Phase 3: conclude 100% of the tests against the final release of
the Conformance Test Specification, including all features and
checks, with 100% explained test results.
Figure 2 provides an overview of the project timeline and shows
the test and environment development curves throughout the plan
phases. The OVM was especially valuable in establishing the steep
implementation ramp for environment capability during the initial phase
of the project. During the test implementation phase the majority of
activity was application-specific sequence, checker and model
development. Note also that towards the end of the project the test
implementation overtook the environment, since tests were required
before all modelling corner cases and checking could be completed.
56
Figure 2: An overview of the project timeline
As shown in Figure 2 we managed to engineer the implementation
of the overall conformance test environment to follow a quite linear
pattern. In this case, as with many client engagements, we succeeded
in our aim to perform agile, feature-based releases. After the initial
development work we could perform functional snapshot releases
of the environment at any stage with known stimulus and modelling
features and checker capability and omissions. The secret here is to
engineer the capability to support all the required features, get the
communication structure and transactions right, but once you are
confident that it can be made to work, focus on the missing pieces
of the puzzle rather than taking any particular thread all the way to
completion.
A key requirement, and one of the justifications for adopting a
simulation-based approach, was the ability to adapt to the evolving
Conformance Test Specification which was under development by
the FlexRay Protocol Conformance Test Working Group in parallel
with the implementation activity. In fact the scope and complexity of
the test specification grew considerably during the project, partly due
to contributions from JasPar [4] and partly due to increased protocol
coverage goals, so Phase 3 was sub-divided into several intermediate
milestones in order to control the deliverables.
OVM Architecture
The mapping of the conformance test environment to generic OVM
component building blocks (such as sequencers, drivers, monitors and
agents) is shown in Figure 3. The following key capabilities of OVM
were used to full advantage in the conformance test environment:
Figure 3: mapping of the conformance test environment to
generic OVM component building blocks
• OVM factory was used to build all components in the environment, and was fundamental in managing the proliferation of
configuration objects which allowed single tests to be run across
multiple configurations by overloading the derived classes from
the test files.
• Sequences were used as the basis for all stimuli providing a
clean and consistent approach to stimulus generation and well
encapsulated control from the test description files.
• TLM ports were used for all transaction level communication
within the environment, for example between the monitors and
the scoreboard
• OVM events were used for timing events, shared between
components via an event pool
The basic operation of each of the sub-components is:
• Lower Tester Agent (LT) is responsible for emulating all of the
cluster channel traffic and checking physical signals. It comprises
a timebase agent and two instances of the channel agent. The
agents contain sequencers, drivers and monitors. Tests interact
with a virtual sequencer in the LT agent which in turn sends
sequences to the appropriate physical sequencer.
All checks are carried out by the monitors or in the
scoreboard via TLM ports. The LT has extensive
error injection capability and supports all legal and
illegal traffic scenarios required by the conformance
test suite.
•Upper Tester Agent (UT) is responsible for
interacting with the IUT via the CHI software API
and the IUT-specific adaption layer. Tests can
interact with the UT sequencer directly to stimulate
the CHI in order to control all operating modes,
configuration, status, buffer, FIFO and interrupt
operation within the IUT. Since there is no physical
interface to monitor (only a software API) the
checks performed in the UT monitor must also be
stimulated directly by UT CHI sequences.
•Scoreboard is used to validate all traffic between
the Upper and Lower tester which passes through the IUT. For
instance if the model predicts that the IUT must send frames
then these are posted to the scoreboard by the UT, when the IUT
actually sends the frame the LT also sends transactions to the
scoreboard for comparison – mismatches, out-of-order traffic or
missing transactions all result in conformance test failures.
• Event Pool is used to share timing events between the Upper and
Lower Tester (and also within the lower tester agent). Most of these
events also communicate additional information by passing simple
data structures (for example slot or cycle counts) as objects within
the event.
A key design aim for the conformance test environment was to
encapsulate the test files in such a way that they could be read and
understood by non-verification experts. This was achieved in an OVMlike manner using macros for background tasks such as configuration
class generation and environment build overheads. Since most of the
checks were fully automatic in the monitors of the environment, this left
concise sequence instantiation in the test implementation files with a
very close match to the test specification requirements. For example, if
the test description were:
• In cycle 9, the LT simulates a startup frame in slot 1 with wrong
header CRC (bit flip in the LSB of the header CRC).
57
This is represented in the actual test as:
`fr_do_lt_with(lt_er_seq,{
lt_ch
== FR_AB;
lt_cycle == 9;
lt_kind
== FR_STARTUP_PAYLOAD;
lt_slot
== 1;
lt_error == FR_HEADER_CRC;
})
As a result of the single sequence call in the test, sequences
are executed on both channels with default values for all frame
content including payload, as well as a timing sequence running in
the timebase sequencer and all the downstream driver and CODEC
functionality. In addition, the frame sent to the IUT is decoded by the
channel monitors and sent to respective scoreboards for subsequent
comparison when slot status is read at the end of the corresponding
communication cycle. Users only need to handle calls to fr_do_lt and
fr_do_ut macros – these in turn perform ovm_do_on_with sequence
calls to the appropriate sequencer path inside the environment.
The scope of the conformance test environment was such that
about 130,000 non-comment lines of code were required for the final
implementation. The approximate distribution of the code is shown in
Figure 4: Code volume distribution
58
The pie-chart gives a good overview of the volume of code required
for the different aspects of the project, but it does not accurately
represent the development effort. For example the configuration
library is a large portion, but is mainly generated automatically
from the test specification file using a script (the implementation of
which was of course considerable effort, but not 30% of the project).
Sequences provided excellent reuse in the test specifications, resulting
in considerable payback. The sequence definitions are relatively
easy to replicate and build up into an extensive library; however, the
much fewer lines of code required in the transaction definition and
associated environment components are much more intense and
time-consuming to generate. Pulling together test definitions from a
library of sequences is not too difficult, but debugging the complex
interactions of the sequences with the checkers and of course the IUT
can be a much more time-consuming activity.
One important thing to note is that the total project time spent on
OVM infrastructure implementation was very small – with a working
codebase from other projects to draw on we spent most of the project
forgetting that OVM was even there. The infrastructure was pulled
together quickly and the details of the methodology could be forgotten
about.
Simulator interoperability with the OVM was not a problem on the
project. SystemVerilog language interoperability in the application
code on the other hand consumed a lot of effort. Some problems
were encountered with general language support, including
different scoping rules, constraint capabilities for complex layered
transactions and support for some basic syntactical constructs. In total
approximately 10% of project effort was consumed handling issues
with multi-tool requirements: analysis, experimentation and validation
of solutions. While this is expected to improve over time, our current
recommendations are:
• Build up awareness of each tool’s capability
• Focus on one tool rather than getting bogged-down with parallel
development
• Once you have extensive working regressions, bring the next tool
into the mix
• Do not wait until the end to investigate code compromises that will
work with all tools
Conclusion
The Simulation-Based FlexRay Conformance Test Environment
was a very challenging project with complex technical and multitool requirements. By successfully applying constrained-random
verification techniques using the OVM we were able to demonstrate
that OVM has achieved its goal to “facilitate true SystemVerilog
interoperability” [5].
Throughout the project the Verilab implementation team were able
to detect and report many issues with the SystemC Executable Model,
the Conformance Test Specification, as well as some issues with the
Protocol Specification itself. With the help of the OVM testbench the
FlexRay Protocol Conformance Test Working Group could quickly
analyse the issues, proposed fixes for the IUT and the specifications,
and release updates at regular intervals.
As well as achieving the obvious goals of pre-silicon conformance
validation, improved debug resulting from RTL visibility, reduced cost,
risk mitigation and improved quality for the IP providers, the project
also facilitated highly effective validation of the evolving Conformance
Test Specification thereby improving the quality and accuracy of
the final document which benefits all FlexRay stakeholders from IP
providers, through OEMs to automobile manufacturers.
Acknowledgements
Analysis and implementation of the Simulation-Based FlexRayTM
Conformance Test Environment was performed by Verilab under
contract to the FlexRay Consortium and we are grateful for permission
to publish this article. In addition we would like to thank the individual
members of the FlexRay Protocol Conformance Test Working Group
for their support throughout the project.
References
[1]
www.flexray.com : FlexRay Consortium
[2]
FlexRay Protocol Specification V3.0, FlexRay Consortium
[3]
FlexRay Protocol Conformance Test Specification V3.0, FlexRay Consortium
[4] www.jaspar.jp/english : Japan Automotive Software Platform
and Architecture
[5] www.ovmworld.org : Open Verification Methodology
59
Making OVM Easier for HDL Users
by John Aynsley, CTO, Doulos
INTRODUCTION
There is currently much discussion concerning the use of
constrained random verification techniques with the SystemVerilog
language and the OVM and UVM methodologies. The debate is
largely the province of experts, of verification professionals who eat,
sleep and breathe functional verification every day of their lives. This
particular article has been written with a different kind of engineer in
mind. Do you use Verilog or VHDL for ASIC or FPGA design, writing
RTL code and block-level test benches? Are you still playing catch-up
with the latest functional verification techniques? Then this article is for
you.
VHDL and Verilog can take you just so far with functional
verification. Though you may have your particular favorite, these
languages have both proven to be effective for RTL hardware design
and for creating monolithic behavioral test benches, but run out-ofsteam when it comes to test bench re-use. Sure, you can do anything
in VHDL or Verilog if you try hard enough, but the key benefit of
moving to a specialized verification language like SystemVerilog is
that it allows you to efficiently re-use existing verification intellectual
property (VIP) and to create your own verification components for reuse on other projects. VHDL and Verilog are excellent for RTL re-use
but are not the best choice for verification re-use.
OVM OR UVM?
By the way, for OVM you can read UVM throughout. Early releases
of UVM, the Unified Verification Methodology from Accellera,
are based on OVM version 2.1.1, so guidelines for OVM will be
equally applicable to UVM. At Doulos we welcome UVM as the
first SystemVerilog verification methodology that is being actively
supported by all simulation vendors.
TEST BENCH REUSE
So what is the best way to structure a test bench to allow a high
level of component re-use? There are several aspects to this, but
the most important include having a standardized way of coding
verification components, having transaction-level communication
between verification components, and the ability to override the
behavior of verification components without touching their source
60
code. And how is this enabled? Using object-oriented (or aspectoriented) programming techniques coupled with specialized language
constructs, such as those found in SystemVerilog, which enable you
to express verification-oriented behaviors such as checking, coverage
collection, and the generation of layered sequential stimuli. Objectoriented programming is key because it enables well-structured
communication using function calls and allows verification components
to be specialized to the needs of a specific test bench or test without
modifying their source code.
As a language, SystemVerilog provides the mechanisms you need
to create verification components for checking, coverage collection,
and stimulus generation, and to modify the behavior of those
components as you write specific tests. But SystemVerilog provides
more than this, so much more in fact that the learning curve can be
daunting for non-specialists. If you are not a verification specialist,
what you might need is just enough SystemVerilog to get you going
so you can start to benefit from VIP re-use and as a base on which
to build as your experience and confidence increase. The aim of this
article is to introduce you to some coding guidelines for OVM that will
enable you to do just that.
Easier OVM is not a distinct functional verification methodology, but
rather a set of guidelines that enable you to use a simple, clean subset
of OVM features to best effect. You still have access to the entire OVM
library to use as you chose and for compatibility with any external IP.
OVM’S UNIQUE SELLING POINTS
What specifically does OVM (or UVM) offer that cannot be achieved
equally well in Verilog or VHDL?
Well, let’s start by laying out the similarities, because many of the
concepts of OVM will be immediately familiar to HDL users. OVM,
Verilog and VHDL each allow a test bench to be partitioned into
hierarchically organized components (Verilog modules or VHDL
design entities); each provides structural connections between those
components so they can communicate (Verilog or VHDL ports);
and each provides a mechanism so that those components can be
parameterized from the outside (Verilog parameters or VHDL generics
and configurations). OVM, Verilog and VHDL each support procedural
code, concurrency, and event-driven timing and synchronization
mechanisms.
But there are some critical differences. The first difference lies in the
mechanism used to communicate between verification components.
OVM supports transaction-level communication using well-structured
mechanisms derived from the SystemC TLM standard and enabled by
the object-oriented programming (OOP) constructs of SystemVerilog.
Neither Verilog nor VHDL are able to support TLM communication
in the same way because they lack the necessary OOP language
features. Thus although you can contrive ways to pass transactions
between components in Verilog and in VHDL, the resulting code is not
reusable in the same way.
The second advantage of OVM over an HDL is that SystemVerilog
offers language constructs to express temporal assertions, functional
coverage collection, and stimulus constraints. The presence of
functional coverage constructs in SystemVerilog makes coding much
more productive, and the constraint solver engine provides facilities
for constrained random verification that are simply absent from Verilog
and VHDL simulators.
Thirdly, OVM offers mechanisms for the customization of verification
components in unanticipated ways. These include the OVM factory,
configurations, and callbacks, mechanisms that allow structure,
behavior, transactions, and stimulus constraints to be modified after
instantiation in ways that go far beyond the parameterization features
provided by Verilog and VHDL.
Finally, OVM offers a standard set of conventions used when
organizing and structuring a test bench that ensure consistency and
interoperability across projects, teams, and vendors. These includes a
standard way of structuring the verification components that comprise
the test bench, a standard way of structuring the flow of control
through the various phases of initialization, simulation, and clean-up,
and a standard way of constructing hierarchical sequential stimulus
(sequences) that enables stimulus reuse.
(A sequence is a conventional way of building an object (requiring
OOP) that corresponds to an ordered set of transactions. There is no
way to code a sequence in Verilog or VHDL in a way that maintains
the proper separation of concerns and hence achieves the required
degree of verification reuse.)
The above points about OVM combine to enable some critical
differences in the verification reuse capabilities of OVM versus Verilog
or VHDL. OVM allows the separation of individual test cases from
the test bench, and enables VIP to be reused and customized to the
needs of each verification environment and each test case without
modification to the source code.
CODING GUIDELINES FOR EASIER OVM
The coding guidelines below are not intended to be restrictive or
draconian. There are several guidelines below that verification experts
may take exception to, and rightly so; these are not guidelines for
expert constrained random verification. If your own favorite OVM
feature happens to be excluded from these guidelines, there is nothing
to stop you from using it anyway! The idea is to provide one simple
way of doing things that can help you make the transition from HDL
designer to SystemVerilog coder and verification engineer.
Naming conventions
Naming conventions are a soft guideline, but it is a good idea to
adopt a consistent practice. The suggestion is to use lower case letters
with words separated by _, as used by the OVM library itself. Handles
should have the suffix _h, types _t, interfaces _if, virtual interfaces _vi,
ports _port and analysis ports _aport. Macros and constants can be
upper case.
One declaration or statement per line
Declare each name on a separate line, keep to one statement per
line, and use consistent indentation. Always use begin…end where
appropriate, even around single statements.
Component class template
Where you would use a module in Verilog or a design entity in
VHDL, the OVM equivalent is a user-defined class that extends
ovm_component. Whereas an HDL module contains declarations that
take effect at elaboration-time and statements that execute at runtime, an OVM component contains multiple methods that are called at
the various phases of the verification run. It is this use of classes and
object-oriented programming (OOP) that opens the door to verification
component reuse:
class my_component extends ovm_component;
`ovm_component_utils(my_component)
ovm_analysis_port #(my_transaction) aport;
virtual dut_if dut_vi;
// other ports, exports, and virtual interfaces, i.e. external connections
function new(string name, ovm_component parent);
super.new(name, parent);
endfunction: new
61
function void build;
super.build();
…
function void connect;
…
function void start_of_simulation;
…
task run;
…
function void check;
…
function void report;
…
endclass: my_component
Post a virtual interface wrapper into the
configuration table
The class-based OVM test bench should communicate with the
DUT through a virtual interface that references a SystemVerilog
interface instantiated at the top level. This virtual interface should be
made visible within the OVM test bench by putting it within a wrapper
object and posting that object into the configuration table using set_
config_object().
Use the factory method
Make uniform use of the factory method name::type_id::create()
whenever instantiating a component, a transaction, or a sequence.
This provides a consistent coding style for all instantiations and allows
the instantiation to be overridden later using the factory mechanism,
whether or not you anticipate that happening.
String name should match class member name
The parts of the component shown above in bold text should appear
exactly as shown and in the order shown. The constructor new should
typically not have any additional arguments or statements. The build,
connect, start_of_simulation, run, check and report methods are
optional. Other class members may be included as needed.
Methodology components
The various OVM methodology components ovm_test,
ovm_env, ovm_agent, ovm_sequencer, ovm_driver, ovm_monitor,
ovm_subscriber and so forth should be used in preference to the
undifferentiated base class ovm_component. The OVM agent structure
incorporating sequencer, driver and monitor should be used wherever
appropriate. This helps ensure consistency and interoperability
between verification environments.
Simple component hierarchy
The run_test() method should be called from a top-level
SystemVerilog module. Each individual test should extend ovm_test
and should instantiate a component that extends ovm_env and that
represents the verification environment. Then everyone knows what to
expect.
Clock and reset logic
The clock and reset generation logic should be contained within the
same top-level module that instantiates the DUT and calls run_test(),
not within the class-based test bench. This makes synchronization
between the clock, the RTL code, and the verification environment
straightforward to achieve without getting into the idiosyncrasies of the
SystemVerilog scheduler regions.
62
When naming components, transactions and sequences, the string
name should match the SystemVerilog class member name. For
example
my_env_h = my_env::type_id::create(“my_env_h”, this);
Note that the arguments passed when creating a component are
always string name followed by this.
Use only port-export connections between
components
Apart from the virtual interface connection to the DUT described
above, all structural connections between verification components
should take the form of TLM port-export connections, including
analysis ports. This provides for a very simple uniform connection
mechanism between OVM components. For example:
function void connect;
my_driver_h.seq_item_port.connect( my_sequencer_h.seq_item_export );
my_monitor_h.aport.connect( aport );
endfunction: connect
In particular, do not instantiate FIFOs to connect components; where
FIFOs are needed, bury them inside components behind TLM exports.
Restrict hierarchical names
The use of hierarchical names should be restricted to picking
out the port and export objects when making TLM connections, as
shown above. Avoid arbitrary hierarchical references between OVM
components just as you would generally try to avoid hierarchical
references between Verilog modules.
Transaction class template
As well as components, an OVM test bench also contains classes
that represent transactions and sequences. These should extend
ovm_sequence_item and ovm_sequence respectively. In OVM, a
transaction or a sequence is an object that contains methods (that
is, behaviors) as well as properties (that is, data). This allows new
types of transaction or sequence to be created by extending existing
transactions, something that is only possible in object-oriented
programming languages:
class my_transaction extends ovm_sequence_item;
`ovm_object_utils(my_transaction)
The sequence item methods convert2string(), do_copy(), and
do_compare() should be implemented wherever they are needed.
This approach avoids the use of the ovm_field_* macros, which are
fine in the hands of experts but can obscure the learning process for
beginners.
(Note for the experts: I am not religious about macros! There are
many good ways of using SystemVerilog for verification, and macros
can be cool! But I would always advocate beginners taking a simple,
uniform approach to coding as they climb what can be a long, steep
learning curve.)
Sequence class template
User-defined sequences should follow a similar pattern but should
include a body method:
class my_sequence extends ovm_sequence #(my_transaction);
`ovm_object_utils(my_sequence)
// Data members, constraints and covergroups
rand int n;
// Data members, constraints and covergroups
constraint …
rand int data;
covergroup …
constraint …
covergroup …
function new (string name = “”);
super.new(name);
function new (string name = “”);
endfunction: new
super.new(name);
endfunction: new
task body;
…
function string convert2string;
…
function void do_copy(ovm_object rhs);
...
function bit do_compare(ovm_object rhs, ovm_comparer comparer);
..
tx = my_transaction::type_id::create(“tx”);
start_item(tx);
assert( tx.randomize() with …
finish_item(tx);
…
endclass: my_sequence
endclass: my_transaction
63
Within the body method, individual sequence items should be
generated and sent to the driver by calling create(), start_item(),
finish_item(), get_response(), grab(), and so forth. Once these
methods have been understood and mastered, it is also possible to
use the OVM sequence macros such as `ovm_do to abbreviate the
code.
Start sequences explicitly
Sequences should be started on sequencers explicitly by calling
their start() method. This means not using ovm_sequence_utils to
register a sequence with a sequencer and have it start automatically.
Use sequence libraries
A good way to organize sequences is to store them in a sequence
library (a separate SystemVerilog package) and then start them as
required for each individual test. Sequences can also start other
sequences.
Use set_config_object and get_config_object
Use OVM configuration rather than class parameters or constructor
arguments to parameterize components. Group multiple configuration
values into objects that can be set using set_config_object. Retrieve
configuration values explicitly by calling get_config_object, typically
from the build() method.
CONCLUSION
OVM (or UVM) is a rich and capable class library that has evolved
over several years from much experience with real verification
projects large and small, and SystemVerilog itself is a large and
complex language. As a result, although OVM offers a lot of powerful
features for verification experts, it can present a daunting challenge
to Verilog and VHDL designers who want to start benefitting from test
bench reuse. The guidelines presented in this article aim to ease the
transition from HDL to OVM.
These guidelines are further explained and illustrated in the Mentor
Graphics Verification Academy module entitled OVM Basics, available
from www.verificationacademy.org. You can also download tutorial
information on OVM from http://www.doulos.com/knowhow
64
Accelerating Software Debug Using ARM’s VSTREAM
with Veloce™ Hardware Emulation
by Javier Orensanz, ARM and Richard Pugh, Mentor Graphics
Hardware emulators, like Mentor Graphics’
Veloce, are widely used to debug SoCs that
include one or more processors. Although
hardware designers are the traditional target for
emulators, software developers are increasingly
using hardware emulation for early firmware,
kernel and driver development. The traditional
connection of a software debugger to an emulator
is done with a debug probe connected to the
JTAG port of the design, but this solution is slow
because of the serial nature of the JTAG protocol.
This article explores the use of ARM’s VSTREAM
co-emulation transactor connected to a Veloce hardware emulator, to
accelerate the connection from the debugger to the hardware target.
Efficiency in SoC design
Time-to-market and cost control are critical factors when planning
the design of a SoC while design complexity continues to increase
exponentially. Many new devices include one or more embedded
processors, memory controllers and an array of complex peripherals.
The SoC design flow, shown in figure 1, has adapted to this
challenge by parallelizing hardware and software design activities so
that boot code, operating system support packages and applications
are available by the time the device tapes out. In many designs,
functional validation and software availability are on the critical path to
release the SoC and there is a need to start software development as
early as possible and on increasingly fast platforms.
Hardware emulation can greatly accelerate system integration and
hardware validation activities by running test vectors several orders
of magnitude faster than RTL simulators. Emulation has therefore
become widely used by hardware development and validation teams.
Figure 2: Veloce hardware emulator
and its debug application environment
Emulators are often the first platforms to implement a functionally
accurate representation of a SoC running at reasonable speed.
Therefore, software development teams have become interested in
them to run their SoC bring-up firmware, operating system boot code,
kernel and drivers. Not only does emulation enable them to perform
this critical activity earlier in the design cycle, but they also provide the
SoC verification engineer the visibility to resolve software/hardware
integration issues. Figure 2 shows the typical debug environment
using Veloce emulation.
Software development
on hardware emulators
To enable software developers to be more efficient in their code
development, they require tools that provide full processor control
and debug visibility. This includes tool features such as the ability to
set breakpoints, single step through the code, view and change the
contents of memory and memory-mapped peripherals,
and so on.
Figure 1: A simplified view
of the SoC design cycle
65
Complex processor features such as virtual-to-memory
address mapping and hardware cross-triggering must be
handled by the tools automatically to save development time.
Most embedded processors include interfaces to allow the
connection to a software debugger. These interfaces are normally
accessible on the JTAG or serial debug port of the SoC.
The connection between the software debugger and the SoC
is done with a debug probe - for example, the ARM® RealView®
Debugger connects to the JTAG port of ARM processor-based
SoCs with a RealView ICE unit, as shown in figure 3.
Figure 4: Debug connection to ARM9 and ARM11 family processors
For example, the debugger connection to ARM9™ and ARM11™
family processors is comparatively slow. These processors have native
JTAG debug interfaces that can be daisychained.
Because of the nature of the JTAG
protocol, the JTAG clock (TCK) is driven by
the debug probe. In order to synchronize
TCK with the processor clock TCK needs to
be sampled with a chain of flip-flops, which
effectively limits its speed to about 100 KHz
on emulators.
However, the debugger connection
to Cortex TM processors on hardware
emulators is faster, as a parallel debug
interface may be used rather than a serial
JTAG connection. The SoC normally
includes a CoreSight TM Debug Access
Port (DAP) which provides an interface
between JTAG and the internal debug bus.
Figure 3: ARM software development tools
The same debug probe used to connect to a SoC can also connect
to a processor synthesized on a Veloce hardware emulator via the
emulator’s In-Circuit Emulation (ICE) interface.
Unfortunately, this JTAG debug interface is relatively slow and
debug operations such as memory download and single stepping can
take several seconds to complete. This limitation hinders the usability
of emulators as software development platforms.
Accelerating software development
on hardware emulators
Depending on the processor synthesized on the emulator, different
debug speeds can be achieved.
66
In the DAP, the synchronization between TCK and the system
clock is only required when a 32-bit access goes to the debug bus. In
practice this means that in emulation the JTAG interface can run at
up to 500 KHz, a five-fold increase compared to ARM9 and ARM11
processor family-based systems.
As hardware emulation speeds are typically in the 1-2 MHz range,
the TCK frequency cannot be increased significantly to enable
more throughput to the software debugger. However, a faster debug
connection may be achieved by bypassing the JTAG interface
and implementing a direct connection to the debug bus. A direct
connection can provide a significant speed increase, as each 32-bit
access on the debug bus is done in a single bus clock cycle instead of
several JTAG clock cycles. The speed of the processor, memories and
peripherals running on the emulator remains the same.
Figure 5: Debug connection to Cortex processors
ARM and Mentor have collaborated to prove the concept
and speed of debug transactors, such as VSTREAM, by
connecting the ARM RealView Debugger to a Mentor
Graphics Veloce hardware emulator via a SCE-MI v2.0
interface. ARM aims to release VSTREAM by mid-2010.
VSTREAM Performance with Veloce
Figure 6: Virtual debug connection, using ARM’s VSTREAM
Implementing a debug transactor VSTREAM
Transaction-based acceleration, as supported by Veloce with its
TestBench XPress technology, TBX, provides a very high bandwidth
connection between a C/C++, SystemC, or SystemVerilog application
running on a workstation, and the RTL running on Veloce. A debug
transactor, like ARM’s VSTREAM, can make use of the infrastructure
provided by Veloce-TBX to connect a software debugger directly to the
DAP RTL. There are two benefits to the use of a debug transactor:
1.Transactors eliminate the need to use the I/O expansion on the
emulator to connect the JTAG signals to the debug probe. With
no dependence on external hardware the job can be run on any
emulation resource, maximizing machine utilization and availability.
A virtual connection to the emulator is also more convenient than a
physical one, as different jobs can be run on the emulator without
concern for the hardware set-up.
2.Transactors can be reused to connect a software debugger to RTL
simulators, such as Questa, which enables very early functional
validation of the debug infrastructure of a SoC.
By eliminating the hardware probe and replacing the
serial JTAG debug port with the 32-bit Debug Access Port
(DAP), interactive SW debug is, well, highly interactive.
Stepping through source or assembly is snappy and
transferring a 1 MByte file between the workstation and
the ARM core’s memory space modelled in Veloce drops
from 30 seconds with JTAG to 5 seconds with VSTREAM. And
these performance improvements are even more impressive when
debugging software on multi-core designs.
We’ve all come to expect technical advances to be accompanied
by minor drawbacks and limitations, but with Veloce and VSTREAM
everything falls on the plus side.
- The debug probe is eliminated, reducing cost and eliminating
the reliability issues associated with the hardware, cables, and
connectors.
- Debug interactivity is greatly improved, especially loading code
and memory transfers.
- Flexibility to run the job on any Veloce user partition of suitable
size is achieved through elimination of debug probe hardware
dependencies.
The VSTREAM collaboration between ARM and Mentor Graphics
delivers measurable improvement in software debug productivity. With
the advent of multi-core processors and more complex embedded
software, these improvements will transition quickly from nice-to-have
to becoming mandatory for the comprehensive validation of complex
SoC designs.
Figure 7: Complete debug solution
based on VSTREAM transactors
67
Editor: Tom Fitzpatrick
Program Manager: Rebecca Granquist
Wilsonville Worldwide Headquarters
8005 SW Boeckman Rd.
Wilsonville, OR 97070-7777
Phone: 503-685-7000
To subscribe visit:
www.mentor.com/horizons
To view our blog visit:
VERIFICATIONHORIZONSBLOG.COM
68