1
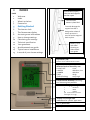
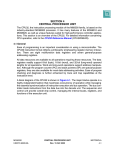
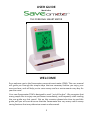
USER GUIDE Model 2652 THE PERSONAL SMART METER WELCOME Eco1 welcome you to the Saveometer personal smart meter (PSM). This user manual will guide you through the simple steps that are necessary before you enjoy your new purchase, and will help you to save money and our environment every day for years to come. Your new Saveometer PSM is designed to work “out of the box”. We recognise that many people like to enjoy new purchases immediately, and frequently start reading the user guide as a last resort! But on this occasion please take time to read this guide, and you will soon discover that the Saveometer has very many useful money saving features that may otherwise remain undiscovered. 1 2 INDEX Saveometer display – side view and support bracket open PAGE 1 2 3 4 Welcome Index What’s in the box Feature list 5 Getting Started 6 7 8 9 10 11 12 13 14 15 The Atomic clock The Saveometer display Accessing more information How to change settings Calculating your settings Technical specification Your guarantee An abbreviated user guide Typical sensor installations A record of your chosen settings Technical and statutory data label To avoid damage the support bracket is designed to release if excess pressure is used. It can be snapped back in place. Battery cover with label showing an abbreviated user guide Top Button (TB) Used to access additional information COLOURED LED’s indicate five different levels of electricity cost 1 LIGHT OFF = Low 2 GREEN = Medium / low 3 AMBER = Medium 4 RED = High 5 RED (Flashing) = Very high Temperature & humidity (alternating) Icon indicating likely weather Used when changing settings > = Forward < = Back S = Select (S is also used to turn the back lights on or off) Display and charger base Indentation for “post it” type notes Pen or pencil rest Mains power red indicator LED 2 1 2 3 THE DISPLAY IN DETAIL 5 8 7 6 9 10 4 5 11 4 6 7 8 9 10 11 12 13 14 15 12 ₁ 3 13 14 ₂ 1 15 16 This area is used to display useful information. This includes a 30 day dynamic bar chart (or graph) of your electricity use (the most recent day enters from the right hand side), prompts when varying settings, & messages. 16 3 Electricity Sensor clip 1 Currency Numerical amounts Gas icon (if applicable) (Gas data is shown on the display in lower case and electricity is in UPPER CASE) Weather symbols - (allow 3 days after connection for symbols to gain accuracy) Hour Minute Atomic clock signal icon Day Month Year Temperature & humidity C or F (temperature) Battery low (D =display) Battery low (T= transmitter) Pence or Cents WHAT’S IN THE BOX (Sorry – pen is not included!) 1 Transmitter 2 3 Battery access at rear Sorry pen not included! Three sockets to connect sensor clip jacks are underneath. Up to 3 jacks may be connected at a time Six rechargeable batteries (Use only the supplied batteries or warranty may not apply) 4 5 5 4 Power supply which connects to the display charging base Display charging base 3 1 2 3 4 5 + + Sensor clip with wire & jack Transmitter Saveometer display Power supply & 6 batteries Display charging base Warranty registration card “Post it” type pad All references to gas are printed in green. Your Saveometer display will not require any alterations and is ready for gas. All you require is a gas transmitter- see enclosed details 4 FEATURE SUMMARY Back lights permanently lit when on charger base - use S button to turn on / off Unique and informative display cycle showing real time electricity cost / hour for 45 seconds, followed for 5 seconds each by the electricity cost that week, cost that month, then the cost of gas that month (if applicable) Atomic radio controlled clock & calendar – this feature functions throughout the UK, Europe, USA, Canada, Japan & much of the Middle East Four different indications (LED’s) show 5 current cost levels of your electricity use. Each level can be varied to your choice. Levels are – very low (off), green (low), amber (medium), red (high), & blinking red (very high). The LED’s and the display back lights are operative at all times when placed on the display charging base, and remain illuminated for 5 -6 minutes when off the base. Use S to turn backlights on/off. Choice of currencies displayed - £, $, € or ¥ Stored data is retained for over 15 years – even when batteries have been removed Cost of electricity may be shown – per hour, week, month, year, previous year – or any other period of time you chose A 30 day dynamic bar chart shows your day to day electricity costs – making it easy to see your cost trends at a glance Greenhouse gasses (CO2) resulting from your electricity consumption may be displayed – the Saveometer encourages thinking green - as well as saving money Battery low indicators for transmitter (T) & display (D) show when batteries are low Very low energy Eco friendly “ switching” power supply The Saveometer PSM current sensor clip is efficient from half an amp up to 100 amps Two or three phase electricity supplies may be monitored. (Each phase requires an additional sensor clip) Some electricity suppliers offer better rates at certain times of the day – the Saveometer can be programmed with up to 4 different charging rates per day Temperature expressed in Centigrade, also % relative humidity (RH). Automatic compensation for any difference in temperatures created when the display rests on the charging base and back lights are on – this takes 20- 30 minutes to adjust. Long life rechargeable batteries Display holder and charging base Model 2652 Electronic barometer – indicating the likely local weather for the following 12/24 hours (The display must be located in normal outside humidity to retain accuracy such as near a window that is frequently opened each day) The display back light remains permanently illuminated when on the display base. Back lights can be turned on/off at any time by briefly pressing S NEW - Gas cost monitoring (a gas transmitter is required) The unique Saveometer UK Guarantee – if you do not save at least the cost of your new Saveometer PSM within one year of constant use following installation, and decide to return it to us, Eco1 Limited will refund the full price that you paid * (Conditions apply – see page 17) 4 GETTING STARTED The rechargeable batteries will probably work out-of-the box, but we strongly advise you to fully charge the transmitter batteries as soon as possible. This will enable you to obtain the best life & durability from your rechargeable batteries. To charge the batteries, connect the power adapter to the charging base. Insert batteries & place your transmitter on the charging base and leave for 10 hours, then replace the transmitter with the Saveometer display for a similar period. When batteries need recharging battery icons will show on the display - T indicating the transmitter and D the display. 1 Insert 3 batteries in the transmitter and 3 into the display, checking that they are installed the correct way round. Placing the display on a (connected) charging base will illuminate the back light & permanently enable the weather forecast & temperature & humidity features. The Saveometer will usually function “out-of-the-box”, even if the rechargeable batteries are not fully charged. When the batteries are installed the display will initially show a default date, a 28 day (simulated) bar chart, and “NO DATA”, indicating that data is not being received from your electricity meter. If the display fails to show anything, please check the batteries are correctly installed and/or recharge them immediately (as described above) before going any further. 2 Set the time & date. To set the clock and date press the Top Button (TB) for 5 seconds until the display bar chart area shows “Time+Date”, then using the lower key press S (to select). Using the lower keys again press < or > to set the hour, and when correct press S to select. Then the minutes will blink; use the < & > keys to adjust and when correct press S to select. Use the same procedure until the time and date are correctly set and the display will show “DONE”. The default display sequence will recommence, and the factory set 28 day bar chart will show. 3 Attach the transmitter sensor clip to the live (often called the positive) wire that leaves your electricity meter (sometimes marked L). Electricity meters are installed in numerous ways and many locations – under the stairs, boiler room, a dedicated cupboard and so on. Below shows how a clip is typically atached: 5 If you have any difficulty in recognising where to fit the sensor, or the cables at the meter are confusing or loose, then immediately consult a qualified electrician before going any further If you require more guidance and examples of typical installations please visit www.saveometer.com/installation. If your electricity meter is located in a distant external meter box or a basement, or you have a large house or commercial premises, you may wish to consider employing a qualified electrician to attach the sensor clip and to lead the sensor wire from the meter cupboard through any intervening wall to the transmitter. In this way the optimum range can be achieved within a building between a transmitter and the wireless display. 4 Plug the sensor jack into one of the 3 connecting sockets located on the underside of the transmitter. (There are 2 extra sockets on the underside of the transmitter – used for multi phase installations, each requiring the removal of a small cap). The transmitter may be mounted using the self adhesive Velcro pad provided. The transmitter must be kept completely dry at all times. 5 When the sensor clip has been correctly connected to the transmitter, the display will stop showing “NO DATA” and show a default 28 day bar chart, and also how much per hour you are currently spending on electricity. If “NO DATA” continues to show, check the sensor clip jack is properly inserted. If “NO DATA” still continues to show, it may be necessary to re-establish the wireless link between your display & the transmitter – please refer to mode 14 “Linking a display to an existing electricity transmitter” on page 13. Up to 25 additional displays may be linked to a single transmitter! This display is showing a cost of 12.5 pence per hour. The default bar chart which you see on first installing is 28 days. During the next 30 days this will gradually be replaced day-by-day (from the right) to show your own daily use pattern Red LED illuminates when the display is on a charger base which is connected to mains power Until data is received from a transmitter this message will show in the lower display (bar chart) area The display now shows the cost of the electricity you are using per hour. Every 45 seconds the cost of electricity you have used in the CURRENT WEEK, followed by the cost for the 6 CURRENT MONTH (then the cost of gas) will each show for 5 seconds. Because you have only just connected your new Saveometer these readings will be zero, and will progressively increase to show you clearly how much you are spending on your electricity. The Saveometer week runs from 00.00 am on Sunday to midnight on the following Saturday, months are calendar months, and quarters (shown as ¼ on the display) are calendar quarters. 6 Now that your Saveometer is up and running you can discover some of the many other features that are at your finger tips – all designed to help you to save money, save energy and minimise CO2 emissions. You may like to spend a few minutes taking the display around your premises and switch on various electrical appliances. You will probably find the cost of using the oven, electric kettle and similar appliances quite a surprise! As you walk around the house or commercial premises switching electrical equipment on and off, the Saveometer will show you every 6 seconds the precise hourly cost of electricity you are using. And please remember that for electricity …... Every constant one penny (1 p) per hour is costing more than £85 a year! 6 THE ATOMIC CLOCK Your Saveometer detects “atomic clock” radio signals that accurately reset and continuously monitor the clock and calendar from transmitters located worldwide. These signals are always strongest at night and they enable clocks to achieve an accuracy of better than 1 second in 1000 years! Thick brick or concrete walls, basements and close proximity to other electronic apparatus, especially power supplies, may inhibit receiving atomic clock radio signals. To optimise atomic clock radio signals it is best to extend the power cord a minimum distance of 60 cms from power supply to the Saveometer display charger base. Minimum distance - 60 cms (20”) to optimise reception of atomic clock radio signals. For optimum signal strength remove display from charger base and stand over night near a window Any power supply, transformer, or similar electrical apparatus including florescent lighting, & long life bulbs Every night, between 1am – 4am, your Saveometer seeks a radio signal and will automatically adjust itself for summer/winter time changes, as well as providing extreme accuracy. While a signal is being received the radio icon will blink, & once received the icon will remain static. The icon will disappear if a signal fails to be detected for more than 3 consecutive days. These highly accurate radio signals are free, and available throughout the UK, most of Ireland & Europe, the USA & Canada, much of the Middle East & Japan. To minimise interference with the radio signals we recommend that your Saveometer display and charging base are located at least 60 cms (about 20 inches) from any other electrical apparatus or power supplies 7 7 THE SAVEOMETER DISPLAY The Saveometer shows the cost per hour of the electricity you are using at any particular time. Every 45 seconds the display will show, for 5 seconds each, your electricity costs so far in the current week, and then the costs so far in the current month, followed (when a gas transmitter is fitted) by your gas costs in the current month. Gas costs are always expressed using lower case alpha characters and the gas icon is shown. Showing gas cost & icon At the bottom of the display is normally a bar graph showing the trend of your electricity costs over the most recent 30 day period. Initially a default 28 day bar graph is shown, leaving 2 “blank days” on the right to differentiate between the default trend and your actual readings as they occur each day. It will take a month before your own 30 day use pattern becomes clear. A trend will start to show after only a few days, with the recent past day’s cost trend always showing on the right hand side of the display. The bar chart below shows a 30 day example of a user’s (rather erratic!) electricity consumption When first connected the bar chart shows a default 28 days. As your own new information becomes available each day a new bar will appear on the right hand side, leaving a 2 day space between default and new data. It will be 30 days before the bar chart shows only your data. The bar chart resets whenever a new date is manually set using function 1 The battery low icons only appear when either the electricity transmitter batteries (icon followed by T) or the display batteries (icon followed by D) need recharging. For the electricity transmitter simply swap over the batteries from a fully charged Saveometer display with the electricity transmitter batteries, and then leave the display on the charger base over night.In this way no data is lost. If the gas transmitter batteries require replacing (every 12 years) the display will show “GAS BATT” in the bar chart area. 8 8 ACCESSING EVEN MORE INFORMATION By pressing the Top Button (TB) briefly the Saveometer will instantly show you even more information. Each short consecutive press of the button shows the following: Press What you see Description The back light remains illuminated whenever the display is placed on a charging base. When turned on the back light illuminates the display & also the cost threshold LED’s. To conserve battery life, when removed from a charging base the backlights remain illuminated for 5 minutes and may be turned on or off at any time by briefly pressing the key marked S This is the total cost of electricity used since you last reset the Saveometer (see mode 6 later in this guide) A gas transmitter will be required to be purchased. This mode shows the total cost of gas since you last reset the Saveometer A symbol denoting gas is also shown 1 Backlight turns on. If already illuminated move to 2 below… 2 TOTAL ELEC 3 Total Gas 4 LAST WEEK 5 LAST MONTH The cost of electricity used in the previous week, ending on Saturday at 12.00 pm Cost of electricity used in previous calendar month 6 LAST 1/4 Cost of electricity used in previous calendar quarter 7 LAST YEAR The cost of electricity used in the previous year 8 kWh THIS MONTH 9 kWh THIS YEAR 10 CO2 THIS MONTH 11 CO2 THIS YEAR 12 DONE How many kWh (Kilowatt hours or “units”) of electricity used in the current month How many kWh (or electricity “units”) you have used so far in the current year How much (in Kilograms) CO2 created to produce the electricity used in the current calendar month How much (in Kilograms) CO2 has been created to produce the electricity you have used in the current calendar year Saveometer reverts to normal default display cycle 9 9 HOW TO CHANGE SETTINGS Getting the best from the Saveometer PSM You can personalise your Saveometer and make it even more accurate for your particular home, office or commercial premises. During manufacture the variable choices are set to default values, all of which can be varied and tailor made to your own personal choice. It is quick to carry out, each setting using the same procedure. Starting on page 11 is a description of the settings that may be varied, together with the default values that have been set during manufacture. Each is changed using a separate mode, and to change any setting the procedure is identical. How to change settings 1 2 Press the top button for 5 seconds until display shows “TIME+DATE”, release button and mode “01” will blink where the temperature is normally seen Use the < and > keys to select the mode you require Forward Back Select. (Also used to turn back light on/off) 3 Press S to select the mode 4 Use the < and > keys to vary the values as you wish 5 Press S to finish, when the display shows “DONE” and reverts to the normal default electricity cost / hour The same procedure is used to change any mode or setting. If at any time you wish to stop setting a mode, press the top button and you will immediately return to the default display and your actions within the mode will be ignored. 10 In modes 6, 7 & 18 there is an extra safety step to avoid accidentally erasing important data Changing your Settings Mode Some modes, such as manually setting clock and date or setting variable charging rates for electricity, require several steps. Time & date. To set the clock manually press the Top Button (TB) 1 for 5 seconds until the display shows “Time+Date”, then press S (to select). Using the lower keys press < or > to set the hour & press S to select. Then the minutes will blink, use the < & > keys to adjust & press S to select. Use the same procedure until the time and date are completely set when the display will show “DONE” & the default display sequence will commence. Once they have been set, the time & date are normally adjusted automatically by a radio signal between 1am & 4am every night, when the atomic clock radio signals are strongest, & a permanent icon will show Default setting Time & date default settings vary according to the country supplied Once a correct date has been set, if the date is subsequently incorrectly set to an earlier date the bar graph will reset to the default format of 28 days followed by 2 “blank” days, and all recorded data will be erased. It will then take 30 days for the bar graph to be truly representative, & each new day appears from the right. When resetting the date the display will show “SURE?” in the sequence to warn you the bar graph may be reset to an earlier date. To accept press “S” in the normal way. If reset to a later date the bar chart will reset to default and no other data will be lost. When changing batteries (seldom) the time resets to nearest hour & will reset automatically or can be manually re-set. 2 3 4 12 or 24 hour clock This sets the format of the day & date to your choice. Either day/month/year , month/day/year or year/month/day Rates & times. Electricity charging rates vary between suppliers, and may change at different times of the day. Check recent electricity bill or contact your supplier for the precise times and rates you are being charged and set your Saveometer accordingly. Each day may be split in up to 4 periods, shown as A, B, C & D on the display when in mode 4. For each period you must select a start time & charging rate. If you only pay a single rate for your electricity simply set your rate for period A and then scroll through B, C & D using the S key & the Saveometer will automatically input the same rate to periods B, C & D. If paying 2 or 3 rates per day, set start times & rates for the periods you require & scroll through unwanted zones using the S key. The Saveometer will automatically recognise how many time zones per day you wish to apply. 11 24 hour dd/mm/yy 12.5p all day 5 6 7 Cost alert thresholds. These are a useful reminder Off Less than 4p / hr when you are using excessive electricity. The Green More than 4p/hr coloured LED lights at the top of the display Amber More than 20p/hr indicate the amount of electricity (& therefore Red More than 40p/hr cost) that is being used per hour. The default Red * More than 54p/hr settings, shown alongside, may be varied to suit your own particular use pattern. A large house or *flashing commercial enterprise will probably set considerably higher thresholds for each indication. Zero the TOTAL COST of electricity used. Your TOTAL £000.00 ELECTRICITY COSTS are shown on the second or third depression of the top button (TB). TOTAL COSTS may be reset to zero at any time. For example, some users may wish to monitor costs over 6 month periods, while some commercial activities using more electricity may chose to monitor costs every week or fortnight. Zeroing TOTAL COSTS does not interfere with any other monthly, weekly or other useful information. This feature is to provide you with a total of electricity costs over any period of your choice. To avoid accidental erasure of this important total, you will be prompted by the lower display to hold the > button down for 6 seconds, and then confirm (you see the word “SURE?”) that you really do wish to proceed to zero the total cost by pressing S Erase ALL acquired stored data. This feature is seldom used Not and is primarily for when a Saveometer is reinstalled in a new applicable location, such as when moving home or business. This erases all data that your Saveometer has acquired since it was first installed. This mode will remove all costs (electricity & gas if applicable) and other data that have ever been ever stored. All settings such as charging rates, LED thresholds etc remain unchanged. To avoid accidental erasure, in this mode you will be prompted by the lower display to hold the > button down for 6 seconds, and then confirm (you see the word “SURE?”) that you really do wish to proceed to erase the acquired data by pressing S. When using function 7 you must always re-link the electricity transmitter to your gas transmitter – see gas transmitter installation guide - page 1 8 9 10 11 Messages Some Saveometers have short messages that show briefly from time to time. You may set their frequency to off, level 1 (every 1 hour) or level 2 (every 30 minutes) Set Voltage that is supplied to your premises Off CO2 (carbon dioxide) created by each Kilowatt hour of electricity used. The default setting is a current National UK average, but may vary according to your supplier. Please check with your supplier for an even more accurate figure. Set atomic clock synchronisation. It is unlikely you will ever need to use this feature unless moving to another country. The 0.43 Kg / kWh 12 240 volts UK 12 13 14 15 Saveometer clock receives radio signals to maintain supreme accuracy of the time and date, & is capable of receiving signals from several distant radio beacons. This mode enables a particular beacon to be selected. The signals available are DCF in Germany which covers most of Europe: MSF located in Cumbria which covers all the UK: WWVB in America which covers the USA, Canada and the Middle East & JJY for Japan and parts of China. If there is no signal the radio icon will extinguish, but the clock will still keep excellent time anyway Set time zone. It is also unlikely that you will ever need to use this mode. As mentioned in 11 above the Saveometer receives radio signals from one of several geographically spread transmitters, some of which may give a time that is not in line with the location where the Saveometer is located. When this occurs the time may be “offset” by precisely one or several hours, either forward or backwards. This enables users to make an appropriate correction, in one hour increments or decrements, so that the correct time is always shown. Reset to default values. This mode resets all the variable settings that you have made to the original factory default values – as listed in the right hand column. Linking a display to an existing electricity transmitter. Install fully charged batteries, & set the time/date manually (mode 1). Then select mode 14 and press S & you will see the word “register” on the display. Within 60 seconds press the green button on the transmitter until the red LED starts to blink & release. The red LED will soon stop blinking & the new display will have been linked to the transmitter. In about 10 seconds the display will show your current electricity cost per hour. You may connect up to 25 displays to each transmitter, and they will of course read identically. Currency choice – these are £ $ € and ¥ 0 (Zero) Not applicable Not applicable £ Modes 16 – 21 require a separate gas transmitter. When a gas transmitter is connected the following modes become available, and until that time these modes remain hidden. 16 17 Set gas price (per Kilowatt Hour or kWh). Gas prices vary between suppliers & you may wish to alter the default setting. For the best way to work out your appropriate setting please to refer to page 15. Zero the total cost of gas used. This total may be reset to zero at any time. For example, some users may wish to monitor their gas costs over 6 month periods, while some commercial activities using more gas may chose to monitor costs every day, or week. This feature provides a total of your gas costs over any period of your choice. Zeroing total costs does not interfere with any other stored data. As a safety measure to avoid accidental erasure, you will be prompted by the lower display during this mode to hold the > button down for 6 seconds, & then confirm (see word “SURE?”) you really do wish to proceed to zero the total cost by pressing S 13 3.4p/kWh Not applicable 18 19 Select if your meter measures gas in cubic feet or cubic meters, & if your meter has 4, 5 or 6 meaningful digits. Please inspect your meter then use the > key to select cubic meters or cu feet, also select 5 or 6 digits (ignore the red numbers on the right) - & press S to select. (If your meter is very old it may have only 4 meaningful digits - then select 5 in this mode as the 4 digit option has been discontinued *) In this example the meter has 5 whole digits & measures in Cubic Meters indicated by M3 Indicated “M3” This sets by what is known as a “gas conversion factor”. Once set, it is Cubic Mtrs or Cu ft, also 4, 5 or 6 meaningful digits? 11.27 for doubtful whether you will need to change the value again. The amount Cu Meters of gas used is measured by your gas meter and converted by your or supplier into kilowatt hours for which you are charged. Our setconversion factor depends whether your meter reads in cu ft (31.4) or 31.4 for cu meters (11.27).This factor may vary very slightly from time to time Cu Feet according to the type and quality of gas supplied & several other factors. This mode enables you to synchronise your gas meter with the Cubic 20 Saveometer. Select mode 20 & you will see 5 or 6 main digits (000000). Meters Read your gas meter (ignoring the last 2 or 3 digits on the right – usually 00000 surrounded in red) and using the < & > press and hold until the display matches the reading of your meter. Digits will increment or decrement progressively faster the longer the < & > keys are pressed.Press S to set. This feature enables you to test the wireless range between a gas Not 21 transmitter and a display. Select mode 21 and see “Gas Test”. Press S & applicable “Gas Rx” will show on the display - blinking. Press the transmit button on the gas transmitter for 1 second and if within range the “Gas Rx” on the display will be replaced by the data received from the gas transmitter. If no signal is received only “Gas Rx” will continue to show. To finish press S again to exit this mode. You may find it useful to use a cordless or cellular phone to communicate when using this feature as the gas transmitter and a Saveometer display may be far apart. Gas transmitters are sealed units, and contain a high quality long life lithium battery which in normal use lasts over 12 years. When a battery becomes low a message “BATT LOW” will show on the display several weeks before it expires. Always return your Saveometer gas transmitter to Eco1 for battery replacement. * If your meter is old and has only 4 meaningful digits, selecting 5 digits will not affect the accuracy of you gas readings or costs. 10 CALCULATING YOUR SETTINGS Electricity The rate or rates you are charged for each Kilowatt hour (kWh – and sometimes called a “unit”) of electricity is shown on your electricity bill, but if in doubt please call your supplier. Some suppliers charge variable rates according to levels of consumption, & practically all suppliers make standing charges that vary according to the periods covered, and then add VAT. For users paying a single rate per kWh, & for best accuracy, you take your past four quarterly bills and add up the total charges (including standing charges & VAT and less any discounts for paying by standing order or by direct debit) and divide the total cost by the number of Kilowatt hours (kWh) that have been charged. In this way you will arrive at an average cost per Kilowatt Hour for your particular use pattern and supplier. The default cost per Kilowatt hour is factory set at about 12.75 pence (kWh). Once you have calculated a figure that is appropriate for you it will only take you 30 seconds to adjust your setting using mode 4. 14 For example – Total the electricity costs for your 4 most recent bills Electricity costs (Including VAT & less discounts) total £ 799.00 Total Kilowatt hours charged are 6932 £ 799.00 = 12.5 p (is the average cost per kilowatt hour) 6392 If you pay for electricity at varying rates per day, it is preferable for optimum accuracy, to input the relevant times and rates using mode 4. Gas Gas prices also vary between suppliers & you may wish to alter the default cost setting. The best way to work out your appropriate cost per Kilowatt hour (kWh) is to take your most recent 4 quarterly gas bills and divide your total costs (including VAT or tax, & standing charges – less any discounts for paying by standing order or by direct debit) by the kWh (Kilowatt hours) for which you have been charged. This will give an accurate current overall average cost per kWh for your particular use pattern and supplier. The default cost of gas is factory set at around 3.40 pence per Kilowatt hour For example Gas costs for the past 13 months (Including VAT less discounts) total £ 866.50 Total Kilowatt hours (kWh) charged were 27772 £ 866.50 = 3.12p (average cost per kilowatt hour) 27772 If in doubt about the appropriate rate to set we suggest that you use a rate that is a little higher than your calculations – in that way there will be no unpleasant surprises when your bill eventually arrives! For more advice on setting your electricity and gas rates there is more useful information on the Saveometer web site at www.saveometer.com/faqs Please note that when your energy bills have varying charges for the initial kWh used, the accuracy of the Saveometer will vary seasonally. On an annual basis the cost figures will however remain accurate to within approximately 2 %. The Saveometer Personal Smart Meter is the first step towards a better understanding of your electricity (and gas) use, and realising how easy it is to change wasteful habits, save money, and reduce your carbon footprint too. Instant accurate information about your energy costs will quickly add up to both monetary and environmental savings. Please email your own creative energy saving tips to [email protected] - the best energy saving tips each month will win a free Saveometer PSM display with charger base and power supply OR a new gas transmitter. 15 11 TECHNICAL SPECIFICATION- MODEL S2652 Processors: Memory: Zones: LCD Display: System Configuration: Atomic Clock: Radio Frequency: Transmitter/Display Range Temperature: Weather Forecast Status Current Measurement: Current (RMS) accuracy Energy Consumption alert Servicing Batteries Battery Consumption: Battery Low indication Battery Recharging Power Supply Operational Temperature: Dimensions: (Weights with batteries) Cleaning 8Bit – 16 MIPS RISC Microcontroller Non-volatile EEPROM – data retention more than 20 years Up to 4 different cost rate periods per day High quality FSTN type Up to 50 Display Units can be registered to transmitter Multiple Bands – sync for WWVB, DCF77, MSF and JJY. 868 MHz ISM Band 80 meters – open area; 30 meters – indoors +/- 1 deg C. Humidity: +/-5% Relative Humidity Cloudy, shower/rain, occasional Sunshine, and Sunny 0.3A – 100A (Ampere), cumulative 3-phrase measurement is supported by transmitter. Accuracy depends on the variables you have set. - 0.3A – 1A within 5% 1A – 100A within 3% 5 levels of Ultra-bright LED’s indicate current energy consumption Off, Green, amber, red and flashing red. Do not attempt to service any part yourself. Openining or removing covers may expose you to danger or voltages or other risks and voids all warranties. Refer all servicing only to qualified engineers at Eco1 Limited. Use only supplied NiMH rechargeable batteries (rating1.2V 1000mAh) Warning –incorrect batteries may result in explosion or fire hazard For replacements contact Eco1 Limited or at www.saveometer.com Transmitter Standby: 60uA Operation: 45mA Display Unit Standby: 110uA Operation: 25mA & 1 mA (average) Battery low indication at display for both the transmitter and display Use only the transmitter & display compatible charging base. Remove connecting jack from transmitter before placing in charging base. Eco-friendly (very low power consumption) Switching Mode (SMPS) Use only supplied power supply (model S005CB0720050) with input: 100 – 240V; 50/60Hz; 150 mA; Output 9V DC 500mA 5 deg C – 45 deg C (41 deg F – 113 deg F) at 85% relative humidity Transmitter 70 mm W x 115H x 35 D, weight 150g , Display unit 99W x 157H x 35 D weight 341g, charging base 130W x 47H x 125D mm, weight 154g Only clean the transmitter and display and charger base using a dry cloth. Do not use aerosol or liquid cleaners. Keep display air vents clean & do not block the air vents in any way Conforms to the adjacent rechnical standards Safety: EN61010-1-2001 & EN61010-031-2002 EMC: EN55014-1:2006, EN61000-3-2:2006, EN55014-2:1997 + A1 EN61000-3-3:1995+A1+A2 & AS/NZS CISPR 14.1 2003 Radio: EN300 220-2 V2.1.2 (2007-06), EN300 330-2 V1.3.1 2006-04) EN301 489 -3 V1.4.1 (“002-08) & AS/NZS 4268:2008 Copies of all compliance certificates available on request Warning: Do not use non recharegeable batteries Warning: Adopt safe procedures when working on hazardous live installations, like when fitting or removing a current sensor If the Saveometer or any part thereof is used in a manner not specified herein the protection provided by the Saveometer may be impaired. Final manufacture is by a carefully selected ISO9001:2000 approved factory in the PRC. Components are from the UK, Japan, the USA, Korea and elsewhere. 16 12 YOUR GUARANTEE In addition to the comprehensive 18 month warranty as set out below, and your statutory rights, Eco1 Limited guarantee that you will save at least the Eco1 recommended selling price of your Saveometer (any model) within one year of installation and permanent connection in the UK or you may return it to us (in appropriate protective packaging, fully insured & prepaid postage please). If you return any unit in good condition, together with your original dated receipt or evidence of purchase and the relevant utility bills for the year in question, Eco 1 will refund your purchase price in full providing your Saveometer has remained permanently connected. Any returned products will be thoroughly checked, repackaged and provided free to schools for educational purposes. Register on line using www.saveometer.com/register or by completing and posting the enclosed guarantee card. To enjoy the Eco1 Limited unique guarantee your Saveometer must be registered within 14 days of purchase. 18 MONTH WARRANTY The Saveometer PSM is guaranteed against manufacturing defects for a period of 18 months. This guarantee does not cover any fault caused by misuse of any sort including contravention of the user guide, or when any part of the product has been dropped or modified in any way. Please take care of your Saveometer PSM. Do not attempt to repair or service any part of the Saveometer Personal Smart Meter, in the event of any problems contact us at [email protected] Do not immerse in water, or any other liquids, or locate in a wet or damp environment Clean only with a soft duster or slightly damp cloth – do not use a spray of any sort Do not expose to heat, flames, water vapour, rain, snow steamy conditions or extreme cold Do not hit strike or drop the equipment, or leave in direct sunlight If the display is accidentally broken take care not to touch the liquid crystals that may result. Eco1 Limited will replace or repair any defective Saveometer PSM within the guarantee period free of charge. A defective Saveometer PSM must be returned to us, at your own expense and appropriately insured and packaged, (where possible in original packaging) together with copy of the original dated purchase receipt. Eco1 limited will, at its discretion, repair or replace defective product. *For full guarantee details see www.saveometer.com, or request a printed copy by letter or by telephone. CHANGING THE TRANSMITTER BATTERIES The three rechargeable batteries are interchangeable between a transmitter and the display.To make sure you do not lose any data when the transmitter batteries require recharging we suggest that you exchange the batteries between the display and the transmitter, and then place the display on the charging base. No part or parts of the Saveometer should be disposed in household waste. This equipment should be taken to your local recycling centre for safe treatment. Details of your local recycling centre can be found at www.recycle-more.co.uk or by telephoning your local council. 17 13 ABBREVIATED USER GUIDE Information about gas is printed in green and only applies once a gas transmitter has been installed To programme To show more useful information Each short press of the button will Press top button for 5 seconds until display blinks. Chose mode using < or > & press S. Adjust settings using < or >. Press S again to finish. Modes 1 2 3 4 5 6 7 8 9 10 11 12 13 14 15 16 17 18 19 20 21 show the following: Press Setting Time/date 12/24 hour clock dd/mm/yy choice 1 Display shows Back light turns on, if it is not already illuminated Vary elec. Rates/& times/day Cost alert LED levels Zero total electricity costs Erase all stored data This cannot be reversed! Messages 1 or 2 or off Set voltage Set CO2 rate /kWh Time signal sync Set time zone Use default settings Link a new display Select £ $ € or ¥ Select gas price per kWh Zero total gas costs Set gas Cu Ft or Cu Meters Gas conversion factor Sync with your gas meter Test gas transmit range 2 Total electricity cost since last reset 3 Total gas cost - since last reset* 4 Electricity cost – last week 5 Electricity cost – last month 6 Electricity cost – last quarter 7 Electricity cost – last year 8 kWh used – current month 9 kWh hours used – this year 10 Kilograms CO2 created - current month 11 Kilograms CO2 created - current year 12 See “DONE” & the default display. User Guides are occasionally mislaid or lost. If this happens there are abbreviated instructions also printed on a small label at the back of the display, as well as brief guide printed on the underside of the display charging base. Alternatively, free copies are available from our web site at www.saveometer.com 18 14 A few typical electricity sensor clip installations Sensor clip 15 A record of your chosen settings MODE Description Date of new setting Default Date of new setting Date of new setting Rates & times +/Start time A - & rate Start time B - & rate 12.5p all day n/a n/a Start time C - & rate n/a Start time D - & rate n/a Cost alert LED’s Off Green - Less than 4p/hr Over 4p/hr < > < > < > Yellow – Over 20p/hr > > > Red - Over 30p/hr > > > Flashing Red - Over 40p/hr > > > 6 Zero total electricity cost n/a 7 Erase stored data. n/a 4 5 10 CO2 created +/- 0.43 Kg / kWh 14 Reset to default values n/a 17 Set gas cost per kWh 3.4p kWh +/- 18 Zero total gas cost n/a 19 Set gas conversion factor(s) 0.32 CuFt to kWh 11.27 CuM to kWh 21 Link a gas transmitter 00000 19 - ALSO AVAILABLE Description Saveometer displays These come complete with 3 rechargeable batteries, a charger base and a (switching mode) mains power supply Rechargeable batteries (Packets of 3) Electricity sensor clip with three meter connecting wire and jack NEW Gas sensor & transmitter Details Many customers have several displays in their homes or commercial premises The more people who can see a Saveometer display the more likely you are to reduce electricity use and save money. Additional displays are most effective for increased family awareness (especially among children) of electricity costs and the CO2 that is being created in our environment. Up to 25 displays may be linked to a single transmitter. Rechargeable batteries have a life of between 3 and 6 years.le supplier’s rechargeable batteries please make sure that the output is between 1000 mAH to 1500 mAH maximum. Failure to do so may damage the switch mode power supply. If the Saveometer is installed in a large house or in commercial premises it is likely that the electricity is a “three phase” supply. A separate sensor clip is required for each phase. Three sensor clips may be attached to a single transmitter. Your Saveometer display is all ready for gas. When gas is monitored you will be able to see and effectively gain control of your gas expenditure, in a similar way to electricity. As an existing Saveometer user you are entitled to a discount when you purchase a gas transmitter. Eco1 Limited guarantee that you will save at least the cost of your new gas transmitter, and probably considerably more, in less than 6 winter months or you may return it to us for a full refund! For current prices and to place an order please contact your original supplier or contact www.saveometer.com V84 130211 w 20