1
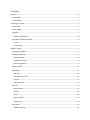
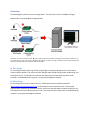
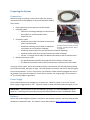
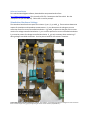
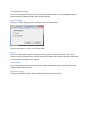
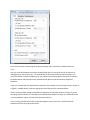
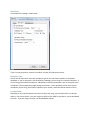
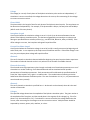
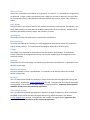
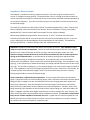
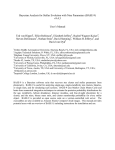
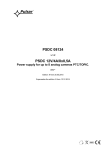
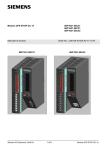
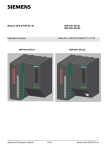
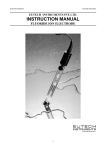
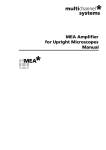
NeuroRighter™ User’s Manual John Rolston [email protected] Created on: Feb. 4, 2009 Last Modified: April 8, 2009 The NeuroRighter system was created by John Rolston ([email protected]) while obtaining his PhD at Emory University and Georgia Tech. It is a fully functional system for acquiring multi-electrode electrophysiological data, and conducting simultaneous microstimulation. The system has both hardware and software components. This document will guide you through using the software and hardware to run experiments. A separate manual is available that covers acquiring the appropriate hardware and assembling the system. Visit this web site for the most up-to-date circuit diagrams, software, and manuals: http://www.johnrolston.com/. Also, review the bibliography section below for a list of papers about the NeuroRighter system, or papers that use the NeuroRighter system. Contents Overview ....................................................................................................................................................... 4 In Vivo Setup ............................................................................................................................................. 4 In Vitro Setup ............................................................................................................................................ 4 Preparing the System .................................................................................................................................... 5 Connections .............................................................................................................................................. 5 Power Supply ............................................................................................................................................ 5 Software .................................................................................................................................................... 5 Software Installation ............................................................................................................................. 6 Stimulation Hardware Settings ................................................................................................................. 6 R_curr .................................................................................................................................................... 7 R_m and R_g ......................................................................................................................................... 7 Software Usage ............................................................................................................................................. 7 Starting NeuroRighter ............................................................................................................................... 7 Configuring Settings .................................................................................................................................. 8 Display Settings ..................................................................................................................................... 8 Hardware Settings................................................................................................................................. 8 Processing Settings ............................................................................................................................. 12 Acquiring Data......................................................................................................................................... 12 Recording ................................................................................................................................................ 13 Raw files .............................................................................................................................................. 13 Spike Waveform files .......................................................................................................................... 13 LFP files ............................................................................................................................................... 13 Stimulation files .................................................................................................................................. 13 Controls ................................................................................................................................................... 13 Noise Training ..................................................................................................................................... 13 Display ................................................................................................................................................. 13 Filters................................................................................................................................................... 14 Spike Detection ................................................................................................................................... 14 Referencing ......................................................................................................................................... 16 Stimulation .............................................................................................................................................. 16 Global Parameters .............................................................................................................................. 17 On Demand ......................................................................................................................................... 18 Open Loop ........................................................................................................................................... 18 Electrode Screening ............................................................................................................................ 19 Electrolesioning ................................................................................................................................... 20 IIS Zapper ............................................................................................................................................ 20 Closed-loop Learning .......................................................................................................................... 20 Impedance Measurements ..................................................................................................................... 21 Channel ............................................................................................................................................... 22 Current vs. Voltage Control................................................................................................................. 22 Periods per Frequency ........................................................................................................................ 22 R_curr .................................................................................................................................................. 22 R_m and R_g ....................................................................................................................................... 23 Voltage ................................................................................................................................................ 23 Start and Stop Frequencies ................................................................................................................. 23 Filters................................................................................................................................................... 23 Diagnostics .............................................................................................................................................. 23 Basic Features ..................................................................................................................................... 24 Special Features .................................................................................................................................. 24 Bibliography ................................................................................................................................................ 25 Papers describing the NeuroRighter System .......................................................................................... 25 Papers using the NeuroRighter System .................................................................................................. 25 Overview The NeuroRighter system has several configurations. The main two are the in vivo (➊ in the figure below) and in vitro setups (➋ in the figure below). Figure 1. Overview of NeuroRighter System. ➊ Shows the standard in vivo setup, with a Triangle Biosystems (TBSI) recording headstage, and custom interface boards. ➋ Shows a hybrid system using a Plexon headstage and preamplifier. ➌ Shows an in vitro hybrid system, using a preamp from MultiChannel Systems. All setups converge to a desktop computer with multiple data acquisition cards (National Instruments PCI-6259 or PCIe-6259). In Vivo Setup For recordings of awake, behaving animals, a lightweight recording headstage is used, connected to custom interface boards. The custom interface boards handle analog filtering, power conditioning, and stimulation control. The boards then interface with National Instruments data acquisition cards, installed in a standard desktop computer, running the NeuroRighter software. In Vitro Setup For recordings from neural or cardiac cultures, a MultiChannel Systems (MCS) preamplifier (http://www.multichannelsystems.com/) is connected to custom interface boards. These boards provide power conditioning, stimulation control, and convert the MCS cables to cables suitable for use with National Instruments data acquisition cards. The custom boards interface with a standard desktop computer, running the NeuroRighter software. Preparing the System Connections Before initiating a recording, ensure that all cables are properly connected (see the NeuroRighter Construction Manual for details). This includes: MCS 68-pin SCSI Cable. Connects MCS preamp to recording interface board. Power cable from power supply to interface boards Recording cables: o Cable from recording headstage to interface board o Data cable from interface board to data acquisition card Stimulation cables o Stimulation input cable from National Instruments card to interface board MCS Preamp with Stimulator Modules. The bottom module has been removed o Stimulation switching control cable from National for clarity. The SCSI connector cable is Instruments card to stimulator headstage not plugged in. o Stimulation output cable from interface board to stimulator headstage o Stimulator power cable from interface board to stimulator headstage o Current- vs. voltage-control cable from National Instruments card to interface board National Instruments cards o The breakout boxes should be connected with the PCI-6259 (or similar) cards o The National Instruments cards should be connected to each other with a RTSI cable If using an in vitro system, ensure that the MCS preamp is connected to the recording interface board (via an MCS SCSI cable, see figure at right). This cable powers the preamp, and carries recorded signals to the interface boards. For an in vitro system, one stimulator module should be plugged into each of the preamp’s four banks of headers (for a total of four modules; see image at right). Ensure that the 15th pin (for MCS MEAs) is grounded. Power Supply Ensure that the batteries are charged prior to system use. When the system is not in use, turn the power supply’s toggle switch to “Off.” When the system is ready to be used, switch the supply to “On.” IMPORTANT: It is good practice to have all headstages, preamps, etc. connected before turning the power on. Connecting or disconnecting components while powered can have unpredictable results. Software Ensure that the NeuroRighter software is installed on your desktop computer, the same computer with the National Instruments cards. The software can be downloaded at http://www.johnrolston.com/. Software Installation To install the NeuroRighter software, download the compressed archive from http://www.johnrolston.com/ (this is usually a ZIP file). Decompress the files to disk. Run the “setup.exe” file (not the MSI file). Follow the on-screen prompts. Stimulation Hardware Settings The stimulator board has three spaces for resistors: R_curr, R_m, and R_g. These resistors determine aspects of stimulation and impedance measurements. R_curr determines the voltage-to-current conversion factor for current-controlled stimulation. R_g and R_m determine the gain of the current monitor for voltage-controlled stimulation. R_curr must be present for current-controlled stimulation. R_m must be present for voltage-controlled stimulation. R_g is only necessary when monitoring “I” during voltage-controlled stimulation. See the picture below for the resistors’ locations. Current and voltage-controlled stimulation resistors. The resistor R_curr (bottom) changes the voltage-to-current conversion factor. Resistors R_m and R_g (top) change the gain of the current monitor (output BNC “I”). R_curr R_curr is used to divide the stimulator input voltage (from the stim-in BNC or screw terminal) into current for current-controlled stimulation. The equation is Ohm’s law: I = V/R (e.g., 1V input → 1 μA when R_curr = 100 kΩ). R_m and R_g R_m and R_g determine the gain of “I” (the current-monitor) when delivering voltage-controlled stimulation. The gain of “I” is determined by the following equation: g = R_m x (1 + (49.4 kΩ/R_g) ). Changing the values of these resistors can change the stability of the “I” monitor. These resistors have no effect on “I” during current-controlled stimulation. Software Usage Starting NeuroRighter NeuroRighter installs shortcuts in the user’s Start Menu (in the NeuroRighter folder), as well as on the desktop. To start the program, double-click on the desktop icon (shown in figure at right). You will be presented with a screen similar to Figure 2, below. Figure 2. NeuroRighter Icon Configuring Settings There are three groups of settings, available by selecting the File Menu in the NeuroRighter software: Display Settings, Hardware Settings, and Processing Settings. Display Settings Clicking on “Display Settings” opens a dialog box, like that shown below. There are two options: “In vivo” and “In vitro (MCS).” In vivo The in vivo setting maps channels 1-N (where N is the number of channels) in linear order. That is, channel 1 (the first analog channel recorded from the first National Instruments card) will be displayed in the first channel window of the software. In vitro (MCS) The in vitro setting maps channels as they would appear when looking down upon an MCS substrate integrated multi-electrode array. Hardware Settings Clicking on “Hardware Settings” opens a dialog box like the one shown below. There are three tabs, representing three types of settings: Input, Stimulation, and Miscellaneous. Input Here you select the National Instruments card (NI-DAQ) that will record the first 16-32 channels of analog data (e.g., Dev1, Dev3, etc.). All installed devices will automatically be listed as options. For more information on device numbering, see your National Instruments device’s literature, or examine the Measurement and Automation tool, distributed with National Instruments data acquisition hardware. If you use a second board for dedicated LFP acquisition (for example, if you are using a Plexon system, as in Figure 1, case ➋, above), check the appropriate box and choose the connected device. If you are using multiple analog input boards for acquisition of raw/spike data (for example, if you are recording from 64 channels, or recording from a MultiChannel Systems preamp), you should select the “Use Second Board” option, and select the appropriate device. If you are using the EEG functionality of the NeuroRighter system, select the “Use EEG Channels” checkbox and select the appropriate device. Stimulation An example of this dialog is shown below. If you are using stimulation, select the checkbox, and then the appropriate device. Multiplexor Type You will also be required to select the multiplexor type of your stimulation modules or stimulation headstage. If you are using the in vivo stimulation headstage, you are using a 16-channel multiplexor. If you are using the stimulator modules for a MultiChannel Systems preamplifier, you are using 8-channel multiplexors. [These assignments might change in the future. To be absolutely certain which type of multiplexor you are using, look at the multiplexor’s part number, and find its documentation online.] Port Bandwidth Depending on the type of National Instruments card you are using, you will select either an 8-bit port width or a 32-bit port width. If you are using a PCI-6259 or PCIe-6259 for stimulation, set the bandwidth to 32-bits. If you are using a PCI-6221, set the bandwidth to 8-bits. Stimulation Timing If you wish to record stimulation timing information synchronized to your experiment, you will need to check this box, and select the device on which this recording occurs. See the NeuroRighter Construction Manual for pin assignments (i.e., where to connect wires). Miscellaneous The miscellaneous tab appears as below. If you wish to use the NeuroRighter software to control a Cineplex camera system, check the appropriate box and select the correct device. If you are using a Plexon preamplifier, and wish to control its programmable referencing through your serial port, check the “Enable Plexon Programmable Referencing” box, and select the appropriate serial port. When conducting impedance measurements, select the device that is receiving the “V” and “I” outputs of the stimulation interface board (ai2 and ai3, respectively). Processing Settings Processing settings determine how data is handled after acquisition. There is currently only one setting, “Process LFPs.” If this setting is enabled, LFPs are either acquired directly from an A/D card, or processed from the raw acquired data. If data is being recorded, LFPs will automatically be save to disk (see Recording below). If this setting is not enabled, LFPs will not be processed, graphed or saved in any circumstance. This can be useful to minimize computation and disk usage for recordings when LFPs are not desired. A sample of the Processing Settings dialog box is shown below. Acquiring Data Before acquiring data, you should set experimental parameters. 1. Select the number of channels. NeuroRighter currently supports 16, 32, and 64 channel recordings. 2. Select the raw data’s sampling rate and LFP sampling rates. Note: If not using a separate card for LFP recording, the LFP signals are created by filtering and downsampling the raw data. The new signals are downsampled to the specified LFP sampling rate. This has no effect if “Processing LFPs” is not enabled (see Processing Settings above). 3. Select the A/D gain for analog input. This is a multiplier that determines the range and resolution of your analog data acquisition. The PCI-6259, for instance, has a maximum range of ±10 V and a resolution of 16 bits. If the A/D gain is 1, the full voltage range is used, and the 16 bits are allocated to this full range. If the A/D gain is 2, the voltage range is reduced by half to ±5 V, but the 16 bit resolution is now allocated to this smaller voltage range, increasing the acquisition’s precision. Important: You want to choose a range that will prevent clipping. If the input exceeds the voltage range, the data “clips” and the signals are lost for the duration of the clipping. You want to find a good balance between minimizing clipping, and having as high a resolution as possible. Fortunately, 16-bit resolution provides very high voltage resolution even at low gains. So an A/D gain of 2 or even 1 will easily resolve action potentials. 4. If you plan to record the acquired data to disk, configure recording options now: select an output file and set the toggle switch to record (this will illuminate the recording “LED”). You can optionally elect to record video data (with an attached Cineplex system) and write all of the raw data to disk (by checking the “save raw spike traces” box). Writing data to file is covered in more detail below. When your parameters are configured, press the Start button to begin acquiring data. [The power supply should have been turned on at this point, or else only noise will be recorded. The software, however, can run whether or not the hardware is powered.] Recording NeuroRighter saves 4 types of files: raw, spike waveform, LFP, and stimulation. Not all files are written for all recordings. The types are determined by the user. Files are only saved if the recording toggle switch is “up.” When recordings are occurring, the recording “LED” will flash between green and red. Raw files Raw files are not saved by default. To save raw files, ensure that the “Save raw spike traces” box is checked (bottom right of software window). Raw files include every sample of data recorded. The saved data is not filtered, regardless of what filters you have set for visualization or spike detection. Spike Waveform files Spike waveform files include information on all spikes detected. The time of the spike, the channel it occurred on, and a number of samples before and after the spike threshold crossing are stored. The number of samples is determined by the “Pre samples” and “Post samples” controls. The default is 22 samples before and 52 after the threshold, giving 75 samples per waveform (22 pre + 1 triggering sample + 52 post). LFP files LFP files are currently saved by default. These files contain the filtered and downsampled data that is visualized in the LFP graph. LFPs are not saved if “Processing LFPs” is not enabled (see Processing Settings above). Stimulation files These files record information about the stimulation that occurred during an experiment. For each stimulation pulse, the time, channel, voltage, and pulse width are recorded. Controls There are several ways to interact with the acquired data while it’s being visualized or before the recording has begun. Below are descriptions of these controls. Noise Training The SALPA filter (Wagenaar, D. A. and S. M. Potter (2002). "Real-time multi-channel stimulus artifact suppression by local curve fitting." J. Neurosci. Methods 120: 113-120) requires an estimate of recording noise before filtering. By pressing the “Train” button, before recording, NeuroRighter records 3 seconds of data to determine noise levels on all channels. Once the training is complete, the SALPA checkbox in the filters section becomes selectable. Display When a recording begins, the visual display of data shows the A/D card’s full range (factoring in the A/D gain). For instance, with an A/D gain of 10, each channel will have a vertical range of ±1 V (assuming a ±10 V card, like the PCI-6259). By clicking the magnifying glass with a “+” inside, the range is halved. Each click of the magnifying glass increases the visual gain by another factor of 2. Similarly, clicking the magnifying glass with a “-“ increases the range by a factor of 2. The magnifying glass with a “=” inside returns the display to the default visual gain. There is also a pause button (“||”). This button freezes the display. Filters There are currently three filters that can be used while acquiring data: SALPA, spikes, and LFPs. SALPA The SALPA filter (Wagenaar, D. A. and S. M. Potter (2002). "Real-time multi-channel stimulus artifact suppression by local curve fitting." J. Neurosci. Methods 120: 113-120) removes stimulation artifacts from the raw data, allowing better visualization of action potentials. To select this filter, noise levels must have been trained prior to beginning the recording (i.e., before pressing “Start”). Spikes The “spikes” filter is a Butterworth bandpass filter with -3 dB points specified in the “Low-cut” and “High-cut” boxes. The number of poles is also selectable. This filtering takes place after the SALPA filter, if applied. LFPs LFP signals can be acquired in one of two ways: 1. derived from the raw analog input channels, then filtered and downsampled, or 2. directly acquired from a dedicated analog input A/D card (as in scenario ➋ of figure 1 above). In the first case, the LFP filter (Butterworth bandpass with cut-offs specified in the “Low-cut” and “Highcut” boxes) is applied to the raw acquired data, then downsampled to a frequency specified in the “LFP Sampling Rate (Hz)” box. It is strongly recommended that a filter always be used when downsampling LFPs in this manner. In the second case, the data is acquired at the frequency specified in the “LFP Sampling Rate (Hz)” box, then filtered according to the characteristics of the LFP filter. This has no effect if “Processing LFPs” is not enabled (see Processing Settings above). Spike Detection Spike detection is the process of finding candidate action potentials from raw data. No method currently available is 100% specific and 100% sensitive—there will always be false positives and false negatives in a practical experimental setup. In the NeuroRighter software, spikes are detected by first calculating an estimate of the noise level for each channel, σ. A threshold is calculated from this number using the entry, T, in the “Threshold” box. Any time the acquired data crosses this threshold, Tσ, a spike is detected. The threshold is symmetric, meaning that samples greater than Tσ and less than -Tσ all trigger spike detection. An typical value of T is 5. There are four methods for spike detection currently implemented in NeuroRighter: Adapative RMS, Fixed RMS, Median, and LimAda. Fixed RMS This method computes σ as the root-mean-squared value of the samples within the first 40 ms of data acquisition. Adaptive RMS With adaptive RMS, σ is computed as the root-mean-squared value of the last 250 ms of acquired data. The window is updated every 10 ms. Median Here, σ is computed as the median of the absolute value of the data in the last 250 ms. This is an adaptive method. The 250 ms is updated every 10 ms. LimAda This method is identical to that used by Daniel Wagenaar’s MEABench software: http://www.its.caltech.edu/~daw/meabench/. See his documentation for details. This method has not been thoroughly tested, as have the previous three. Referencing Digital and analog referencing of channels can be set through the “Ref” tab, as shown below. Digital Referencing Selecting “Spike Referencing On” will digitally subtract the selected channel from all other channels. This can be useful when dealing with movement artifacts or related correlated noise. This has no effect on the LFP channels, nor data saved with the “Save raw spike traces” command. It will affect the data sent to the spike detection algorithms. Selecting “LFP Referencing On” accomplishes identical referencing for the LFP channels. Analog Referencing If a Plexon preamp is being used, analog referencing can be controlled similarly to digital referencing. Stimulation Before stimulating, ensure the stimulation modules are properly connected (see NeuroRighter Construction Manual and Stimulation Hardware Settings above). Stimulation commands are available in the “Stim” tab in the NeuroRighter application. Before stimulating, set the “Global Parameters.” Then choose a type of stimulation, set parameters for that type, and start stimulation. Available stimulation modalities are: On Demand (single pulses or brief trains), Open Loop (continuous stimulation delivered in pseudo-random fashion) Electrode Screening (cycles randomly through a selection of stimulation parameters) Electrolesioning (sends “DC” current for a given length of time, useful for electrocoagulation) IIS Zapper (an experimental closed-loop application that stimulates when an interictal spike is detected on an LFP channel) Closed-loop Learning (an experimental closed-loop application mimicking the experiment of Bakkum, Chao, and Potter 2008) A screenshot of the interface follows. Settings for each stimulation type are described below. Global Parameters These parameters affect all stimulation types. Current vs. Voltage Control This setting determines whether stimulation is voltage- or current-controlled. The current for currentcontrolled stimulation is specified as a voltage, and delivered as a voltage by a National Instruments D/A output. This voltage is then converted to current on the stimulation/power interface board through the resistor R_curr (see Stimulation Hardware Settings above). So, to deliver a 10 μA pulse, for example, you would deliver a 1 V pulse with R_curr = 100 kΩ. Offset Voltage The offset voltage is added to the entire stimulation waveform. This can be used to account for offsets induced by the electrode’s electrochemical shift, or to provide a constant bias current. On Demand On demand stimulation provides à la carte stimulation pulses or pulse trains. All pulses are biphasic with phase widths of equal length. The specified voltage is for the first phase, and the second phase is the negative of the first phase (e.g., if the first phase is 1V, the second will be -1V). Num Pulses This specifies the number of pulses or pulse trains that will be delivered. Voltage This specifies the voltage of the first phase of the biphasic stimulation pulse. The second phase is the negative of this voltage (e.g., if the first phase is 1V, the second will be -1V). If stimulation is currentcontrolled, this voltage determines the current, after accounting for the voltage-to-current conversion resistor. Rate This determines the stimulation rate at which multiple pulses are given. This has no effect if the number of pulses is equal to one. Phase Width The phase width is the length of time for each phase of the biphasic stimulus pulse. For example, if the phase width is 400 μs, the total pulse will be 800 μs (400 for each of the two phases). Interphase Length A brief period where the stimulation voltage is set to 0 V (or 0 A) can be inserted between the two phases of the biphasic stimulation pulse. This has been suggested by some authors to reduce tissue damage or provide different excitatory effects (e.g., see Merrill DR, Bikson M, Jefferys JG 2005). If the offset voltage is non-zero, the interphase voltage will equal the offset. Channel The electrode on which the stimulation is delivered is specified in the “Channel” box. *For curious computer scientists this is 1-based, not 0-based.] Open Loop Stimulation is delivered in a pseudorandom order from the specified set of electrodes. The aggregate stimulation rate determines the time between pulses (e.g., if the rate is 100 Hz, and 10 electrodes are selected, each electrode will be asynchronously stimulated at 10 Hz). Rate The selected set of electrodes is stimulated asynchronously at the specified rate (e.g., if the rate is 100 Hz, and 10 electrodes are selected, each electrode will be asynchronously stimulated at 10 Hz). Voltage The voltage (or current) of each phase of the biphasic stimulation pulse can be set independently. If stimulation is current-controlled, this voltage determines the current, after accounting for the voltageto-current conversion resistor. Phase Width The phase width is the length of time for each phase of the biphasic stimulus pulse. The two phases can be determined independently. For example, if the phase width is 400 μs, the total pulse will be 800 μs (400 for each of the two phases). Interphase Length A brief period where the stimulation voltage is set to 0 V (or 0 A) can be inserted between the two phases of the biphasic stimulation pulse. This has been suggested by some authors to reduce tissue damage or provide different excitatory effects (e.g., see Merrill DR, Bikson M, Jefferys JG 2005). If the offset voltage is non-zero, the interphase voltage will equal the offset. Pre and Post Phase Length A brief period where the stimulation voltage is set to 0V (or 0A) is usually present at the beginning and end of each pulse. In our experience, this helps control stimulation artifacts. If the offset voltage is nonzero, the pre and post-phase voltage will equal the offset. Channels The set of channels to stimulate is determined before beginning the open-loop stimulation experiment. The number of selected channels can be 1 to N, where N is the number of available channels. Electrode Screening The electrode screening experiment cycles through a selected set of stimulation parameters on a set of electrodes in a random ordering. Each selected electrode will be stimulated with all possible permutations of stimulation parameters. Each permutation will be delivered the specified number of times (the “Num repeats” box), again in a random order. The randomization of ordering minimizes habituation effects between stimulation pulses. The rate of stimulation is 1 Hz (i.e., one permutation on one electrode every second). Channels The set of channels to stimulate is specified here. 1-N channels can be selected, where N is the total number of electrodes. Voltages The specified voltage determines the amplitude of the biphasic stimulation pulse. The given number is the amplitude of the first phase, and the second phase is the negative of this voltage (e.g., if the first phase is 1V, the second will be -1V). If stimulation is current-controlled, this voltage determines the current, after accounting for the voltage-to-current conversion resistor. Multiple values should be separated by commas, spaces, tabs, newlines, or colons. Pulses per Train Pulse trains can be delivered in addition to single pulses. If a value of “1” is provided here, single pulses are delivered. If larger numbers are specified, then a rapid train of pulses is delivered, at a rate of 200 Hz (5 ms between pulses). Multiple values should be separated by commas, spaces, tabs, newlines, or colons. Pulse Widths The phase width is the length of time for each phase of the biphasic stimulus pulse. For example, if the phase width is 400 μs, the total pulse will be 800 μs (400 for each of the two phases). Multiple values should be separated by commas, spaces, tabs, newlines, or colons. Num Repeats The number of times each permutation is presented is specified here. Electrolesioning To localize electrode tips for histology, it is often suggested to deliver direct current (DC) stimulation prior to animal perfusion. This component of NeuroRighter allows this to be done easily. Voltage The voltage of the electrode for the duration of the stimulation is specified here. If stimulation is current-controlled, this voltage determines the current, after accounting for the voltage-to-current conversion resistor. Duration The duration for which the voltage is provided for each electrode is specified here. Typical values are in the 1-30 second range. Channels to Stimulate The set of channels to lesion is specified here. 1-N channels can be selected, where N is the total number of electrodes. IIS Zapper This is an experimental closed-loop application. Please review the code thoroughly before using, and ask the author, John Rolston ([email protected]), for help. This application has not been thoroughly tested (though it has worked for the code’s author on several occasions). Important: data acquisition should be started prior to the closed-loop experiment. Closed-loop Learning This is an experimental closed-loop application, based on the paper by Bakkum DJ, Chao Z, and Potter SM (2008). Please review the code thoroughly before using, and ask the author, John Rolston ([email protected]), for help. This application has not been thoroughly tested. Important: data acquisition should be started prior to the closed-loop experiment. Impedance Measurements NeuroRighter is capable of measuring impedance spectra in real time, using the stimulator and its current- or voltage-monitoring outputs. The essential idea is that, if a voltage-controlled sine wave us used to stimulate an electrode, the monitored current can be used to calculated electrode impedance at the sine wave’s frequency. This is also true when using current-controlled sine waves and monitoring the delivered voltage. The results are presented in a table (under “Results”) and depicted graphically in a plot. Clicking “Copy Data to Clipboard” copies the contents of the “Results” box to the clipboard. Clicking “Save Data as Matlab MAT File” saves the data in MAT format (useful for later analysis in Matlab). Before taking impedance measurements, ensure that the “V” and “I” terminals of the stimulator interface board (either BNC or screw terminals) are connected to the Impedance Device’s ai2 and ai3 inputs, respectively (see the NeuroRighter Construction Manual for more details). The Impedance Device is specified File -> Hardware Settings under the “Miscellaneous” tab. Important: Impedance measurements are difficult for a number of reasons. First, impedance values range over several orders of magnitude. Therefore, some measurements will be very small, and likely buried in noise. Other measurements will be very large, and clip at the power supply rails. It is therefore strongly recommended that the actual data be monitored first with an oscilloscope before relying on the computed values. An oscilloscope can be used by hooking up the appropriate BNC outputs, and executing an impedance measurement. As an example, take a current-controlled measurement of impedance. What’s measured is the actual delivered voltage. If the impedance is very high (e.g., at low frequencies in standard electrodes), the voltage required to deliver that current will be very high. This can lead to clipping (e.g,. if the required voltage is 8 V, but the power supply is limited to 6 V). If the impedance is very low, the voltage required will be very low. If the noise is, for example, 10 mV peak-to-peak, at the delivered voltage is 10 mV, this will be obscured by the noise. However, filtering might be able to recover the desired voltage. Second, impedance is affected by stray capacitance. There are many places where the stimulation signal is carried near other wires and conducting objects, after it has left the stimulation interface board. Along this path, a voltage or current-controlled pulse will wind up charging these other objects and wires (stray capacitance). Since the stimulation current and voltage are measured on the interface board, these stray capacitances will be included in the measured impedance. Therefore, what is truly being measured is the impedance of the electrode, and the cables leading to it. With short cables, this effect is negligible, especially when higher amplitude test currents or voltages are used. However, the effect can be large when using long cables and low amplitude test waves. It is therefore recommended that you test a known impedance to estimate your error. A good source of a known impedance is the MultiChannel Systems test MEA, which has a known resistance and capacitance in parallel. However, any custom-built resistor and capacitor in parallel will do. Channel Impedance measurements can be taken from a single channel, or all channels in sequence (by checking the “all channels” box). Current vs. Voltage Control Impedance measurements can be conducted by delivering current-controlled sine waves and measuring the delivered voltage, or by delivering voltage-controlled sine waves and measuring the delivered current. The amplitude of the sine wave is always specified as a voltage (since this is what the National Instruments D/A emits) but the voltage is converted to current through R_curr if the stimulation is current-controlled (see Stimulation Hardware Settings). Periods per Frequency Each sine wave is presented for the specified number of periods, to help estimate the average amplitude of the measured wave. However, to improve results, the minimum duration of any test wave is 100 ms. R_curr When measuring impedance with current-controlled stimulation, NeuroRighter requires the value of R_curr. Knowing this, the software can then calculate the delivered current, and use that to compute the measured impedance. R_m and R_g When measuring impedance with voltage-controlled stimulation, NeuroRighter requires the values of R_m and R_g. Knowing these, the software can calculate the gain of the current monitoring circuitry, and then use this to calculate the measured impedance. Voltage The amplitude of the delivered sine wave is specified here. If stimulation is current-controlled, this voltage determines the current, after accounting for the voltage-to-current conversion resistor. Start and Stop Frequencies The impedance spectrum is measured over the specified range of frequencies. The actual frequencies measured begin with the start frequency, and then every multiple of 1.5 thereafter, in a semilogarithmic fashion. For example, if the start and stop frequencies are 1 and 10 Hz, the tested frequencies are 1, 1.5, 2.25, 3.375, 5.0625, and 7.5938. To test a single frequency, set the start and stop frequencies equal to each other (e.g., to measure impedance at 1 kHz, set the start frequency to 1000 Hz and the stop frequency to 1000 Hz). Filters It is occasionally necessary to filter the measured signals to improve the measurement quality. This is especially true if the signals are present on a large background of noise. Two filters are available: a matched filter and a bandpass filter. Matched Filter The matched filter will convolve the measured signal with the original sine wave. This is the optimal matched filter assuming a Gaussian distribution of noise. This is our preferred method. Bandpass filter This bandpass filter is a 1-pole filter with -3 dB points at the ±0.25 * f, where f is the frequency of interest. [This tends to over-estimate the impedance in our experience.] Diagnostics The diagnostics section is provided to help verify that the recording equipment is amplifying with an appropriate bandpass filter and gain. This works nearly identical to impedance measurements. However, unlike impedance testing, the measured signals will be recorded by the recording headstage or preamplifier. All input sine waves should be voltage-controlled. With a known voltage-controlled sine wave of a know frequency, the measured signals from the headstage or preamplifier can be used to determine the system’s gain at that frequency. When computed at multiple frequencies, the system’s transfer function can be estimated. Basic Features These features are identical to those used for impedance measurements. Please refer to that section for more information. Special Features All channels at once Selecting this requires a way to deliver stimulation to all channels simultaneously. This capability is not present with the normal stimulator headstages. In our case, we use a Plexon Headstage Test Unit, which provides a common signal to all electrodes. External voltage divider The National Instruments analog output, used to generate stimulation pulses and test waves, has a finite accuracy (16-bits with a range of ±5 V). Therefore, very small amplitude sine waves (e.g., 1 mV), will have poor resolution. To account for this, we often use an external voltage divider, to divide down a 1 V sine wave to something smaller (e.g., 100 μV). Entered the division factor will allow the software to automatically account for this. Digital Filter This filter is identical to the bandpass filter used in the impedance measurement section. Bibliography Papers describing the NeuroRighter System 1. J. D. Rolston, R. E. Gross, S. M. Potter (Submitted). "A low-cost multielectrode system for data acquisition and real-time processing with rapid recovery from stimulation artifact." 2. J. D. Rolston, R. E. Gross, S. M. Potter (2008) "Low-Cost System for Simultaneous Recording and Stimulation with Multi-microelectrode Arrays" 6th International Meeting on SubstrateIntegrated Micro Electrode Arrays (SIMEA), Reutlingen, Germany. Find the paper in the conference proceedings: http://www.nmi.de/images/publikationen/MEA%202008%20Proceedings%20final_web.pdf Papers using the NeuroRighter System [No content yet.]