1
UCI150511
Universal Coastal Interface
User manual
05/2015, Edition 1
Table of Contents
Section 1 Install software .................................................................................................................. 3
Section 2 SUNA operation ................................................................................................................ 5
2.1 Verify sensor operation................................................................................................................ 5
2.2 Monitor data collection................................................................................................................. 6
2.2.1 Monitor data in spectra graph .............................................................................................8
2.2.2 Monitor data in absorbance graph.......................................................................................8
2.3 Get data from sensor................................................................................................................... 9
2.4 Use software to set up sensor for deployment............................................................................. 9
2.4.1 Set up for autonomous deployment.................................................................................. 10
2.4.2 Set up for SDI-12 deployment........................................................................................... 11
Section 3 HydroCAT operation ...................................................................................................... 13
3.1
3.2
3.3
3.4
Verify sensor operation.............................................................................................................. 13
Monitor data collection............................................................................................................... 13
Get data from sensor................................................................................................................. 15
Set up for deployment................................................................................................................ 16
Section 4 Reference ..........................................................................................................................19
4.1 Verify precision of sensor output................................................................................................ 19
4.1.1 Update reference spectrum............................................................................................... 19
4.1.2 Update firmware................................................................................................................ 21
4.1.3 Temperature check........................................................................................................... 22
4.1.4 Zero conductivity frequency test........................................................................................22
4.1.5 Conductivity standard check............................................................................................. 22
4.2 Sensor dashboards.................................................................................................................... 23
4.3 Preferences menu...................................................................................................................... 24
4.4 Sensor menu.............................................................................................................................. 25
4.4.1 Create summary report..................................................................................................... 27
4.5 Data menu.................................................................................................................................. 28
4.5.1 Files necessary to process data........................................................................................ 28
4.5.1.1 Reprocess SUNA data............................................................................................. 28
4.5.1.2 Convert SUNA raw data........................................................................................... 29
4.5.1.3 Replay saved SUNA data......................................................................................... 30
4.5.2 Replay saved HydroCAT data........................................................................................... 31
4.5.3 Compare reference spectrum files.................................................................................... 32
4.6 View menu................................................................................................................................. 33
4.7 Window menu............................................................................................................................ 35
4.8 Help menu.................................................................................................................................. 35
Section 5 Troubleshooting ..............................................................................................................37
5.1
5.2
5.3
5.4
SUNA general troubleshooting................................................................................................... 37
SUNA operation troubleshooting................................................................................................ 37
SUNA communication troubleshooting...................................................................................... 38
SUNA warnings and error messages......................................................................................... 38
Section 6 General information ....................................................................................................... 41
6.1 Service and Support................................................................................................................... 41
1
Table of Contents
2
Section 1
Install software
The Universal Coastal Interface (UCI) software communicates with a number of sensors.
Refer to the sea-birdcoastal.com website for the current list of sensors that use this
software.
1. Get the software from the sea-birdcoastal.com website or the manufacturer-supplied
CD.
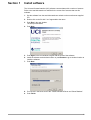
2. Double-click on the file with ".exe" appended to the name.
3. Push Run in the new window.
The setup wizard starts.
4. Push Next.
5. Push Agree in the next window to agree with the terms of the software.
6. Install the software at the default location or push Browse to go to another location to
install the software.
7. Push Next.
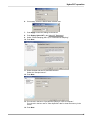
8. Put a check in the boxes next to the "Install USB-Serial Driver and "Show Readme."
9. Push Finish.
3
Install software
The software is ready to use.
4
Section 2
SUNA operation
2.1 Verify sensor operation
WARNING
Nitrate sensors use an ultraviolet (UV) light. Do not look directly at a UV light when it is on. It can
damage the eyes. Keep products that have UV light away from children, pets, and other living
organisms. Wear polycarbonate UV-resistant safety glasses to protect the eyes when a UV light is
on.
CAUTION
Do not supply more than 15 VDC to the sensor. More than 15 VDC will damage the wiper.
Do the steps below to make sure that the sensor operates before further setup and
deployment.
1. Connect the connectors on the cable to the bulkhead connector on the sensor and to
the PC.
2. Connect the USB or RS232 cable to the PC.
For RS232: connect the power connectors on the cable to a 8–15 VDC power supply.
For USB: a DC power supply is only necessary for data collection. If the sensor is
equipped with internal memory, the file system will show as a USB mass storage
device on the PC.
3. If necessary, start the software.
4. RS232: turn on the power supply.
5. Push Connect in the UCI Dashboard area.
6. If necessary, change the "Sensor Type" to the connected sensor.
7. Put a check in the "Try All Baud Rates" box.
The software automatically finds the correct baud rate.
8. If necessary, select the communication port.
9. Push Connect.
The "Connection Mode" shows "Transition" on a yellow background, and then shows
"Setup" on a green background.
10. Push SUNA Settings in the SUNA Dashboard area.
Make sure that the "Operational Mode" at the top of the new window is "Continuous."
5
SUNA operation
11. Push Start in the SUNA Dashboard area.
The sensor collects data that shows in the Spectra Graph and Time Series Graph
tabs.
12. For sensors that are not equipped with internal memory: Select the View menu, then
Data Logging. Push Start Log to save data to the PC.
13. Let the sensor collect data for a minute or two.
14. Push Stop.
15. Make sure that the collected data is saved.
•
•
Sensors with internal memory: select Transfer Files in the SUNA Dashboard.
Look at the files on the right for the file that was most recently saved.
Sensors without internal memory: Go to the directory on the PC to see the file
that was most recently saved.
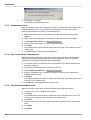
2.2 Monitor data collection
Use the software to monitor data as it is collected, or to look at it after a deployment, if the
sensor is equipped with internal memory. If the sensor does not have internal memory,
make sure to use the Data Logging tab to save collected data to a PC.
1. Push Start in the SUNA Dashboard area.
2. From the View menu, select the options to see the data:
6
•
Real Time Data—shows the most current data from the selected sensors.
•
Data Logging—Push Start Log to save the collected data to the PC.
SUNA operation
• Time Series, Spectra, and Total Absorbance graphs.
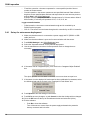
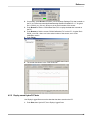
3. Push Select Sensors to see a list of parameters that can show in the Time Series
tab.
4. Put a check in the box next to any additional parameters so that they will show in the
Time Series graph.
The left axis of the Time Series graph shows the parameters that are selected.
SUNA
HydroCAT
5. Look at the data in the Time Series tab.
•
•
•
•
Put a check in the box next to "Time Axis" to push Zoom In and Zoom Out to
change the scale of time.
Put a check in the box next to "Range Axis" to push Zoom In and Zoom Out to
change the scale of the data.
To move the data in any direction, push the "Ctrl" key on the PC keyboard and
the left button of the mouse pointer at the same time.
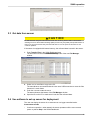
To select a specific part of the data to zoom in on, pull the mouse pointer
diagonally (refer to the arrow in the graph below).
7
SUNA operation
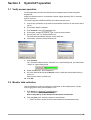
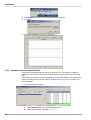
2.2.1 Monitor data in spectra graph
The Spectra graph shows both the dark and light data in raw counts.
The dark counts are from thermal noise. The light counts are the measured output minus
the dark counts.
The measured spectrum is always flat below 200 nm, and then has four or five peaks.
The peaks are approximately 25 nm apart in the lower wavelength range and up to 50 nm
apart in the upper range.
1. Put a check in the box next to either or both the "Wavelength Axis" or the "Range
Axis" to enable the Zoom In or Zoom Out options.
The user can change the values for the axis with a check in the box.
2. Push Select Sensors either in the Time Series graph or in the Real Time Display tab
to select the parameters to see on the graph.
3. Push Configure to put a limit on or to remove the limit to the "Time Axis Range."
2.2.2 Monitor data in absorbance graph
The Total Absorbance graph shows the calculated absorbance from 210 to 370 nm. This
graph is an alternative to the Spectra graph. The absorbance graph should be flat when a
sample of DI water is collected. The absorbance increases as absorbing species such as
nitrate and bromide are added to samples.
8
SUNA operation
2.3 Get data from sensor
CAUTION
Do data transfers away from harsh environments such as strong electric fields or electrostatic
discharge sources. Electrostatic Discharge (ESD) sources may temporarily disrupt data transfer. If
this occurs, move the sensor away from the ESD source. Turn the power off and then on and
continue operation.
If the sensor is equipped with internal memory, the collected data is saved in the sensor.
1. Push Transfer Files in the SUNA Dashboard area.
The files saved on the sensor show on the right side of the new File Manager
window.
2. Select one or more files to copy to the PC.
The manufacturer recommends that the user use a USB connection to move the files
because it is much faster.
3. Push the <- arrow to start the move.
The status shows at the bottom of the File Manager window.
4. Open the file on the PC to make sure it has all of the collected data.
2.4 Use software to set up sensor for deployment
The user can deploy the sensor in an autonomous or a logger-controlled mode.
Autonomous modes
•
Continuous operation—when started, the sensor operates until the user removes
power or pushes Stop in the SUNA Dashboard.
9
SUNA operation
•
•
Fixed-time operation—the sensor operates for a user-specified period of time or
number of measurements.
Periodic operation—the sensor operates at user-specified intervals. Data collection
begins at a user-specified date and time and stops when the user removes power or
pushes Stop in the SUNA Dashboard.
Example: a sensor set up at 8:00 with a "Sample Interval" of 2 hours and an offset of
900 seconds (15 minutes) will operate at 10:15, 12:15, 2:15, etc.
Logger-controlled modes
•
•
Polled operation—the sensor communicates through and is controlled by an
RS232 terminal program.
SDI-12—The sensor communicates through and is controlled by an SDI-12 controller.
2.4.1 Set up for autonomous deployment
1. Make sure that the sensor is connected to a power supply and PC (RS232 or USB
cable) and is on.
2. Make sure that the software is open and in communication with the sensor.
3. Push SUNA Settings in the SUNA Dashboard area.
4. Select the "Operational Mode" for the planned deployment.
5. Use the manufacturer-set values for that operation mode or change them as
necessary.
6. If the sensor has an integrated wiper, put a check in the "Integrated Wiper Enabled"
box.
The wiper operates one time data is collected, but no more than once per hour.
7. If the sensor is to be deployed in fresh water but has a calibration for seawater, select
the Advanced tab and put a check in the "Deployed in Fresh Water" box.
8.
9.
10.
11.
Push Upload to save the settings in the sensor.
Push OK to save any changes, or push Cancel to close the window with no changes.
Go to the UCI menu at the top of the software window and select Exit (Ctrl-e).
Exit the software:
•
10
Push No to close the software.
Turn off the sensor, remove from the power supply and attach the protective
dummy connector and lock collar.
SUNA operation
•
Push Yes to close the software and start the sensor. The sensor will collect data
immediately if the user selected "Continuous" or "Fixed-time" or at the userspecified time if "Periodic" was selected.
2.4.2 Set up for SDI-12 deployment
The user can deploy the sensor in a logger-controlled mode with an SDI-12 controller.
1.
2.
3.
4.
Set up the sensor in SDI-12 mode to operate with a controller.
Make sure that the sensor is connected to and in communication with the software.
Push SUNA Settings in the SUNA Dashboard.
At the General tab, select the "SDI 12 Operational Mode."
5. If necessary, change the "Number of Measurements per Frame."
The sensor calculates the average of the value entered. For example, if "5" is
entered, 5 measurements will be averaged and will show as one measurement in the
data.
6. If the sensor is so equipped, put a check in the "Integrated Wiper Enabled" box.
The wiper operates before each measurement.
7. The default "Logging Level" is INFO.
8. Push Upload.
A new window shows.
9. Push Yes to put the SUNA into SDI-12 mode.
The sensor is ready to connect to an SDI-12 data logger.
11
SUNA operation
12
Section 3
HydroCAT operation
3.1 Verify sensor operation
Do the steps below to make sure that the sensor operates before further setup and
deployment.
Make sure that the sensor is connected to a power supply (optional), SDI-12 controller,
and PC and is on.
The sensor operates in RS232 and SDI-12 modes at the same time.
1. Connect the connectors on the cable to the bulkhead connector on the sensor and to
the PC.
2. If necessary, start the software.
3. Push Connect in the UCI Dashboard area.
4. If necessary, change the "Sensor Type" to the connected sensor.
5. Put a check in the "Try All Baud Rates" box.
The software automatically finds the correct baud rate.
6. If necessary, select the communication port.
7. Push Connect.
The "Connection Mode" shows "Transition" on a yellow background, and then shows
"Setup" on a green background.
8. Select the UCI menu, then Preferences.
9. Go to the General tab and push Browse to find or make the Default Data Directory
on the PC.
Data from the sensor is saved here.
10. Push OK.
3.2 Monitor data collection
Use the software to monitor the data as it is collected, or after a deployment. Use the
Data Logging tab to save collected data to a PC.
1. Push Start in the HydroCAT Dashboard area.
The "Connection Mode" shows "Acquisition."
Note: It may take up to two minutes for the sensor to show data.
2. From the View menu, select the options to see the data:
•
Real Time Data—shows the most current data from the selected sensors.
13
HydroCAT operation
•
Data Logging—Push Start Log to save the collected data to the PC.
• Time Series graphs.
3. Push Select Sensors to see a list of parameters that can show in the Time Series
tab.
4. Put a check in the box next to any additional parameters so that they will show in the
Time Series graph.
The left axis of the Time Series graph shows the parameters that are selected.
SUNA
HydroCAT
5. Look at the data in the Time Series tab.
•
•
14
Put a check in the box next to "Time Axis" to push Zoom In and Zoom Out to
change the scale of time.
Put a check in the box next to "Range Axis" to push Zoom In and Zoom Out to
change the scale of the data.
HydroCAT operation
•
•
To move the data in any direction, push the "Ctrl" key on the PC keyboard and
the left button of the mouse pointer at the same time.
To select a specific part of the data to zoom in on, pull the mouse pointer
diagonally (refer to the arrow in the graph below).
6. Let the sensor collect data for approximately 5 minutes.
7. Push Stop in the HydroCAT Dashboard.
The "Connection Mode" mode shows "Setup."
3.3 Get data from sensor
CAUTION
Do data transfers away from harsh environments such as strong electric fields or electrostatic
discharge sources. Electrostatic Discharge (ESD) sources may temporarily disrupt data transfer. If
this occurs, move the sensor away from the ESD source. Turn the power off and then on and
continue operation.
1. Push Transfer Data in the HydroCAT Dashboard area.
The new file shows near the bottom of the window in the "File Name" area.
2. If necessary, push Browse to change the directory on the PC in which the data is
stored
3. Push Transfer to move the file to the PC.
4. Push OK when the Transfer Progress window shows 100%.
15
HydroCAT operation
5. The manufacturer-set default is a check in the checkbox for "Display Data when
Transfer Completed."
6. The sensor is ready to set up for a specific deployment.
3.4 Set up for deployment
1.
2.
3.
4.
If necessary, start the software.
If necessary, connect the sensor to an SDI-12 controller if applicable, and PC.
Push HydroCAT Settings in the HydroCAT Dashboard area.
Select the Output Format tab if necessary. Select the settings for a specific
deployment. Push Default to remove the "Conductivity" and "Salinity" parameters.
Parameter Units
•
•
•
•
Temperature: select °C or °F.
Conductivity: select µS/cm, S/m, mS/cm.
Pressure: select PSI or Decibars.
Oxygen: select mg/L or ml/L.
Parameters to Output
•
•
•
Put a check in the box for each parameter to show "Temperature," "Conductivity,"
"Pressure," "Oxygen," "Salinity," "Sound Velocity."
Put a check in the box "Specific Conductivity" to show that parameter.
Put a check in the box "Sample Number" to add a number to each row of data
that is collected.
5. Select the Data tab to change the "Sample Interval" time (measured in seconds).
Note: the sample interval time that is recorded by the sensor is directly related to
pressure and temperature. This can result in a sample interval that is longer than the
user-specified sample interval.
16
HydroCAT operation
6. If necessary, select the RS232 data collection rate.
7.
8.
9.
10.
Push Apply to save the settings to the sensor.
Push Deploy HydroCAT in the HydroCAT Dashboard.
Select "Polled Sampling (SDI-12)" or "Autonomous Sampling."
Push Next.
11. Select the date and time to start data collection.
Select the "Sample Interval."
12. Push Next.
13. Put a check in the box to "Synchronize HydroCAT clock to computer."
Put a check in the box next to "Clear HydroCAT data" to clear the memory in the
sensor.
14. Push Next.
17
HydroCAT operation
15. Enter any comments about the deployment.
Put a check in the box next to "View Report" to save a summary of the settings saved
in the sensor.
If necessary, enter the directory in which the report will be saved, or push Browse to
find a new directory.
16. Push Finish.
The software disconnects. The sensor is now ready for deployment.
18
Section 4
Reference
4.1 Verify precision of sensor output
4.1.1 Update reference spectrum
The user needs to update the reference spectrum of the SUNA at regular intervals so that
the data that the sensor collects is accurate. It may also be necessary to update the
firmware, although that is not required very frequently.
A calibration file contains the data required to convert a spectral measurement into a
nitrate concentration. The calibration data are the wavelengths of the spectrum, the
extinction coefficients of chemical species and a reference spectrum relative to which the
measurement is interpreted. The sensor can store many calibration files, but only the
active file has a green background. Push Transfer Files > File Manager, then select the
Calibration Files tab to see the list of calibration files stored in the sensor.
Make sure to clean the sensor and the sensor windows at regular intervals and before
and after every deployment. Monitor the spectral intensity of the lamp. Although the
intensity will decrease over time, make sure there are no sudden changes.
Necessary supplies:
•
•
•
•
•
•
•
•
Power supply
PC with software
Connector cable for sensor–PC–power supply
Clean de-ionized (DI) water
Lint-free tissues
Cotton swabs
Isopropyl alcohol (IPA)
Parafilm® wrap
Notes
•
•
•
•
Use only lint-free tissues, OPTO-WIPES™, or cotton swabs to clean the optical
windows.
Use the software to update the reference spectrum.
Use only clean DI water that has been stored in clean glassware.
Use Parafilm® wrap to capture DI water in the optical area of the sensor. Do not use
cups, a bucket, or a tank to collect a reference sample.
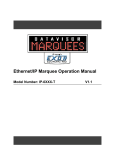
1. Clean the sensor:
a. Flush the sensor and the optical area with clean water to remove debris and
saltwater.
b. Clean the metal parts external to the optical area so that the Parafilm® will seal.
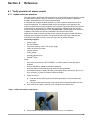
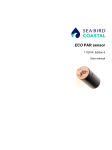
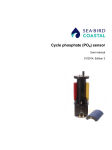
2. If the sensor has a wiper, carefully move it away from the optical area.
Figure 1 Wiper moved from optical area
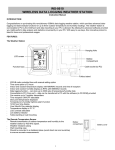
3. Cut and stretch a length of approximately 40 cm (16 in.) of Parafilm®.
19
Reference
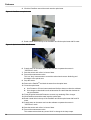
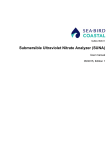
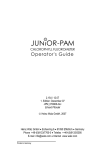
4. Wind the Parafilm® around the metal near the optical area.
Figure 2 Parafilm® on optical area
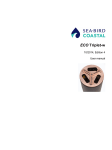
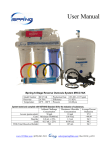
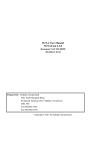
5. Break a small hole in the top of the Parafilm® and fill the optical area with DI water.
Figure 3 Optical area filled with DI water
6. Supply power to the sensor and use the software to operate the sensor in
"Continuous" mode.
7. Start the sensor and collect 1 minute of data.
8. Record the measurement value.
This is a "dirty" measurement to record the value when there are biofouling and
blockages in the optical area.
9. Stop the sensor.
10. Remove the Parafilm® and drain the water from the optical area.
11. Clean the optical area:
12.
13.
14.
15.
16.
17.
20
a. Use DI water or IPA and cotton swabs and lint-free tissues to clean the windows.
b. Use vinegar to clean debris such as barnacles. Be careful that the windows do
not get scratches.
Flush the optical area with DI water to remove any remaining IPA or vinegar.
Wind Parafilm® around the metal near the optical area.
Break a small hole in the top of the Parafilm® and fill the optical area with fresh DI
water.
Supply power to the sensor and use the software to operate the sensor in
"Continuous" mode.
Start the sensor and collect 1 minute of data.
Record the measurement value.
This measurement shows any sensor "drift" or change in the lamp output.
Reference
18.
19.
20.
21.
22.
Stop the sensor.
Remove the Parafilm® and drain the water from the optical area.
Flush the optical area with DI water.
Wind Parafilm® around the metal near the optical area.
Break a small hole in the top of the Parafilm® and fill the optical area with fresh DI
water.
23. Supply power to the sensor and use the software to operate the sensor in
"Continuous" mode.
24. Start the sensor and collect 1 minute of data.
25. Record the measurement value.
26. Use the software to update the reference spectrum.
a. Go to the Sensor menu, then select Update Calibration.
b. Do the steps in the Calibration Wizard to update the reference spectrum.
27. If the measurement is ±2 µM (0.028 mgN/L) from the manufacturer-supplied
reference (±5 µM [0.056 mgN/L] for a 5 mm pathlength sensor), the sensor is within
the specification.
If the measurement is not within these specifications, do this procedure from step
9 until the measurement is within specification.
4.1.2 Update firmware
At regular intervals, make sure that the current firmware is installed in the SUNA. Go to
the seabird-coastal.com web site to get the current firmware for the sensor.
1. Save the firmware to the PC.
The firmware is an ".sfw" file.
2. Make sure that the sensor is connected to the PC and a power supply.
3. Push Connect.
4. Go to the Sensor menu, then select SUNA, then Advanced, then Upload Firmware
File.
5. Push Browse to find the firmware file that is saved on the PC.
6. Push Open.
7. Push Upload.
It takes approximately 2 minutes for the software to complete the upload.
21
Reference
8. The firmware is updated.
The software disconnects the sensor.
4.1.3 Temperature check
Make sure that the values of the temperature output of the HydroCAT sensor agree with a
known temperature value. The manufacturer recommends to do this check in water
because the temperature of water is more stable than air.
1. Make sure that the sensor is connected to a PC and the software and has power
supplied.
2. Make a note of the temperature of the water in which the sensor is submerged.
3. Push Temperature Check in the HydroCAT dashboard.
4. Enter the water temperature in °C the "Temperature" area.
5. Push Start.
The software takes a few minutes to collect data for the test. The results show in the
"Status" area.
6. Push Next. Make a "Temperature Check Report."
4.1.4 Zero conductivity frequency test
Make sure that the conductivity values of the sensor agree to tenths of one Hz with the
manufacturer-supplied calibration page values of the HydroCAT. This shows that the
conductivity cell is clean and operates within specifications.
1. If necessary, make sure that the sensor is connected to a PC and the software and
has power supplied.
2. If necessary, make sure that the conductivity cell is dry.
3. Push Conductivity Check in the HydroCAT dashboard.
4. Enter the "Calibration Zero Conductivity Frequency" value from the manufacturersupplied calibration page.
5. Push Start.
The software takes a few minutes to collect data for the test. The results show "Check
Complete" in the "Status" area.
6. Push Next to do the Standards test for conductivity.
4.1.5 Conductivity standard check
Make sure that the output values of the sensor agree with a standard solution.
1. Enter the value for the "Standard Conductivity."
2. Push Start.
The software takes a few minutes to collect data for the "Standard Check" test. The
results show "Conductivity Check Passed" in the "Status" area.
3. Push Next.
4. Enter the value from a previous conductivity check to compare to the current output
value.
5. Push Next.
6. Push Next.
22
Reference
The software makes a "Conductivity Check Report" that the user names and saves to
the PC
7. Push Finish.
4.2 Sensor dashboards
The dashboard is the main area from which to control and to communicate with the
sensor.
SUNA dashboard
HydroCAT dashboard
Information about the status of the sensor is contained in the upper part of the window
and is updated each time the sensor is connected to the software.
Common settings
•
•
•
•
•
•
Connect/Disconnect lets the user start and stop communication between sensor
and software.
Sensor Settings lets the user select options for a specific deployment.
Transfer Files lets the user move data saved on the sensor to a PC.
Replay Logged Data lets the user see data that was saved on a PC in a graph.
Start/Stop lets the user start and stop data collection.
Command Terminal lets the user send terminal program-level commands to the
sensor.
Sensor-specific settings
•
•
•
•
SUNA:Reference Update lets the user update the reference spectrum stored in the
sensor so that the sensor can accurately convert a spectral measurement into nitrate
concentration.
SUNA: Wipe Now lets the user operate the anti-fouling wiper for one revolution.
HydroCAT: Start Pumping operates the pump for 5 minutes if the sensor is in water.
HydroCAT: Temperature Check lets the user enter reference temperatures, collect
data, and make new reference values..
23
Reference
•
•
HydroCAT: Conductivity Check lets the user check that the conductivity reference
value.
HydroCAT: Deploy HydroCAT lets the user set a time and a date in the future for the
sensor to start data collection.
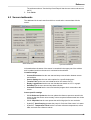
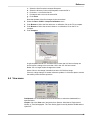
4.3 Preferences menu
The user can set up communication between the software and the sensor and change the
way data appears.
•
•
"Maximum Wakeup Attempts" lets the user select the number of times the software
will try to connect to a sensor. Range: 5–15.
"Response Timeout" is the interval of time between communication between the
sensor and the software. Range: 5–10.
Data that is collected by the sensor shows in any of the user-selected graphs in the
Performance Optimization Settings area.
Note: The software operates faster if the user selects only one graph.
If the user deselects the checkbox for "Enable Time Series Graph" for example, the graph
will still show in the main window, but collected data will not.
The software automatically saves files that have information about sensor use, data
collection, and software operation over time. This information helps the user and
Customer Support find problems and do troubleshooting.
24
Reference
When the "Display Dialog for Error Level Messages" box has a check in it, the software
saves one of five levels of error messages.
•
•
•
•
•
INFO—The default level. All high-level operations are saved.
ERROR—Minimum level. Only errors that need to be examined by the user or
Customer Support are saved.
WARN—Low level. The files that are saved do not have enough information for the
user to make an analysis of how the sensor is used and configured.
TRACE—The highest level. Used only for troubleshooting because very large files
are created.
DEBUG—High level. Used for troubleshooting.
"Daily Log Files"—all messages from a single day are saved in one file.
"Rolling Log Files"—all messages are saved in one file until it is the maximum size
specified by the user. The messages are then saved to a new file. The user specifies the
number of files to keep. The oldest files are erased first.
"Enable Logging Lost Bytes"—if this box has a check in it, the software saves all of the
unexpected output from the sensor to a file.
"File Location"—the operating system of the PC determines where these files are saved.
4.4 Sensor menu
The Sensor menus have options for each sensor that the software communicates with.
SUNA Sensor menu
HydroCAT Sensor menu
Refer to the section on Sensor dashboards on page 23 for more information about these
items and the Advanced menu items for the HydroCAT.
Advanced sensor menu items
25
Reference
•
•
•
•
•
•
•
•
•
26
SUNA: Edit Log Headers—lets the user put labels on log files.
SUNA: SUNA Self Test—the software does a test of the sensor function. The output
shows in the Instrument Console tab.
SUNA: DAC Calibration—does not apply to coastal deployments.
SUNA: Upload Firmware File—lets the user update the firmware in the sensor. Refer
to Update firmware on page 21 for details.
SUNA: Administrative Settings—for use by manufacturer
SUNA: Upload Instrument XML File—an .xml file necessary for the sensor to process
data. It is installed at C:\users\%username%\AppData\Roaming\Sea-Bird-Coastal
\UCI 1.0\SUNA_%SN%.xml.
HydroCAT: Pressure Offset—lets the user change the pressure offset value.
HydroCAT: Temperature Check—lets the user do a check of temperature values for a
reference.
HydroCAT: Conductivity Check—lets the user do a check of conductivity values for a
reference.
Reference
4.4.1 Create summary report
Get a summary of the settings saved in the sensor.
1. Select Summary Report.
2.
3.
4.
5.
Enter any comments about the report (optional).
Put a check in the "View Report" checkbox to see the report after it is created.
Push Browse to go to the directory in which to save the report.
Push Save Report.
A .pdf of the Summary Report is created.
27
Reference
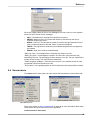
4.5 Data menu
The data menu has sensor-specific options for data management.
HydroCAT Data menu
SUNA Data menu
4.5.1 Files necessary to process data
Go to the Data menu to select how data is processed. The HydroCAT can only replay
data.
•
•
•
Use Convert Raw Data to change binary files into ASCII files.
Use Replay Logged Data to show a graph of saved data.
Use Reprocess Data to apply a different reference value or change the settings to
process the data.
The SUNA uses the three files below to process data:
1. The .xml package file that is stored in C:\users\%username%\AppData\Roaming\SeaBird-Coastal\UCI 1.0\SUNA_%SN%.xml.
2. The raw data file to process.
3. The reference spectrum file (optional for Replay Logged Data).
4.5.1.1
Reprocess SUNA data
The user may find that it helps to use the Reprocess Data option under some conditions.
•
•
•
The settings for the sensor were incorrect. Use the Reprocess option to correct for
this, such as when a sensor was deployed in seawater, but set up for fresh water.
The data that is collected has changed over an extended deployment. Data is
processed with an updated reference spectrum file, and compared to the original
reference.
Water temperature and salinity data are collected. These can be put together with the
spectral data from the sensor to get more accurate nitrate data (Sakamoto et al.
2009).
Note that the data files collected with SDI-12 do not contain spectral data and cannot be
reprocessed.
1. Start the software.
2. Go to the Data menu, then select SUNA, then Reprocess Data.
28
Reference
The Reprocessing Dashboard shows.
3. Push Browse to find the package file, the reference file, and the data file required to
reprocess the data.
4. "Processing Settings" are set by the manufacturer and usually do not need to be
changed.
5. Push Process Selected File(s).
The software starts to reprocess the data.
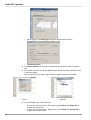
4.5.1.2
Convert SUNA raw data
The user can collect data in either an ASCII or binary format. Although binary files require
less storage space and are faster to transmit than ASCII, binary files are not humanreadable and must be converted. Use the software to convert binary to ASCII, and also to
"convert" ASCII files so that they contain sensor headers, tab delimiters, and other
information to help the user more easily do an analysis on the data.
1. Go to the Data menu, then SUNA, then Convert Raw Data.
2. If necessary, push Browse to find the .xml "Instrument Package File" that is saved on
the PC at "Users/username/AppData/Roaming/Sea-Bird-Coastal/UCI 1.0." A typical
file is "SUNA_xxx_001.xml, where xxx is the serial number of the sensor.
3. Put a check in the boxes next to the parameters to convert.
4. Push Browse to find the file of data to convert.
5. Push Browse to select the directory in which to save the converted data.
6. Push Options. More settings are available in a new window.
7. Select any options under Conversion Type.
29
Reference
•
•
"Output Field Delimiter"—select either comma or tab delimiter.
"Output Extra Header Information"—put a check to get an additional row of data
at the start of the output file.
• "Use Satlantic Data Logger Time Stamps"—put a check to add data and time
values from an attached data logger. This is not usually necessary because the
sensor includes this information in its output.
• "Output Frame Time Stamps"—put a check to add the time stamps from the data
frame to the output.
• "Output Frames with Sensor Conversion Errors"—put a check to remove any
frames that have a field that cannot be converted.
• "Single Output File per Frame Definition"—put a check to get all of the output in
one file. Usually there is one output file for each input file.
8. Select options under Output Format:
•
"Floating Point Conversion Type"—specify the floating point values in decimal or
scientific notation.
• "Floating Point Precision"—specify the number of significant digits in the floating
point value. Range: 0–10.
• "Suppress Non-numerical Output Values"—put a check so that text content does
not show in the output.
• "Format Frame Time Stamps"—put a check so that the time stamps print in
human-readable format.
• "Display Converted Data"—put a check so that the data shows in the graph area
of the software.
9. Select options under Error Checking:
•
"Frame Counter (if available)"—put a check so that the value increases by one
from frame to frame. Any increments larger than one will show in the Application
Console.
• "Check Sum (if available)"—put a check so that each frame is examined. Correct
frames have a zero entry in the checksum field. Incorrect frames are not
converted.
10. Push OK. The Conversion Options window closes.
11. Push OK. The Convert Raw Data Files to ASCII window closes.
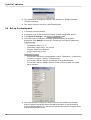
4.5.1.3
Replay saved SUNA data
Use Replay Logged Data to see the data that has been saved on the PC.
1. Push Data, then SUNA, then Replay Logged Data.
30
Reference
2. If necessary, push Browse to find the .xml "Instrument Package File" that is saved on
the PC at "Users/username/AppData/Roaming/Sea-Bird-Coastal/UCI 1.0." A typical
file is "SUNA_xxx_001.xml, where xxx is the serial number of the sensor.
3. Push Browse to find the "SUNA Raw Data File" to replay the data that is saved on
the PC.
4. Push Browse to find the current "SUNA Calibration File" on the PC. A typical file is
SUNA_xxxn.CAL, where xxx is the serial number of the sensor, and n is the
calibration version.
5. Push Finish.
6. The saved data shows in the Time Series tab.
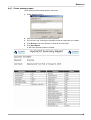
4.5.2 Replay saved HydroCAT data
Use Replay Logged Data to see the data that has been saved on the PC.
1. Push Data, then HydroCAT, then Replay Logged Data.
31
Reference
2. Push Browse to find the file to replay that is saved on the PC.
3. Push OK.
4. The saved data shows in the Time Series tab.
4.5.3 Compare reference spectrum files
Compare the change between two reference spectrum files. The amount of change is
related to the time interval between the updates and the amount of lamp use during that
time.
Note that this procedure is done automatically by the software when the user updates the
reference spectrum for the sensor. Refer to Update reference spectrum on page 19 for
more information.
1. Find the two files to compare:
a. Push Transfer Files in the SUNA Dashboard area.
b. Select the Calibration Files tab.
32
Reference
c.
d.
e.
f.
g.
2.
3.
4.
5.
Select the first file under Instrument filesystem.
Select the directory in the Local filesystem to save the file in.
Push the <-- to move the first file.
Do steps d and e to move the second file.
Push Close.
Note that the date of the files changes to the current date.
Select the Data > SUNA > Compare Calibration menu
Push Browse to find to the first reference, or calibration, file on the PC to compare.
Push Browse to find to the second reference, or calibration, file on the PC to
compare.
Push Compare.
A typical update interval of 3–6 months with no more than 100 hours of lamp use
should cause a change of no more than 10% in the 215–240 nm interval.
Below 215 nm, larger relative changes are normal.
Above 240 nm, the change is smaller than at the 215–240 nm range.
If there is a large change, do several reference updates 12–24 hours apart to monitor
the stability of the reference spectrum.
4.6 View menu
Dashboards—Go to the View menu and Dashboards, to select the dashboard for a
specified senor.
Graphs—Go to the View menu and select from Spectra, Absorbance, Reprocessed
Nitrate, or Time Seriesgraphs. The Time Series graph is used by both the SUNA and the
HydroCAT.
33
Reference
Output—Go to the View menu and select Instrument Console to see the data collected
by the sensor. Select Application Console to see terminal-level communications.
HydroCAT: select Post-processed Console.
Instrument Console
Application Console
Real Time Data—From the View menu, select Real Time Data to select the parameters
that the specific sensor will use for data collection.
Data Logging—Go to the View menu and select Data Logging to select the location on
the PC that the collected data is saved.
Data Acquisition Monitor—Use for troubleshooting.
34
Reference
4.7 Window menu
The user can change how the software shows different tabs.
•
•
•
•
Close Window—closes the selected tab (highlighted in blue).
Close all Documents—closes all tabs except the UCI Dashboard.
Configure Window—
Maximize: increases the size of the selected tab to fill the software screen size.
Float: unlocks the selected tab from the software screen so that the user can move it
to other locations on the PC screen.
Float Groups: the same as Float above, but all tabs that are open are unlocked so
that the user can move them to other locations on the PC screen.
Minimize: Minimizes the selected tab and moves it to the side of the software screen.
Minimize Group: minimizes the open tabs in the "Console," "Dashboard," or "Graph"
areas of the software.
Dock: locks the tab that the user selected to "float" back in its previous position in the
software window.
Dock Group: the same as Dock above, but all tabs that are open are locked back into
their previous position in the software window.
Reset Windows: all tabs go to their initial location in the software when the software
started.
4.8 Help menu
Go to the Help menu for help with sensor operation, settings in the software, and
troubleshooting. Select Sea-Bird Coastal to go to the manufacturer's web site.
35
Reference
36
Section 5
Troubleshooting
5.1 SUNA general troubleshooting
WARNING
Nitrate sensors use an ultraviolet (UV) light. Do not look directly at a UV light when it is on. It can damage the eyes. Keep
products that have UV light away from children, pets, and other living organisms. Wear polycarbonate UV-resistant safety
glasses to protect the eyes when a UV light is on.
Possible problem
Sensor does not appear to be on
Possible solution
Check that the cable is connected and the power source is on.
Turn the sensor off for at least 60 seconds. Turn the power on again. If the sensor still
does not appear to be on, use a different cable.
Check that the voltage supplied to the sensor is between 8–15 VDC with at least 1 amp of
current. Check the cable voltage: put the leads of a DMM in DC voltage mode at contacts
1 (+) and 2 (-) of the cable to see if there is voltage. If not, use a different cable.
Check the mode of operation. The sensor may be in an unknown mode. Start a terminal
program, supply power to the sensor, and type "$" then "Enter" three or more times. A
prompt from the sensor shows.
Check the cable for continuity. Refer to the sensor specifications for connector functions.
Check the power consumption. Use a power supply with an accurate digital current
indicator.
•
•
•
current > 500 mA at 12V: sensor is in data collection mode. Put a piece of white
paper into the optical area and make sure that there is a blue spot. If there is not, the
sensor may be in an unknown mode or there is a system failure.
current > 5 mA: sensor is in "standby" mode and gives a result over the RS232 input.
current >100 µA: sensor is not in operation. Contact Customer Support.
5.2 SUNA operation troubleshooting
Possible problem
Possible solution
Self-test fails for internal
humidity
Monitor the sensor and do a sensor self-test at regular intervals. Make sure that the
sensor is not attached to any frame so tightly that the pressure housing is out-of-round.
Self-test fails for low spectrum
average or high dark counts
Clean the optical windows with a low-lint swab or tissue and isopropyl alcohol.
The average value in DI water is within specifications shown below.
•
•
•
Baseline "drift"
Dark spectrum: 500–1000 counts, with a standard deviation of no more than
12 counts.
Maximum light spectrum: no more than 55000, with no more than 60-count standard
deviation.
Average light spectrum: approximately 10000–15000 counts, with ranges to at least
20000 counts. An average value of <10000 may mean that the optical windows are
dirty or stained, or that the lamp is degraded.
Check if the lamp is degraded. Apply drift corrections if the rate is approximately
0.004 mgN/L per hour of lamp "on" time.
Wiper does not operate correctly •
•
•
•
Make sure that there is a check in the box for "Integrated Wiper Enabled" in the
General tab of the Settings tab of the software.
Check the alignment of the wiper brushes and make sure that the wiper is not bent
If the wiper is from another manufacturer, check that the battery contacts are
functional.
Contact Customer Support for further help.
37
Troubleshooting
5.3 SUNA communication troubleshooting
Possible problem
Possible solution
Collected data is different from
transmitted data
•
•
•
Check the clock settings in the sensor.
Make sure that there is no extra averaging or data collection in the setup.
Check the data output settings.
Problems with sensor-tosoftware communication
•
•
Make sure that the sensor-PC cable is connected correctly.
Make sure the current software and firmware are installed.
Self-test fails to complete
Make sure that the sensor has an external power source; external power is necessary to
turn on the lamp.
5.4 SUNA warnings and error messages
Possible problem
Possible solution
Data warnings and error
messages
Contact Customer Support. If possible, have the information listed below:
Negative nitrate concentration
Clean the optical area and check the reference spectrum. Apply a new one if necessary.
•
•
•
•
•
screenshot of the "Application Console" of the software.
"messages.log" file—go to the Transfer Files window and select the Log Files tab.
Copy the file to the PC for Customer Support.
Make sure that the sensor is in water.
Check that the "Deploy in Fresh Water" box has the appropriate check in it.
Check for salinity compensation.
Analysis of nitrate standard shows Check that the nitrate standard concentrations are accurate. Make sure the dilutions
sensor is possibly out of
were done correctly and that the standards are used within 1 week (in the lab) or before
specification
expiration (unopened standards). Verify that the standards were made in comparable
units (mg/L as nitrogen or µMoles).
Check the sensor settings. Make sure that the "Deployed in Fresh Water" setting has a
check in the box if the sensor operates in fresh water.
Poor correlation with field samples Check the sensor for fouling or lamp change ("drift"). Clean the optical windows and do a
(grab samples)
blank check.
•
•
Set the sensor to do a self-test. Check light:dark counts, such as high CDOM or
other absorbers and other data about the sensor.
Check for matrix interferences that can cause measurement errors. Do
measurements for a wider range of constituents an do possible lab matrix spikes to
isolate the cause.
Check the representativeness of the data collection site. If the data from the sensor does
not agree with grab samples but shows good performance, the site may not be
representative of conditions, or the water is not well mixed.
Data collection rate is very slow
Check if the internal memory is on. Data collection starts after approximately 5 seconds.
Check if the "adaptive integration" is on. Data collection starts after approximately
500 milliseconds (20 × "integration period").
Nitrate values are not stable
38
•
•
•
Check that the optical area is not blocked with debris.
Check that the wiper functions correctly.
Clean and dry the optical area.
Troubleshooting
Possible problem
Nitrate value are frequently "-1" or
"NAN"
Possible solution
Check that the lamp intensity is sufficient. Measure the spectrum in DI or tap water.
Maximum output is > 10000. For best case, > 30000.
Check the data: if the maximum is < 1000 and the lamp intensity is sufficient, the water
sample is optically dense.
SELFTEST alert for lamp intensity Check the sensor for high internal humidity. Do a "selftest":
or high humidity
if humidity is > 50%, the sensor may have a leak. Contact Customer Support.
if humdity is > 30%, the sensor is probably ok. Contact Customer Support.
39
Troubleshooting
40
Section 6
General information
Revised editions of this user manual are on the manufacturer's website.
6.1 Service and Support
The manufacturer recommends that sensors be sent back to the factory annually to be
cleaned, calibrated, and for standard maintenance.
Refer to the website for FAQs and technical notes, or contact the manufacturer for
support at:
[email protected]
Do the steps below to send a sensor back to the manufacturer.
1. Contact the manufacturer for a Return Merchandise Authorization (RMA).
Note: The manufacturer is not responsible for damage to the sensor during return shipment.
2. Remove all anti-fouling treatment from the sensor before sending it back to the
manufacturer.
Note: The manufacturer will not accept sensors that have been treated with anti-fouling
compounds for service or repair. This includes tri-butyl tin, marine anti-fouling paint, ablative
coatings, etc.
3. Use the sensor's original ruggedized shipping case to send the sensor back to the
manufacturer.
4. Write the RMA number on the outside of the shipping case and on the packing list.
5. Use 3rd-day air to ship the sensor back to the manufacturer. Do not use ground
shipping.
6. The manufacturer will supply all replacement parts and labor and pay to send the
sensor back to the user via 3rd-day air shipping.
41
General information
42
Sea-Bird Coastal
13431 NE 20th Street
Bellevue WA 98005 U.S.A.
sales (425) 401-7653
support (425) 401-7654
[email protected]
www.sea-birdcoastal.com
©
Satlantic, Inc., 2015. All rights reserved. Printed in USA.