1
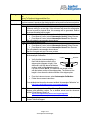
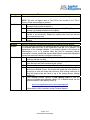
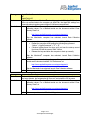
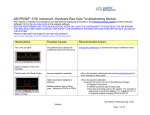
To navigate within this document
use the
or
keys
ABI PRISM® 310 Genetic Analyzer
Errors Encountered on the ABI PRISM® 310 Genetic Analyzer
BEFORE PERFORMING ANY TROUBLESHOOTING WORK ON YOUR ABI PRISM® 310
GENETIC ANALYZER, PLEASE READ THE INSTRUMENT USER’S MANUAL FOR SAFETY AND
WARRANTY INFORMATION AND FURTHER DETAILS ON USE OF THE SYSTEM.
NOTE: Text in this fashion indicates a link to a picture or another section of this/another document.
Please contact AB Technical Support if you have any questions regarding this procedure.
About Errors Encountered on the ABI PRISM® 310 Genetic Analyzer
The ABI PRISM® 310 Genetic Analyzer consists of various subsystems including: communication,
data processing, electrophoresis, signal detection, sample movement, and temperature control.
When certain subsystems fail or encounter difficulties, the software generates error messages, which
may be helpful in determining a resolution. The purpose of this document is to introduce some errors
commonly encountered on the system, provide context on how/why the problem occurred, and
suggestions to resolve the error.
Errors
Note: Click on the error message to jump to the appropriate page. Error messages are organized
alphabetically.
Error Message
“Alert from Instrument: Cannot Move Motor Beyond MaxPos”
“Alert from Instrument: EP Current is Fluctuating – Possible Bubbles in Capillary”
“Alert from Instrument: EP Current is Zero”
“Alert from Instrument: Insufficient Gel Remaining to Complete the Next Injection”
“AppleTalk Not Connected” or “AppleTalk is Off”
“Autosampler Time Out”
“Detected Error Related to Syringe Pump”
“Incorrect Color Index”
“Leak Detected in the Syringe Pump”
“Move To Position is Bigger and Max Pos”
“No Communication: Retrying Communication with Instrument”
“SCIDRV Err: Line Buffer Overflow”
“Step Time Too Short to Execute Function”
“Type 1 Error”
“Type 2 Error”
“Unable to Reach Set Temperature”
“-108: Out of Memory”
Page 1 of 13
310 Analyzer Error Messages
Page
2
3
4
4
5
5
6
6
7-9
2
9
10
10
11
11
12
12
Message
Context
Resolution
Alert from Instrument: Cannot move motor beyond MaxPos
or
Move To Position is bigger and Max Pos
The Data Collection software is unable to move the autosampler to the desired
position because it perceives the desired position as beyond its maximum set points.
If the error is received while in Manual Control
If you are trying to move the autosampler up or down, verify that the
1
increment setting is not too high. If the command will cause the autosampler
to move beyond its physical limits, this message will be generated. Reduce
the increment setting and try again.
If this does not resolve the problem, perform the following:
2
From Manual Control, select Autosampler Home X,Y then Execute.
From Manual Control, select Autosampler Home Z then Execute.
This will update the autosampler home values.
If the error is received during a run
Cancel the run then home the Autosampler:
1
From Manual Control, select Autosampler Home X,Y then Execute.
From Manual Control, select Autosampler Home Z then Execute.
This will update the autosampler home values.
Start the run again and see if the error persists.
If the error persists, verify the proper placement of the electrode then perform
2
the Autosampler Calibration:
Capillary
Electrode
Verify that the electrode/capillary is
flush with the bottom surface of the
stripper plate (diagram at right). If the
electrode is too high above the bottom
surface, install a new electrode and trim
it so that it is flush. NOTE: The maximum trim length is flush
with the bottom surface of the stripper plate. The minimum trim
length is 1mm above the bottom surface of the stripper plate.
From the Instrument menu, select Autosampler Calibration.
Follow the on-screen instructions.
For a detailed tutorial see the document entitled “Autosampler Calibration” at:
http://home.appliedbiosystems.com/support/apptech/
3
If the error persists, perform a Clear Memory Reset to clear the instrument
firmware and calibration values. For a detailed tutorial see the document
entitled “Clear Memory Reset” at:
http://home.appliedbiosystems.com/support/apptech/
4
The autosampler motor and/or control system may be malfunctioning.
Contact Technical Support.
Page 2 of 13
310 Analyzer Error Messages
Message
Context
Resolution
Alert from Instrument: EP current is fluctuating – possible bubbles in capillary
When the current fluctuates outside of the expected range the error is generated.
Typical run current should hold fairly stable within the 4 - 8 µAmp range (depending
upon POP-4™ or POP-6™ polymer and the capillary length). It is important to remedy
all possible causes of the current fluctuation, as there may be more than one culprit.
Make fresh 1x running buffer and ensure adequate volume/ionic strength in
1
the anode buffer jar and vial position 1.
Ensure there is no liquid or condensation around the
2
junction of the septa/white cap/sides of the vial at position
1. If present, separate the components, dry them
completely with a lab wipe, and reassemble the parts.
NOTE: This is the most common site for arcing to occur.
3
4
From Manual Control or an Injection List, perform a SeqFillCapillary module
to purge any possible bubbles from the capillary. It may be a good idea to
perform this 2 – 3 times to ensure adequate purging. Also check for and
remove any bubbles that may be in the polymer channel inside the pump
block.
Inspect the 310 Analyzer for any other visible signs of electrical arcing at:
Autosampler Tray Carrier – this is the white carrier upon which the
sample tray sits. Specifically, look at the exterior and interior of the
tray carrier for carbon residue (black marks).
Autosampler Arm – this is what holds up the tray
carrier. Look for carbon residue on the outside
surface of the arm.
Electrode Thumbscrew – this is what holds the
electrode in place. Carefully remove the
thumbscrew and inspect the surface for damage,
corrosion, or burning.
Gel Block – the anode connection. Carefully
inspect the gel block channel for a brownish haze or
black particulates, which may indicate arcing
residue.
What to do if signs of arcing are present::
REPLACE all parts that show arcing damage. Cleaning typically is
not enough and continued use of suspect parts will likely continue
arcing (and leaking).
ENSURE the vials, septa, trays, sample tubes, and other components
are clean and dry.
If possible, avoid a humid environment or utilize air conditioning to
avoid environmental factors that increase the chances of arcing.
5
6
It is possible that the capillary may be compromised (persistent bubble,
cracked, or non-conductive). Replace the capillary with a new one and test
run to reproduce the error.
If the error persists, obtain the instrument run log and contact Technical
Support.
Page 3 of 13
310 Analyzer Error Messages
Message
Context
Resolution
Message
Context
Resolution
Alert from Instrument: EP current is zero
The instrument has determined that there is no electrical current during a run.
NOTE: This error will appear when a Test-CCD-4 Color module is run. This is
normal. OK the error message to continue.
Make fresh 1x running buffer and ensure adequate volume/ionic strength in
1
the anode buffer jar and vial position 1.
From Manual Control or an Injection List, perform a SeqFillCapillary module
2
to purge any possible bubbles from the capillary.
It is possible that the capillary may be compromised (persistent bubble,
3
cracked, or non-conductive). Replace the capillary with a new one and test
run to reproduce the error.
If the error persists, obtain the instrument run log and contact Technical
4
Support.
Alert from Instrument: Insufficient gel remaining to complete the next injection
The Data Collection software has determined that the syringe max travel value will
be exceeded before the end of the injection/run and the run is paused. The
appearance of the message indicates: 1) not enough polymer in the syringe to
start/complete a run or 2) potential leaks that may be increasing polymer
consumption. It is also possible that samples added after a run has been started did
not take into account the amount of polymer in the syringe.
Check for leaks and tighten fittings if necessary. Resolve leaks before
1
continuing with the next step.
Add polymer to the syringe if it is low. Be sure to purge any bubbles in the gel
2
block that may have been introduced by the syringe.
If the run was paused, resume the run. If it was cancelled, start the run again.
3
If the message persists, cancel the run, then perform the Syringe Home
4
function from Manual Control. This function will update the home position of
the syringe in case the system has lost track. After homing, make sure to
bring the syringe pump arm back on top of the syringe plunger. Attempt
another run.
If the message persists, perform a Clear Memory Reset to clear the
5
instrument firmware and calibration values. For a detailed tutorial see the
document entitled “Clear Memory Reset” at:
http://home.appliedbiosystems.com/support/apptech/
If the problem is still not resolved, contact Technical Support.
Page 4 of 13
310 Analyzer Error Messages
Message
Context
Resolution
AppleTalk Not Connected
or
AppleTalk is Off
AppleTalk® system is a Macintosh® networking protocol. While the 310 Analyzer
does not communicate to the computer via AppleTalk, the AppleTalk settings can
potentially disrupt regular communication if it becomes compromised.
Perform a Clear Memory Reset to clear the instrument firmware and
1
calibration values. For a detailed tutorial see the document entitled “Clear
Memory Reset” at:
http://home.appliedbiosystems.com/support/apptech/
2
3
After the Macintosh® computer has rebooted, launch Data Collection
software.
If the error persists, clear (or “zap”) the parameter RAM (pRAM):
Restart the computer while keeping the following keys pressed:
“Option” + “Apple/Command” + “P” + “ R”
Continue holding these four keys until you hear the start-up sound
four times OR see the screen “flash” 4 times.
Release the keys and allow the computer to boot up normally.
After the Macintosh® computer has rebooted, launch Data Collection
software.
If the error persists, trash the preferences file and reset it. For a detailed
tutorial see the document entitled “310 Preferences” at:
http://home.appliedbiosystems.com/support/apptech/
4
Message
Context
Resolution
After the Macintosh® has rebooted, launch Data Collection software.
If the error persists, contact Technical Support.
Autosampler Time Out
Each axis (X, Y, and Z) has a home sensor. If the autosampler does not find one of
the home sensors, the autosampler will “time out” and cause the 310 to pause.
Perform a Clear Memory Reset to clear the instrument firmware and
1
calibration values. For a detailed tutorial see the document entitled “Clear
Memory Reset” at:
http://home.appliedbiosystems.com/support/apptech/
2
If the error persists, contact Technical Support.
Page 5 of 13
310 Analyzer Error Messages
Message
Context
Resolution
Detected Error Related to Syringe Pump
When this error is seen, the run is usually paused. The broad nature of the message
does not indicate what the cause is. Try the following suggestions to resolve the
problem.
From Manual Control, select Syringe Home then Execute.
1
This will send the syringe pump arm to its uppermost (home) position.
From Manual Control select Syringe Down and enter a value in the value
2
box then Execute. Using decreasing increments, bring the syringe pump arm
back on top of the syringe plunger.
Start a run. If the error persists, perform a Clear Memory Reset to clear the
3
instrument firmware and calibration values. For a detailed tutorial see the
document entitled “Clear Memory Reset” at:
http://home.appliedbiosystems.com/support/apptech/
If the problem is still not resolved, contact Technical Support.
Message
Context
Resolution
Incorrect Color Index
This error may occur after the service engineer performed a CCD calibration.
Previous data in the CCD camera may not have been completely cleared from its
memory, so the data is different from what the Data Collection software is expecting.
This will cause an “Incorrect Color Index” error.
Ensure that the serial communication cable from the computer to the 310
1
Analyzer is not near a strong electrical/magnetic field. Interference with the
communication may compromise the data traveling between the two.
From Manual Control, select Cold Boot Instrument then Execute. A dialog
2
box will appear indicating firmware is being sent to the instrument. Wait for
this to complete. From Manual Control, send the following commands:
Syringe Home then Execute
Autosampler Home X,Y then Execute
Autosampler Home Z then Execute
3
Alternatively, you can also perform the cold boot by:
Quitting Data Collection software then shutting down the computer.
Turn off the 310 Analyzer .
Hold the Tray button down for 10 seconds while you turn the 310
Analyzer on.
Restart the computer and launch Data Collection software. The
firmware will reload.
From Manual Control, select Syringe Home then Execute.
From Manual Control, select Autosampler Home X,Y then Execute.
From Manual Control, select Autosampler Home Z then Execute.
If the error persists, contact Technical Support.
Page 6 of 13
310 Analyzer Error Messages
Message
Context
Resolution
Leak detected in the syringe pump
A leak is detected if the gel pump moves a greater distance than expected. Normal
polymer usage is approximately 4-7µl per injection which is equivalent to 1-2
encoder counts for the 1.0 mL syringe or 5-10 encoder counts for the 250µL syringe
(seen in the instrument run log). Actual leaks can occur at various locations on the
system and should be carefully examined. The message may sometimes be
generated by conditions on the system that mimic a leak – these also need to be
considered.
Verify and resolve the following conditions that mimic a leak
Bubbles – Since the gel pump moves polymer by
1
compression, bubbles of sufficient size can also be
compressed, causing the syringe to
move faster than expected, which in
turn causes a leak error. Isolate and
remove any bubbles found in the
syringe or within the polymer channel
inside the pump block.
Pump Arm – Ensure that the pump arm is positioned
2
properly above the syringe plunger. The pump arm may
have been homed or moved, but never brought back on top
of the syringe (picture at right). If a run is started in this
condition, the pump arm will move down quickly, find little
resistance, and generate a leak error.
Verify and resolve potential leaks at the following locations
Capillary Fitting – This is the most
1
common place for leaks to occur.
Ensure the fitting is properly cleaned
and is finger-tight. The fitting is secure if
the capillary cannot be pulled out by
hand.
If the fitting cannot secure the capillary
or leaks continue, replace the fitting as it may be cracked or warped, or
the threads may be stripped.
Ensure that the area of the block where the fitting resides is clean and
free from residue. If build-up is present, soak and flush the block in warm
water.
Try installing another capillary to ensure the capillary is within spec.
If this does not stop the leaking, replace the pump block as microscopic
fractures/cracks may have formed. To prevent damage to the block, avoid
over-tightening the capillary fitting, and do not subject the pump block to
organic solvents or boiling water.
Page 7 of 13
310 Analyzer Error Messages
2
Block Fittings – Inspect the upper and lower block
fitting for leaks.
Ensure the fittings are properly cleaned and fingertight.
Verify the o-rings are intact and not compromised.
If the fitting threads are stripped, the fittings will not
secure properly. Replace the fittings as necessary.
3
Anode Buffer Jar / Pin Valve – Inspect the anode buffer jar
and pin valve for leaks.
The pin valve/pump block must be properly attached to
the instrument. The pin valve has an upper and a lower
head. The silver toggle arm of the 310 Analyzer must sit
between the upper and lower heads to function properly.
Check that the volume of the buffer jar does not change.
If the volume increases dramatically, polymer may be
leaking into the jar.
To perform a leak test, remove the buffer jar from the
pump block. Dry the pin valve area with a laboratory
wipe. Run a SeqFillCapillary module then inspect the pin valve area for
signs of polymer leakage. If polymer is present then a leak is occuring. To
remedy the leak, the following options may work:
Soak and flush the block in warm water.
Remove and replace the pin valve.
It is possible that the solenoid controlling the pressure of the silver
toggle arm needs calibration.
Lastly, damage to the block can prevent a proper seal. Replace the
pump block as microscopic fractures/cracks may have formed. To
prevent damage to the block, avoid over-tightening the capillary fitting,
and do not subject the pump block to organic solvents or boiling
water.
4
Syringe – The polymer syringe can also leak. Inspect the
following areas:
Syringe Plunger: The average syringe has a functional
life of 3 months. Wear and tear on the plunger tip may
cause polymer to leak around the tip and along the sides
of the glass barrel (right). If this leak is severe enough,
the error may be generated.
Syringe Fitting: The syringe locks into the pump block via
a metal neck. A bushing and TWO o-rings must
be properly installed to prevent leakage. One oring goes around the bushing. The other o-ring sits behind the
bushing.
Page 8 of 13
310 Analyzer Error Messages
5
Syringe/Block Connection – Leaks can also occur at the connection where
the syringe attaches to the block. Ensure the following:
The syringe is assembled properly with the bushing and two o-rings.
The syringe is attached to the block with finger-tight pressure and that the
threads have not been crossed.
Always tighten the syringe while grasping the metal neck never the glass
barrel. Tightening by the glass barrel may shear the glass free from the
metal neck rendering the syringe useless.
6
Capillary – If the capillary develops a crack, leakage can occur. Open the
detection window and the heat plate door and carfefully inspect the entire
capillary for any signs of breakage. Replace as necessary.
Pump Force Calibration – The 310 Analyzer gel pump presses down on the
syringe with a specific amount of force. If the pump force value was changed
or if the calibration is incorrect, the gel pump may be pushing down with an
excessive amount of force, and causing a leak. To ensure this is not
happening, from Manual Control confirm that the value for the “Syringe (Gel)
Pump Force” matches the value on the calibration sticker. Perform a Clear
Memory Reset to clear the instrument firmware and calibration values. For a
detailed tutorial see the document entitled “Clear Memory Reset” at:
7
http://home.appliedbiosystems.com/support/apptech/
If the problem is still not resolved, contact Technical Support.
Message
Context
Resolution
No communication: Retrying communication with instrument
The communication between the 310 Analyzer and the computer has been
compromised in some fashion. The Data Collection software generates this error
while waiting for a signal from the instrument.
There are a variety of possible causes for this error. They include:
Cable connection problems
Boot-up/shut-down sequence problems
Preferences/settings
Drivers/configuration problems
Power failure
Network interference
Corrupted firmware
For a detailed tutorial to re-establish communication, please see the document
entitled “Resolving Communication Problems” at:
http://home.appliedbiosystems.com/support/apptech/
If the problem is still not resolved, contact Technical Support.
Page 9 of 13
310 Analyzer Error Messages
Message
Context
Resolution
Message
Context
Resolution
SCIDRV Err: Line buffer overflow
The common misconception is that this error is referring to a “liquid” buffer
overflowing, when in reality, it is referring to a “memory” buffer. This error is
generated by the 310 Analyzer firmware but its exact cause is unknown. However,
there are some commonalities associated with the error:
More frequently seen when running dye set F applications.
Typically preceded by samples with very large primer peaks and/or
extremely high signal strength.
Seen regardless of a Macintosh® or Windows® controlled computer.
Implementing the following resolutions should mitigate most incidences of the error.
As a quick fix, try re-injecting the sample. If the cause was due to excessive
1
signal, the second injection should be reduced since a portion of the DNA has
already been injected.
Another quick fix would be to increase the dilution factor of the sample OR
2
decrease the injection time of the sample to reduce the excessive signal.
It is also possible that the serial cable from the computer to the 310 Analyzer
3
is compromised. Try installing a different serial cable to remedy the problem.
To address a more systemic problem, quantitate and confirm the appropriate
4
DNA quantity in the initial PCR reaction. Prevent overloading the reaction to
prevent overloading the capillary.
Clean up the samples (columns or other purification system). Remove
5
excess unincorporated dyes to reduce excessive signal.
Step Time Too Short to Execute Function
This error can occur as a result of the syringe trying to move beyond the syringe
max travel value. The syringe drive will then pump with a higher force that can push
all of the polymer out of the syringe and into the anode buffer jar even when the
buffer valve is closed.
From Manual Control, select Cold Boot Instrument then Execute. A dialog
1
box will appear indicating firmware is being sent to the instrument. Wait for
this to complete. From Manual Control, send the following commands:
Syringe Home then Execute
Autosampler Home X,Y then Execute
Autosampler Home Z then Execute
2
Alternatively, you can also perform the cold boot by:
Quitting Data Collection software then shutting down the computer.
Turn off the 310 Analyzer.
Hold the Tray button down for 10 seconds while you turn the 310
Analyzer on.
Restart the computer and launch Data Collection software. The
firmware will reload.
From Manual Control, select Syringe Home then Execute.
From Manual Control, select Autosampler Home X,Y then Execute.
From Manual Control, select Autosampler Home Z then Execute.
If the problem is still not resolved, contact Technical Support.
Page 10 of 13
310 Analyzer Error Messages
Message
Context
Resolution
Message
Context
Resolution
Type 1 Error
This is a Macintosh® OS only problem. It is known as a “bus error” (a “bus” is a
subsystem that transfers data or power between computer components or between
computers). This means the computer tried to access memory that doesn’t exist or
isn’t available.
Allocate more RAM memory to the program:
From the hard drive, navigate to the program in question. Ensure that the
1
program is not running (you should not be able to see it from the Finder).
Single-click on the program icon (Data Collection or Analysis program for
2
example) then click on File and choose Get Info. (If there is a Memory subselection choose that).
Highlight the “Preferred Size” field and increase it by 20-30% more than the
3
“Suggested” Size. Set the “Minimum Size” to the same number in the step
before.
Close the window then monitor if the error is generated again.
4
Zap the parameter RAM:
Restart the computer while keeping the following keys pressed:
1
“Option” + “Apple/Command” + “P” + “ R”
Continue holding these four keys until you hear the start-up sound four times
2
OR see the screen “flash” 4 times.
Release the keys and allow the computer to boot up normally.
3
Type 2 Error
This is a Macintosh® OS only problem. It is known as an “address error”. Data was
written to the wrong place in memory or the system is trying to access data at the
wrong address.
Allocate more RAM memory to the program:
From the hard drive, navigate to the program in question. Ensure that the
1
program is not running (you should not be able to see it from the Finder).
Single-click on the program icon (Data Collection or Analysis program for
2
example) then click on File and choose Get Info. (If there is a Memory subselection choose that).
Highlight the “Preferred Size” field and increase it by 20-30% more than the
3
“Suggested” Size. Set the “Minimum Size” to the same number in the step
before.
Confirm CPU/Operating System compatibility:
Confirm that the program generating the error is supported on the
1
CPU/Operating System in question.
If the program is unsupported/untested, try installing the program on a
2
CPU/Operating System that is supported.
Run Norton® Utilities Disk Doctor
Run the appropriate version of Norton® Utilities Disk Doctor to scan the hard
1
drive for damaged or corrupted files. You may need to reinstall the program.
Page 11 of 13
310 Analyzer Error Messages
Message
Context
Resolution
Unable to reach set temperature
The 310 Analyzer utilizes a heat plate to control for consistent run temperatures
during a run. Consistent run temperature is a critical factor for reproducible fragment
analysis and sequencing runs. This error indicates that the heat plate system is
unable to stabilize the heat plate at the desired set temperature. NOTE: The 310
Analyzer should be situated in an environment where the temperature can be
maintained between 15-30°C (58-86°F).
Verify that the instrument is situated in an environment where the temperature
1
is maintained between 15-30°C (58-86°F).
Ensure that the instrument is not sitting in the direct pathway of a cooling vent.
2
If a custom run module is in use, perform a test run with a default run module,
3
to ensure the set temperature is not out of range.
Perform a Clear Memory Reset to clear the instrument firmware and
4
calibration values. For a detailed tutorial see the document entitled “Clear
Memory Reset” at:
http://home.appliedbiosystems.com/support/apptech/
If the problem is still not resolved, contact Technical Support. The heat plate
assembly may need repair/replacement.
Message
Context
Resolution
-108: Out of Memory
This error indicates there is insufficient RAM memory to run a program. It is typically
seen at either the beginning of a run or towards the end of a series of runs. Users
who do not frequently restart their computers will be more susceptible to this error.
While the message does not indicate which program has caused the problem, in
many cases the launching of the analysis program (Sequencing Analysis or
GeneScan® software) is the likely culprit. Another possibility is if other programs are
running concurrently which uses up the available RAM.
Restart the computer. This will clear up the available RAM memory.
1
As a preventative measure, restart the computer before every run.
2
An alternative is to increase the virtual memory on the computer and allocate
3
more RAM memory to each program.
Contacting AB Technical Support
By Telephone: 1-800-831-6844
http://www.appliedbiosystems.com/support/
By Internet:
Then click on “Frequently Asked Questions” and then the “Ask a Question” tab.
By E-mail:
[email protected]
Page 12 of 13
310 Analyzer Error Messages
For Research Use Only. Not for use in diagnostic procedures.
Applied Biosystems, ABI PRISM, and GeneScan are registered trademarks and AB (Design), POP-4, POP-6,
and Applera are trademarks of Applera Corporation or its subsidiaries in the US and/or certain other countries.
All other trademarks are the sole property of their respective owners.
Page 13 of 13
310 Analyzer Error Messages