1
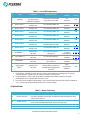
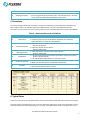
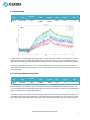
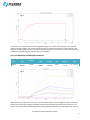
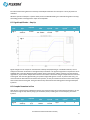
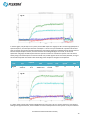
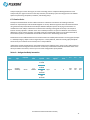
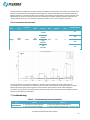
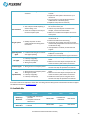
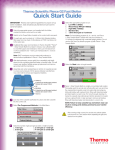
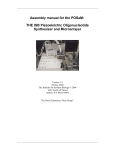
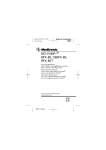
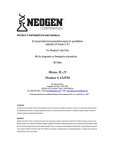
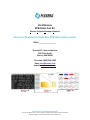
USER MANUAL SPRI DEMO CHIP KIT SURFACE PLASMON RESONANCE IMAGING GUIDE TO A DEMONSTRATION OF REAL SPRI-BASED ARRAY ASSAYS ID NO: _________________ PLEXERA LLC – APPLICATIONS LAB 401 TERRY AVE N SEATTLE, WA 98109 TELEPHONE: (206) 732-1382 EMAIL: [email protected] WEBSITE: WWW.PLEXERA.COM Solutions for Functional Proteomics The screening, affinity, kinetics, and concentration of ligands and analytes are measured with the highest throughput and array density of the label-free SPRi system Contents 1. Introduction ................................................................................................................................ 2 2. Demo Chip Kit Description .......................................................................................................... 3 3. Demo Chip Kit Components ........................................................................................................ 3 Table 1 – List of Kit Components ................................................................................................. 4 4. Instructions ................................................................................................................................. 4 Table 2 – Demo Chip Setup ......................................................................................................... 4 5. Procedures .................................................................................................................................. 5 Table 3 – Method and Procedure Guidelines .............................................................................. 5 6. Typical Cases ............................................................................................................................... 5 6.1. Strong Binding ...................................................................................................................... 6 6.2. Weak Binding ........................................................................................................................ 7 6.3. Small-Large Molecule Interactions ....................................................................................... 7 6.4. Cross Reactivity and Multiple Interactions........................................................................... 8 6.5. Signal Amplification – Step Up ............................................................................................. 9 6.6. Complex Formation In Vitro ................................................................................................. 9 6.7. Kinetics Series ..................................................................................................................... 11 Series A – Antigen-Antibody Interaction................................................................................ 11 Series B – Lectin-Lectin Interaction ........................................................................................ 12 6.8. Concentration Determination ............................................................................................ 13 7. Troubleshooting ........................................................................................................................ 13 Table 4 – Troubleshooting Issues and Solutions ....................................................................... 13 8. Available Kits ............................................................................................................................. 14 9. References ................................................................................................................................ 15 For Research and Demonstration Use Only 1 1. Introduction Surface Plasmon Resonance imaging (SPRi) technology can be used to measure molecular interactions and kinetics in real-time and with high-throughput. The Plexera Demo Chip has been developed and designed for use and demonstration with Plexera’s PlexArray® Surface Plasmon Resonance imaging instrument, due to its high capacity and wide range of applications. This unique platform combines the microarray chip format with SPR, so that all users can easily and efficiently study multiple interactions between all kinds of molecules, in a multiplexed assay format. Analyte and Ligand interaction (immobilized antibody and injected antigen shown) This image represents one of many ligand spots on a Nanocapture® chip Ligands are immobilized on a Nanocapture chip, allowing for high-throughput assays Binding of one analyte to many ligands can be observed in real time via the Plexera Instrument Control software, and further kinetic analysis can be subsequently performed For Research and Demonstration Use Only 2 The Demo Chip has been printed with a variety of well characterized ligands, and typical binding assays can be easily performed using only a few sets of ligands and analytes. While the Demo Chip provides the user with a small array, the kit allows the user to become familiar with the PlexArray instrument, and explore the capacity of the high-throughput array format and capabilities of the chip. The Demo Chip has been tested for long term stability and resistance to a multitude of regeneration solutions and cycles. It can be used many times for binding assays without the need for replacement. 2. Demo Chip Kit Description Below is an image of the Demo Chip mounted on the SPR instrument, and visualized using the Plexera Instrument Control Module. The standard Regions of Interest (ROIs) for the Demo Chip are visible in the image. On each Demo Chip, there are triplicates of the immobilized ligands. Thus, with every injection, statistically significant data set replicates are generated with identical experimental conditions. Row 1 2 3 4 5 6 7 8 9 Column I C-1 C-2 L-3 C-1 C-2 L-2 C-1 C-2 L-1 II C-1 C-2 L-6 C-1 C-2 L-5 C-1 C-2 L-4 III C-1 C-2 L-9 C-1 C-2 L-8 C-1 C-2 L-7 Maps of ligands and controls on the chip Ligand L-1 L-2 L-3 L-4 L-5 L-6 L-7 L-8 L-9 ROI 0 1 2 3 4 5 6 7 8 Real image of ligands and controls on the array chip, seen through the instrument control software (only 2/3 triplicates shown) The Ligands L-1 through L-9 represent the immobilized ligands on the surface of the chip. Shown above are both a graphical interpretation of what you observe on the Plexera Instrument Control software, and a screenshot capture of the array duplicates as seen through the real-time imaging of the Instrument Control software. The table on the left indicates how the Regions of Interest should be defined on the Instrument Control software. This will allow you to match the ROIs and your experimental results to the sample data provided later on in the manual under the “Typical Cases” section. Duplicate or triplicate spots on the array can also be selected as additional ROIs, providing replicate data sets. 3. Demo Chip Kit Components The Demo Chip package contains one Nanocapture chip, printed with a variety of molecules. Additionally, analytes and the appropriate buffers are provided to demonstrate a multitude of binding profiles, calculate the kinetics of different molecular interactions, and clean the fluidics of the instrument (see Table 1). Enough analyte is provided to perform five replicates of each experiment (excluding Analyte A-6). See the following table for a detailed description of the contents of the Demo Chip Kit contents. For Research and Demonstration Use Only 3 Table 1 – List of Kit Components No Item 1 SPRi Chip 2 Analyte 1 (A-1) a 3 Analyte 2 (A-2) a 4 Analyte 3 (A-3) a 5 Analyte 4 (A-4) a 6 Analyte 5 (A-5) a 7 Analyte 6 (A-6) a 8 Analyte 7 (A-7) a 9 Assay Buffer 1 10 Assay Buffer 2 11 Wash Buffer 12 Regeneration b Buffer a. b. c. Description One Nanocapture chip printed with triplicates of 9 ligands 30µl per vial Ready to use 10µl per vial Ready to use 10µl per vial Ready to use 10µl per vial Ready to use 10µl per vial Ready to use 3µl per vial Ready to use 30µl per vial Ready to use b, c b b 40ml per tube 10x stock 40ml per tube 10x stock 40ml per tube 10x stock 40ml per tube 10x stock Directions for Use Storage & Stability Demo Data Fig Load the flow cell with PBS, then mount on the SPR 4°C 6 months N/A Use with Assay Buffer #1 Use with Assay Buffer #1 Use with Assay Buffer #1 Use with Assay Buffer #1 Use with Assay Buffer #1 Use with Assay Buffer #1 – will inactivate Ligand L-3 spots Use with Assay Buffer #2 For use with Analytes A-1 through A-6 For use with Analyte A-7 Used for cleaning the fluidics of the instrument Use for regeneration cycles to remove bound analyte from the immobilized ligands after injections 4°C 6 months 4°C 6 months 4°C 6 months 4°C 6 months 4°C 6 months 4°C 6 months 4°C 6 months 4°C 1 month (after dilution) 4°C 6 months 4°C 6 months Room temperature 6 months 5, 6, 7 5, 6 N/A 3 N/A 1 2, 4, 7 1, 5, 6, 7 2, 4, 7, 8 N/A N/A For analytes A-1 through A-7, spin down the contents of the vial with a centrifuge prior to use, and reference Section 6, Typical Cases, for amounts needed for each injection For Assay Buffers 1 and 2, as well as the Wash and Regeneration buffers, dilute the stock 10x concentration to 1x using deionized water prior to use Due to the shorter stability of Assay Buffer 1, you should not dilute the entire 10x stock at the buffer at once – instead, incrementally dilute portions of the stock as needed 4. Instructions Table 2 – Demo Chip Setup Step Description 1 Load the Flow Cell 2 Mount the Chip 3 4 Dilute the Sample Prime Flow Cell Details Load the flow cell with assay buffer or PBS – will require 75µl Can blow out buffer with nitrogen and reload if initial loading doesn’t fill at least ¾ of the flow cell Place the slide in the housing of the PlexArray instrument Place 2-3 drops index fluid between the prism and the chip Dilute sample to 1ml using the appropriate buffer Use the “Prime Flow Cell” function to flush assay buffer through the flow cell For Research and Demonstration Use Only 4 5 Blocking the Surface Can use a high flow rate to remove any air bubbles Make sure that Assay Buffer 1 is primed in the system Insert a long (20-30 minute) baseline step in the methods page at a slow flow rate (1-2µl/s) to complete the blocking of the chip surface 5. Procedures This section quickly outlines how to establish a method for completing any of the experiments detailed in the Demo Chip Kit. Below is an example image of the “Method Setup” tab, and in the table below there are instructions on how to fill in the lines to create a protocol for the automated experimental process (see Table 3). Table 3 – Method and Procedure Guidelines Step Description 1 Add Analyte 2 Set Flow Rate/Time 3 Add Regeneration 4 Add Baseline 5 Number of Injections 6 Save Data Details Add an Analyte line to the Method table Define the location of the sample (BIG1-6 or SMALL1-6 for individual Eppendorf tubes, or A1-H12 for a 96 well plate) Choose the rate at which each analyte will be injected Standard: 4µl/second Define the duration of the injection Standard: 230 seconds Add a regeneration cycle after each analyte injection Duration: 120 seconds Can add a short baseline step between regeneration and the next injection Duration: 60-120 seconds Can help establish a stable baseline to help data analysis Define the number of injections you need to complete an experiment Make sure that each injection is followed by regeneration After the experiment is complete, save the .avi video file for analysis Also save the .txt file for further analysis 6. Typical Cases There are a variety of assays and experimental cases that can be demonstrated with the use of the Demo Chip Kit. The most common and simple type is the one-to-one relationship experiment, which can be performed using any analyte provided in the Demo Chip package. For this assay, the typical analyte injection and regeneration cycle For Research and Demonstration Use Only 5 should be employed. With one injection, binding to any of the multitude to ligands on the chip can be observed and recorded. You can observe real-time binding on up to 25 ROIs within the Instrument Control Panel, and using the data analysis software, you can subsequently determine the binding to any point on the array by measuring intensity changes from the recorded .avi video file of the experiment. This type of experiment can result in a variety of binding profiles and kinetics, depending upon which analytes are injected. Both weak and strong binding examples are shown below. It is important to note that some analytes, such as Analyte A-6, will very tightly bind to ligands on the chip, and cannot be regenerated without risking damage to the other ligands. As a result, Analyte A6 should be the last injection performed on the chip to prevent tampering the results of other experiments. There are also a handful of other useful assays that can be carried out on SPR, and that can be shown and executed using the contents of the Demo Chip Kit. Below are some results for different types of binding and experiments that can be performed and observed using the Demo Chip kit. 6.1. Strong Binding Demo Data Fig. 1 Interaction Type BiotinStreptavidin Injection Single Analyte/ MW A-6 60kDa Amount Injected 1µl 16.67nM Flow Rate Interacting Ligands Interacting ROIs 4µl/s L-3 2 Fig. 1 Strong binding is often characterized by a large increase in signal and a fast on-rate (the large uptick on the graph at just after 200 seconds), followed by a slow off-rate, and only a small decrease in signal during the dissociation phase of the injection. In some cases, one or more regeneration cycles will not be sufficient in stripping the analyte from the ligand on the chip. One such example, using Analyte A-6, is shown above. It’s important to note that after the regeneration step, the signal from the ligand does not return to the previous baseline signal established prior to the injection. This is due to strong covalent residue binding between the analyte and the immobilized ligand. The affinity of this interaction is so strong, that it falls outside the measureable range of the SPRi instrument. However, Plexera can ensure that if this case is performed correctly, the user will observe an on-rate of greater -5 than 10,000 1/(M•s), and an off-rate of less than 10 1/s. For Research and Demonstration Use Only 6 6.2. Weak Binding Demo Data Interaction Type Injection Fig. 2 Lectin-Lectin Single Analyte/ MW A-7 128kDa Amount Injected 2µl 15.6nM Flow Rate Interacting Ligands Interacting ROIs 4µl/s L-8, L-9 7, 8 Fig. 2 As opposed to the strong binding example given before, with this injection of Analyte A-7, the observed on-rate is slower, and the overall SPR signal is lower. Additionally, the off-rate is faster, resulting in a rapid signal decrease during the dissociation step. The binding difference between analyte A-1 and ligands L-8 and L-9 is quite apparent. On this graph, please note the values on the Y axis. The apparent increase in signal noise is a result of the lower overall signal response during this experiment. Thus, the noise appears to be far more prominent than in the other Typical Cases data. 6.3. Small-Large Molecule Interactions Demo Data Fig. 3 Interaction Type Small-Large Molecule Injection Single Analyte/ MW A-4 66.6kDa Amount Injected 2µl 30nM Flow Rate Interacting Ligands Interacting ROIs 4µl/s L-4 3 SPRi technology can allow users to measure the interactions between small molecules and large molecules. This can be accomplished by immobilizing the small molecule on the chip and injecting a protein, or by immobilizing the protein, and injecting the small molecule of interest. The issue presented in this model is that, when injected, small molecules do not have enough mass to cause any noticeable change in SPR signal. Additionally, not all small molecules will immobilize on a chip, and if they are able to immobilize, you risk the inactivation of the portion of the molecule that interacts with your analyte of interest. For Research and Demonstration Use Only 7 Fig. 3 To solve this issue, small molecules can be conjugated to larger ones, such as a carrier protein, to increase the overall mass of the complex, and to make it possible to observe an interaction between a small molecule, and a larger one via SPR imaging. One such interaction is demonstrated above. In this injection, a small molecule a mass of 184Da is conjugated to a larger molecule with a mass of 66kDa. 6.4. Cross Reactivity and Multiple Interactions Demo Data Fig. 4 Interaction Type LectinMultiple Injection Single Analyte/ MW A-7 128kDa Amount Injected 2µl 15.6nM Flow Rate 4µl/s Interacting Ligands L-1, L-2, L-3, L-4, L-6 Interacting ROIs 0, 1, 2, 3, 5 Fig. 4 When performing a simple one-to-one assay, it can be useful to identify a variety of ligands to which one analyte will bind. Due to the high-throughput capabilities of the PlexArray Surface Plasmon Resonance instrument, one injection of an analyte will provide binding data for all the ligands immobilized on the Nanocapture chip. This can For Research and Demonstration Use Only 8 be useful for determining both cross reactivity and multiple interactions of an analyte to a variety of proteins or molecules. While the injection of Analyte A-7 (shown above) shows considerable binding to a multitude of ligands on the chip, the binding profiles to each ligand are unique and comparable. 6.5. Signal Amplification – Step Up Demo Data Fig. 5 Interaction Type AntigenAntibody Injection Double Analyte/ MW A-1, A-2 150, 150kDa Amount Injected 2µl (ea) 13.3nM Flow Rate Interacting Ligands Interacting ROIs 4µl/s L-7 6 Fig. 5 Signal strength from an analyte can sometimes be relatively weak, depending on a multitude of factors, such as analyte concentration and kinetics of the ligand-analyte interaction. The signal strength from an experiment can be amplified with a secondary binding injection method. Start by injecting one analyte of interest, and then without regeneration, inject another analyte with which the first interacts. This creates a larger complex mass that is bound to the ligand. This secondary ligand binding can provide a larger SPR signal as a result. To perform this assay, you must minimize the dissociation time between the injections, so that you maximize the amount of the initial analyte that remains bound to the ligand. The figure above clearly demonstrates the binding pattern through subsequent injections. 6.6. Complex Formation In Vitro Alternatively, instead of using subsequent injections to increase the signal of an analyte-ligand interaction, you can also create a larger analyte mass by using a pre-incubation period, involving two or more analytes, prior to the injection. Demo Data Fig. 6a Interaction Type AntigenAntibody Injection Single (1/2) Analyte/ MW A-1 150kDa Amount Injected 2µl 13.3nM Flow Rate Interacting Ligands Interacting ROIs 4µl/s L-7 6 For Research and Demonstration Use Only 9 Fig. 6a In the first graph, only Analyte A-1 is injected, and the SPR response is roughly 175 RU. The second graph depicts a separate injection, in which equal amounts of Analytes A-1 and A-2 are pre-incubated for a period of 30 minutes prior to injection. Due to the interaction between the two analytes during the incubation period, the total mass of the final analyte complex increases, and thus increases the resulting SPR signal. As a result, in the second experiment and graph, the SPR response from the injection increases to around 275 response units. This shows that by using a second analyte to increase the overall mass, smaller signals can be more easily detected, as long as the second analyte will not interfere with the binding of the complex to the ligand via competition. Demo Data Fig. 6b Interaction Type AntigenAntibody Injection Single (2/2) Analyte/ MW A-1 + A-2 300kDa total Amount Injected 2µl (ea) 13.3nM Flow Rate Interacting Ligands Interacting ROIs 4µl/s L-7 6 Fig. 6b It is often useful to inject both analytes individually prior to the assay. This is to ensure that there is not identical binding to the ligand of interest, and to establish a norm for SPR response from the injection. If the pre-incubated For Research and Demonstration Use Only 10 analyte sample gives a lower final signal, or shows no binding, there is competitive binding between the two analytes and your region of interest on the chip. Therefore, the PlexArray system and chip gives the user flexible options for performing competition, inhibition, and blocking assays. 6.7. Kinetics Series Perhaps the most beneficial use of the SPR instrument is to determine the kinetics of a binding interaction between an injected analyte and immobilized ligands on the chip. Determining kinetic data can be demonstrated using the Demo Chip and the Plexera Data Analysis Module. Multiple injections of varying concentrations are needed of the same analyte to determine the kinetics of the binding to the ligands on the chip. The analyte of interest must be prepared in a dilution series. The standard procedure is to inject four different concentrations, differing by a factor of three (example: 2.23, 6.68, and 20.04, and 60.12nM). Kinetics can be determined with as few as three injections, but additional concentrations reduce error in determining kinetic data. Shown below are two different dilution series used for kinetics and affinity determination. The first graph (example A – Antibody-Antigen), depicts a series using Analyte A-1 in Assay Buffer #1, while the second graph (example B – Lectin-Lectin) uses a dilution series of Analyte A-7 in Assay Buffer #2. *While there is listed example data for the solved kinetics for the following assays, there can be a wide variance in solved kinetic values among labs and instruments. So while any solved kinetics should be somewhat similar to the values provided in this manual, variance up to one order of magnitude is quite possible. Series A – Antigen-Antibody Interaction Demo Data Interaction Type Injection Analyte/ MW Amount Injected Flow Rate Interacting Ligands Interacting ROIs ka * k d* KD* 4µl/s L-7 6 2.6 x 6 10 1.9 x -4 10 7.2 x -11 10 0.3µl 2.23nM Fig. 7a AntigenAntibody Series A-1 150kDa 1µl 6.68nM 3µl 20.04nM 9µl 60.12nM For Research and Demonstration Use Only 11 Fig. 7a Series B – Lectin-Lectin Interaction Demo Data Interaction Type Injection Analyte/ MW Amount Injected Flow Rate Interacting Ligands Interacting ROIs ka * k d* KD* 4µl/s L-6 5 1.8 x 5 10 4.2 x -4 10 2.3 x -9 10 0.27µl 2.23nM Fig. 7b LectinLectin Series A-7 128kDa 0.8µl 6.68nM 2.4µl 20.04nM 7.2µl 60.12nM Fig. 7b For Research and Demonstration Use Only 12 These experiments resulted with successive injections of different concentrations of an analyte. This data can then be used, combined with the Plexera Data Analysis Module, to determine the affinity of an interaction between a ligand and analyte. It can also be useful to use increasing concentrations until saturation in signal is reached. This is identified by two or three successive injections of increasing concentration reaching a similar or identical index rd th change value (on the Y axis). This saturation is becoming visible in the 3 and 4 injections of Series A. 6.8. Concentration Determination Demo Data Fig. 8 Interaction Type Injection LectinLectin Series Analyte/ MW A-7 128kDa Amount Injected Flow Rate Interacting Ligands Interacting ROIs Signal Response 0.27µl 2.23nM 80 0.8µl 6.68nM 235 2.4µl 20.04nM 4µl/s L-6 5 450 7.2µl 60.12nM 715 Fig. 8 If the concentration of a particular molecule in a solution is unknown, SPR can be used to determine the concentration. You can perform a concentration series injection of the molecule of interest (Analyte A-7 shown above) and plot the signal response against the concentration of the analyte injection. After finding this correlation, you can perform an injection of the unknown concentration, and use the solved correlation value to determine the unknown concentration. 7. Troubleshooting Table 4 – Troubleshooting Issues and Solutions Issue Air in flow cell Causes Air present in analyte injections Air present in the assay buffer Solution Stop (interrupt) the experimental run Using “Load and Prime Flow Cell”, try a short, fast For Research and Demonstration Use Only 13 The instrument de-gasser is not activated Jam detection Auto-sampler needle impacting a surface during a run Some sort of object in the way of the auto-sampler’s path Clog in system Buildup of protein or other material within the tubing of the instrument High background signal No signal Too much signal Poor reproducibility Insufficient blocking of the surface after ligand spotting Inactivity of ligand(s) Inactivity of analyte(s) Wrong assay buffer Wrong amount of analyte injected Wrong amount of analyte injected Wrong assay buffer Inactivity of ligand(s) Inactivity of analyte(s) flow rate, such as 20-40µl/sec for a period of 3-5 seconds Repeat this short pulse a few times to try to remove air You can also try a long (20-30 min) baseline stabilization at a slow rate (1µl/s) Repeat as many times as necessary Watch a portion of a the experiment run to look for the cause of the jam Look for any loose objects around the auto sampler, such as lids of microtubes Make sure all tubes and well plates are secure and in place Look to make sure that fluid is exiting the waste line denoted “0” Remove the slide from the housing Using a thin pin or paper clip, insert it into the channel that pumps buffer into the flow cell to try to alleviate the clog If the problem is not fixed, contact technical support Do a long (30 minute) baseline injection of Assay Buffer #1 at a rate of 4µl Repeat until a steady baseline signal is observed Ensure that you are using the appropriate assay buffer Make sure that the chip and analytes are still within the activity date listed in the manual Double check that you are using the correct amount of analyte as specified in the manual Ensure that you are using the appropriate assay buffer Make sure that the chip and analytes are still within the activity date listed in the manual Double check that you are using the correct amount of analyte as specified in the manual If the user continues to experience issues after consulting with this table, please contact Plexera technical support for additional assistance ([email protected]). 8. Available Kits Product PlexArray® Demo Kit I PlexArray® Demo Kit II Content Included with instrument purchase Complete contents of Demo Kit IV 1x Demo Chip Manual ID No Price Detail BG-DE-K001 Included with Instrument PDF manual BG-DE-K002 Inquire for price PDF manual For Research and Demonstration Use Only 14 PlexArray® Demo Kit III PlexArray® Demo Kit IV 1x Demo Chip Assay buffers Analyte reagents 5 reactions per analyte Manual 2x Demo Chip Assay buffers Analyte reagents 10 reactions per analyte Manual BG-DE-K003 Inquire for price PDF manual BG-DE-K004 Inquire for price PDF manual 9. References Kodoyianni V. Label-free analysis of biomolecular interactions using SPR imaging. BioTechniques. 2011; 50(1):3240. Lausted C, Hu Z, Hood L. Label-Free Detection with Surface Plasmon Resonance Imaging. Methods Mol Biology. 2011; 723: 321-33. Lausted C, Hu Z, Hood L. Quantitative Serum Proteomics from Surface Plasmon Resonance Imaging. Mol Cell Proteomics. Dec 2008; 7 (12): 2464-74 Lausted C, Hu Z, Hood L, Campbell C. SPR Imaging for High Throughput, Label-Free Interaction Analysis. Comb Chem High Throughput Screening. Sep 2009; 12(8):741-51. Linman MJ, Abbas A, Cheng Q. Interface design and multiplexed analysis with surface plasmon resonance (SPR) spectroscopy and SPR imaging. Analyst. 2010; 135(11):2759-67. Paul S, Vadgama P, Ray AK. Surface plasmon resonance imaging for biosensing. IET Nanobiotechnol. 2009; 3(3):7180. Yanase Y, Hiragun T, Kaneko S, Gould HJ, Greaves MW, Hide M. Detection of refractive index changes in individual living cells by means of surface plasmon resonance imaging. Biosens Bioelectron. 2010; 26(2):674-81. Yanase Y, Hiragun T, Yanase T, Kawaguchi T, Ishii K, Hide M. Application of SPR Imaging Sensor for Detection of Individual Living Cell Reactions and Clinical Diagnosis of Type I Allergy. Allergol Int. 2013. For Research and Demonstration Use Only 15 Array + Chip + SPRi = Screening any Analyte and Ligand Through Biointeractions Plexera®, PlexArray®, and Nanocapture® are registered trademarks of Plexera LLC Version 1.0 – April 2013 Copyright notice: © Copyright 2013 by Plexera LLC. All rights reserved. Information in this document is subject to change without notice and does not represent a commitment on the part of Plexera. Every effort has been made to supply complete and accurate information; however, Plexera LLC assumes no responsibility and will not be liable for any error, omissions, damage, or loss that might result from any use of this manual or the information contained therein. Information given may not be used in any other form. No part of this document may be reproduced or transmitted in any form or by any means, electronic or mechanical, including photocopying, without written permission from: Plexera LLC 13110 NE 177th Place #100 Woodinville, WA. 98072 For Research and Demonstration Use Only Solutions for Functional Proteomics The screening, affinity, kinetics, and concentration of ligands and analytes are measured with the highest throughput and array density of the label-free SPRi system 16