1
Lapap Mk II Manual
December 1, 2008
Lapap Mk II Manual
Edition Electronic version generated on
c 2006 EADS SPACE Transportation
Copyright 2
Contents
1
2
Installation Instructions
1.1 Check Platform Requirements . . . . . . . . . . .
1.2 Instructions for Linux/Unix . . . . . . . . . . . .
1.2.1 Unpacking the Distribution . . . . . . . .
1.2.2 Starting the application. . . . . . . . . . .
1.2.3 Exiting the application . . . . . . . . . . .
1.3 Instructions for Windows XP . . . . . . . . . . .
1.3.1 Unpacking the distribution. . . . . . . . .
1.3.2 Starting the application . . . . . . . . . .
1.3.3 Exiting the application . . . . . . . . . . .
1.4 Operational Products in the Standalone Version
.
.
.
.
.
.
.
.
.
.
.
.
.
.
.
.
.
.
.
.
.
.
.
.
.
.
.
.
.
.
.
.
.
.
.
.
.
.
.
.
.
.
.
.
.
.
.
.
.
.
.
.
.
.
.
.
.
.
.
.
.
.
.
.
.
.
.
.
.
.
3
3
3
3
3
3
3
3
4
4
4
Working with Lapap Mk II
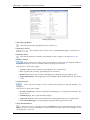
2.1 Menu Structure . . . . . . . . . . . . . . . . . . . . . . . . . . . . . . . . . . . . .
2.1.1 File . . . . . . . . . . . . . . . . . . . . . . . . . . . . . . . . . . . . . . . .
2.1.1.1 Reset Application . . . . . . . . . . . . . . . . . . . . . . . . . .
2.1.1.2 Save Data pool Buffer... . . . . . . . . . . . . . . . . . . . . . . .
2.1.1.3 Exit . . . . . . . . . . . . . . . . . . . . . . . . . . . . . . . . . .
2.1.2 View . . . . . . . . . . . . . . . . . . . . . . . . . . . . . . . . . . . . . . .
2.1.2.1 Show Message Buffer ... . . . . . . . . . . . . . . . . . . . . . . .
2.1.2.2 Refresh Display Navigation Tree . . . . . . . . . . . . . . . . . .
2.1.2.3 Google / Table Style Search Results . . . . . . . . . . . . . . . .
2.1.2.4 Zoom in doc / Zoom out doc . . . . . . . . . . . . . . . . . . .
2.1.2.5 Clear Log . . . . . . . . . . . . . . . . . . . . . . . . . . . . . . .
2.1.2.6 Windows . . . . . . . . . . . . . . . . . . . . . . . . . . . . . . .
2.1.2.7 Workspaces . . . . . . . . . . . . . . . . . . . . . . . . . . . . . .
2.1.2.8 Add Plugin / Undock Plugin / Move Plugin / Remove Plugin
2.1.2.9 Split Frame . . . . . . . . . . . . . . . . . . . . . . . . . . . . . .
2.1.2.10 Maximize... / Reset View . . . . . . . . . . . . . . . . . . . . . .
2.1.2.11 Show Log Window . . . . . . . . . . . . . . . . . . . . . . . . .
2.1.3 Display . . . . . . . . . . . . . . . . . . . . . . . . . . . . . . . . . . . . . .
2.1.3.1 Close . . . . . . . . . . . . . . . . . . . . . . . . . . . . . . . . .
2.1.3.2 Close Others . . . . . . . . . . . . . . . . . . . . . . . . . . . . .
2.1.3.3 Undock . . . . . . . . . . . . . . . . . . . . . . . . . . . . . . . .
2.1.3.4 Cascade / Tile / Maximize All... . . . . . . . . . . . . . . . . . .
2.1.3.5 Toggle Tabbed Mode . . . . . . . . . . . . . . . . . . . . . . . .
2.1.3.6 Synoptic Default Size . . . . . . . . . . . . . . . . . . . . . . . .
2.1.3.7 Load Homepage... . . . . . . . . . . . . . . . . . . . . . . . . . .
2.1.3.8 Subsystem Overview . . . . . . . . . . . . . . . . . . . . . . . .
2.1.3.9 Close all but Homepage . . . . . . . . . . . . . . . . . . . . . . .
2.1.3.10 Find Text As You Type . . . . . . . . . . . . . . . . . . . . . . .
2.1.3.11 Find Parameter In Other Displays . . . . . . . . . . . . . . . . .
2.1.3.12 Properties . . . . . . . . . . . . . . . . . . . . . . . . . . . . . . .
2.1.4 Documentation . . . . . . . . . . . . . . . . . . . . . . . . . . . . . . . . .
2.1.4.1 Find in page... . . . . . . . . . . . . . . . . . . . . . . . . . . . .
2.1.4.2 Zoom in doc / Zoom out doc . . . . . . . . . . . . . . . . . . .
2.1.5 Options . . . . . . . . . . . . . . . . . . . . . . . . . . . . . . . . . . . . .
2.1.5.1 Preferences . . . . . . . . . . . . . . . . . . . . . . . . . . . . . .
2.1.6 Help . . . . . . . . . . . . . . . . . . . . . . . . . . . . . . . . . . . . . . .
2.1.6.1 Hot Key Help . . . . . . . . . . . . . . . . . . . . . . . . . . . .
2.1.6.2 Current Display . . . . . . . . . . . . . . . . . . . . . . . . . . .
2.1.6.3 ODF Documentation . . . . . . . . . . . . . . . . . . . . . . . .
2.1.6.4 User Manual . . . . . . . . . . . . . . . . . . . . . . . . . . . . .
2.1.6.5 About . . . . . . . . . . . . . . . . . . . . . . . . . . . . . . . . .
.
.
.
.
.
.
.
.
.
.
.
.
.
.
.
.
.
.
.
.
.
.
.
.
.
.
.
.
.
.
.
.
.
.
.
.
.
.
.
.
.
.
.
.
.
.
.
.
.
.
.
.
.
.
.
.
.
.
.
.
.
.
.
.
.
.
.
.
.
.
.
.
.
.
.
.
.
.
.
.
.
.
.
.
.
.
.
.
.
.
.
.
.
.
.
.
.
.
.
.
.
.
.
.
.
.
.
.
.
.
.
.
.
.
.
.
.
.
.
.
.
.
.
.
.
.
.
.
.
.
.
.
.
.
.
.
.
.
.
.
.
.
.
.
.
.
.
.
.
.
.
.
.
.
.
.
.
.
.
.
.
.
.
.
.
.
.
.
.
.
.
.
.
.
.
.
.
.
.
.
.
.
.
.
.
.
.
.
.
.
.
.
.
.
.
.
.
.
.
.
.
.
.
.
.
.
.
.
.
.
.
.
.
.
.
.
.
.
.
.
.
.
.
.
.
.
.
.
.
.
.
.
.
.
.
.
.
.
.
.
.
.
.
.
.
.
5
5
5
5
5
5
5
5
6
6
6
6
6
6
6
6
6
6
6
6
6
7
7
7
7
7
7
7
7
7
7
7
8
8
8
8
8
8
8
8
8
8
3
.
.
.
.
.
.
.
.
.
.
.
.
.
.
.
.
.
.
.
.
.
.
.
.
.
.
.
.
.
.
.
.
.
.
.
.
.
.
.
.
.
.
.
.
.
.
.
.
.
.
.
.
.
.
.
.
.
.
.
.
.
.
.
.
.
.
.
.
.
.
.
.
.
.
.
.
.
.
.
.
.
.
.
.
.
.
.
.
.
.
.
.
.
.
.
.
.
.
.
.
.
.
.
.
.
.
.
.
.
.
.
.
.
.
.
.
.
.
.
.
.
.
.
.
.
.
.
.
.
.
.
.
.
.
.
.
.
.
.
.
.
.
.
.
.
.
.
.
.
.
.
.
.
.
.
.
.
.
.
.
.
.
.
.
.
.
.
.
.
.
CONTENTS
2.2
2.3
Tool bar . . . . . . . . . . . . . .
Workspaces . . . . . . . . . . .
2.3.1 Plugins . . . . . . . . . .
2.3.2 Predefined Workspaces
2.3.3 Changing Workspaces .
2.3.4 Creating Workspaces . .
2.3.5 Managing Workspaces .
2.3.6 Creating Own Windows
Preferences . . . . . . . . . . . .
2.4.1 Audio Notification . . .
2.4.2 Search . . . . . . . . . .
2.4.3 Datapool Buffer . . . . .
2.4.4 Tool Tips . . . . . . . . .
.
.
.
.
.
.
.
.
.
.
.
.
.
.
.
.
.
.
.
.
.
.
.
.
.
.
.
.
.
.
.
.
.
.
.
.
.
.
.
.
.
.
.
.
.
.
.
.
.
.
.
.
.
.
.
.
.
.
.
.
.
.
.
.
.
.
.
.
.
.
.
.
.
.
.
.
.
.
.
.
.
.
.
.
.
.
.
.
.
.
.
.
.
.
.
.
.
.
.
.
.
.
.
.
.
.
.
.
.
.
.
.
.
.
.
.
.
.
.
.
.
.
.
.
.
.
.
.
.
.
.
.
.
.
.
.
.
.
.
.
.
.
.
.
.
.
.
.
.
.
.
.
.
.
.
.
.
.
.
.
.
.
.
.
.
.
.
.
.
.
.
.
.
.
.
.
.
.
.
.
.
.
.
.
.
.
.
.
.
.
.
.
.
.
.
.
.
.
.
.
.
.
.
.
.
.
.
.
.
.
.
.
.
.
.
.
.
.
.
.
.
.
.
.
.
.
.
.
.
.
.
.
.
.
.
.
.
.
.
.
.
.
.
.
.
.
.
.
.
.
.
.
.
.
.
.
.
.
.
.
.
.
.
.
.
.
.
.
.
.
.
.
.
.
.
.
.
.
.
.
.
.
.
.
.
.
.
.
.
.
.
.
.
.
.
.
.
.
.
.
.
.
.
.
.
.
.
.
.
.
.
.
.
.
.
.
.
.
.
.
.
.
.
.
.
.
.
.
.
.
.
.
.
.
.
.
.
.
.
.
.
.
.
.
.
.
.
.
.
.
.
.
.
.
.
.
.
.
.
.
.
.
.
.
.
.
.
.
.
.
.
.
.
.
.
.
.
.
.
.
.
.
.
.
.
.
.
.
.
.
.
.
.
.
.
.
.
.
.
.
.
.
.
.
.
.
.
.
.
.
.
.
.
.
.
.
.
.
.
.
.
.
.
.
.
.
.
.
.
.
.
.
.
.
.
.
.
.
.
.
.
.
8
10
10
10
13
13
17
17
18
18
18
18
19
CLSW Status
3.1 The Tabs of the CLSW Browser
3.1.1 Overview . . . . . . . .
3.1.2 Port Counters . . . . . .
3.1.3 Port Status . . . . . . . .
.
.
.
.
.
.
.
.
.
.
.
.
.
.
.
.
.
.
.
.
.
.
.
.
.
.
.
.
.
.
.
.
.
.
.
.
.
.
.
.
.
.
.
.
.
.
.
.
.
.
.
.
.
.
.
.
.
.
.
.
.
.
.
.
.
.
.
.
.
.
.
.
.
.
.
.
.
.
.
.
.
.
.
.
.
.
.
.
.
.
.
.
.
.
.
.
.
.
.
.
.
.
.
.
.
.
.
.
.
.
.
.
.
.
.
.
.
.
.
.
.
.
.
.
.
.
.
.
.
.
.
.
.
.
.
.
21
21
21
23
24
Synoptic Display System
4.1 Window Handling . . . . . . . . . . . . . . . . . . . . . . . . . . . . . . . . . . . . . . . .
4.1.1 Docking / Undocking Displays . . . . . . . . . . . . . . . . . . . . . . . . . . . . .
4.1.2 Toggling Tabbed Mode . . . . . . . . . . . . . . . . . . . . . . . . . . . . . . . . . .
4.1.3 Display Size . . . . . . . . . . . . . . . . . . . . . . . . . . . . . . . . . . . . . . . .
4.1.3.1 Changing Display Size . . . . . . . . . . . . . . . . . . . . . . . . . . . .
4.1.3.2 Synoptic Default Size . . . . . . . . . . . . . . . . . . . . . . . . . . . . .
4.2 Synoptic Navigation Buttons . . . . . . . . . . . . . . . . . . . . . . . . . . . . . . . . . .
4.3 Display Features . . . . . . . . . . . . . . . . . . . . . . . . . . . . . . . . . . . . . . . . . .
4.3.1 Overall Monitoring Status . . . . . . . . . . . . . . . . . . . . . . . . . . . . . . . .
4.3.2 Element Types . . . . . . . . . . . . . . . . . . . . . . . . . . . . . . . . . . . . . . .
4.3.2.1 Navigation Buttons . . . . . . . . . . . . . . . . . . . . . . . . . . . . . .
4.3.2.2 Command Buttons / 2 Step Commanding . . . . . . . . . . . . . . . . .
4.3.2.3 Measurements . . . . . . . . . . . . . . . . . . . . . . . . . . . . . . . . .
4.3.2.4 Graphical Elements . . . . . . . . . . . . . . . . . . . . . . . . . . . . . .
4.3.3 Display Context Menus . . . . . . . . . . . . . . . . . . . . . . . . . . . . . . . . .
4.3.3.1 Context Menu for Buttons . . . . . . . . . . . . . . . . . . . . . . . . . .
4.3.3.2 Context Menu for Labels . . . . . . . . . . . . . . . . . . . . . . . . . . .
4.3.3.3 Context Menu for Measurements . . . . . . . . . . . . . . . . . . . . . .
4.3.4 Quick Graphs . . . . . . . . . . . . . . . . . . . . . . . . . . . . . . . . . . . . . . .
4.3.4.1 Purpose of Quick Graphs . . . . . . . . . . . . . . . . . . . . . . . . . . .
4.3.4.2 Axis Functionality . . . . . . . . . . . . . . . . . . . . . . . . . . . . . . .
4.3.4.3 Context Menu of a Quick Graph . . . . . . . . . . . . . . . . . . . . . . .
4.3.4.4 Linegraph Menu . . . . . . . . . . . . . . . . . . . . . . . . . . . . . . . .
4.3.5 Performance Indicators . . . . . . . . . . . . . . . . . . . . . . . . . . . . . . . . .
4.4 Limit Manager . . . . . . . . . . . . . . . . . . . . . . . . . . . . . . . . . . . . . . . . . . .
4.4.1 Changing Monitoring Values For Numerical Measurements . . . . . . . . . . . .
4.4.2 Changing Monitoring Values For State codes (Based on Discreet Measurements)
.
.
.
.
.
.
.
.
.
.
.
.
.
.
.
.
.
.
.
.
.
.
.
.
.
.
.
25
25
26
27
27
27
27
27
28
28
28
28
28
29
29
29
30
30
30
32
32
33
33
34
35
35
36
37
.
.
.
.
39
39
40
40
40
2.4
3
4
5
Status Displays
5.1 Station Mode . . . . . . . . .
5.2 Station Mode Compatibility
5.3 DMS Status . . . . . . . . . .
5.4 S-Band / KU-Band . . . . .
.
.
.
.
.
.
.
.
.
.
.
.
.
.
.
.
.
.
.
.
.
.
.
.
.
.
.
.
.
.
.
.
.
.
.
.
4
.
.
.
.
.
.
.
.
.
.
.
.
.
.
.
.
.
.
.
.
.
.
.
.
.
.
.
.
.
.
.
.
.
.
.
.
.
.
.
.
.
.
.
.
.
.
.
.
.
.
.
.
.
.
.
.
.
.
.
.
.
.
.
.
.
.
.
.
.
.
.
.
.
.
.
.
.
.
.
.
.
.
.
.
.
.
.
.
.
.
.
.
.
.
.
.
.
.
.
.
.
.
.
.
CONTENTS
6
7
8
9
System Message Panel
6.1 The Message Buffer View . . . . . . . . . . . . . . .
6.1.1 The columns in the Message Buffer View . .
6.1.1.1 Time . . . . . . . . . . . . . . . . . .
6.1.1.2 Classification . . . . . . . . . . . . .
6.1.1.3 Subsystem . . . . . . . . . . . . . .
6.1.1.4 Equipment . . . . . . . . . . . . . .
6.1.1.5 Text . . . . . . . . . . . . . . . . . .
6.1.2 Sorting the columns of the Message Buffer .
6.1.3 Actions in the Message Buffer View . . . . .
6.1.3.1 Filter . . . . . . . . . . . . . . . . . .
6.1.3.2 Clear . . . . . . . . . . . . . . . . . .
6.1.3.3 Sync . . . . . . . . . . . . . . . . . .
6.1.3.4 Freeze . . . . . . . . . . . . . . . . .
6.1.3.5 Live . . . . . . . . . . . . . . . . . .
6.1.3.6 Load . . . . . . . . . . . . . . . . . .
6.1.3.7 Save . . . . . . . . . . . . . . . . . .
6.1.3.8 Acknowledge & Close . . . . . . . .
6.1.3.9 Close . . . . . . . . . . . . . . . . .
6.1.3.10 Showing Event Help for a message
6.1.4 The Icons in the Message Buffer View . . . .
6.1.4.1 The "Live" Icon . . . . . . . . . . . .
6.1.4.2 The "Loaded Messages" icon . . . .
6.1.4.3 The "Filter" icon . . . . . . . . . . .
.
.
.
.
.
.
.
.
.
.
.
.
.
.
.
.
.
.
.
.
.
.
.
.
.
.
.
.
.
.
.
.
.
.
.
.
.
.
.
.
.
.
.
.
.
.
.
.
.
.
.
.
.
.
.
.
.
.
.
.
.
.
.
.
.
.
.
.
.
.
.
.
.
.
.
.
.
.
.
.
.
.
.
.
.
.
.
.
.
.
.
.
.
.
.
.
.
.
.
.
.
.
.
.
.
.
.
.
.
.
.
.
.
.
.
.
.
.
.
.
.
.
.
.
.
.
.
.
.
.
.
.
.
.
.
.
.
.
.
.
.
.
.
.
.
.
.
.
.
.
.
.
.
.
.
.
.
.
.
.
.
.
.
.
.
.
.
.
.
.
.
.
.
.
.
.
.
.
.
.
.
.
.
.
.
.
.
.
.
.
.
.
.
.
.
.
.
.
.
.
.
.
.
.
.
.
.
.
.
.
.
.
.
.
.
.
.
.
.
.
.
.
.
.
.
.
.
.
.
.
.
.
.
.
.
.
.
.
.
.
.
.
.
.
.
.
.
.
.
.
.
.
.
.
.
.
.
.
.
.
.
.
.
.
.
.
.
.
.
.
.
.
.
.
.
.
.
.
.
.
.
.
.
.
.
.
.
.
.
.
.
.
.
.
.
.
.
.
.
.
.
.
.
.
.
.
.
.
.
.
.
.
.
.
.
.
.
.
.
.
.
.
.
.
.
.
.
.
.
.
.
.
.
.
.
.
.
.
.
.
.
.
.
.
.
.
.
.
.
.
.
.
.
.
.
.
.
.
.
.
.
.
.
.
.
.
.
.
.
.
.
.
.
.
.
.
.
.
.
.
.
.
.
.
.
.
.
.
.
.
.
.
.
.
.
.
.
.
.
.
.
.
.
.
.
.
.
.
.
.
.
.
.
.
.
.
.
.
.
.
.
.
.
.
.
.
.
.
.
.
.
.
.
.
.
.
.
.
.
.
.
.
.
.
.
.
.
.
.
.
.
.
.
.
.
.
.
.
.
.
.
.
.
.
.
.
.
.
.
.
.
.
.
.
.
.
.
.
.
.
.
.
.
.
.
.
.
.
.
.
.
.
.
.
.
.
.
.
.
.
.
.
.
.
.
.
41
41
42
42
42
42
42
42
43
43
43
45
45
45
45
45
45
45
46
46
46
46
46
46
Situational Awareness
7.1 SAW Messages . . . . . . . . . . . . . . . .
7.2 SAW Icons . . . . . . . . . . . . . . . . . . .
7.3 Opening the Message Buffer View for SAW
7.4 SAW Filter Functionality . . . . . . . . . . .
7.5 Handling SAW messages . . . . . . . . . . .
7.5.1 Acknowledging SAW messages . .
.
.
.
.
.
.
.
.
.
.
.
.
.
.
.
.
.
.
.
.
.
.
.
.
.
.
.
.
.
.
.
.
.
.
.
.
.
.
.
.
.
.
.
.
.
.
.
.
.
.
.
.
.
.
.
.
.
.
.
.
.
.
.
.
.
.
.
.
.
.
.
.
.
.
.
.
.
.
.
.
.
.
.
.
.
.
.
.
.
.
.
.
.
.
.
.
.
.
.
.
.
.
.
.
.
.
.
.
.
.
.
.
.
.
.
.
.
.
.
.
.
.
.
.
.
.
.
.
.
.
.
.
.
.
.
.
.
.
.
.
.
.
.
.
.
.
.
.
.
.
.
.
.
.
.
.
.
.
.
.
.
.
47
47
47
47
48
48
48
Timer Section
8.1 Timer Types . . . . . . . .
8.1.1 Alarm Clock Timer
8.1.2 Count Down Timer
8.1.3 Timer Settings . . .
8.1.3.1 Name . .
8.1.3.2 Type . . .
8.1.3.3 Sound . .
.
.
.
.
.
.
.
.
.
.
.
.
.
.
.
.
.
.
.
.
.
.
.
.
.
.
.
.
.
.
.
.
.
.
.
.
.
.
.
.
.
.
.
.
.
.
.
.
.
.
.
.
.
.
.
.
.
.
.
.
.
.
.
.
.
.
.
.
.
.
.
.
.
.
.
.
.
.
.
.
.
.
.
.
.
.
.
.
.
.
.
.
.
.
.
.
.
.
.
.
.
.
.
.
.
.
.
.
.
.
.
.
.
.
.
.
.
.
.
.
.
.
.
.
.
.
.
.
.
.
.
.
.
.
.
.
.
.
.
.
.
.
.
.
.
.
.
.
.
.
.
.
.
.
.
.
.
.
.
.
.
.
.
.
.
.
.
.
.
.
.
.
.
.
.
.
.
.
.
.
.
.
.
.
.
.
.
.
.
51
51
51
52
52
52
52
52
International Procedure Viewer Components
9.1 ODF Book Browser . . . . . . . . . . . . . . . . . . . . . . . . . .
9.1.1 Selecting ODF Procedures . . . . . . . . . . . . . . . . . .
9.1.2 Searching For Procedures . . . . . . . . . . . . . . . . . .
9.1.3 Displaying Procedure Properties . . . . . . . . . . . . . .
9.2 Procedure Executor . . . . . . . . . . . . . . . . . . . . . . . . . .
9.2.1 Logic Flow Procedures . . . . . . . . . . . . . . . . . . . .
9.2.1.1 Working With Logic Flow Procedures . . . . . .
9.2.1.1.1
Elements in Logic Flow Procedures . .
9.2.1.1.2
Basic Navigation . . . . . . . . . . . .
9.2.1.1.3
Executing The Logic Flow Procedures
9.2.2 Check List Procedures . . . . . . . . . . . . . . . . . . . .
9.2.2.1 Working With Check List Procedure . . . . . .
9.2.2.1.1
Elements In Checklist Procedures . . .
9.2.2.1.2
Executing Check List Procedures . . .
9.2.3 PDF Procedures . . . . . . . . . . . . . . . . . . . . . . . .
9.2.4 General Procedure Work Flow . . . . . . . . . . . . . . .
.
.
.
.
.
.
.
.
.
.
.
.
.
.
.
.
.
.
.
.
.
.
.
.
.
.
.
.
.
.
.
.
.
.
.
.
.
.
.
.
.
.
.
.
.
.
.
.
.
.
.
.
.
.
.
.
.
.
.
.
.
.
.
.
.
.
.
.
.
.
.
.
.
.
.
.
.
.
.
.
.
.
.
.
.
.
.
.
.
.
.
.
.
.
.
.
.
.
.
.
.
.
.
.
.
.
.
.
.
.
.
.
.
.
.
.
.
.
.
.
.
.
.
.
.
.
.
.
.
.
.
.
.
.
.
.
.
.
.
.
.
.
.
.
.
.
.
.
.
.
.
.
.
.
.
.
.
.
.
.
.
.
.
.
.
.
.
.
.
.
.
.
.
.
.
.
.
.
.
.
.
.
.
.
.
.
.
.
.
.
.
.
.
.
.
.
.
.
.
.
.
.
.
.
.
.
.
.
.
.
.
.
.
.
.
.
.
.
.
.
.
.
.
.
.
.
.
.
.
.
.
.
.
.
.
.
.
.
.
.
53
53
54
54
56
56
56
57
57
59
59
60
60
61
63
63
63
.
.
.
.
.
.
.
.
.
.
.
.
.
.
.
.
.
.
.
.
.
.
.
.
.
.
.
.
.
.
.
.
.
.
.
.
.
.
.
.
.
.
.
.
.
.
.
.
.
.
.
.
.
.
.
.
.
.
.
.
.
.
.
.
.
.
.
.
.
.
5
CONTENTS
9.3
Documentation Viewer . . . . . . . . . . . . . . . . . . . . . . . . . . . . . . . . . . . . . . .
9.3.1 Searching For Documentation . . . . . . . . . . . . . . . . . . . . . . . . . . . . . . .
63
64
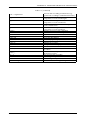
A Keyboard Shortcuts and Hot Keys
65
B Known Problems
67
Index
69
6
List of Tables
4
Synoptic Display System
4.1 Meaning of Measurements Background Color . . . . . . . . . . . . . . . . . . . . . . . . . .
29
Status Displays
5.1 Station Mode Values . . . . . . . . . . . . . . . . . . . . . . . . . . . . . . . . . . . . . . . .
39
A Keyboard Shortcuts and Hot Keys
A.1 Lapap Mk II Application and Desktop Hot Keys . . . . . . . . . . . . . . . . . . . . . . . .
65
5
7
Abstract
This document is the user manual for the Lapap Mk II Application.
Lapap Mk. II is the commanding and control crew interface for Columbus.
It provides online access to the nominal part of columbus’ subsystems. Data is directly derived from
the DMS data pool and commands are initiated directly to the onboard execution software by the crew.
Subsystems and equipment are shown within Lapap Mk. II as graphical schematics with data representation in alphanumerical output boxes, states, animated symbols and line color coding. Commands
are predefined so that the crew can issue the commands by either clicking on a button or selecting the
command from a list and clicking Execute.
Lapap Mk II provides commanding for all subsystems, display measurements acquired by the DMS
and indicators of limit supervision and data validity.
Chapter 1
Installation Instructions
This chapter describes the steps necessary to install Lapap Mk II.
1.1
Check Platform Requirements
The Lapap Mk II software runs on Linux, Windows, and Solaris platforms for which a Java (TM) 2
Standard Edition runtime environment is available (see http://java.sun.com/j2se). It has been tested
on the following platforms:
- SUSE Linux Enterprise Server 9 with Service Pack 3 and J2SE 1.6.0_01
- Windows XP (SP2), J2SE 1.6.0_01
Other platforms are expected to work but are currently not supported.
1.2
1.2.1
Instructions for Linux/Unix
Unpacking the Distribution
The distribution comes as an archive named lapap-x.y.z.tar.gz where x.y.z is the release version identifier
(e.g., 1.4.0). To unpack this archive in a sub-directory of your home directory, do:
$ cd $HOME
$ tar zxf lapap-x.y.z.tar.gz
This will create a directory $HOME/lapap-x.y.z containing the complete Lapap Mk II distribution.
The Lapap Mk II software saves user specific information such as window position or workspace
changes. They are saved into an application configuration directory which is by default named:
$HOME/.lapap
If you install the Lapap Mk II software onto a machine where a previous version had been installed
you may want to delete this directory or its contents to ensure a clean new environment and skip all
former configuration changes.
1.2.2
Starting the application.
You can start the Lapap Mk II application with the command:
$ $HOME/lapap-x.y.z/bin/lapap.sh
1.2.3
Exiting the application
Choose Exit from the File menu inside the application window.
1.3
1.3.1
Instructions for Windows XP
Unpacking the distribution.
The distribution comes as an archive named lapap-x.y.z.zip where x.y.z is the release version identifier (e.g.,
1.4.0). To unpack this archive in a sub-directory of the program folder
3
1.4. OPERATIONAL PRODUCTS IN THE STANDALONE
CHAPTER
VERSION
1. INSTALLATION INSTRUCTIONS
- select the file lapap-x.y.z.zip in the windows explorer.
- in the context menu (right-click) choose Extract All... and extract the file to a directory of your
choice, for example C:\Program Files.
This will create a directory C:\Program Files\lapap-x.y.z containing the complete Lapap Mk II distribution.
The Lapap Mk II software saves user specific information such as window position or workspace
changes. They are saved into an application configuration directory which is by default named:
%USERPROFILE%/.lapap
If you install the Lapap Mk II software onto a machine where a previous version had been installed
you may want to delete this directory or its contents to ensure a clean new environment and skip all
former configuration changes.
1.3.2
Starting the application
You can start the Lapap Mk II application by double-clicking on the file: C:\Program Files\lapap-x.y.z\bin\lapap.bat.
1.3.3
Exiting the application
Choose Exit from the File menu inside the application window.
1.4
Operational Products in the Standalone Version
In the standalone version of Lapap Mk II examples of operational data are contained for demonstration
purposes. Operational products are Synoptic Displays, ODF Procedures and Crew Documentation.
These products are located in dedicated sub-folders of the LAPAP Mk II directory structure:
share/displays
share/odf
share/doc
Here they can be easily exchanged if new data is available by simply replacing the files in these
directories. However, Lapap Mk II expects all data in a consistent set and the paths to these data need
to be preserved.
4
Chapter 2
Working with Lapap Mk II
This chapter describes the general work flow in Lapap Mk II. It will introduce the menu bar and the tool
bar. Also information on working with Workspaces and Plugins can be found here.
2.1
Menu Structure
This section describes the different functions that can be found in the Menu of Lapap Mk II.
2.1.1
File
The File Menu contains functionality to save the data in the Data pool buffer and to exit the application.
2.1.1.1
Reset Application
Resets the application. This means that all read only workspaces are reloaded and changes performed
to them are reverted.
In detail, the following actions are performed:
• Read only workspaces are reset to their initial layout.
• Documentation Viewer opens the default home page.
• Message Buffer View is set to its initial state.
• Preferences are set to their defaults. For detailed information about which settings are affected see
Section 2.4.
2.1.1.2
Save Data pool Buffer...
The Data pool Buffer saves the values of the Measurements within the last 30 minutes and stores them
automatically within a temporary binary file.
The menu item "Save Data pool Buffer..." is useful to export these data into *.csv format.
2.1.1.3
Exit
Choose this menu item to quit the Lapap MK II application. Before the application will be closed, a
confirm dialog appears which has to be confirmed by clicking the OK button.
2.1.2
View
This menu contains functionality to manage the different views of the application.
2.1.2.1
Show Message Buffer ...
Choose this menu item to open the Message Buffer View. For detailed information about the Message
Buffer View see Chapter 6.
5
2.1. MENU STRUCTURE
2.1.2.2
CHAPTER 2. WORKING WITH LAPAP MK II
Refresh Display Navigation Tree
Refreshes the Synoptics Hierarchy View.
2.1.2.3
Google / Table Style Search Results
These two menu items change the layout of the search results in the documentation workspace. Google
Style Search Results will make the results look like the results in www.google.com, while Table Style
Search Results displays the search results in a table.
2.1.2.4
Zoom in doc / Zoom out doc
This functionality changes the font size of the content in the documentation workspace. Images are not
affected by the zoom level and will stay in their default size (100%).
2.1.2.5
Clear Log
Clears the Lapap Mk II applications log. This log displays messages which track the user actions performed in Lapap Mk II.
2.1.2.6
Windows
The Windows sub menu contains the menu item: New Window... and a list of all windows which have
been created for the currently selected Workspace. The functionality of configuring Workspaces and
new windows is described in Section 2.3.
2.1.2.7
Workspaces
Opens a sub menu to choose a different Workspace. Workspaces can be seen as different views of the
content available in Lapap Mk II.
For detailed information see Section 2.3.
2.1.2.8
Add Plugin / Undock Plugin / Move Plugin / Remove Plugin
Lapap Mk II offers the possibility to load and integrate special Plugins into the Workspace. It is also
possible to undock the currently selected view, which will open it in an external window.
2.1.2.9
Split Frame
By using this menu item it is possible to split a frame into two new Frames. See Section 2.3 for detailed
information on Workspace layout.
2.1.2.10
Maximize... / Reset View
Maximizes the content of the active frame in the working area. After using this feature, the menu item
is renamed Reset View and will reset the view.
2.1.2.11
Show Log Window
Displays the applications user log. In this area near the bottom of the application window user actions
will be logged.
2.1.3
Display
2.1.3.1
Close
Closes the currently selected Display.
2.1.3.2
Close Others
Closes all other Displays except the one currently selected.
6
CHAPTER 2. WORKING WITH LAPAP MK II
2.1.3.3
2.1. MENU STRUCTURE
Undock
Undocks the current Display. See Section 4.1.1 for more information.
2.1.3.4
Cascade / Tile / Maximize All...
These are default window operations for the open displays.
I MPORTANT
The Application has to be in Window Mode to make these functions work.
See Section 2.1.3.5.
2.1.3.5
Toggle Tabbed Mode
Toggles the display mode of Synoptic Displays. See Section 4.1.2 for more information
2.1.3.6
Synoptic Default Size
Resizes a Display back to its native size. See Section 4.1.3.2.
2.1.3.7
Load Homepage...
Opens the Home Display.
2.1.3.8
Subsystem Overview
Opens the Functional Overview Displays of all subsystems.
2.1.3.9
Close all but Homepage
Closes all open displays except the Home Display.
2.1.3.10
Find Text As You Type
This functionality is related to Synoptic Displays. It can be used to find a specific item within the
display by searching for its name as it is shown in the display.
If a display is open, select Find Text As You Type and type the term you are searching for. The text
you have entered so far is displayed in the lower section of the display area. All items within the display
which match to the search term are highlighted with a yellow frame.
To stop the function press the ESC key.
2.1.3.11
Find Parameter In Other Displays
This function can be used to find other displays that contain a certain Measurement. See Find Parameter
In Other Displays.
2.1.3.12
Properties
Opens a dialog which shows the properties of the selected Display.
2.1.4
Documentation
The functionality found here is related to the Documentation Workspace.
7
2.2. TOOL BAR
2.1.4.1
CHAPTER 2. WORKING WITH LAPAP MK II
Find in page...
This will open a small dialog box to enter a search term. The currently loaded documentation page will
then be searched for the entered term.
2.1.4.2
Zoom in doc / Zoom out doc
This will aply a larger / smaller font size to the content in the documentation frame. Images are not
affected by the selected size. Alternatively this functionality can be accessed from the lapap tool bar.
2.1.5
Options
This menu contains only one entry: The Preferences Dialog.
2.1.5.1
Preferences
Opens the Preferencesdialog of Lapap Mk II.
See Section 2.4.
2.1.6
Help
2.1.6.1
Hot Key Help
This will open a help screen which gives information about certain hot keys (key combinations) and
about their functionality.
2.1.6.2
Current Display
This menu item opens the display specific help. Every display contains a link to a specific help page
which will be displayed in the Documentation Workspace.
2.1.6.3
ODF Documentation
Opens the ODF Documentation in the Documentation Workspace.
2.1.6.4
User Manual
Displays this document in the Documentation Workspace.
2.1.6.5
About
Opens an About dialog. The exact version and build number of the Lapap Mk II application can be seen
here.
2.2
Tool bar
This chapter gives an introduction to the Lapap tool bar.
Tool bar of Lapap Mk II
• Hot Key Help
This will open the Hot Key Help. "Hot Keys" are keyboard shortcuts which provide a fast
way to reach certain functionality within the application.
8
CHAPTER 2. WORKING WITH LAPAP MK II
2.2. TOOL BAR
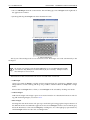
Hotkey Help Dialog
• Show Message Buffer
This will open the Message Buffer View. See Section 6.1.
• Workspace Chooser
This element can be used to choose a predefined Workspace. See Section 2.3.
• Maximize Frame
This will maximize the currently selected frame in the workspace. See Section 2.1.2.10.
• Window Actions
These Actions are used to control certain functions of the Synoptic Display Windows.
For more Information on how to handle windows in lapap see Section 4.1.
The actions are (from left to right):
– Cascade. Organizes the currently opened displays in a cascaded way.
– Tile. Organizes the currently opened displays in a tiled way.
– Maximize Maximizes the currently selected display within the Synoptic Display Area
– Toggle Tabbed Mode. This toggles between the tabbed and the windowed mode. See Section
2.1.3.5.
• Synoptic Actions
These Actions are used to invoke certain actions specific for Synoptic Displays. See
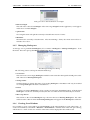
Chapter 4.
The actions are (from left to right):
– Default Synoptic Size. Sets the currently selected display to its Synoptic Default Size. See
Section 2.1.3.6.
– Load Homepage. This opens the Home Display.
– Subsystem Overview. This opens the Functional Subsystem Displays for all subsystems.
– Close all but Homepage. All other displays than the Homepage will be closed.
• Zoom Documentation
This will zoom in / out in the Section 9.3 Workspace. Zooming the documentation means
that the font size of the documentation content will be increased / decreased. Images are not
affected by the zoom level.
9
2.3. WORKSPACES
CHAPTER 2. WORKING WITH LAPAP MK II
C AUTION
When changing the font size of the documentation the currently visible position of
the document is not maintained.
• Reset Application
Resets the application. This means that all read only workspaces are reloaded and changes
performed to them are reverted.
• Back List / Forward List
These controls are related to Synoptic Procedures. They allow the navigation
through the history of procedures which have been opened in the Procedure Executor. Threre
are two ways to use the controls:
A simple click will move to the previous / next procedure in the history
A click on the small arrow on the left of the control will open a popup menu displaying all procedures that lie before / behind the currently selected procedure. To open a procedure from this list,
simply click it.
2.3
Workspaces
Workspaces can be considered as different display representations of the functionality and tools available in Lapap Mk II.
Workspace defines the frames presenting the crew interface to the Lapap Mk II tools. Frame locations
are fixed whereas the occupancy is defined by different frame sets, i.e. Workspaces. The menu bar and
the tool bars are not part of a Workspace and always present.
The predefined Workspaces which can be selected in the view Menu, but it is also possible to define
own Workspaces.
2.3.1
Plugins
Workspaces display their content using Plugins. A Plugin can be considered as a component that can
be integrated dynamically into the application. In fact, everything (except the menu and the tool bars)
within lapap is realised as Plugins.
As these Plugins are realized as self contained functional units, it is possible to customize the layout
of the application.
2.3.2
Predefined Workspaces
The following Workspaces are predefined and can be selected in the Menu View \ Workspaces. It is
possible to select a Workspace from the Workspace Chooser in the Lapap tool bar. Each Workspace is
designed for a special purpose.
One thing that all predefined Workspaces have in common, is that the System Message Panel is
always present.
• Synoptics
This is the default Workspace loaded at start up. This Workspace should be used to work with the
Synoptic Displays exclusively.
10
CHAPTER 2. WORKING WITH LAPAP MK II
2.3. WORKSPACES
Synoptics Workspace
• Synoptics & Proc.
This Workspace makes it possible to work with both Procedures and Synoptics at the same time.
Synoptics & Proc. Workspace
• Procedures
This Workspace focuses on working with procedures.
11
2.3. WORKSPACES
CHAPTER 2. WORKING WITH LAPAP MK II
Procedures Workspace
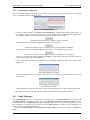
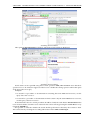
• CLSW Status
This workspace can be used to access the web front ends of the four Columbus CLSW Switches.
See Chapter 3 for more information.
CLSW Configuration Workspace
• Documentation
The focus of this Workspace is to display the Documentation available in Lapap Mk II.
12
CHAPTER 2. WORKING WITH LAPAP MK II
2.3. WORKSPACES
Documentation Workspace
2.3.3
Changing Workspaces
It is possible to change the layout of a Workspace (predefined or self created) and add or remove Plugins. If the layout of a Workspace has been changed and the application is closed, this changes will be
saved and restored at the next start of lapap.
Predifined Workspaces marked with an (R) are treated in a special way. The (R) stands for "read
only". These read only Workspaces can be changed in layout and content just like every non read only
Workspace but these changes aren’t saved when the application is closed. Another difference is that the
original layout of read only Workspaces will be restored if the Reset Application icon in the toolbar is
pressed.
2.3.4
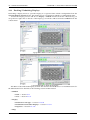
Creating Workspaces
To create an empty Workspace, choose View \ Workspace \ Create Workspace... from the menu. This
will create a new Workspace and remove all Plugins from the application leaving an empty working
area.
At first, the user is requested to enter a name for the new Workspace in the upcoming dialog box.
I MPORTANT
The menu item view \ Workspace \ Create Workspace will create a new Workspace in
the application main window. For reasons of readability the following figures will show the
process of configuring an own workspace in a new window. See Section 2.3.6.
Creating a new Workspace
After pressing the OK button, the new empty Workspace will be selected.
13
2.3. WORKSPACES
CHAPTER 2. WORKING WITH LAPAP MK II
Empty Workspace
I MPORTANT
The steps described in the following can also be performed on the predefined
Workspaces. But changes performed on Workspaces marked with an (R) won’t be saved
when the application is closed.
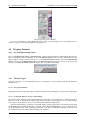
Now it is up to the user to design a new Workspace. It is possible to subdivide the working area into
smaller panels which are divided by horizontal or vertical splitters.
This can be done by right clicking anywhere into the empty frame and selecting Split Frame from the
context menu. This will divide the frame in two by a horizontal splitter. The orientation of the sliders
can be changed by context menu. To remove a frame set, choose Remove Frameset from the splitter’s
context menu. Of course, a frame of a frame set can be divided into two more frames
1: Context Menu in an Empty Frame
2: The Empty Frame is Split into a Frame Set
14
CHAPTER 2. WORKING WITH LAPAP MK II
2.3. WORKSPACES
3: Context Menu of a Frame Set Splitter
4: Frame Set After Changing the Orientation
The context menu for a splitter contains these menu items:
• Change Orientation
This will change the splitters orientation from vertical to horizontal and vice versa.
• Remove Frameset
This removes the splitter and unites the two frames into one. The Plugins which have been integrated into the two frames are now all integrated into one Frame.
• Resize Frameset
This will open a sub menu with radio buttons to choose the way the frameset should behave if the
application window is resized or the splitter is moved. Only one of the following settings can be
selected:
– Proportional
The Frames will be resized proportional, if the application window is resized. The splitter
can be moved manually.
– Proportional, Fixed
The Frames will be resized proportional, if the application window is resized., The splitter
can’t be moved manually.
– Left / Top
The left / top Frame will be resized proportional while the right / bottom Frame keeps its
size. The splitter can be moved manually.
– Left / Top, Fixed
The left / top Frame will be resized proportional while the right / bottom Frame keeps its
size. The splitter can’t be moved manually.
– Right / Bottom
The right / bottom Frame will be resized proportional while the top / left Frame keeps its
size. The splitter can be moved manually.
– Right / Bottom, Fixed
The right / bottom Frame will be resized proportional while the top / left Frame keeps its
size. The splitter can’t be moved manually.
After the working area has been organized into frame sets, it is time to put Plugins into them:
15
2.3. WORKSPACES
CHAPTER 2. WORKING WITH LAPAP MK II
• Choose Add Plugin from the context menu. This will bring up a list of Plugins at the right side of
the applications window.
• Just drag and drop the Plugins into their destination frame.
5: Add Plugin Opens the Plugins List
6: Integrated Plugin
The layout of the Workspace does not need to be saved. All changes are saved automatically to the
Workspace.
I MPORTANT
Be careful: even changes to the predefined Workspaces are saved immediately and without comment. Only Workspaces marked with an (R) are "read only". Changes made to
these Worspaces are not saved.
The functions in the context menu can also be accessed in the view menu:
• Add Plugin
Opens a list with all Plugins available and not integrated into the application. Plugins can be
integrated into a frame via drag and drop. It is possible to add more than one Plugin into a single
frame.
If more than one Plugin share a frame, a certain Plugin can be selected by clicking onto its tab.
• Undock Plugin
Undocks the Plugin. The Plugin opens in an external window. For detailed information on docking and undocking Plugins, see Section 4.1.1.
• Move Plugin
Selecting this item in the menu will open up a small dialog showing graphical representations of
the different Frame sets within the application. The selected Plugin’s frame is shown in dark gray.
Select the destination of the selected Plugin by clicking into one of the light gray representations,
and the Plugin will be moved to the according Frame
16
CHAPTER 2. WORKING WITH LAPAP MK II
2.3. WORKSPACES
Dialog to Choose the Destination of a Plugin
• Remove Plugin
This will remove the selected Plugin. After removing a Plugin from the application, it will appear
in the list of available Plugins.
• Split Frame
Choosing this item will split the currently selected frame into two frames.
• Maximize
Maximizes the currently selected Frame. After maximizing a frame, the menu item will be renamed to Reset View...
2.3.5
Managing Workspaces
To manage own or predefined Workspaces, choose View \ Workspaces \ Manage Workspaces... from
the menu. This will open up the Manage Workspaces dialog.
The Manage Workspaces dialog
The following actions can be performed in this dialog:
• Create New
This will create a new empty Workspace with the name entered in the input field and put it at the
end of the list of Existing Workspaces.
• Change Name
Click this button to change the name of an existing Workspace. This Button will only be enabled
if a existing Workspace has been selected before.
• Delete
To delete an existing Workspace, select it in the list and press the Delete button. If the deleted
Workspace was the one currently selected, the first one in the list will automatically be selected.
• Move Up / Down
This will move the selected Workspace up or down in the list of Existing Workspaces. The order
in the list is the order in which the Existing Workspaces will appear in the Workspaces sub menu.
2.3.6
Creating Own Windows
It is possible to create own windows in which Plugins can be integrated like in each other frame. To
create a new Window, select View \ Windows \ New Window... from the menu. This will open a dialog
which asks for a name for the new window. This name will be displayed in the window title.
17
2.4. PREFERENCES
CHAPTER 2. WORKING WITH LAPAP MK II
Self Created Empty Window
After one or more Windows have been created, they are listed in the View \ Windows menu. The
way how Plugins can be integrated into them is similar to integrating Plugins into frames of the main
window.
Custom windows are directly connected to the Workspace in which they have been created. As a
consequence they will be only visible if this Workspace is currently selected. Even the View \ Window
menu only contains the windows for the current Workspace.
If the user closes a window, the application will display a confirmation dialog. After the user confirmed, the window will be closed and its layout will be lost.
The windows (unless they have been closed) will be available after the application has been restarted.
2.4
Preferences
To change preferences for the Lapap Mk II application choose Options \ Preferences from the menu.
This will open the Preferences Dialog.
If the application is closed and reopened or Reset Application is chosen from the menu or the tool
bar, some of the Preferences will be set to their default values:
• Audio Notification
– All check boxes selected.
• Search
– Search results layout = Google Style.
• Datapool Buffer
– Auto-export datapool buffer selected.
– Auto-export incremental selected.
• Tool Tips
– Activate selected.
2.4.1
Audio Notification
This section provides the possibility to associate sound files with specific events in the Lapap Mk II
application. Every time an event occurs, the configured sound file will be played.
2.4.2
Search
Here you can select the Search Result Layout. You can select between Google Style and Table Style.
2.4.3
Datapool Buffer
These options are related to the export functionality of the Datapool Buffer.
• Auto-export datapool buffer
This will enable the automated export of the Datapool buffer.
18
CHAPTER 2. WORKING WITH LAPAP MK II
2.4. PREFERENCES
• Auto-export incremental
This option controls the amount of data which is exported on each auto export. if Auto-export
incremental is selected, only the updates which arrived since the last export will be saved. If it is
not selected, each export will contain the updates of the last 30 minutes.
2.4.4
Tool Tips
Select or delesect Activate if you want to turn on or off the tool tips in Lapap MK II.
19
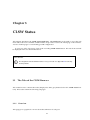
Chapter 3
CLSW Status
This Chapter introduces the CLSW Status Workspace. This Workspace can be used to access the web
front ends of the four Columbus CLSW Switches. It provides access to the initial page of the switches.
Access to further pages is controlled by ground configuration.
To open one of the four pages, click on the according CLSW Status button. The web front end will
be displayed in the area below the buttons.
I MPORTANT
The integration of the CLSW web interface is not yet smooth. See Appendix B for currently
known problems.
3.1
The Tabs of the CLSW Browser
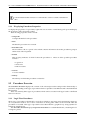
The CLSW browser contains three tabs (displayed as three gray buttons below the CLSW Status buttons). These tabs contain the following sub pages:
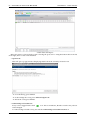
3.1.1
Overview
This page gives a graphical overview about the utilization of each port.
21
3.1. THE TABS OF THE CLSW BROWSER
CHAPTER 3. CLSW STATUS
CLSW Status Workspace
Below the chart is a list in which events concering the ports arrive. Using the buttons below the list
on the right, these events can be handled.
• Open Event
This will open a popup window displaying details about the currently selected event.
- To close the dialog, press Cancel.
- To Acknowledge the event, press Acknowledge Event.
- To delete the event, press Delete.
• Acknowledge Selected Event
Every event is tagged with a small
acknowledged.
icon. This icon indicates, that the event has not yet been
To Acknowledge selected events, just click the Acknowledge Selected Events Button.
22
CHAPTER 3. CLSW STATUS
3.1. THE TABS OF THE CLSW BROWSER
• Delete Event
This will delete the currently selected event(s).
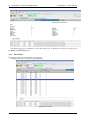
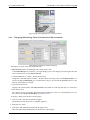
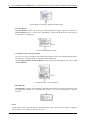
3.1.2
Port Counters
This page displays certain counters for each port in a list.
To refresh the list, press the Refresh button. To view the details of a port, select it and press the
Details for Selected Port button.
CLSW Port Counters
- To refresh the list, press the Refresh button.
- To view the details of a port, select it and press the Details for Selected Port button. This will open
the Details page:
23
3.1. THE TABS OF THE CLSW BROWSER
CHAPTER 3. CLSW STATUS
The details page gives a detailed overview about the port. To get back to the previous page, press
the Return to Summary button.
3.1.3
Port Status
This page displays the current States of each port.
This page offers only one functionality: Refresh.
CLSW Port Counters
24
Chapter 4
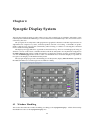
Synoptic Display System
The Synoptic Display System provides online access to the nominal part of columbus’ subsystems. Data
is directly derived from the DMS data pool and command are initiated directly to the on-board execution
software by the crew.
The synoptics show subsystems and equipment in graphical schematics with data representation in
alphanumerical output boxes, states, animated symbols and line colorcoding. Commands are predefined so that the crew can issue the command by either clicking on a button or selecting the command
from a list then clicking Execute.
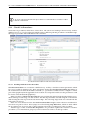
The displays in Lapap Mk II are organized in a hierarchical way. There is a main display showing an
abstract overview of the whole columbus module with all its subsystems. It is by default configured as
the Home Display and will be loaded automaticaly at application startup. It can be opened by clicking
onto the Load Homepage button in the toolbar or in the View menu. From this display it is possible to
navigate to the displays of the different subsystems.
The Synoptic Displays provide commanding for all subsystems, display Measurements acquired by
the DMS and indicators of limit supervision and data validity.
The Synoptics Home Page
4.1
Window Handling
This section describes the window handling according to the Synoptic Displays. All the functionality
described here refers to the Synoptic Display area.
25
4.1. WINDOW HANDLING
4.1.1
CHAPTER 4. SYNOPTIC DISPLAY SYSTEM
Docking / Undocking Displays
Undocking a display means to open the Display in a separate frame which is independent from the
Synoptic Display Executor frame. This Frame has an own menu bar with the according Menu items.
To undock a Display, select it and choose Display \ Undock from the menu bar. Alternatively you
can perform a right click on the tab of the Display you want do undock and select Undock from the
context menu.
Lapap MK II With a Docked Display
Lapap Mk II With an Undocked Display
The Menu of the undocked Display contains the structure described below. To find Instructions for
the Menu Items follow the links to the referring sections in this manual.
• Window
– Dock --> Section 4.1.1
– Close --> Section 2.1.3.1
• Display
– Find Text As You Type --> Section 2.1.3.10
– Find Parameter In Other Displays --> Section 2.1.3.11
– Properties --> Section 2.1.3.12
• Help
26
CHAPTER 4. SYNOPTIC DISPLAY SYSTEM
4.2. SYNOPTIC NAVIGATION BUTTONS
– Current Display --> Section 2.1.6
To dock the Display, choose Window \ Dock from the Displays menu bar.
4.1.2
Toggling Tabbed Mode
Displays can be shown either on a tabbed window (one window at a time) or as iconized internal windows (many in parallel). This option toggles between these two modes.
In this manual the mode showing the displays as independent internal windows will be called "windowed mode", and the mode showing one window at a time will be called "tabbed mode".
To toggle between the two modes press the
Tabbed Mode from the menu bar.
icon in the tool bar or select Display \ Toggle
If the application is set to tabbed mode, each display will be shown in the Synoptic display hierarchy
in full size. To switch between displays the tabs have to be used.
While in windowed mode, each display will be shown in a own internal Window which can be
resized and moved.
4.1.3
Display Size
4.1.3.1
Changing Display Size
Displays can be maximized within the Synoptic Display area using the maximize button of the internal
frame. If a Display is not maximized, it can be resized like any other window by clicking and dragging
its borders to the desired size.
4.1.3.2
Synoptic Default Size
Although the size of a Display can be chosen manually, there is a default size for each Display. This
original size is the size it has been designed for and in which it can be viewed best.
To restore this default size select Display \ Synoptic Default Size from the menu or click the referring icon
in the tool bar.
I MPORTANT
This does only work if the synoptic display area is not set to Tabbed Mode.
4.2
Synoptic Navigation Buttons
Every Display contains specific navigation buttons on the right side. These buttons represent the different subsystems of the columbus module and selecting one of them opens the "Functional Overview"
- display of the according subsystem. The home display contains an additional Button to close itself.
Every sub display contains a button at which (re)opens the home display.
27
4.3. DISPLAY FEATURES
CHAPTER 4. SYNOPTIC DISPLAY SYSTEM
The Synoptic Navigation Buttons
For every open display a tab is displayed on top of the "synoptic display area" allowing the crew to
return to an previously opened display by clicking on it.
4.3
4.3.1
Display Features
Overall Monitoring Status
The overall Monitoring Status of Measurements on the particular display is indicated by the small indicator in the title (or tab) of a display. If one of the Measurements is out of its soft or hard limits, it turns
light orange or orange. It always has the color of the Measurement with the most critical Monitoring
Status. (I.e. the overall Monitoring Status of the Home Display shown here is shown as an orange dot,
because some Measurements within the display are out of their hard limits).
Overall Monitoring State Indicator
4.3.2
Element Types
Synoptic - Displays can contain different types of command or control elements which offer different
functionality.
4.3.2.1
Navigation Buttons
Rectangular buttons with sharp edges are Buttons which will open displays of certain sub components.
4.3.2.2
Command Buttons / 2 Step Commanding
This special kind of button can be identified by its round edges. These buttons have a different kind of
behaviour as the normal buttons within Lapap Mk II. They do not open displays or have other navigation features. These Buttons are to execute commands within the subsystems.
Instead of immediately executing a command when pressing it, the button will remain pressed until
the Execute Button within the display is clicked. This 2 Step Commanding is a way to help the user
avoid making mistakes while executing commands, as he has to select the command an execute it in
two different steps rather than simply clicking onto a button.
28
CHAPTER 4. SYNOPTIC DISPLAY SYSTEM
4.3.2.3
4.3. DISPLAY FEATURES
Measurements
Measurements are numerical representations of certain values in different subsystems (i.e. temperature,
water flow, pressure, etc.). They are usually displayed as output boxes with black text and a white
background. They change their background color according to certain situations. These colors indicate
their Monitoring Status. The following table illustrates the meaning of each possible background color.
Table 4.1: Meaning of Measurements Background Color
Color
Valid
White
Pale Green
Light
Orange
Orange
Purple
Monitored
X
X
X
X
X
X
X
Out of Soft
Limits
Out of Hard
Limits
X
X
• White
The value is valid and within its normal range.
• Pale Green
The value is valid, within its normal range and monitored.
• Light Orange
The value is beyond its soft limits.
• Orange
This value is beyond its hard limits.
• Purple
The value is not valid. This situation may occur if the connection to the DMS is lost. Additional a status indicator "M" is shown. (M means "missing).
There are two important properties for each measure: Monitoring Status and Acquisition Status.
These Properties can be viewed in detail in the Properties Dialog of a certain Measurement.
• Monitoring Status
Monitoring means that a Measurement is observed by a mechanism determining if the value is
within the ranges of its soft and hard limits, or is as expected.
• Acquisition Status
The acquisition of a Measurement value is the point of time at which the value was retrieved from
the data pool.
4.3.2.4
Graphical Elements
Within certain displays, there are a number of inactive elements (like arrows, lines and symbols) which
do not provide any functionality except changing its color or appearance depending on the values and
states of certain Measurements.
4.3.3
Display Context Menus
Every display contains elements that provide a context menu. It can be opened by clicking the right
mouse button within the display. Depending on the display area location where the context menu is
instantiated different options are provided:
If the context menu is opened by clicking into an empty area within the display, these general options
will appear:
29
4.3. DISPLAY FEATURES
CHAPTER 4. SYNOPTIC DISPLAY SYSTEM
• Copy Display Title to Clipboard
Copies the exact title of the current display into the systems clipboard. This functionality is useful
if the user wants to use the exact title of the display in another application (i.e. Open Office).
• Show Information...
Opens help for the current display within the Documentation Plugin.
These general options are also available in the context menus of all other element types within a
display.
4.3.3.1
Context Menu for Buttons
Buttons provide a special properties dialog within the context menu. The items in this context menu
are:
• Properties
The Properties Dialog for the button contains two tabs with the following properties:
– Tab: General
∗ Enabled: values {yes | no}, if yes, the button will work.
– Tab: On Press
∗ Action: The action this button will perform. In General it will open the display of a
component within the subsystem.
∗ New Window: values {yes | no}, if yes, the display linked to this button will be opened
in a new window (or tab)
4.3.3.2
Context Menu for Labels
Labels provide the function Copy Label to Clipboard. Choosing this menu item will copy the caption
of the label into the clipboard.
4.3.3.3
Context Menu for Measurements
Measurements offer the most complex context menu of all element types. The context menu will look
slightly different depending on what type the current Measurement is. As the differences are only
slight, this section does not deviate between the both types.
P ROPERTIES
• Properties
The Properties Dialog provides detailed information about a Measurement or a Computation.
I MPORTANT
The values in the Properties dialog of a Measurement are not updated by default.
That means the displayed values are retrieved when the dialog is opened and not
further updated and may deviate from the ones which can be seen in the Synoptic
Display. Select the checkbox update in the top of the dialog to enable real time
updates.
The following list contains the most important properties:
– Data Source Type
values {Telemetry | Computation}.
∗ Telemetry
A Telemetry is a value which is directly measured within a component (i.e. a temperature, water flow, etc.)
30
CHAPTER 4. SYNOPTIC DISPLAY SYSTEM
4.3. DISPLAY FEATURES
∗ Computation
A Computation isn’t a directly measured value. It’s a value which is the result of a calculation that combines different values.
– Opsname
A string containing a short, unique name for the Measurement.
– Pathname
The Pathname is the hierarchical position of the Measurement in the MDB (Mission Data
Base).
– SID
The SID is another unique identifier for the currently selected Measurement. In this case a
number.
– Formatted Value
This value represents the Measurement as it will be displayed in the Synoptic Display. The
source of this formatted (and displayed) value depends on the property Output.
– Raw Value
The raw value is the raw data derived from the source of the Measurement. I.e. a temperature
sensor provides the measured temperature not "as is", but as a value that has to be interpreted.
– Engineering Value
The engineering value is a value calculated from the raw value of a Measurement. I.e. the
temperature measured by a temperature sensor calculated from its raw data.
– Engineering Unit
The unit in which the Measurement is measured. For example: A temperature measured in
◦ C will have the engineering unit degC.
– Type
The kind of data. (i.e. a numeric value, a state like ON or OFF, etc.)
– Output
This property controls the source for the formatted value. Values can be "Engineering value"
or "Raw value".
– Acquisition Status
Indicates whether the value is acquired (values are reported from the data source) or not (no
connection to the DMS data pool could be established or the data could not be acquired by
the DMS)
– Monitoring Status
Indicates whether the value is monitored or not.
– Soft Limit (lower) / Soft Limit (upper)
The borders for the soft limit of this value.
– Hard Limit (lower) / Hard Limit (upper)
The hard limit borders of this value.
I MPORTANT
The initial limits for each Measurement are configured within the MDB (Mission Data Base). For information related to limits see Section 4.4.
– Expected Value
The expected value of the Measurements monitoring. See Section 4.4.2 for more information.
– Acquisition Time
The time the current value of this Measurement has been retrieved
– Time Since Acquisition
The time that has passed since the acquisition time has been retrieved. Its the "age" of the
value.
31
4.3. DISPLAY FEATURES
CHAPTER 4. SYNOPTIC DISPLAY SYSTEM
• Show In Quick Graph
This menu item opens the Line Graph for the current Measurement. See Section 4.3.4 for more
information.
• Find Parameter In Other Displays
This functionality is useful if the user wants to find a certain Measurement which is referenced by
more than one display.
To search for a Measurement in other displays move the mouse pointer over the menu item. A sub
menu showing the Opsname of the Measurement opens. Select the Opsname of the Measurement
to open the Find Parameter dialog.
While searching for displays containing the Measurement, a progress bar will be displayed, showing the search progress.
There are some actions available (even while the search is still running):
– Stop
Stops the search. This function is useful if the searched display has already appeared in the
search results and no further searching is needed.
– Select All
Selects all displays found.
– Open
Opens the selected displays.
– Close
Closes the "Find Parameter" - dialog
Find Parameter Dialog
• Copy Computation to Clipboard
If the current Measurement is a Computation, it is possible to copy the rule which is used to
calculate it into the systems clipboard.
• Copy Opsname to Clipboard
If the current Measurement is a Telemetry, it is possible to copy its Opsname into the systems
clipboard.
• Change Monitoring Values
This will open the Limit Manager for this value. The Limit Manager may be used to change the
soft limits for a Measurement. See Section 4.4 for Details.
4.3.4
Quick Graphs
4.3.4.1
Purpose of Quick Graphs
A Quick Graph is a graphical representation of the according Measurement. It shows the values of the
Measurement in relation to the time as a graph. The soft and hard limits are also displayed. Because of
this it is easily possible to identify if a value is leaving its limits repeatedly.
32
CHAPTER 4. SYNOPTIC DISPLAY SYSTEM
4.3. DISPLAY FEATURES
Graphs display the value of a certain Measurement and its changes over a period of time as a graphical diagram. A Graph can be opened by right clicking upon the value which should be displayed and
choosing Show In Quick Graph from the context menu.
I MPORTANT
There is always only one Quick Graph open. If "Show As Quick Graph" is selected for
another Measurement, The already opened Quick Graph will show both the graphs.
The window of a Quick Graph can be rescaled and the graph will fit its size according to the window.
It is also possible to interact with the graph’s axes to get a better view of a certain region in the graph.
Line Graph of 4 Numerical Measurements
4.3.4.2
Axis Functionality
The Quick Graph can be scaled and moved along its axis to get a better view of a certain region within
the graph.
• Moving Along an Axis
To shift the content of the Quick Graph along an axis, simply click and drag on the axis description.
After releasing the mouse, the graph will be redrawn.
• Scaling Along an Axis
To scale the axis, click and drag on the axis description while pressing the CTRL key.
I MPORTANT
To make it easier to find the correct position in the Quick Graph to use one of the
functions described above, the cursor will change to a hand cursor.
4.3.4.3 Context Menu of a Quick Graph
A Line Graph offers a context menu with the following entries:
33
4.3. DISPLAY FEATURES
CHAPTER 4. SYNOPTIC DISPLAY SYSTEM
• Save Snapshot
This function saves the current state of the line Graph into a *.PNG image into the users home
directory.
• Show Information
This menu item opens the help dialog of the according display.
• Copy Display Title to Clipboard
This will copy the title of the display according to the Measurement into the operating systems
clipboard.
The Quick Graph offers a different context menu for its axes. (To open this context menu, move the
mouse over an axis description until the cursor changes to a hand cursor):
• Axis Reset
If the axis values have been changed before, this menu item restores the default values for the axis.
• Axis Auto-Range
If this checkbox is selected, the scaling of the axis will be automatically adapted to the values in
the graph so that the minimum and maximum value of the axis are within the visible region of the
graph.
• Axis Auto-Move
If this checkbox is selected, the graph will scroll to keep the last update within the visible range.
4.3.4.4
Linegraph Menu
If the Line Graph is in an undocked Window, it provides a menu bar with the following structure:
• File
– Create HTML Report
This functionality is useful to generate a detailed report about the current state of the visualized Measurement. The Report will be saved into the user’s configuration directory
– Save Snapshot
This function saves the current state of the line Graph into a *.PNG image into the user’s
configuration directory.
– Print
This will open a common printer dialog to configure the printer settings and to print the
current state of the line graph.
– Print Preview
To setup the page before printing the line graph, choose this menu point. To take a look at the
preview of the page as it would be printed, click the OK button.
– Properties
Choose this menu item to open a dialog showing the properties of the line graph.
– Close
This will close the line graph window.
• Window
– Dock
Choose this menu point if you want to dock the line Graph window into the Synoptic Display
area.
– Close
Choose this menu point if you want to Close the Quick Graph.
• Help
– Current Display
This will open the display help for the display according to the line graph.
34
CHAPTER 4. SYNOPTIC DISPLAY SYSTEM
4.3.5
4.4. LIMIT MANAGER
Performance Indicators
The Performance indicators in lapap inform inform about the synoptic system’s performance and the
source of the displayed time in the toolbar.
Performance Indicators
• The first indicator item is the Display Refresh Indicator. It informs about the update latency of
the display. Update latency is the time between receiving the data and finishing the rendering of
the display. It can be found at the left of the applicatons time in the toolbar.
Performance Indicator Shows: Update Latency < 800 ms
If the update latency is less than 800 milliseconds the icon is green.
Performance Indicator Shows: Update Latency between 800 and 2000 ms
If the latency is between 800 and 2000 milliseconds the color changes to light orange.
Performance Indicator Shows: Update Latency > 2000 ms, data is dropped
If its color is orange the latency is bigger that 2000 ms. That means that data is dropped, because
data from interface cannot be handled.
• The second item concerns the time distribution. It indicates whether the time is derived from the
DMS or not.
Time Field: DMS Derived Time
If the time displayed in the toolbar is derived from the DMS, it will be displayed with a gray
background.
Time Field: Local Time
If the DMS time can’t be derived, the local time will be displayed on a light orange background.
More information about the communication state of the DMS can be found in Chapter 5.
4.4
Limit Manager
The Limit Manager is a tool to change the monitoring values of a Measurement. It is realized with
Synoptic Displays. Depending on the type of the Measurement (numerical Measurements or State
codes based on discreet Measurements) the according display will be opened allowing the user to set
the soft limits or to declare an expected value for the Measurement. As the two types of displays are
different, they are described separately.
To open the Limit Manager select Change Monitoring Values from the context menu of a Measurement.
35
4.4. LIMIT MANAGER
CHAPTER 4. SYNOPTIC DISPLAY SYSTEM
Opening The Limit Manager For a Measurement
4.4.1
Changing Monitoring Values For Numerical Measurements
Limit Manager (Numerical Measurement)
The display consists of the following elements:
• Measurement Name (in the display title) and current value
as the Limit Manager is realised as a synoptic displays, the value displayed on the right offers the
same context menu as other Measurements.
• Command Buttons to enable / disable monitoring
Using this command buttons enables / disables the monitoring of the current Measurement. As
usual in 2 Step Commanding, the command will only be executed if the Execute button on the
bottom of the display is clicked.
• Current Limits section
Displays the current limits of the Measurement. The fields are read only and only for verification.
• Set Limits section
New Limits can be entered into the input fields. Besides the values are command buttons to set
the values with 2 Step Commanding. See Section 4.3.2.2.
To change a limit, perform the following steps:
1. Click onto the value that should be changed
The displayed value turns into an editable input box
2. Enter the new Value
3. Click the command button besides the changed value
This will enable the Execute button at the bottom of the display.
36
CHAPTER 4. SYNOPTIC DISPLAY SYSTEM
4.4. LIMIT MANAGER
4. Click the Execute Button at the bottom of the display
The new value will be updated immediately and can be verified in the current limits section after
the next data pool update.
If invalid data or a value that is not allowed has been entered, a message window will open and
inform the user. The invalid value will be replaced with the current setting.
Changeable values:
• Soft High Limit / Soft Low Limit
The upper / lower border of the soft limit range. These values may only be changed to values
within the hard limits of the Measurement. The Soft High Limit has to be greater than the current
Soft Low Limit and the Soft Low Limit has to be smaller than the current Soft High Limit.
• Soft nCount
This value determines how often the monitored Measurement may leave the range of its soft limits
before a SAW Message will be generated.
4.4.2
Changing Monitoring Values For State codes (Based on Discreet Measurements)
Limit Manager (Discreet Measurement)
The display for discreet Measurements consists of basically the same elements as a display for numerical ones, except:
• Set Limits section
The Expected Value can be selected from the drop down box rather than typing the new value.
The nCount value can be entered into the input field. Besides the values are command buttons to
set the values with 2 Step Commanding.
Changeable values:
• Expected Value
As discreet Measurements can only be set to specific values, there is no "range" in which the
value should be. This is why discreet Measurements have no soft or hard limits. Instead they are
checked for an expected value.
• Soft nCount
This value determines how often the monitored Measurement changes into a State code which is
different from the expected value.
37
Chapter 5
Status Displays
There are four icons in the Lapap tool bar which inform the user about the communication state of
certain elements. These elements are displayed using different colors to inform about the state of the
system they represent.
Depending on which element is considered, these colors have to be interpreted differently.
Status Displays
5.1
Station Mode
As long as values for the Station Mode can be acquired, its icon will indicate the current value of the
Station Mode. Its background color depends on the current mode.
If the Station Mode value could not be acquired, the icon will be displayed with a purple background,
showing a question mark.
Table 5.1: Station Mode Values
Symbol
Meaning
Standard
Microgravity
Reboost
Assured Safe Crew Return
Proximity Operations
External Operations
Survival
Value can’t be acquired.
39
5.2. STATION MODE COMPATIBILITY
5.2
CHAPTER 5. STATUS DISPLAYS
Station Mode Compatibility
The Station Mode Compatibility indicator shows if the current Columbus mode is compatible to the ISS
station mode:
• pale green: Status measurement could be acquired, Columbus mode is compatible with the current ISS station mode.
• orange: Status measurement could be acquired but the current Columbus mode is not compatible
with the ISS station mode.
• purple: Status measurement could not be acquired.
5.3
DMS Status
The status of the DMS is indicated using two different visual components. The first one is the DMS
Status Display and the second one is the DMS time shown in the Date and Time Group.
Depending on the acquisition state of three certain Measurements in the data pool the background
color of the DMS Status Display is chosen.
• pale green: One or more Measurements can be acquired and a physical connection to the DMS
therefore exists.
• gray: None of the defined Measurements can be acquired and a loss of connection to the DMS is
assumed.
The background color of the DMS time in the Date and Time Group depends on its acquisition state:
• gray: DMS time can be acquired.
• light orange: Loss of DMS time distribution.
See Section 4.3.5 for more information about the DMS time.
5.4
S-Band / KU-Band
The link state indicators use the following policy to determine their background color:
• pale green: Status measurement could be acquired, a connection is present.
• gray: Status measurement could be acquired but its value indicates that no connection is present
(Loss Of Signals).
• purple: Status measurement could not be acquired. No connection is present.
40
Chapter 6
System Message Panel
This chapter describes the usage of the System Message Panel (SMP). The SMP is used to display the
messages which are send by the different subsystems.
The SMP is divided into two different views:
- The System Message Panel at the bottom of the Lapap application window displaying the last 5
messages. This view cannot be filtered or sorted.
- A view called Message Buffer View which allows the user to view all messages. It allows the user
to filter and sort the messages and to save and load a set of messages
Another set of components related to this functionality can be found in the tool bar. The SAW Icons.
The SAW Icons
The Message Buffer View in combination with this icons is needed to handle the Situational Awareness - functionality. See Chapter 7 for more information.
6.1
The Message Buffer View
The Message Buffer View is a separate window displaying all or a subset of the messages. There are
several ways to open it:
• By right-clicking onto the header of the System Message Panel at the bottom of the Lapap application window and selecting Show Message Buffer from the context menu.
• By double-clicking onto the header of the System Message Panel.
• By choosing Show Message Buffer... in the View menu.
• By clicking The Message Buffer View Icon in the Toolbar. See Section 2.2
• By clicking onto a SAW Icon in the tool bar.
Some Messages will be displayed in a different color (i.e. OUT OF LIMIT) to show their Situational
Awareness context.
The Message Buffer View
To get a better view of the text of a certain message without resizing the Message Buffer View just
double - click the message. A tool tip will be displayed showing the full text.
41
6.1. THE MESSAGE BUFFER VIEW
CHAPTER 6. SYSTEM MESSAGE PANEL
The tool tip of a message
6.1.1
The columns in the Message Buffer View
Every message in the Message Buffer View contains different fields. These are:
6.1.1.1
Time
The on-board time at which the message was generated.
6.1.1.2
Classification
The classification of the message. There are four possible values: "OUT OF LIMIT", "ADVICE", "ERROR"
and "INFO". The following list shows the Classifications sorted from important to less important.
• OUT OF LIMIT
"OUT OF LIMIT" - Messages can occur in two possible cases. At first they occur if a monitored
measurement leaves its range. The second case in which OUT OF LIMIT messages may appear
are critical errors, i.e. if a certain software component in the columbus module crashes.
For more information on measurements and monitoring, see Section 4.3.2.3.
• ADVICE
Indicates a message which should be understood as a message with a higher priority as a message
of the type INFO. Though they do not indicate critical errors or malfunctions, users should always
check messages of this type.
• ERROR
Indicates the occurrence of an operational or functional error in a subsystem. I.e. the user has tried
to execute a command which was not allowed at that point of time.
• INFO
A message with this classification is an general information.
6.1.1.3
Subsystem
The subsystem according to the current message.
6.1.1.4
Equipment
The equipment of the subsystem. A equipment can be understood as a complete functional unit within
a certain subsystem, not only a single construction unit (like screws, LEDs, etc).
6.1.1.5
Text
A human readable, textual description of the message.
42
CHAPTER 6. SYSTEM MESSAGE PANEL
6.1.2
6.1. THE MESSAGE BUFFER VIEW
Sorting the columns of the Message Buffer
When the Message Buffer View is opened, it will be sorted ascending by Time.
The Messages in the Message Buffer View (and in the System Message Panel) can be sorted by
clicking onto the header of the according column. After a column has been sorted, a small arrow in the
header of the column shows whether the order is ascending or descending.
It is possible to sort the list according to more than one column. The column which has been clicked
most recently provides the main order (i.e "Classification"). The messages are sorted in a way that
ensures the entries in the Classification column are ascending. So the previously sorted column ("Subsystem" in this case), is sorted ascending too, but respecting the main order of the Classification column.
To reset the sort, double click on a column. This will apply the main order to it and remove the
assortments of all other columns.
Sorted by "Classification" as the main order and then by "Subsystem".
6.1.3
Actions in the Message Buffer View
On the right side of the Message Buffer View window are different buttons which offer functionality to
filter the list, to load and save sets of messages and to freeze and unfreeze the list.
6.1.3.1
Filter
The filter functionality can be used to find a certain message. Also the amount of displayed messages
in the Message Buffer View can be decreased. There are several criteria according to which the messages
can be filtered.
The Situational Awareness check boxes at the top of the Message Buffer View are mentioned in
Chapter 7.
The Filter Controls for the Message Buffer View
• Filtering according to the message time:
Clicking on the Time Filter... Button opens the System Message Time Filter dialog. This dialog
can be used to define a Filter for the time of the messages.
43
6.1. THE MESSAGE BUFFER VIEW
CHAPTER 6. SYSTEM MESSAGE PANEL
The System Message Time Filter
The following filtering options can be selected:
–
–
–
–
N/A: The messages will not be filtered according to the time they arrived
Since: All messages since this point in time will be displayed in the Message Buffer View
Until: All messages that occurred earlier than this point of time will be displayed
Range: All messages within the selected range will be displayed
If any option except N/A is selected, one or both text fields will be enabled. A click on the clock
symbol next to an enabled text field open a simple calendar dialog. This dialog can be used to
select a time for one of the text fields. The title of the calendar dialog indicates which date will be
configured.
Calendar Dialog
In this calendar the desired point of time can be selected. Click the button OK to set the selected
point of time in the filter dialog, or click Clear to remove an existing selection. The button Now
selects the current time in the calendar dialog.
• Filtering according to the other fields of the message:
There are two drop down and two text fields for the related attributes of a system message. Use
these text fields to search for messages with a certain attribute.
– Classification
This drop down box can be used to select the classification of the messages which shall be
found
– Subsystem
This drop down box can be used to select the subsystem to which the messages shall belong.
– Equipment
Enter search criteria for the field "equipment" into this text field.
– Text
Enter search criteria for the field "text" into this text field.
You may use wild cards in the two text fields. The wild card * (one or more characters) and ?
(exactly one character) are supported by the filter.
Filter Filled
44
CHAPTER 6. SYSTEM MESSAGE PANEL
6.1. THE MESSAGE BUFFER VIEW
I MPORTANT
Messages from the subsystem DMS will always be displayed, even if they don’t
match the filter criteria.
6.1.3.2 Clear
A click on this button removes every message from the Message Buffer list. The messages are simply
hidden and an empty list will be displayed. There is no way to permanently delete the messages from
the system. To bring back the messages that have been hidden, click Sync.
6.1.3.3 Sync
A click on this button "synchronizes" the Message Buffer View with the system. This means that all
messages since the start of the application will be displayed. All filters will be removed. If old messages
had been loaded into the Message Buffer View, they will be removed to display the current messages.
6.1.3.4 Freeze
If the Message Buffer View is frozen, no new Messages will be displayed in the message list. This
behavior is helpful when a user searches for a specific message in the list. So he won’t get irritated by
new messages appearing in his search results. As long as the Buffer is frozen, the caption of the Freeze
- button will change to Live.
If the messages in the view are saved to a *.CSV - file while it is frozen, only frozen messages will
be saved to the file.
6.1.3.5 Live
The "Live" - button unfreezes the Message Buffer View and all messages that have been sent while the
Message Buffer View was frozen will appear in the list. The Live - button also removes loaded message
snapshots from the buffer and returns to the current messages.
6.1.3.6 Load
It is possible to load a set of old messages into the Message Buffer using the Load - Button. After a set
of old messages has been loaded, only these old messages will be displayed in the Message Buffer. To
return to the live messages click onto the Live button. The loaded messages will then be discarded.
6.1.3.7 Save
To save the messages which are currently in the Message Buffer View, use the Save - Button.
I MPORTANT
All live (or frozen) messages will be saved to the file, even if they do not match the current
filter settings. Instead of saving only matching messages the filter settings are put into the
*.CSV - file. After a reload the filter settings in the file are set automatically !!!
6.1.3.8
Acknowledge & Close
If the Message Buffer was opened in situational awareness context this button is enabled. See Section
7.5.1 for more information.
45
6.1. THE MESSAGE BUFFER VIEW
6.1.3.9
CHAPTER 6. SYSTEM MESSAGE PANEL
Close
This button simply closes the Message Buffer View.
6.1.3.10
Showing Event Help for a message
To retrieve further information about a message it is possible to display event help by right clicking onto
a message and selecting Show Message Help from the context menu. The event help will be opened in
the main window of Lapap Mk II, after the Documentation Worspace has opened. To get back to the
display which was open before select the according workspace in the Workspace chooser.
6.1.4
The Icons in the Message Buffer View
Above the Filter - button are three icons displaying the current state of the Message Buffer View:
The Icons in the message Buffer View
6.1.4.1
The "Live" Icon
The Live icon on the left indicates that the messages currently displayed in the Message Buffer View
are synchronized with the application. In this case a green dot is displayed. If the Message Buffer is in
frozen state the dot is gray.
6.1.4.2
The "Loaded Messages" icon
the middle icon displaying a floppy disc indicates that the messages in the Message Buffer View are
loaded from a *.CSV - file. If the Message Buffer View is in live - mode the floppy disc is displayed
gray.
6.1.4.3
The "Filter" icon
If a filter is applied to the Message Buffer View a small funnel icon is displayed. If no filter is applied
the funnel is displayed gray.
46
Chapter 7
Situational Awareness
This chapter describes the Situational Awareness (SAW) functionality of Lapap Mk II.
The Situational Awareness functionality of Lapap Mk II informs the user about certain important
events. I.e. if a value runs out of its monitoring limits a message with the classification OUT OF LIMIT
will appear. To make sure that the user recognizes these situations (i.e. in the case that he has not been
in front of the screen all the time) SAW provides a way to show him that certain events occurred in his
absence.
The SAW functionality does not change the systems state in any way. It is only providing functionality to inform the user about occurrences of certain events.
7.1
SAW Messages
Messages which are trigger messages for Situational Awareness will be displayed in orange in the
System Message Panel and in the Message Buffer View. It is possible to filter the Message Buffer
View according to messages with SAW context. This can be achieved by using the check boxes at the
top of the Message Buffer view.
7.2
SAW Icons
The SAW icons can be found in the main tool bar of Lapap Mk II. There is an Icon for every subsystem
showing whether there is a occurrence of a SAW message for the subsystem or not. If a SAW message
appears for a subsystem, its icon will be displayed with an orange background. This makes it possible
to easily recognize every occurrence of SAW messages without searching for SAW messages by hand.
The SAW Icons in the Tool Bar of Lapap Mk II.
7.3
Opening the Message Buffer View for SAW
Though it is possible to search for SAW Messages by hand, lapap offers a work flow to simplify this
process.
The Message Buffer View can be opened by clicking onto one of the SAW icons in the tool bar of
Lapap Mk II. In the case that the clicked icon shows an orange background, the Message Buffer View
will be opened in SAW Mode. The button Acknowledge & Close near the bottom right corner of the
dialog is now enabled.
if a subsystem icon is clicked which shows a gray background, the Message Buffer View will be
opened without SAW context. But a filter setting will be applied to show only messages according to
the subsystem of the clicked icon.
To open the Message Buffer view for SAW just click on a SAW icon which shows a orange background. This indicates that there are SAW messages for the according subsystem.
47
7.4. SAW FILTER FUNCTIONALITY
CHAPTER 7. SITUATIONAL AWARENESS
The view can also be opened by right - clicking onto the icon and selecting Show Message Buffer in
the context menu.
The Message Buffer View opened for SAW.
7.4
SAW Filter Functionality
Situational Awareness Messages can be filtered using the check boxes at the top of the Message Buffer
View. If one of these check boxes is selected, the dialog will display only messages of the according
subsystem defined to be trigger messages for SAW.
The Message Buffer View is now in Situational Awareness Mode. The dialog title changes and enumerates the selected subsystems.
It is possible to use the standard filter functionality while the Message Buffer is in Situational Awareness Mode. But the drop down boxes to select the classification and the subsystem are disabled as the
SAW Mode implies search criteria for these fields.
I MPORTANT
Even in Situational Awareness Mode messages from the DMS are displayed.
The Message Buffer View Filtering SAW Messages
7.5
Handling SAW messages
The Message Buffer View offers all the functionality it has in its original context. But only SAW messages according to the selected subsystems will be displayed.
7.5.1
Acknowledging SAW messages
To Acknowledge the SAW message for the according subsystem click the button Acknowledge & Close.
The Message Buffer View will be closed and the icon’s background color changes from orange to gray.
Acknowledging a set of SAW messages has the following consequences: The Message Buffer View
will be closed and the according icon will change its background color back to gray. If new SAW messages appear for the according subsystem, the messages acknowledged before will not be displayed
again if the Message Buffer View is opened in SAW context for the same subsystem the next time.
It is possible to acknowledge SAW messages without opening the Message Buffer View. Just right click onto the icon of the subsystem and choose Acknowledge. To acknowledge all subsystems at once
choose Acknowledge All.
48
CHAPTER 7. SITUATIONAL AWARENESS
7.5. HANDLING SAW MESSAGES
The context menu of a SAW icon
49
Chapter 8
Timer Section
This chapter describes the timer section in the Date & Time Group within Lapap MK II.
The timer section contains four similar timers which can be configured and used for different purposes.
Timer Section of Lapap Mk II
8.1
Timer Types
The timer section in the tool bar of Lapap Mk II contains four timers.
These timers can be configured in two ways:
• Alarm Clock Timer
These timers can be identified by the alarm clock symbol.
• Count Down Timer
The stop watch symbol identifies this timer type.
Both timer types count backwards and display the remaining time in an input field. Its background
color changes to indicate the remaining time:
• green = remaining time > 1 minute
• light orange = remaining time < 1 minute
• orange = timer has reached the target time and is counting forwards to show the time that has
passed since then.
The difference between the both timer types is the way the time that the user enters into the input
field is interpreted.
8.1.1
Alarm Clock Timer
The Alarm Clock Timer can be set up to a specified End Time (within a 24 hour range). After setting
up the End Time, a click onto the play button will start the timer. It will display the amount of time
that is remaining until the End Time is reached. The end time will be calculated according to the time
displayed in the upper right corner of the Date & Time Group.
51
8.1. TIMER TYPES
CHAPTER 8. TIMER SECTION
This timer type can be used as a reminder which will remind the user about an event which will
occur at the specified End Time.
To display the End Time of the Alarm Clock Timer, move the mouse over its label. This will show
the End Time in a tool tip.
I MPORTANT
The time of the laptop on which the Lapap Mk II application is running is synchronized
with the DMS time at application startup. The time displayed in the application window is
the time retrieved from the DMS.
Displaying The Target Time of a Alarm Clock Timer
8.1.2
Count Down Timer
The Count Down Timer can be set to a time within the range of 24 hours. After clicking the start button
this time will be counted backwards.
8.1.3
Timer Settings
To change the settings of a timer open the context menu by right clicking onto the symbol of the according timer. Select Settings... from the context menu.
To reset a timer to its default state, select Reset from the context menu which opens on a right click
on the timer’s label.
Timer Settings Dialog
• To make the changes work, click Apply or press the ENTER key.
• To cancel the operation, click Cancel or press the ESC key.
The following settings apply to both timer types:
8.1.3.1
Name
Each timer has a label that is displayed above the remaining time. To distinguish the different timers it
may be helpful to mark them with a custom label.
This label can be reset to its default value by selecting the context menu item Reset Label. This can
be done while the timer is running.
8.1.3.2
Type
The timer type can be set to Alarm Clock Timer or Count Down Timer.
8.1.3.3
Sound
It is possible to select a sound which will be played when the timer reaches the specified time.
52
Chapter 9
International Procedure Viewer
Components
This chapter describes the components that realise the functionality of the International Procedure
Viewer (IPV) in lapap. Lapap contains components to search, navigate and work through ODF Procedures and the related Documentation.
The components are based on the IPV and they work similar.
To execute or work through an ODF Procedure means to manually perform the steps described in
the procedure.
The IPV functionality contains three major components:
1. ODF Book Browser
The ODF Book Browser provides a tree view in which all accessible ODF Procedures can be
found. The root entry of the tree is labeled ODF Libraries.
This view can be used to navigate to a specific procedure and to start it. It also provides a way to
search for specific procedures.
See Section 9.1
2. Procedure Executor
The Procedure Executor is a view in which the procedure selected in the ODF Book Browser will
be opened. Depending on the type of the selected procedure this view looks different.
This view is used to work with the procedures.
See Section 9.2
3. Documentation Viewer
The Documentation Viewer is useful to search for and display help information on certain topics.
See Section 9.3
9.1
ODF Book Browser
To access the ODF Book Browser, select one of the default Workspaces Synoptics or Procedures. Each
one of them contains the ODF Book Browser.
53
9.1. ODF BOOK BROWSERCHAPTER 9. INTERNATIONAL PROCEDURE VIEWER COMPONENTS
The ODF Book Browser
9.1.1
Selecting ODF Procedures
The ODF Book Browser provides a tree view which contains all available ODF Procedures. To select a
certain procedure, navigate through the tree to the desired procedure and simply select it. Depending
on the workspace that was previously selected, the procedure will open in a different place.
• In Workspace Synoptics
The ODF Book Browser can be found in the lower left corner of this workspace. By selecting a
procedure, the workspace Synoptics & Proc will be opened and the procedure will be shown there
on the left side while previously opened Synoptic Displays remain visible on the right side.
The workspace Synoptics & Proc is useful if a specific display is needed to perform the procedure.
But as the ODF Book Browser is not visible in this workspace, it is necessary to switch to another
one to select a different procedure.
• In Workspace Procedures
The workspace Procedures is focused completely on the work with procedures. It contains the
ODF Book Browser on the left side and the Procedure Viewer on the right side.
9.1.2
Searching For Procedures
The ODF Book Browser provides a search functionality to find certain procedures or documentation
related to them.
To search for a procedure, enter a search term in the text box in the ODF Book Browser and press
the Search Button.
54
CHAPTER 9. INTERNATIONAL PROCEDURE VIEWER COMPONENTS9.1. ODF BOOK BROWSER
Searching For Procedures
This opens the Documentation workspace, where the search results are displayed.
Searching For Procedures
Search terms can be specified using the boolean operators AND, OR and NOT. Note that these
operators have to be written in uppercase letters to be considered as being operators rather than parts
of the query (like in Google).
Examples:
• To Search for a procedure or documentation containing the terms DMS and Overview, use the
query "dms AND overview".
• To Search for a procedure or documentation which contain only the term DMS but not Overview,
use the query "dms NOT overview".
If documentation about a certain procedure should be found, the radio button Documentation has
to be selected and the search has to be restarted. This can be done by pressing the Search Button or by
typing the ENTER key.
It is possible to select the whether the search shall be performed on the titles, the Content or both.
This can be done by selecting the according radio button in the ODF Search Plugin.
55
9.2. PROCEDURE EXECUTOR
CHAPTER 9. INTERNATIONAL PROCEDURE VIEWER COMPONENTS
I MPORTANT
If documentation shall be found, it is recommended to search for contents rather than for
titles.
9.1.3
Displaying Procedure Properties
To display the properties of a procedure, right-click onto its name. A small dialog will open and display
the properties of the selected procedure.
The following properties can be viewed:
• Unique ID
A unique identifier for the procedure.
• Date
The date the procedure was created.
• Procedure code
The Procedure code is a special value which contains information about the procedures purpose
and its state of development.
• Format
This property indicates of which format the procedure is. There are three possible procedure
formats:
– Logic Flow
– Check List
– PDF Procedure
• Version
A version number.
• Library
The Library in which this procedure is related to.
9.2
Procedure Executor
The Procedure Executor displays the content of the selected procedure and provides functionality to
perform it. Depending on the type of procedure which is opened it looks different and contains different
functionality.
There are currently three types of procedures which can be executed. Each type leads to a different
kind of work flow.
9.2.1
Logic Flow Procedures
These type of procedure is designed for work flows which are not linear and contain many decisions.
As every decision leads to two or more exits there are many paths which can be followed while the
procedure is executed. This type of procedure is best described in a graphical way using symbols for
transitions and decisions.
The Procedure Executor displays Logic Flow Procedures in a subdivided frame, containing the following two panels:
56
CHAPTER 9. INTERNATIONAL PROCEDURE VIEWER COMPONENTS
9.2. PROCEDURE EXECUTOR
• Overview Panel
The Overview Panel (on the left) provides an overall view of the whole procedure and can be used
as a navigation help to keep in mind which part of the procedure is currently displayed in the
Procedure Panel. The currently displayed section is shown as a green rectangle in the Overview
Panel.
A slider can be used to change the zoom level of the procedure displayed in the Procedure Panel.
To enlarge the procedure, move the slider to the right. To get a more distant view, move it to the
left. The Button Return to Default Zoom sets the zoom level to its default value which is chosen
to show as much as possible of the procedure but to keep the procedure readable.
• Procedure Panel
In this panel the procedure is displayed in the selected zoom level. This panel provides functionality to actually work with the procedure currently opened.
A Logic Flow Procedure in the Procedure Executor
9.2.1.1
Working With Logic Flow Procedures
9.2.1.1.1 Elements in Logic Flow Procedures A Logic Flow Procedure consists of specific elements
which provide different functionalities.
• Instruction Blocks
Each Logical Flow Procedure is separated into Instruction Blocks. There are different types of
Instruction Blocks:
– Action Blocks
Action Blocks contain a number of procedural steps the user has to perform manually on
the equipment or a Synoptic Display. An Action Block contains procedural steps which are
related to one specific display or equipment.
The single steps can be identified by little black dot in front of them which is called "bullet".
57
9.2. PROCEDURE EXECUTOR
CHAPTER 9. INTERNATIONAL PROCEDURE VIEWER COMPONENTS
Action Block Containing a Single Procedural Step
– Decision Blocks
Decision Blocks contain one or more procedural steps that require a decision. Therefore a
Decision Block has two or more exits. Depending on the result of the decision the user has
to follow the according exit.
Decision Block With Two Exits
– Combined Action / Decision Blocks
In some cases some procedural steps and a following decision belong together and should be
grouped into a single element to make their relationship clear.
The Combined Action / Decision Block is such an element combining the two types of Instruction Blocks.
Combined Action / Decision Block
– Result Blocks
Result Blocks contain a short summary which describes the progress the performing of the
procedure has reached at a certain moment of time. No action or decision has to be performed.
• Notes
These small icons provide information about the current step / The whole procedure. To display
the information (or to hide it), click onto the icon.
58
CHAPTER 9. INTERNATIONAL PROCEDURE VIEWER COMPONENTS
9.2. PROCEDURE EXECUTOR
Opening a Note of a Instruction Block
• Step Exits
Step Exits do not just only show to which step they lead, they also contain interactivity. A click
onto the description of an exit will select the according next Instruction Block.
9.2.1.1.2 Basic Navigation The Overview Panel contains a small overview image of the procedure
and displays a green rectangle representing the current view port of the Procedure Panel. While the
scrollbars in the Procedure Panel are moved, this rectangle moves simultaneously to show the changed
visible region.
Another more direct way to navigate within the procedure is to click into the Overview Panel (using
any mouse button). This will center the visible region on the position of the mouse click. It is also
possible to drag the view to the desired position.
9.2.1.1.3 Executing The Logic Flow Procedures The execution of a Logic Flow Procedure has to start
with the first available Instruction Block, numbered 1. If additional notes are available, read them first.
To select a certain Instruction Block in the procedure, right-click anywhere in the Procedure Panel.
This will open a context menu displaying the available Instruction Blocks.
I MPORTANT
Instruction Blocks are called "steps" in the Procedure Panel, deviating from the ODF
Standards. Be careful not to confound them with the "procedural steps" inside an Instruction Block
Procedure Panel - Context Menu
After selecting an Instruction Block from the context menu, the procedure will be scrolled to make
it visible. The selected Block will change its color to light green.
After performing the manual tasks, the next Block can be selected. There are two ways to do this:
1. Clicking onto the description of the exit
This way is the most save way, because the step which has to follow according to the work flow of
the procedure will be selected.
2. Selecting the following step from the context menu.
Using the context menu to select the following step is also possible but should be used carefully
as it is possible to select a wrong step accidentally.
59
9.2. PROCEDURE EXECUTOR
CHAPTER 9. INTERNATIONAL PROCEDURE VIEWER COMPONENTS
I MPORTANT
To ensure a proper work flow of the procedure it is recommended to use method 1. rather
than the context menu.
9.2.2
Check List Procedures
Check lists are procedures which have a linear flow. The actions are lined up followed one by another
and there are no (or very few) decisions which lead to a different path the procedure is walked through.
This type of procedure is described best with a checklist.
A Check List Procedure In The Procedure Executor
9.2.2.1
Working With Check List Procedure
Check List Procedures are executed in a different way. At first, a checklist contains parameters which
have to be set before starting work. These parameters change the Check List Procedure depending on
the circumstances in which it should be executed (i.e. a procedure could be used to configure a certain
part of the equipment, but be applicable for more than one component. In this case the parameters could
be used to select the desired equipment).
While executing a Check List Procedure the user performs the manual tasks described in the procedural sub steps of each step, one after another. The first step should be selected using the context menu
and selecting the first step from the sub menu Step. The following single tasks are selected with the
keyboard’s arrow keys.
There are a few situations where the Check List Procedures might contain a decision and therefore
more than one path to follow. These jumps are realized using Step References, which are links within
the procedures text. A mouse click on these elements selects the according step of the procedure.
Another type of "link" are Procedure Departures. If a procedure requires the execution of another
procedure (i.e. for initialization purposes) it will contain such a link to another procedure.
60
CHAPTER 9. INTERNATIONAL PROCEDURE VIEWER COMPONENTS
9.2. PROCEDURE EXECUTOR
Check List Procedures may require the recording of specific data. This technique is called Data
Recording and makes it possible to enter the data directly into the procedure.
A detailed description of this features can be found in the next section.
9.2.2.1.1
Elements In Checklist Procedures
• Show Ground Blocks Button
This button will hide / show all procedure steps that are related to ground operations.
• Hide Parameters Button
This button will hide / show the Parameter Selection.
Parameter Selection
Before the execution of a Check List Procedure the user should specify its parameters. This means
he has to select the correct parameter using one of the radio buttons below the title of the procedure.
Depending on which parameter is selected, the procedure will be changed. That does not mean
that the instructions or the work flow will change. The parameters have influence on certain
descriptions or labels.
Check List Procedure - Parameter Selection
• Instructions
Instructions are procedural steps which are textually described and have to be performed manually by the user on the according equipment. Instructions can be selected by using the arrow keys
but contain no other functionality.
A Selected Instruction
• Procedure Departure
In some cases the execution of another procedure may be necessary or desired. In this case a Check
List Procedure may contain a link to another procedure. These links are called Procedure Departures. Clicking onto a Procedure Departure will immediately open the referenced procedure.
I MPORTANT
Read the instruction besides the Procedure Departure carefully as it may contain
information about the step at which the current procedure has to be resumed after
finishing the referenced one.
A Procedure Departure
• Step References
Although Check List Procedures have a linear work flow there may be some cases where a step
has to be left undone and resuming at a later point in the procedure is necessary. Those non linear
jumps in the work flow are realized by Step References. These references look similar to the
Procedure Departures.
A Step Reference
• User Input Fields
There are certain procedures that ask the user to record some data. This can be done directly in the
Procedure Executor using User Input Fields.
61
9.2. PROCEDURE EXECUTOR
CHAPTER 9. INTERNATIONAL PROCEDURE VIEWER COMPONENTS
The User Input Field has to be selected to enable user input. After the user has entered the data
he has to press the Record button to make the procedure store the entered data. After pressing the
Record button it turns gray and changes its caption to Recorded.
I MPORTANT
It is possible to select following steps after entering user data without pressing the
Record button. The entered data will remain within the User Input Field but it will
be lost if another procedure is opened or the application is closed.
It is possible to re-enter data after pressing the Record button. If the user has accidentally entered
wrong data and pressed the Record button he may simply re-enter the correct data. The Recorded
button will change back into the Record button as the input changes.
Data Recording In User Input Fields
User Input Field After Recording a Value
• User Display Fields
The previously entered values may appear in the procedure at some later point. These areas are
called User Display Fields.
User Display Fields are read only and just for verification.
User Display Field
• Clarifying Information
Among a procedure important issues are shown in special sections called Clarifying Information.
These blocks are non functional but can be selected. Read this blocks carefully as they contain
important information. There are three different types of Clarifying Information:
– Warning Blocks
Warning Block
– Caution Blocks
Caution Block
– Note Blocks
Note Block
62
CHAPTER 9. INTERNATIONAL PROCEDURE VIEWER COMPONENTS
9.3. DOCUMENTATION VIEWER
9.2.2.1.2 Executing Check List Procedures The procedural steps of a Check List Procedure have to
be executed one after another and there are no (or only a few) decisions that lead to different paths.
Because of that the work flow is different from the one used in Logic Flow Procedures.
Check List Procedures are divided into a number of steps, which can be selected from the context
menu. Each of this step contains selectable tasks, which can be selected by typing the arrow keys on the
keyboard.
I MPORTANT
Only the main steps of each Check List Procedure can be selected by context menu. To
select the sub steps within each step the arrow keys have to be used.
The selected sub step is displayed with a light green background. It contains the manual steps the
user has to perform, and can range about a single or more lines.
9.2.3
PDF Procedures
PDF Procedures are procedures which are in the Adobe Acrobat PDF file format. To display a PDF
Procedure the Adobe Acrobat Reader will be opened as a Plugin within lapap. It is not necessary to
open the procedure externally.
PDF Procedures can be either Check List Procedures or Logic Flow Procedures.
Procedures of this type can only be viewed and executed manually. None of the functionality described above applies to PDF Procedures. Instead the functionality of the Adobe Acrobat Reader can be
used (to print the procedure or to search for certain terms).
9.2.4
General Procedure Work Flow
There are some things that Check List Procedures and Logic Flow Procedures have in common:
• Interrupting The Execution
If a procedure has been executed until a certain step, and the user has to interrupt the execution, it
is possible to stop the work and continue later. The work on the procedure may simply be stopped
(by selecting another procedure, by closing the application or by choosing a different workspace).
If the same procedure is opened the next time, a dialog box will ask the user if he wants to continue
the execution of the procedure. If he chooses Yes, the procedure will be opened and scrolled to
the position it had been stopped at. All values the user has entered into User Input Fields will be
restored and the last step will be reselected.
If the procedure should be restarted completely, the user has to select No from the dialog box.
• Procedure Context Menu
The context menu of procedures contains the same element for both types of procedures.
• Printing Procedures
It is possible to print the currently opened procedure by selecting Print from the context menu.
This will open the procedure as an external Adobe Acrobat Reader document (PDF). After this,
the procedure may be printed using the Adobe Acrobat Reader.
9.3
Documentation Viewer
The Documentation Viewer may be used to view Documentation about procedures or general information concerning Columbus.
To open the Documentation Viewer, select the workspace Documentation. This will open the Documentation Viewer and load the documentations start page.
63
9.3. DOCUMENTATION VIEWER
CHAPTER 9. INTERNATIONAL PROCEDURE VIEWER COMPONENTS
Documentation Viewer (Start Page)
The Documentation Viewer contains the following elements:
• Navigation Buttons
At the top of the Workspace are two navigation buttons labeled Back and Forward. These buttons
work similar to the navigation buttons of an Internet browser. They navigate back and forward
through the document history of the Documentation Viewer.
• Crumb Trail
The crumb trail below the navigation buttons displays the user’s position within the hierarchical
structure of the documentation. The single elements can be considered as branches within the tree
structure of the documentation and can be clicked to open the corresponding page.
• Documentation View
The main area of the documentation Workspace shows the currently loaded page.
The documentation pages are of the format HTML or PDF. If a PDF documentation page is selected,
the Adobe Acrobat Reader will be opened embedded in the Documentation Viewer.
The text size of HTML documentation can be changed by using the toolbar buttons or according
menu elements.
9.3.1
Searching For Documentation
The contents of the documentation can be searched using the ODF Search Plugin. For detailed information on how to use the ODF Search Plugin, see Section 9.1.2.
64
Appendix A
Keyboard Shortcuts and Hot Keys
Table A.1: Lapap Mk II Application and Desktop Hot Keys
Alt + F3
Alt + F4
Alt + F7
Alt + F8
Alt + F9
Alt + F10
Activate window menu
Close active window
Move active window
Resize active window
Minimize active window
Maximize active window
Alt + Tab
Alt + Shift + Tab
Activate next window
Activate previous window
Alt + F1
Alt + F5
Alt + F12
Alt + Print
Ctrl + Print
Ctrl + Alt + Delete
Ctrl + Escape
Ctrl + Alt + V
Ctrl + Alt + R
Ctrl + Alt + X
Ctrl + Alt + D
Popup launch menu
Show window list
Mouse emulation using →, ←, ↓ and ↑
Window screenshot
Desktop screenshot
Logout
Show task manager
Show Klipper popup-menu
Manually invoke action on current clipboard
Enable/Disable clipboard actions
Toggle desktop
F1
F2
Ctrl + 1
Ctrl + 2
Ctrl + 3
Ctrl + 4
Ctrl + 5
F10
F12
User Manual
Onboard Documentation
Switch to Workspace "Synoptics"
Switch to Workspace "Synoptics + Procedures"
Switch to Workspace "Procedures"
Switch to Workspace "CLSW Status"
Switch to Workspace "Documentation"
Activate application menu
Columbus Home Page
Tab
Shift + Tab
Focus next component
Focus previous component
Perform dialog default action (normally Accept
/ OK / Open...)
Activate selected element
Dismiss dialog or cancel selection
Enter
Space
Esc
65
APPENDIX A. KEYBOARD SHORTCUTS AND HOT KEYS
Table A.1: (continued)
Home
End
Activate item according to mnemonics (e.g.
open menu according to underlined character)
Transfer selection to next horizontal
component or scroll contents right
Transfer selection to previous horizontal
component or scroll contents left
Transfer selection to next vertical component or
scroll contents down
Transfer selection to previous vertical
component or scroll contents up
Transfer selection to first component
Transfer selection to last component
Ctrl + W
Ctrl + F4
Ctrl + U
Ctrl + D
Ctrl + F
Ctrl + Shift + F
Close synoptic display
Close synoptic display
Undock synoptic display
Dock synoptic display
Find text as you type
Find parameter in displays
Alt + <alphanum.>
→
←
↓
↑
Transfer selection to next section in checklist
procedure
Transfer selection to previous section in
checklist procedure
’Yes’ in logic flow procedure
’No’ in logic flow procedure
’Next’ in logic flow procedure
Undo last decision in logic flow procedure
Ctrl + ↑
Ctrl + ↓
Y/y
N/n
X/x
Ctrl + Backspace
66
Appendix B
Known Problems
• "Time synchronization occured" event messages (SPR-20091)
The cause for this message is generally a detected offset between the laptop local clock and the
DMS provided station time. Usually the PWS laptop is synchronized to the DMS provided time
regularly as long as it is connected to the LAN. In case the laptop is not connected to the LAN for a
certain period but still running the laptop local clock may drift from the stable GPS time due to the
inaccuracy of the laptop hardware. The same can happen if a process on the laptop blocks other
tasks. In such situations the detected difference will result in the described message.
There are two situations where the message is raised although no time adjustment has been performed: Lapap start-up and shutdown.
• Using the CLSW Web Interface (SPR-20116)
The built-in web interface to the Columbus LAN Switch does not integrate smoothly. Especially
in case new windows are opened interaction may be corrupted. E.g. when acknowledging CLSW
events in the web interface a new window is opened with confirmation buttons. If in such situations the expected action is not performed a simple repetition of the required steps is adviced.
Please note, that the steps may need to be repeated more than once.
• Hot Keys in the CLSW Web Interface (SPR-20683)
In the "CLSW Status" workspace the Lapap Mk II hot keys will not be available as long as the
CLSW web interface has the input focus. Clicking with the mouse into the application’s toolbar or
status bar or switching into another workspace using the mouse will recover hot key functionality
again.
67
Index
Exit the application, 5
A
Acknowledge
Acknowledge Situational Awareness, 45
Acknowledging SAW Messages, 48
Action Block
Element in Logic Flow Procedures, 57
Alarm Clock Timer
Timer Types, 51
Audio
Audio Notification Preferences, 18
F
File
File Menu, 5
Filter
Filter System Messages, 43
Find Parameters
Find Parameter in Other Display, 32
Freeze
Freezing the Message Buffer view, 45
C
Caution Block
Element in Check List Procedures, 62
Check List Procedure
ODF Procedures following a linear work flow,
60
Clarifying Information
Element in Check List Procedures, 62
Classification
Message Attribute Classification, 42
Clear
Removing all messages in the Message Buffer
View, 45
Close
Closing the Message Buffer View, 46
Combined Action / Decision Block
Element in Logic Flow Procedures, 58
Command Buttons
Command Buttons and 2 Step Commanding,
28
Context Menus
Context Menus of the different elements, 29
Count Down Timer
Timer Types, 52
H
Handling SAW messages
Handling Situational Awareness, 48
Help
Lapap Mk II Help, 8
Home Page
Close all but Homepage, 7
Load Synoptics Home Page, 7
I
Install
Installing Lapap Mk II on Linux/Unix, 3
Installing Lapap Mk II on Windows XP, 3
Instruction Block
Element in Logic Flow Procedures, 57
Instructions
Element in Check List Procedures, 61
International Procedure Viewer
The IPV is a set of components to display and
execute ODF Procedures, 53
IPV
IPV = International Procedure Viewer, 53
L
Limit Manager
The Limit Manager offers a way to change a
Measurements soft limits / expected value,
35
Line Graph
Line Graph Context Menu, 32
Line Graphs
Line Graphs, 32
Live
Setting the Message Buffer View back to live
mode, 45
Load
Loading System Messages, 45
Log
Applications user Log, 6
Logic Flow Procedure
ODF Procedures with a non linear work flow.,
56
D
Data pool
Save Data pool Buffer, 5
Decision Block
Element in Logic Flow Procedures, 58
DMS Status
DMS Status Display in Lapap tool bar, 40
Documentation
Find in page..., 8
Documentation Viewer
Viewing Documentation, 63
E
Element Types
Element Types in Synoptic Displays, 28
Equipment
Message Attribute Equipment, 42
Execute Button
Button to execute commands in 2 Step Commanding, 28
Exit
M
Measurements
69
INDEX
INDEX
Measurements, 29
Menu
Menu Structure, 5
Message Buffer
Message Buffer View, 41
Show the Message Buffer View, 5
S-/KU-Band
Communication Link Status Display in Lapap
tool bar, 40
Save
Saving System Messages, 45
SAW
Situational Awareness, 47
SAW Icons
Situational Awareness Icons, 47
SAW Message Buffer View
Opening the Message Buffer View for Situational Awareness, 47
SAW messages
Trigger Messages for Situational Awareness,
47
Search
Searching for ODF Procedures, 54
Sort
Sorting the Message Buffer View, 43
Station Mode
Station Mode Status Display in Lapap tool bar,
39
Station Mode Compatibility
Station Mode Compatibility in Lapap tool bar,
40
Status Displays
Status Displays in Lapap tool bar, 39
Step Exits
Element in Logic Flow Procedures, 59
Step Reference
Element in Check List Procedures, 61
Subsystem
Message Attribute Subsystem, 42
Open Subsystem Overview, 7
Sync
Synchronizing the Message Buffer View, 45
N
Navigation
Synoptic Display Navigation, 25
Navigation Buttons
Synoptic Navigation Buttons, 27
Note Block
Element in Check List Procedures, 62
Notes
Element in Logic Flow Procedures, 58
O
ODF Book Browser
A tree view to search and select ODF Procedures., 53
Ops Products
Operational products in the standalone version, 4
Overview Panel
Panel that gives an overview about the currently loaded Logic Flow Procedure, 57
P
Parameter Selection
Setting the parameters for Check List Procedures, 61
Preferences
Options Menu, 8
Preferences Dialog, 18
Procedure Departure
Element in Check List Procedures, 61
Procedure Executor
IPV Component in which ODF Procedures are
executed., 56
Procedure Panel
Control in which Logic Flow Procedures are
displayed and executed, 57
Procedure Properties
Properties of ODF Procedures, 56
T
Tabbed Mode
Toggle Tabbed Mode, 7
Text
Message Attribute Text, 42
U
User Display Field
Element in Check List Procedures, 62
User Input Field
Element in Check List Procedures, 61
R
Record Button
Element in Check List Procedures, 61
Recorded Button
Element in Check List Procedures, 61
Requirements
Check Platform Requirements, 3
Reset Application
Reset Application, Read only Workspaces will
be reverted, 5
Result Block
Element in Logic Flow Procedures, 58
V
View
View Menu, 5
W
Warning Block
Element in Check List Procedures, 62
Workspace
Workspace Menu, 6
Workspaces
Workspace Handling, 10
S
70