1
SmartField-Lysimeter
User Manual
Smart Field Lysimeter
Contents
1
Introduction......................................................................................................... 4
1.1 Notes to this manual .......................................................................................... 4
1.2 Intended use ...................................................................................................... 4
2 System configuration ......................................................................................... 5
2.1 Logger box and related components .................................................................. 6
2.1.1 Data logging and controller ....................................................................... 6
2.1.2 tensioCON ................................................................................................ 7
2.1.3 SFL Pump Controller ................................................................................ 7
2.1.4 Rechargeable battery ............................................................................... 7
2.1.5 Solar panel ............................................................................................... 8
2.2 Field Box ............................................................................................................ 8
2.2.1 Pump and Distribution Box ....................................................................... 9
2.2.2 Drain water bottle...................................................................................... 9
2.2.3 Drain water balance PL-10 ....................................................................... 9
2.2.4 Aliquot sample taking (option) ................................................................ 10
2.3 Lysimeter.......................................................................................................... 11
2.3.1 Lysimeter balance PL-50/100/200 .......................................................... 11
2.3.2 Lysimeter sensor distribution box ........................................................... 12
3 Sensors ............................................................................................................. 13
3.1 Reference Tensiometer T8 (Field) ................................................................... 13
3.2 Matrix potential sensor MPS2 (Lysimeter) ....................................................... 13
3.3 Sensor 5TE (Lysimeter) ................................................................................... 14
3.4 VTENS (Lysimeter) .......................................................................................... 14
4 Feedback control of the lower hydraulic boundary condition ...................... 14
4.1 Background ...................................................................................................... 14
4.2 How it works ..................................................................................................... 15
4.3 Limitations ........................................................................................................ 15
5 Data logger DT80M ........................................................................................... 16
5.1 Connections to the device ................................................................................ 16
5.1.1 Connection via USB................................................................................ 16
5.1.2 Connection via Ethernet ......................................................................... 16
5.1.3 Connection via GPRS/3G Remote.......................................................... 17
5.1.4 UMS SIM card ........................................................................................ 17
5.2 Data retrieval .................................................................................................... 17
5.2.1 Data format ............................................................................................. 17
5.2.2 USB memory stick .................................................................................. 18
5.2.3 GPRS/3G modem (integrated)................................................................ 18
5.3 System access (internal services) .................................................................... 20
5.3.1 Access to the data logger with dEX ........................................................ 20
5.3.2 FTP server .............................................................................................. 21
5.3.3 Command interface ................................................................................ 21
5.4 Change configuration ....................................................................................... 22
5.4.1 Data logger program (config) .................................................................. 22
5.4.2 Run time settings (Channel variables) .................................................... 23
6 Power Management .......................................................................................... 24
Seite 2 von 65
Smart Field Lysimeter
6.1 tensioCON charging controller ......................................................................... 24
6.2 Battery management actions............................................................................ 27
7 Installation notes .............................................................................................. 28
7.1 Adjusting the Lysimeter and drain water bottle................................................. 28
7.2 Adjusting the solar panel .................................................................................. 29
7.3 Connecting the tubes and adjusting the cables ................................................ 30
7.4 Autoconfig function........................................................................................... 33
7.5 Flooding ........................................................................................................... 33
8 Maintenance ...................................................................................................... 34
8.1 Regular service ................................................................................................ 34
8.1.1 Filling and emptying the drain water bottle ............................................. 34
8.1.2 Filling the Tensiometer ........................................................................... 34
8.1.3 Degree of freedom of Lysimeter and drain water bottle .......................... 35
8.1.4 Exchanging spare parts .......................................................................... 35
8.1.5 Exchanging the drying cartridge ............................................................. 36
8.2 Trouble shooting in the field ............................................................................. 36
8.2.1 Checking the electrical energy supply .................................................... 36
8.2.2 Checking the data logger ........................................................................ 37
8.2.3 Resetting the data logger ........................................................................ 38
8.3 Winter operation ............................................................................................... 38
9 Expert functions ............................................................................................... 39
9.1 Pump system ................................................................................................... 39
9.2 Changing the system configuration .................................................................. 40
9.2.1 Storage intervals (schedules) ................................................................. 40
9.3 SMS alarms...................................................................................................... 42
10 Interpreting the measurements .................................................................... 42
10.1 Influence of pump times ............................................................................. 42
10.2 Balancing the weight values ...................................................................... 43
10.3 Calculating the precipitation and evapotranspiration ................................. 44
10.3.1 Precipitation ......................................................................................... 44
10.3.2 Evapotranspiration ............................................................................... 45
10.3.3 Et0 ....................................................................................................... 47
10.4 Flaws and errors ........................................................................................ 47
10.4.1 Battery state of charge (SOC).............................................................. 47
10.4.2 Negative influence on weight values .................................................... 47
10.4.3 Dropouts and spikes in measurement series ....................................... 48
11 Appendix ........................................................................................................ 50
A DT80M ............................................................................................................. 50
B Connection diagram ......................................................................................... 51
C Serial bus diagram ........................................................................................... 52
D Connections on the bottom of the logger box ................................................... 53
E Connector pin assignment ............................................................................... 54
F Technical data .................................................................................................. 57
G Technical terms ................................................................................................ 60
H Sensor table ..................................................................................................... 61
I Table of figures ................................................................................................ 62
J References ....................................................................................................... 64
Seite 3 von 65
Smart Field Lysimeter
1 Introduction
1.1 Notes to this manual
Figure 1: separate parts of the manual dedicated to work in the field
Please note
This manual includes also 3 single pages that describe and illustrate how to install
the SmartField-Lysimeters in the field:
- Cutting the soil column
- Earthworks and basic setup
- Installation and start-up
These 3 pages focus on to dos in order to minimize reading time in the field whereas
this user manual gives you background information.
1.2 Intended use
SmartField-Lysimeters are most precise field setups to determine the precipitation
and the evapotranspiration at true field condition. Further they measure the drainage
water amount to determine the ground water recharge capacity of a field site at a certain soil depth.
The determination is based on the weight changes of the Lysimeter soil column and
a drainage water bottle. Additional sensor equipment is measuring matrix potential,
volumetric water content and temperature at certain depths. This enables the user for
model calibration issues based on Richards’s equation, HYDROS 2 D and others,
where fluxes are calculated based on these data. The Lysimeter directly measures
due to weight the atmospheric interface, which is any kind of precipitation like rain,
dew, hoar frost, and the first snow event as input parameters. Further it measures the
output parameters like evaporation, transpiration and drainage. To reach true water
situation inside the Lysimeter, the matrix potential in the field in the depth of the Lysimeter bottom is measured and transferred it into the Lysimeter.
Seite 4 von 65
Smart Field Lysimeter
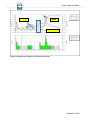
2 System configuration
Figure 2: overall scheme system and components
Seite 5 von 65
Smart Field Lysimeter
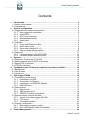
2.1 Logger box and related components
Up to 4 Lysimeters can be connected to the logger box.
solar panel
GSM antenna
logger box
inside:
data logger DT80M
tensioCON controller
pump controller
rechargeable lead battery
lightning protection
below:
4x Lysimeter connector
Figure 3: logger box and components
2.1.1 Data logging and controller
The DT80M is on one hand a data logger. All measurement data are logged and can
later on be read out automatically or manually. On the other hand this device also
works as a controller of the SmartField-Lysimeter functions. The communication with
the devices connected to it is partially bi-directional.
Seite 6 von 65
Smart Field Lysimeter
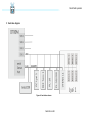
user interface
USB memory stick
Ethernet
analog inputs
USB host
digital and serial sensor
inputs
Figure 4: data logger DT80M
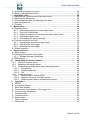
2.1.2 tensioCON
The tensioCON controls the power management of the SmartField-Lysimeter. It
charges and controls the built-in 12 V lead battery.
2.1.3 SFL Pump Controller
Each of the up to 4 connected Lysimeters has its own pump controller. It controls a
bi-directional peristaltic pump that is located in the Field Box.
The pump controller is in charge of precisely adjusting the matrix potential in the bottom of the Lysimeter (called the lower hydraulic boundary condition) due to field condition. For more information see chapter 4 Feedback control of the lower hydraulic
boundary condition.
The feedback control adjusts the lower hydraulic boundary condition
- Either to a reference value usually given by the reference Tensiometer that is connected to the controller.
- Or a manually fixed value for simulation reasons or artificial ground water level
tests.
For this the controller needs to know the reference value (from T8) and the actual
value VTENS. The controller activates the pump in short intervals to adjust the matrix
potential as precisely as possible.
The feedback control uses a PI (proportional & integral) algorithm. If necessary this
algorithm can be adjusted to the characteristics of the soil. The related parameters
can be changed with the UMS tensioVIEW software.
The data logger stores the times of water inlet and outlet (as seen by the Lysimeter)
for each pump with a 1 sec resolution. In the evaluation these times can be compared with the weights of the drain water and the Lysimeter.
2.1.4 Rechargeable battery
The rechargeable 12 V / 24 Ah lead gel battery is located under the flap panel of the
data logger. The battery’s capacity is sufficient for 1 to 2 weeks of normal operation –
depending on how it is discharged by running the pumps and how the system is
equipped.
Seite 7 von 65
Smart Field Lysimeter
2.1.5 Solar panel
Figure 5: solar panel
Under normal sun radiation the solar panel generates enough energy to run the system with 4 Lysimeters. In winter the energy supply can get tight depending on the
location, the position of the system in the field and use.
2.2 Field Box
The Field Box works as a supply station for the Lysimeter. It is dug into the soil in a
defined distance close to the Lysimeter whereas the logger box can be set up much
farer away.
Pump and Distribution Box
drain water bottle
drain water balance
Figure 6: Field Box
Seite 8 von 65
Smart Field Lysimeter
2.2.1 Pump and Distribution Box
The Pump and Distribution Box is located in the Field Box and has 2 tasks. On one
hand all components are connected to it – the cable to the Lysimeter, the drain water
balance and the reference Tensiometer – and the signals are distributed according to
the connections.
On the other hand it houses the bi-directional pump and the connection for the tubes.
This pump conveys water from the Lysimeter into the drain water bottle and the other
way round.
2.2.2 Drain water bottle
The drain water bottle in the Field Box works as a buffer storage for surplus water or
supply water respectively. By collecting the water in a bottle an exact balance of the
water budget in the Lysimeter can be calculated. This kind of balancing is much more
precise than a flow measurement.
2.2.3 Drain water balance PL-10
The drain water balance measures precisely the weight of the drain water bottle and
the water that runs to or from the Lysimeter bottom. The resolution of the balance is
usually 1 gram or optionally 0.1 gram.
Air pressure equalize hole
Drain water bottle
Tube connector
Leveling plate
Drain water balance
PL-10
Earth connector
Figure 7: drain water balance with drain water bottle and levelling plate
Seite 9 von 65
Smart Field Lysimeter
2.2.4 Aliquot sample taking (option)
Figure 8: apparatus for aliquot sample taking
As an accessory a aliquot sample apparatus can be delivered. The function is to determine the mass of drained substances at each drainage event. Therefore the flask
takes an aliqout sample ratio of about 5% of the water flux drained into the drainage
bottle. The flask of the aliquot sample taking is mounted to the drain water bottle and
thus part of the weight balance.
The sample taking is set up in a way that water runs only into the flask when water is
pumped from the Lysimeter to the drain water bottle. If the pump works in reverse
direction a valve blocks the water flow. So you get water samples in the flask according to drainage events, while the drainage bottle gives you the bulk composition.
Seite 10 von 65
Smart Field Lysimeter
2.3 Lysimeter
The Lysimeter consists of the Lysimeter cylinder and all parts that are mounted to it.
It is located in a 1 m distance from the Field Box and is connected with it by cables
and tubes lying in a protective tube.
water content probe 5TE
matrix potential probe MPS-2
Lysimeter collar
sensor port 6x
Lysimeter bottom
equipped with novel
suction cups
sensor distribution
box
Lysimeter cylinder
platform balance
VTENS port
pump tube
Lysimeter housing
Figure 9: Lysimeter
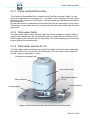
2.3.1 Lysimeter balance PL-50/100/200
The Lysimeter balance measures the weight of the Lysimeter cylinder and the soil
column it. Thus it registers the mass of water that flows to or from the Lysimeter
caused by precipitation and evaporation on the top and drains from the Lysimeter at
the bottom.
In order to increase the resolution and precision of the balances their nominal measuring range is according to the SFL-type and weight.
SFL 300 with PL50 – nominal range 0 … 50 kg, max. 75 kg, precision ±7 g
SFL 600 with PL100 – nominal range 0 ... 100 kg, max. 150 kg, precision ±14 g
SFL 900 with PL200 – nominal range 0 … 200 kg, max. 300 kg, precision ±28 g
Seite 11 von 65
Smart Field Lysimeter
Flap for fixing the Lysimeter
Precision measuring
transmitter
Adjustable
foot
Cable clip fastener for fixing tubes
and cables
Figure 10: platform balance PL-50
The balances PL100 and PL200 can be replaced by each other if needed. The PL50
is less high and cannot be replaced by one of the others.
On the top platform are flaps for fixing the Lysimeter on the balance. So the whole
unit can be lowered down into the Lysimeter housing.
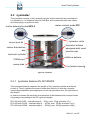
2.3.2 Lysimeter sensor distribution box
The sensor distribution box is directly mounted to the Lysimeter cylinder and does 2
jobs. Three MPS-2 sensors and three 5TE sensors are connected to it.
Additionally a pressure sensor and an evaluation electronics measure the actual
pressure VTENS. For this the sensor is connected with the suction cups in the Lysimeter bottom (see also 3.4 VTENS (Lysimeter)).
Only a thin cable runs from the sensor distribution box to the bottom platform of the
balance to make sure the influence of the cable on the Lysimeter weight measurement is minimal.
Seite 12 von 65
Smart Field Lysimeter
Sensor ports
for MPS2 and
5TE sensors
Inside:
Pressure sensor for VTENS
Data cable to Lysimeter
bottom and data logger
Tube for VTENS
pressure connection
to suction cup in the
Lysimeter bottom
Figure 11: Lysimeter sensor distribution box
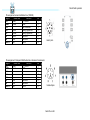
3 Sensors
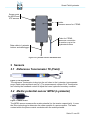
3.1 Reference Tensiometer T8 (Field)
Figure 12: T8 Tensiometer
The reference Tensiometer is dug into the soil close to the Lysimeter (see separate
page „Earth works and basic set-up”). The measurement values of the Tensiometer
are used by the feedback control to adjust the lower hydraulic boundary condition.
3.2 Matrix potential sensor MPS2 (Lysimeter)
Figure 13: MPS2 sensor
The MPS2 sensor measures the matrix potential (or the tension respectively). It uses
the Echo technology to determine the water content of a porous matrix. The water
content within the porous matrix correlates with the matrix potential.
Seite 13 von 65
Smart Field Lysimeter
Because of the measuring principle this sensor does not work close to saturation,
that is > -10 kPa. On the other hand this sensor is maintenance free and works even
in the dry range of < -500 kPa.
3.3 Sensor 5TE (Lysimeter)
Figure 14: 5TE sensor
The three 5TE sensors measure the volumetric water content, the electrical conductivity and the temperature of the soil. The 5TE uses the Echo Technology, an FDR
(Frequency Domain Response) based technology which is widely spread to measure
water content in soil and other porous materials.
3.4 VTENS (Lysimeter)
The VTENS or virtual Tensiometer is the controlled boundary condition in the bottom
of the Lysimeter cylinder. The value of a reference Tensiometer is controlled at a ceramic surface by a vacuum controller. VTENS is there the actual measurement value
directly within the ceramic. At the boundary layer of the ceramic to the soil bottom the
potential is identical. In principle VTENS is therefore a 4th matrix potential value directly above the Lysimeter bottom. Contrary to MPS2 matrix potential values this value can work also at zero or respectively even into the over pressure range (water
level inside the Lysimeter).
The limits of the VTENS are set by the reference value of the Tensiometer and the
air entrance point of the ceramic surface. When it is met (at approx. 80 kPa) air enters spontaneously, the measurement value breaks down to zero and the feedback
control can no longer work correctly.
The VTENS is not a sensor located in the bottom. Instead of this a reference tube is
lead out, which leads to suction cups in the Lysimeter bottom. This tube is connected
with the sensor distributor. Here a precision pressure sensor and an evaluation electroncs are situated. So the VTENS is located in the sensor distribution box.
4 Feedback control of the lower hydraulic boundary
condition
Contrary to gravity Lysimeters, which only drain overpressure water or free water, the
SmartField-Lysimeter works with a drain water feedback control due to field condition
having the real field condition inside the Lysimeter.
4.1 Background
Water in the soil always flows from spots of higher pressure or matrix potentials to
spots of lower matrix potentials. After rain e.g. the soil surface has free water – the
matrix potential or pressure potential is here close to 0 hPa. The water is sucked
downwards by the dry soil with its negative or smaller potentials and following gravity.
Seite 14 von 65
Smart Field Lysimeter
When the soil surface dries out it is just the other way round. The water flow turns as
the surface has now the lower potential (evapotranspiration).
The water in older gravity Lysimeters can only run off when it can drain freely that
means at potentials of zero hPa what is equivalent to a groundwater level. So these
Lysimeters are in times of high precipitation rates always too wet. This influences the
whole Lysimeter. Vice versa they dry out too much in times of low precipitation as no
water is supplied from the bottom.
Here is the big advantage of the SmartField-Lysimeters! Their feedback control
measures the water potential at the bottom and adjusts it continuously. Thus the soil
humidity, the water flows and potentials in the Lysimeter are identical to the real field
situation. The length of the soil column does not need to be two meters to minimize
these errors of gravity Lysimeters.
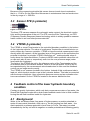
4.2 How it works
In the Lysimeter bottom there are several suction cups with a porous ceramic surface
which is in contact with the soil above it or the soil sample respectively. The pressure
or the negative pressure respectively in the suction cups is measured precisely by
means of the VTENS sensor. The pump controller drives in a pulsed way a bidirectional pump to adjust the VTENS measurement value to a reference value. The
reference value is usually coming from the Tensiometer that is built in field close to
the Lysimeter at the same depth.
If the Lysimeter is in hydraulic equilibrium the VTENS measurement value correlates
with the value of a Tensiometer at this depth. Also a manual reference value can be
set. In principle the value of a farther remote Tensiometer could be used via an
online connection with the data logger.
pressure sensor and
evaluation electronics
pump controller
actual value VTENS
suction cup at
Lysimeter bottom
bi-directional drain water
pump bottle
reference value
Tensiometer
in the field
Figure 15: feedback control of the lower hydraulic boundary condition
4.3 Limitations
The novel feedback control of the lower hydraulic boundary condition works very precisely and over a wide range of +3 kPa … -70 kPa.
The feedback control is limited by the air entrance point of the suction cup ceramic. If
this point is reached (at approx. 80 hPa) air entrances spontaneously, the measureSeite 15 von 65
Smart Field Lysimeter
ment value breaks down to zero and the feedback control can no longer work correctly. In this case the pump will be deactivated.
If the soil becomes wet again the pores of the ceramic close and the pump can build
up a vacuum again (re-vitalization).
air entrance
revitalization
Figure 16: air entrance into the suction cup in the Lysimeter bottom
5 Data logger DT80M
5.1 Connections to the device
The DT80M has a built-in web interface. The connection is IP based, i.e. the logger
has an IP address that is used to access the logger functions.
5.1.1 Connection via USB
For this connection the software „DTUSB“ is used. It installs drivers so that your
computer can generate a virtual TC/IP connection with the data logger via USB cable. The software identifies a connected data logger, shows its IP address and starts
the web browser, linking to the logger’s homepage.
5.1.2 Connection via Ethernet
If an Ethernet is used the access is carried out directly via the assigned IP address.
Please find in the DT80 manual how to configure the IP-address manually or using
DHCP.
Seite 16 von 65
Smart Field Lysimeter
5.1.3 Connection via GPRS/3G Remote
With a GPRS/3G SIM card you can contact the data logger via mobile phone network.
Please note
It is possible to set up an internet connection with the data logger by using an ordinary SIM card. That means the device can e.g. store data on a FTP server but there
is no bi-directional access to the device. It is not accessible from the internet.
For this you need a M2M card that enables connections in both directions and offers
a public IP address.
5.1.4 UMS SIM card
The scope of delivery includes a SIM card installed in the data logger. This card enables the UMS service people to access the command interface of the data logger,
e.g. to update the software or to retrieve the status of connected sensors.
For technical reasons it is not possible to access this interface from the customer’s
end.
Additionally this SIM card can be used to upload data from the logger to any server in
the internet.
Please note
A 1 year use of the UMS SIM card is included in the sales price of the Smart Field
basic set. After this you can extend the use at favorable conditions.
5.2 Data retrieval
There are several possibilities to read out measurement data from the DT80M.
5.2.1 Data format
The device can store measurement data in 2 different formats – either as a .CSV or a
.DBD file (Datataker Binary). In a .CSV file the data are separated by comma or semicolon. Schedules are shown in a sequence. You can set internal profiles settings to
a certain degree to configure the .CSV format. CSV files are readable by any spreadsheet program but they also have disadvantages:
1. The format is country specific and different
No international standard exists. That is why the import of these data into a table calculation often is erroneous. Reformatting is time consuming.
2. The format needs much memory space.
The storage in the ASCII .CSV format needs many data so that a transfer via
metered internet connection is expensive.
For the transfer to and storage on the FTP server usually the .DBD format is used.
Data are stored compressed and independent of platform, country and format. To
read the format you need an import tool. The program DPLOT (delivered on CD) offers integrated .DBD support so that data can be visualized. Additionally you can find
Seite 17 von 65
Smart Field Lysimeter
in the internet an import filter for National Instruments Diadem as well as a command
line utility from Datataker for the conversion of different .CSV formats.
If the data have to be transmitted regularly (e.g. daily) it is a challenge not only to
convert the data but also to merge the small files being transmitted automatically to a
big evaluable file.
The UMS solution offers a service on the web server that converts data, merges and
sorts them (see 5.2.3.2).
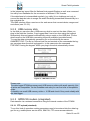
5.2.2 USB memory stick
In the field you can also use a USB memory stick to read out the data. When you
plug in the stick the function „Copy logged data“ has to be done using the keypad.
Alternatively this can happen automatically using a script on the USB stick. For the
data format on the USB stick converting tools are available (see data format).
To copy the data automatically generate a file on the stick with the name
ONINSERT.DXC. The file is a normal text file and consists of the commands the logger executes when the stick is plugged in. In this case enter the command
COPYDATA using the keypad. When you plug in the stick automatically shows:
Figure 17: USB data read out
Please note
The data logger DT80M processes only USB memory sticks with small capacity. Not
all sticks are compatible. On the Datataker web site you can find a list of compatible
sticks.
Preferably use small USB memory sticks < 16 GB and check if they work reliably with
the data logger.
5.2.3 GPRS/3G modem (integrated)
Data transfer via a metered connection using the internal modem of the DT80M.
5.2.3.1 FTP upload (standard)
To run this kind of operation certain parameters need to be entered into the data logger like e.g. mobile phone service APN, SIM PIN, FTP server access data etc.
Seite 18 von 65
Smart Field Lysimeter
These parameters are entered using the web interface (see chapter 5.4 Change configuration).
Everything is ready to operate when you use the provided UMS SIM card. As a default the data are stored on the UMS web server umsdataview.de. In the web interface of the logger you can change the FTP server and the access data. Preferably
you use the economical .DBD format although you need to merge the data later on.
Figure 18: example of daily transmitted .DBD data on the FTP server
5.2.3.2 umsdataview.de server
The data transfer to the server umsdataview.de runs automatically when you use the
UMS SIM card. The server runs a service that provides your data as readable Excel
files sorted by months (see Figure 19).
With every upload of the logger the file will be created new. This is usually done once
a day.
Please note
The SIM card and the service are included in the Lysimeter basis set for the first
year. To extend the use please contact UMS.
If you do not need this service, please send back the UMS SIM card. Thank you!
Seite 19 von 65
Smart Field Lysimeter
Figure 19: file structure and sorted Excel files on umsdataview.de
5.3 System access (internal services)
5.3.1 Access to the data logger with dEX
dEX ist the integrated web interface of the data logger. You need a web browser with
Adobe flash support on your computer.
You can retrieve the current logger status and change its configuration. Additionally
certain activities can be executed online.
dEX is an interface that exchanges relatively big data packets with the web browser.
When you start dEX the approx. 1 MB application is uploaded into the cache of the
browser. Even if it is possible in principle it does not make sense to use dEX via a
metered internet connection (GPRS). dEX works via USB cable or Ethernet connection.
dEX distiguishes two modi (after a select page in the web follow two areas):
Monitor the logger:
- status
- download data
- command interface (online)
Configure the logger:
- permanent configuration (program) of the logger
- configuration of power supply, SIM card, display etc.
Seite 20 von 65
Smart Field Lysimeter
Figure 20: “Monitor the logger“ page of dEX
5.3.2
FTP server
The integrated FTP server offers access to the internal file system of the data logger.
E.g. you can initiate updates. The FTP server is not really suitable to download
measurement data. For more information please see the data logger manual.
Please note
The internal FTP server should not be confused with the FTP client that stores the
data on an external web server (see 5.2.3.1 FTP upload (standard)).
5.3.3 Command interface
Via the command interface you can configure and read out the data logger. All entries into the command interface use the Datataker command syntax. The access to
the command interface is done transparent over the logger’s IP address and TCP
port 7700. The dEX web interface offers in “Monitor the logger” a simple access to
the command interface. For a connection with minimized data transfer a terminal
program supporting TCP sockets (like ZOC or Putty) is recommended.
Even when a program (configuration) is active any command can be executed manually. E.g. a measurement of any channel can be executed once by entering the
command syntax.
In the data logger manual you will find all information on the use of the command interface.
Seite 21 von 65
Smart Field Lysimeter
Example:
user entry:
>1V {measurement of channel 1, clamp +-}
answer Datataker:
256mV
>
Please note
A misuse of the command interface can very easily disturb the function of the program and e.g. interrupt the data storage.
5.4 Change configuration
The data logger configuration can be changed using the web interface or the command interface respectively. Two different levels are to be distinguished.
5.4.1 Data logger program (config)
The logger program is stored permanently in the logger and can be changed with
“configure the logger“ in the web interface. It is programmed in a Datataker proprietary syntax (interpreter language). dEX simplifies programming as it is an intuitive
graphical web interface. From the graphical design of the program a program file is
compiled.
Figure 21: configuration web-page of dEX
Seite 22 von 65
Smart Field Lysimeter
The program is structured in so called schedules i.e. a list of commands that is executed in periodic intervals. In these schedules e.g. measurements, calculations,
changes of digital outputs etc. can be executed.
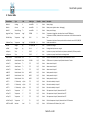
The SmartField-Lysimeter program is divided in several schedules:
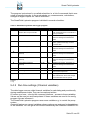
Table 1: SmartField-Lysimeter data logger program
Schedule
A
Function
Serial communication tensioCON, SFL-Pump-Controller
Interval
1 min
Type
W*
B
System
10 min
R,L
C
1 min balance data
1 min
R,L
D
Sensor data Lysimeter 1
10 min
R,L
E
Sensor data Lysimeter 2
(optional)
10 min
R,L
F
Sensor data Lysimeter 3
(optional)
10 min
R,L
G
Sensor data Lysimeter 4
(optional)
10 min
R,L
H
I
<free>
Autoconfig
manual
R,L
W
J
FTP Upload
1 day
W
Description
Bi-directional serial communication
with tensioCON power controller and
pump controllers
Retrieval of sensors, averaging, update and storage of measurement
data
Retrieval of all Lysimeter’s weight
data, update and storage of measurement data
Retrieval of sensors, averaging, update and storage of measurement
data
Retrieval of sensors, averaging, update and storage of measurement
data
Retrieval of sensors, averaging, update and storage of measurement
data
Retrieval of sensors, averaging, update and storage of measurement
data
Executing once the autoconfig function for the components
Setting up an Internet connection with
the external FTP server and storage
of the data after the last upload
* W=Working
R=Return
L=Log
5.4.2 Run time settings (Channel variables)
The data logger uses so called channel variables for calculating and provisionally
storing measurement data. They can be read and written.
Of course you have – also by the command interface – access to these variables.
Values can be read out and manipulated. If these variables are used in the config
program this can influence it.
The SmartField-Lysimeter program uses some variables e.g. to control the pump
system.
A special feature are named variables whose numbers are assigned to descriptions
of the variables. You can get a list of these variables by the command “NAMEDCVS”.
Seite 23 von 65
Smart Field Lysimeter
User entry:
NAMEDCVS {display of named variables}
answer Datataker:
DT80> Namedcvs
CV S CV Name
Value Units
==========================================
1 A Batterie Voltage
13.32 V
2 A Batterie Current
-1950 mA
3 A Batterie Charge
3.64 Ah
4 A Batterie SOC
17 %
5 A Solar Pan. Curre
0 mA
6 A Logger Current
135 mA
7 A PumpController C
0 mA
8 A L1/2 sensors Cur
0 mA
9 A L3/4 sensors Cur
0 mA
61 A L1 LevelControl
2
51 A L1 Manual Setpoi
-50 hPa
117 A L1 Setpoint
-559.9 hPa
62 A L2 LevelControl
2
52 A L2 Manual Setpoi
-50 hPa
217 A L2 Setpoint
-50 hPa
63 A L3 LevelControl
2
53 A L3 Manual Setpoi
-50 hPa
317 A L3 Setpoint
-50 hPa
64 A L4 LevelControl
2
54 A L4 Manual Setpoi
-50 hPa
417 A L4 Setpoint
-50 hPa
Figure 22: channel variables by “NAMEDCVS”
6 Power Management
6.1 tensioCON charging controller
Charging and control of the 12 V lead battery is managed by the tensioCON. This
device provides the following functions:
-
solar charging for 12 V lead battery up to 120 Ah
simultaneously measuring battery voltage and current
exactly balancing the power charged and recharged to the battery
controlling limiting values
controlling 4 switching outputs, externally controllable (instead of relays)
switching off switch outputs at overload
RS485 over voltage protection
communication with the data logger DT80M via RS485, SDI12
Seite 24 von 65
Smart Field Lysimeter
Figure 23: tensioCON
The tensioCON determines several times per second the battery voltage, the current
to or from the battery as well as the current of the connected devices like data logger,
pump and sensors. Based on the balance the energy consumption of the connected
devices and the charging energy of a connected solar panel are calculated. The battery state is determined by the energy charged and recharged and by voltage limits.
The tensioCON determines the following battery data:
battery voltage [V]
battery current [mA] (positive = discharging, negative = charging)
SOC [%] state of charge
The SOC is the most important information as this represents the current state of the
battery. Battery voltage and current are only momentarily values.
The tensiCON gives these data via the serial RS485 interface to the data logger.
Thus battery characteristic values can be stored and the data logger can switch into
an energy saving mode if necessary.
The tensioCON switching outputs are connected to the data logger, the modem, the
pump controller and the sensors. The tensioCON is configurated in a way that the
data logger is always switched on, except for the battery’s SOC being at a critical
level.
The 3 other switching outputs are switched on and off by the data logger serially or
by digital outputs. Thus the data logger can minimize the energy consumption if
needed.
So primarily the data logger controls the switching outputs and by this the connected
devices. If certain critical values have been underrun the tensioCON automatically
switches off the devices as a final instance.
Seite 25 von 65
Smart Field Lysimeter
Table 2: switching outputs of tensioCON
Output
Device
Logger
controller
1
data logger DT80M
-
Switch off by
tensioCON at
SOC
<5%
2
1DSO
<25%
3
pump controller
Lysimeter 1-4
sensors Lysimeter 1and 2
2DSO
<10%
4
sensors Lysimeter 2 and 3
3DSO
<10%
Description
Permanent power supply of
the data logger. It can initialize the energy saving mode
itself.
Pump controller and pump
motors
All Lysimeter sensors and
balances
All Lysimeter sensors and
balances
The tensioCON can be connected with a PC. For this a tensioLINK USB converter
and the related software from UMS are necessary.
By this software you can configure e.g. the internal switching functions and the
switch off conditions. Also a change of the charging curve is possible if a different
battery with known capacity is used. This capacity must be entered into the
tensioCON so that it can work properly. Only then it can determine the exact SOC.
Of course all values are pre-set for the SmartField-Lysimeter.
Figure 24: tensioCON configuration register
Seite 26 von 65
Smart Field Lysimeter
Figure 25: tensioCON battery state
6.2 Battery management actions
In schedule A the data logger checks all measurement values and status of the tensioCON. Usually this happens once per minute. The values are stored as channel
variables.
Table 3: variables for battery management
CV
1CV
Function
Battery management
Battery Voltage
Def
Type
Description
R,L
[V] Battery under Logger load, sensors
disconnected from battery
[mA] current from battery (positive values = discharge)
[Ah]
[%]
[mA] current from solar panel
[mA] current to logger during measuring
(positive values = logger discharges
battery)
[mA] all Lysimeters
[mA] Lysimeter 1 and (2, optional)
[mA] Lysimeter 3 and 4 (optional)
2CV
Battery current
R,L
3CV
4CV
5CV
6CV
Battery charging
Battery state of charge (SOC)
Solar Panel current
Logger current
R,L
R,L
R,L
R,L
7CV
8CV
9CV
Pump controller current
sensors Lysimeter 1,2
sensorsLysimeter 3,4
R,L
R,L
R,L
Standard settings are active as follows:
SOC > 33%
Seite 27 von 65
Smart Field Lysimeter
Battery level ok, all schedules are executed in normal intervals: schedule B 1
min, schedule C 10 min, schedule D-G 10 min, pumps on, sensors on, modem
stand-by on,
SOC < 25%
Battery level low. Energy consumption is reduced. Data logger goes in power
save mode, pumps off, sensors on, modem stand-by time reduced, schedule
B 1 min, schedule C 10 min, schedule D-G 10 min
SOC < 5%
Battery level critical. Minimum energy consumption. Data logger goes immediately in power save mode, sensors off, modem stand-by off, schedule B 1 min,
schedule C 1 h, schedule D-G off
7 Installation notes
Please note
This manual includes 3 separate single pages that describe and illustrate how to install the SmartField-Lysimeters in the field:
- Cutting the soil column
- Earthworks and basic setup
- Installation and start-up
These 3 pages focus on to dos in order to minimize reading time in the field. If you
need also background information then please read the following chapter.
7.1 Adjusting the Lysimeter and drain water bottle
Adjusting the Lysimeter and its balance as well as the drain water bottle and its balance are crucial for the quality of the measurement values. Please make sure
1. The balances are levelled correctly
2. The layout of the cables and tubes to the Lysimeter keeps them mechanically
flexible
3. Cables and tubes do not touch the outside of the Lysimeter cylinder and the
drain water bottle.
Seite 28 von 65
Smart Field Lysimeter
no!
housing
1
yes!
Figure 26: adjusting and centering the Lysimeter
It is important that the top platform of the balance on which the Lysimeter or respectively the drain water bottle stands is free to move. Cable and tube are tied together
and lead up in a loose loop (see 7.3 Connecting the tubes and adjusting the cables).
All cables not being weighing related should be packed so that they have absolutely
no contact with the mass to be weighed.
Any enclosure touch results in erroneous weight measurement (see chapter 10.4.2.1
Freedom degree limited by contact).
The drain water bottle has to be placed exactly in the center of the Field Box – otherwise it can get in contact with the Field Box lid causing weight measurement errors
too.
Place the Lysimeter exactly in the center of the Lysimeter housing. During the installation stones and gravel may have fallen into the gap between Lysimeter and housing. If so please remove them.
After having fixed the silicone sleeve gasket please check the function by slightly
moving the Lysimeter with your finger – it should start to swing a bit.
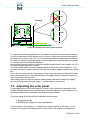
7.2 Adjusting the solar panel
Correct adjustment of the solar panel is crucial for the continuous operation of the
system. Please make sure you know how to correctly adjust the panel upfront or respectively optimize the orientation and angle during operation.
The solar panel of the SmartField-Lysimeter does two jobs:
1. Supplying energy
2. Shielding the logger box from sun radiation
The orientation of the panel is – related to the markers glued to the mast – to the
south on the northern hemisphere and to the north on the southern hemisphere.
Seite 29 von 65
Smart Field Lysimeter
Please note
A wrongly orientated mast fixed in the ground cannot easily be corrected and eventually has a negative influence on the power supply.
The energy consumption and the power of the solar panel always depend on local
conditions. In general there is an energy surplus in summer. In winter a lack of energy may happen so that the system may restrict its operation.
So it is important to optimize the panel adjustment based on winter needs. It is a
good rule of thumb to fix the angle at 30° related to the marker. Of course you can
adjust the angle according to the season. Please check the battery values regularly
in the system schedule (see chapter 6.1 tensioCON charging controller ).
Please note
As the angle of the SmartField-Lysimeter’s solar panel should be optimized for winter
operation it is steeper than the recommended angle for operating solar plants most
efficiently.
Northern hemisphere
S
N
Southern hemisphere
Figure 27: orientation and angle of the solar panel depending on the location
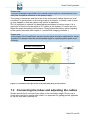
7.3 Connecting the tubes and adjusting the cables
Please shorten the 4 mm and 6 mm tubes to the necessary length. Do not use a
usual side cutter but a special tube cutter. It is important for getting perfect tightness
to clip the tube with a precise cut.
Seite 30 von 65
Smart Field Lysimeter
Figure 28: cutting the tubes correctly
Make sure you insert and remove the tube correctly.
When you insert the tube put it into the fitting and after internal contact push it approx. 1 cm in.
When you remove the tube press the blue ring until you have removed the tube.
Please note
If the tube has not been pushed to the very end stop the connection is blocked!
Seite 31 von 65
Smart Field Lysimeter
Inserting the tube:
After 1st contact inside …
… push in approx. 1 cm further
Removing the tube:
Push blue ring and keep pressing…
…while pulling the tube out
Figure 29: inserting and removing the tubes
Seite 32 von 65
Smart Field Lysimeter
7.4 Autoconfig function
With the Autoconfig function of the data logger you need to configure components of
the Lysimeter for the intended operation (also when you retrofit components).
In principle all sensors are connected to a common measuring bus that distinguishes
the sensors by their addressing. To reduce the configuration effort the Autoconfig
function has been developed. The function distinguishes between device type and
connecting position. There is a dedicated 8 pin plug on the logger box for each Lysimeter. Each type of device exists only once within one Lysimeter line section.
Please note
Immediately after having connected all delivered components execute the Autoconfig
function by using the display functions of the data logger. The configuration will run in
the background. No message will show in the display.
Please execute the Autoconfig function also after every change of your system e.g.
when changing devices or upgrading the system.
At the moment it is not possible to cover 1 to 4 Lysimeter count with one logger configuration. For each Lysimeter configuration you need to load its own dedicated logger configuration.
DT80 V9.10
Smart Field Lysi
Function 1/10
Update Readings
Function 2/10
Reset Probes
Function 3/10
SFL Autoconfig
7.5 Flooding
The design of the Field Box and the Lysimeter enclosure is not waterproof. Therefore
select a place at your site which is representative and preferably not in a
dell/depression, but at a higher lying location. Platform balances are water protected
Seite 33 von 65
Smart Field Lysimeter
IP68, so short time flooding causes no damage, but you need to empty, clean and
replace parts in the Field Box.
8 Maintenance
8.1 Regular service
8.1.1 Filling and emptying the drain water bottle
Please empty the drain water bottle to fill level when its weight has risen up to >9 kg,
Fill the bottle up when its weight has fallen below 1 kg (if there is an aliquot sample
apparatus: below 2 kg).
Do all the steps fast and meticulously. This is important to not make the interpretation
of your measurement data more difficult.
Pay attention to correctly removing and inserting the tubes (see chapter 7.3 Connecting the tubes and adjusting the cables).
Fill level: In rainy seasons, where only little water will flow into the Lysimeter, it is
recommended to set the fill level at 2 liters. In dry seasons fill it up to 8 liters. Please
adjust the appropriate level due to your later experience.
full
fill level
empty
Figure 30: fill level of the drain water bottle
8.1.2 Filling the Tensiometer
8.1.2.1 When do Tensiometers need to be refilled?
Tensiometers need to be refilled when:
the curve of the readings obviously gets flatter and flatter,
the Tensiometer filling indicator at the data logger display shows 1,
the maximum of 85 kPa cannot be reached anymore,
but not until the soil is moister than > -90 kPa.
Seite 34 von 65
Smart Field Lysimeter
If the soil gets dryer than -85 kPa, the readings drop slowly towards zero by diffusion
and slight leakage.
If the soil dries out to more than -1500 kPa (15 bar) the readings drop to atmospheric
pressure as air will enter the cup.
Figure 31: downwardly installation – the
marked pipe is the refilling tube, the unmarked pipe the de-airing pipe
Please fill the Tensiometer when you
are at the site. Remove the black tubing from the black marked pipe and
press in water with the syringe delivered as long as bubbles drop from
the open end. You need max 20 ml of degassed water in the syringe. To degas water
close the half-full syringe and apply vacuum by pulling the syringe piston. Sample
bubbles by turning the syringe upside down and around and push them out afterwards. Repeat this step about three times and fill the Tensiometer.
8.1.3 Degree of freedom of Lysimeter and drain water bottle
Each time you visit the site check the position of Lysimeter (Lysimeter gently swinging) and if silicone sealing is o.k.
Also take care of the drainage bottle not to touch the Field Box cover or cables and
tubes.
Stones and other foreign bodies that are trapped between the Lysimeter cylinder and
housing have an extremely disturbing influence on the weight measurement. If the
measurement data show such an erroneous characteristic (see chapter 10.4.2.1), but
no mechanical contact can be identified also dirt in the narrow slot of the platform
balance can be a reason.
8.1.4 Exchanging spare parts
8.1.4.1 Pump head with tubes
According to pump time activity it will be necessary to exchange the pump head.
The total pump time can be accumulated from measuring data.
You can identify a malfunction of the pump and the need of replacement by the
measurement values of VTENS. A leakage occurred or the motor shaft was slipping
(disengaged). Both reasons – visible in the measurement data – lead to an increased
pump activity.
If the pump head needs to be exchanged you can:
- either send the pump box to UMS
- or order the pump head as a spare part.
Seite 35 von 65
Smart Field Lysimeter
For replacing the pump the pump box needs to be removed and opened.
Figure 32: pump head spare part
8.1.5 Exchanging the drying cartridge
Two drying cartridges are delivered with the Lysimeter Set. Each time when you are
at the site please exchange the drying cartridge inside the Logger Box. To regenerate it remove the plastic lid and place it in an oven at 130°C for four hours. It looks
orange when dry and transparent when wet.
Figure 33: drying cartridge
8.2 Trouble shooting in the field
8.2.1 Checking the electrical energy supply
In normal operation the status LED of the tensioCON flashes in a 5 sec interval. All
loads switched on flash with it.
Seite 36 von 65
Smart Field Lysimeter
Table 4: LEDs energy supply
Output
(LED)
Device
Logger
controller
1
2
3
4
Data logger DT80
Pump system
Lysimeter 1+2 sensors
Lysimeter 3+4 sensors
1DSO
2DSO
2DSO
Switch off by
tensioCON at
SOC
<5%
<25%
<15%
<15%
Switched off by data logger
Only in case of failure
Only in case of failure
Only in case of failure
LED1 indicating the data logger function should always be on. The tensioCON indicates failures (e.g. rechargeable battery empty) by flashing the status LED red.
Is the data logger still active (reaction on pressing the button) the battery state can be
read from the logger display.
8.2.2 Checking the data logger
During measurements the device shuts the display off to reduce energy consumption. By pressing a button the display shows a message and the backlight goes on.
By pressing the buttons UP/DOWN you can scroll through the display modi. First the
logger information shows then the measurement channels.
Date: 23/10/2013
Time: 16:44:02
date and time
DT80M
V9.10
Smart Field Lysi
data logger version and running job
Modem
Start Session
…
Batterie SOC
86%
scrolling through the measurement
channels
…
L1-LYW
8.6kg
…
Seite 37 von 65
Smart Field Lysimeter
Please note
The data logger runs the sensor measurements clocked. Between the measurements
the values are not updated. This can take up to 10 min depending on the measurement value and setting. The values are always synchronized at midnight. That means
a schedule being executed every 10 min always starts at xx: 00 min, xx:10 min, xx:20
min, xx:30 min, xx:40 min and xx:50 min.
Also the execution of the schedule can take approx. 30 sec, as especially the retrieval of sensors with the SDI12 protocol is time consuming.
To provide a faster diagnosis in the field the function “Update Data” is provided. Activate the function on the display and then wait about 30 sec until all schedules have
been retrieved. Then you can read off the new measurement values from the display.
8.2.3 Resetting the data logger
In case of a malfunctioning a data logger reset may help to solve the problem. If the
device still reacts, this can be done by the command “SINGLEPUSH” – also via remote administration.
If the logger does not react you can try a hardware reset. For this push an opened
paper clip into the reset hole on the left side (see Figure 40: connections and reset
hole).
Please note
A reset initializes the data logger program. That means non-permanent settings will
be changed to standard values.
8.3 Winter operation
Depending on the location of the Lysimeter system winter operation can be limited or
even impossible for two important reasons:
1. Frost
Frost prevents the operation of the drain water system and by this the feedback control of the lower hydraulic boundary condition. In order to protect the system from
frost damages the water should be emptied and pump function stopped.
2. Energy supply
In winter energy supply can be very limited. The system switches then into the energy saving mode that restricts certain functions.
Please take care you make the system fit for winter operation. If you expect strong
soil frost empty the drain water bottle, the aliquot sample taking and the pump system.
After this turn off the pump system using the display function. If the pump runs at
temperatures below -20° C the pump tube can be damaged.
Seite 38 von 65
Smart Field Lysimeter
Please note
After re-starting the system in spring all measurement values and data should be
checked to identify damages as soon as possible.
9 Expert functions
9.1 Pump system
The pump system and the controller can be run in different modes. They are controlled by the data logger. A special case is the complete shutdown of the pump system’s energy supply.
In the standard modus at start the pump controller adjusts VTENS and thus the the
lower hydraulic boundary condition to the value given by the reference Tensiometer.
By entering different settings and variables of the data logger the performance of the
pump system can be changed. If you want to keep a Lysimeter at a constant reference value then you need to change 2 channel variables in runtime: the control variable 6xCV and the reference variable 5xCV. The “x” refers to the number of the Lysimeter. You find the settings in the following table. Once set they are kept in operation until you reset them.
Enter the command “NAMEDCVS“ into the command window to get an overview of
the current variables and values:
User entry:
NAMEDCVS {display of named variables}
answer Datataker:
DT80>
CV S CV Name
Value Units
==========================================
1 A Batterie Voltage
13.32 V
2 A Batterie Current
-1950 mA
3 A Batterie Charge
3.64 Ah
4 A Batterie SOC
17 %
5 A Solar Pan. Curre
0 mA
6 A Logger Current
135 mA
7 A PumpController C
0 mA
8 A L1/2 sensors Cur
0 mA
9 A L3/4 sensors Cur
0 mA
61 A L1 LevelControl
2
51 A L1 Manual Setpoi
-50 hPa
117 A L1 Setpoint
-559.9 hPa
62 A L2 LevelControl
2
52 A L2 Manual Setpoi
-50 hPa
217 A L2 Setpoint
-50 hPa
63 A L3 LevelControl
2
53 A L3 Manual Setpoi
-50 hPa
317 A L3 Setpoint
-50 hPa
64 A L4 LevelControl
2
54 A L4 Manual Setpoi
-50 hPa
417 A L4 Setpoint
-50 hPa
Figure 34: NAMEDCVS response
Seite 39 von 65
Smart Field Lysimeter
Table 5: pump system variables
Variable/Function Lysimeter
1DSO=0
1-4
Result
Complete shut-down of the
pump system
1DSO=1
6[x]CV=0
6[x]CV=1
6[x]CV=2
50[x]CV=[SP]
Pump system activated
Comment
Cuts off the power
supply of the pump
system.
Normal operation
manual reference value of
the Lysimeter on SP [hPa]
No impact on automatic operation
1-4
x
x
x
x
9.2 Changing the system configuration
9.2.1 Storage intervals (schedules)
As a standard the weight values for each Lysimeter are stored with a 1 min resolution. All other sensor values and system characteristics are stored every 10 min.
These intervals have proved themselves as good practice and provide the best ratio
of resolution and storage density. Balancing formulas are optimized to these intervals.
Of course you can set your own intervals within certain ranges. In principle the
change of a storage interval is possible in runtime without interrupting the program.
The disadvantage of this is – after a reset or power failure – the data logger starts
again with the standard values. To store the changes permanently the values need to
be changed in the program (config).
9.2.1.1 Changing in runtime (temporary)
To set a temporary change of the measurement or data storage please look at the
table with the function of the schedules and the intervals (see Fehler! Verweisquelle
konnte nicht gefunden werden.).
Schedule D is executed every 10 min. To accelerate the execution to 5 min enter the
command RD5M (see also the DT80M manual).
Seite 40 von 65
Smart Field Lysimeter
User entry:
RD5M {schedule D every 1 min}
answer Datataker:
>
Immediately all sensors in the Lysimeter 1 are read and stored every 5 min.
Please note
Reading sensors via the serial SDI12 interface takes some seconds. During this time
the data logger is blocked and the reaction time may increase. The program becomes instable if there is not enough time between reading time and the start of a
new schedule. Therefore a minimum time for the execution of schedules exists. You
find them in the following table.
Table 6: min and max schedule run times
Schedule
A
B
C
D
E
F
G
H
I
J
Function
Serial retrieval tensioCON
System
Balance data
Sensor data Lysimeter 1
Sensor data Lysimeter 2
(optional)
Sensor data Lysimeter 3
(optional)
Sensor data Lysimeter 4
(optional)
free
Autoconfig
FTP Upload
Standard
interval
1 min
10 min
1 min
10 min
10 min
Min
Max
1 min
1 min
1 min
5 min
5 min
=B
1day
1day
1day
1day
10 min
5 min
1day
10 min
5 min
1day
manually
1day
1hour
7days
9.2.1.2 Changing the program (permanent)
For permanent changes the same rules apply as for temporary ones. For a change
you start the config web page of the DT80M. Click on the left hand side in the program tree on the schedule entry and change the measuring interval in the graphical
diagram of the configuration.
Save the program upfront on your laptop. After activating the new program on the
logger the new storage intervals will be used.
Seite 41 von 65
Smart Field Lysimeter
Please note
If UMS updates your standard program your new storage intervals will be reset.
When you transfer the changed program all previously stored measurement values
will be deleted. So please download the data upfront by manually executing schedule
J (FTP upload).
9.3 SMS alarms
At moment SMS alarms have not yet been integrated in the data logger program. In
the future messages are planned e.g. for:
- drain water bottle full
- drain water bottle empty
- frost alert
- battery alert
- etc.
The function “SMS alarms” is already available in the data logger. You can use it
yourself to send alarms to a certain mobile phone number. For more details see the
DT80M manual.
10 Interpreting the measurements
10.1 Influence of pump times
In the SmartField-Lysimeter the feedback control of the lower hydraulic boundary
condition works very precisely and in a wide range. However you can identify the influence of the pump times on the measurement data.
The pump – a bi-directional peristaltic pump – is run clocked. I.e. it is not the rotation
speed that is controlled but the pump time. During a pump period the pump always
runs with maximum speed. The shortest running time is set to 1 sec. Depending on
the negative pressure and the air volume in the vacuum system this second of pumping causes a visible peak of the value VTENS.
These discrete peaks can be monitored in the diagram (see Figure 35: influence of
pump times). Compared to the complete dynamics and precision of the system these
peaks do not really count.
Seite 42 von 65
Smart Field Lysimeter
Figure 35: influence of pump times
10.2 Balancing the weight values
By using the weight values of the drain water and the Lysimeter a precise balance
can be calculated. The Lysimeter delivers – if set up and ran correctly – the information on precipitation with excellent precision. On purpose a weight balancing has
not been integrated in the Lysimeter program as this kind of evaluation is scientific
work.
Prerequisites for a high data quality are:
- Technically correct measurement of the weights (no contact of the Lysimeter to the
housing side walls and the environment, no snow, no disturbing plant cover)
- Filtering measurement series (filtering laws and errors)
- Avoiding interruptions (e.g. drain water bottle full)
- Data evaluation and verification before calculation
- missing data compensation manually
Seite 43 von 65
Smart Field Lysimeter
10.3 Calculating the precipitation and evapotranspiration
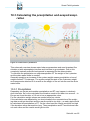
Figure 36: water balance parameters
This schematic overview shows water balance parameters and most important flux
situation at soils atmospheric interface and interface to groundwater. Due to this
complexity basically scientific background is requested for the determination.
To calculate the precipitation an evapotranspiration ET the weight of the Lysimeter
and the drain water bottle is needed.
Generally speaking an increase of the system weight means precipitation a loss of
weight means ET or drainage. The system weight consists of the Lysimeter weight
and components attached to it as well as the weight of the soil column and the drain
water bottle.
10.3.1 Precipitation
Depending on climate and weather precipitation and ET may happen in relatively
short intervals. So for the calculation the duration needs to be taken into account – in
Europe we found duration of 10 min to be an appropriate value.
For the calculation weight values are needed once per minute.
If the calculation was adjusted by too short durations the uncertainties of the weighing data would get dominant and the results would be too high – as each ripple would
be calculated as precipitation or ET. On the other hand the results would be too high
if the durations were assumed too long. Then precipitation and ET would almost cancel each other and the results would get too low.
Seite 44 von 65
Smart Field Lysimeter
At all, the accuracy is still much better than every precipitation instrument we know
so far, as true surface situation is taken into account.
Rain events can clearly be identified in measurement series. So one possible interpretation method for assumed 10 minutes duration is as follows:
„n“ = weight data [kg] at time „n“ in [min]
The surface of the Lysimeter is 0.0707 m², so a 1 kg increase of weight means 14 to
15 mm precipitation.
n [kg] – (n-10 [kg]) * 14.15 = precipitation [mm]
To compensate data uncertainties an average value is taken:
(n-3 + n-2 + n-1)/3 - (n-13 + n-12 + n-11)/3 * 14.15 = precipitation [mm]
If the precipitation is calculated below the tolerance threshold of 5 Grams, the precipitation is set to zero. This means precipitation 0 … <0.035 = 0
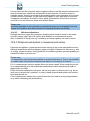
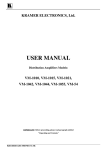
10.3.2 Evapotranspiration
As ET is not an event, but takes place in low rates over longer durations, it is recommended to calculate this for one day using the water balance formula.
ET [mm] = precipitation [mm] + reduction of system weight [kg] * 14.15 [mm] per day
Please note!
If you have growing plants in the Lysimeter you need to continuously reduce the syst
em weight by this amount of biomass.
Seite 45 von 65
Smart Field Lysimeter
Figure 37: evapotranspiration
This example shows the calculation for one day, based on a Lysimeter with a surface
of 1 square meter. So one kg correlates to one mm.
Interpretation of data based on events:
00:00 … 01:30, dew amount of 0.3 mm
01:30 … 07:00, nothing happens
07:00 … 17:00, ET = 2.67 mm
17:30 … 19:00, rain event with 3.5 mm
20:45 … 22:00, rain event with 2.17 mm
22:00 … 24:00, no dew after rain event
Precipitation for this day is 5.97 mm
ET for this day is 2.67 mm
The drainage bottle increased weight of 1.43 kg, so ground water recharge capability
was 1.43 mm.
The Lysimeter weight increased at this day from 2160.00 kg to 2.161.87 kg, so the
change of water amount in the Lysimeter is 1.87 kg.
The calculation is based on the expertise and experience of the Wagna Lysimeter
where different kinds of rain measurements have been compared with Lysimeter
measurements since 2004.
The scientific background is based on Prof. Dr. Johann Fank, Joanneum Research
Graz.
Seite 46 von 65
Smart Field Lysimeter
10.3.3 Et0
Please note
For the exact determination of Et0 usually a radiation sensor and a wind sensor close
to the Lysimeter are necessary.
10.4 Flaws and errors
10.4.1 Battery state of charge (SOC)
In winter a lack of energy may happen so that the system may restrict its operation.
Lack of energy can influence 2 system components.
An important load of the Lysimeter is the pumps for the feedback control of the lower
hydraulic boundary condition. If energy supply is tight this control function stops to
work. Also the update of the measurement data is restricted (see chapter 6: Power
Management). If energy lacks completely the system shuts down and restarts not
before the battery’s SOC has met an acceptable value again.
If these problems occur soon and often you may reconsider the energy supply. In
some cases an optimization of the solar panel’s angle may help. Also increasing the
capacity of the power supply may be a good idea. The system is delivered with a
mains supply circuit and can easily be connected to a permanent power supply from
the mains.
10.4.2 Negative influence on weight values
10.4.2.1
Freedom degree limited by contact
If Lysimeter or drainage bottle has mechanical contact to the housing, surrounding
cables etc. this will have a very heavy impact on weight measuring data. The data
will be instable and in many cases it has a high dependence on temperature (Figure
38).
Figure 38: mechanical contact leads to temperature dependent fluctuations
10.4.2.2
Plants and snow cover
Check if the plant cover at the top edge has a negative influence on the free movement of the Lysimeter. If the plant cover sprawls over the edge, cutting it back makes
sense.
Seite 47 von 65
Smart Field Lysimeter
A snow cover on the Lysimeter has a negative influence on the weight measurement
data as forces from outside are transferred to the Lysimeter. First snow event increases weight. As soon as weight of surrounding snow cover interferes due to snow
crystals onto the Lysimeter you will see strong ripples in your data due to snow selfcompaction processes. A careful cut free gives good data for a short time, but new
snow fall or ice will influence these after a while again.
Please note
As winter operation of the Lysimeter is restricted anyway due to drainage frost shutdowns, this condition should be marked for balancing and then be filtered.
10.4.2.3
Wind and vibrations
Stronger wind can cause the Lysimeter swinging which leads to noise in the measurement values (see Figure 39: spikes and dropouts in measurement series).
Also a vibration of the ground e.g. caused by a nearby highway can lead to noise.
10.4.3 Dropouts and spikes in measurement series
Dropouts and spikes in measurement series belong to the most undesirable events –
although experience tells they happen again and again. Reasons for this are e.g. lack
of energy, sensor troubles, timing problems of measuring buses, animals gnawing on
cables and tubes, corrosion etc.
Please note
It is essential to react as fast as possible on events listed above. This is only possible
by continuously checking the measurement data. Do not leave it to chance!
E.g. in measurement series a weight value can show a peak. When analyzing visually or mathematically one will realize the measurement value represents a spike or
respectively an outlier.
Either technical explanations (dropout, failure) may exist or natural ones (e.g. an animal has run across the Lysimeter). In many cases dropouts and spikes can be identified and filtered out.
If the measurement values are not pre-filtered this can lead to wrong interpretations
(e.g. when calculating the precipitation).
Seite 48 von 65
Smart Field Lysimeter
Wind
Spike
Dropout
Figure 39: spikes and dropouts in measurement series
Seite 49 von 65
Smart Field Lysimeter
11 Appendix
A DT80M
Figure 40: connections and reset hole
Figure 41: front panel
Figure 42: analog input
Seite 50 von 65
B Connection diagram
-UL
Loggerbox
+LS2…+LS4 are optional
-W1
-W1
Connection Logger Multifunktion
EC-8/5-50
-W1
-W1
Connection Logger Multifunktion
EC-8/5-50
Connection Logger Multifunktion
EC-8/5-50
Connection Logger Multifunktion
EC-8/5-50
+LS1
+LS2
+LS3
+LS4
Lysimetersegment
Lysimetersegment
Lysimetersegment
Lysimetersegment
-W3
-W3
-UC1-1
-W3
-UC1-2
-W3
-UC1-3
PL-10
-UC1-4
PL-10
+FB1
+FB2
Fieldbox
-W2
Connection Lysimeter Scale and Probes
EC-8/1.5
PL-10
+FB4
Fieldbox
-W2
Connection Lysimeter Scale and Probes
EC-8/1.5
PL-10
+FB3
Fieldbox
-W2
Connection Lysimeter Scale and Probes
EC-8/1.5
Fieldbox
-W2
Connection Lysimeter Scale and Probes
EC-8/1.5
+L1
+L2
+L3
+L4
Lysimeter
Lysimeter
Lysimeter
Lysimeter
Figure 43: cable connections
Smart Field Lysimeter
C Serial bus diagram
Figure 44: serial bus scheme
Seite 52 von 65
Smart Field Lysimeter
D Connections on the bottom of the logger box
service connector for
tensioLINK/tensioVIEW
solar panel connector
3 further Lysimeter connectors
cable inlet for optional AC
Power supply
1st Lysimeter connector
cable inlet for optional
sensor equipment
Figure 45: bottom view of logger box connections
Seite 53 von 65
Smart Field Lysimeter
E Connector pin assignment
Pin assignment DT80M /Lysimeter plugs 1-4
Signal
Cable color
Function
V+
white
10…14VDC
P+
brown
pump +
S+
green
VTENS signal +
Syellow
VTENS signal Pgrey
pump A
pink
RS485-A
B
blue
RS485-B
SDI12
red
SDI12
GND
shield
GND
Pin
1
2
3
4
5
6
7
8
SHD
female 8 pins
1234
Pin assignment DT80M /solar panel power
Signal
Cable color
Function
V+
brown
solar panel +
Vblue
solar panel V+
white
solar panel +
Vblack
solar panel -
Pin
1
2
3
4
male 4 pins
Seite 54 von 65
Smart Field Lysimeter
Pin assignment sensor distribution box (VTENS)
Signal
Cable color
Function
V+
white
6…18VDC
GND
shield
GND
n.c.
not connected
S+
green
analog signal out+
Syellow
analog signal outA
black
RS485-A
B
blue
RS485-B
SDI12
red
SDI12
Pin
1
2
3
4
5
6
7
8
Pin assignment Pump and Distribution Box / reference Tensiometer
Signal
Cable color
Function
Pin
V+
white
6…18VDC
1
GND
brown
GND
2
n.c.
3
n.c.
4
n.c.
5
A
pink
RS485-A
6
B
blue
RS485-B
7
SDI12
red
SDI12
8
male 8 pins
female 8 pins
Seite 55 von 65
Smart Field Lysimeter
Pin assignment
Pump and Distribution Box /drain water balance
Signal
Cable color
Function
V+
white
6…18VDC
GND
brown
GND
n.c.
n.c.
n.c.
A
pink
RS485-A
B
blue
RS485-B
SDI12
red
SDI12
Pin
1
2
3
4
5
6
7
8
Pin assignment
Pump and Distribution Box / Lysimeter balance
Signal
Cable color
Function
V+
white
6…18VDC
GND
brown
GND
n.c.
green
n.c.
Syellow
VTENS Signal S+
grey
VTENS Signal +
A
pink
RS485-A
B
blue
RS485-B
SDI12
red
SDI12
Pin
1
2
3
4
5
6
7
8
female 8 pins
female 8 pins
Seite 56 von 65
Smart Field Lysimeter
F Technical data
T8 Tensiometer
Material and dimensions
Ceramic
Housing
Shaft
Measuring range
Pressure sensor
Soil water tension
Water level range
Temperature
Accuracy
Pressure
Temperature
Al2O3 sinter, air entry pressure > 15.000
hPa; length 60 mm, 24 mm
PA6 GF30
Notch impact resistant PMMA, 25 mm
-1000 hPa … +1000 hPa (elektronical)
-850 hPa … +1000 hPa (physical)
-850 hPa … 0hPa
(Tensiometer)
0 hPa … 1000 hPa
(Piezometer)
-30 °C … +70 °C
± 5 hPa
± 0,2 K (-10…+30 °C);
± 0,4 K(-30…+60 °C)
Power supply
Supply voltage Vin
Current
Resistance to chemicals
PH range:
6 … 18 V DC
3 mA nominal, (max. 20 mA)
pH 3 … pH 10. Limited to media that do
not etch silicone, fluoro-silicone, EPDM,
PMMA and polyether-imide
Seite 57 von 65
Smart Field Lysimeter
5TE Volumetric Water Content
Measuring range
Water contents
Elektrical conductivity
Soil temperature
Accuracy
Volumetric water content
Electrical conductivity
Soil temperature
Resolution
Matrix potential
Electrical conductivity
Soil temperature
Power supply
Supply voltage Vin
Current
Operating temperature
Apparent dielectric permittivity (εa): 1 (air) to 80 (water)
0-23 dS/m (bulk)
-40°C…50°C
εa: ±1 εa (unitless) from 1-40 (soil range), ±15% from
40-80
• Using Topp equation: ±0.03 m3/m3 (±3% VWC)
typical in mineral soils that have solution electrical
conductivity < 10 dS/m
• Using medium specific calibration: ±0.01 - 0.02
m3/m3 (± 1-2% VWC) in any porous medium.
±10% from 0-7 dS/m, user calibration required above 7
dS/m
±1°C
εa: 0.1 εa (unitless) from 1-20, < 0.75 εa (unitless) from
3
3
20-80 VWC: 0.0008 m /m (0.08% VWC) from 0 to
50% VWC
0.01 dS/m from 0-7 dS/m, 0.05 dS/m from 7-23 dS/m
0.1°C
3.6 … 15 V DC
0.03 mA stand-by, 10 mA max. for 150ms
-40°C…+50°C
Seite 58 von 65
Smart Field Lysimeter
MPS2 Matrix potential sensor
Measuring range
Matrix potential
Soil temperature
Power supply
Supply voltage Vin
Current
Accuracy
Matrix potential
Soil temperature
Operating temperature
-100 ... -5000 hPa, pF 1,71..3,71
-40°C…50°C
3,6 … 15 V DC
0,03 mA standby, 10mA max. for 150ms
±10 kPa for -10 kPa to -100 kPa; ±25%
of the measurement value for -75 kPa .. 500 kPa
1° C
-40°C…+50°C
VTENS virtual Tensiometer
Measuring range
Pressure sensor
Soil water tension
Water level
Accuracy
pressure
Power supply
Supply voltage Vin
Current
-1000 hPa … +1000 hPa (electrical)
-850 hPa … +1000 hPa (physical)
-850 hPa … 0hPa
(Tensiometer)
0 hPa … 1000 hPa
(Piezometer)
± 5 hPa
6 … 18 V DC
3 mA nominal
Seite 59 von 65
Smart Field Lysimeter
G Technical terms
tensioLINK
tensioLINK is a registered trademark of the UMS GmbH. tensioLINK is a serial bus for sensors and devices. Apart from the sensors
all devices in the SmartField-Lysimeter communicate via tensioLINK.
tensioLINK is based on the international standard EIA-485 and RS-485 in the 2 wire version. tensioLINK adds on this bus system a
propietary protocol. Well known other protocols using RS-485 are e.g. Modbus and Profibus.
The tensioLINK protocol is multi master compliant and communicates usually with the transfer parameters 9600 baud, 8N1. Based on
the robust construction of RS485 up to 128 participants can be linked together over cable lengths up to several kilometers.
http://de.wikipedia.org/wiki/EIA-485
http://www.ti.com/lit/an/slla070d/slla070d.pdf
tensioVIEW
tensioVIEW is a registered trademark of the UMS GmbH. tensioVIEW is a easy to use software that supports devices and sensors
with the tensioLINK interface. For this usually the tensioLINK USB converter in the PC is connected to the tensioLINK bus.
For the different types of devices tensioLINK provides descriptions and functions which with the following operations can be executed:
- listing devices linked to the bus
- retrieving status data
- retrieving measurement data
- configuring operating parameters
- storing measurement data of several devices over any long periods of time
- reading out stored measurement values from the sensors
Seite 60 von 65
Smart Field Lysimeter
H Sensor table
Channel Name
Type
Unit
Probe Type
Schedule
Interval
Description
Batt-Volt
Voltage
V
tensioCON
B
10 min
Battery voltage
Batt-Curr
Current
mA
tensioCON
B
10 min
Battery current (positive values = discharging)
Batt-SOC
State of Charge
%
tensioCON
B
10 min
Battery state of charge
Logger Box Temp
Temperature
degC
DT80M
B
10 min
Field Box Temp
Temperature
degC
PL10
B
10 min
L1 Bottom Temp
Temperature
degC
PL-50/100/200
B
10 min
Temperature in Logger Box, value taken from internal DT80M sensor
Temperature in Field Box, value taken from internal sensor of PL-10 balance transmitter
box
Temperature in Lysimeter 1 bottom, value taken from internal sensor of PL-50/100/200
balance transmitter box
Lx-LYW
Weight
kg
PL-50/100/200
C
1 min
Lysimeter no. x weight
Lx-SWW
Weight
kg
PL-10
C
1 min
Drainage bottle Lysimeter no. x weight
Lx-Pump-in
Time
s
SFL-PC
C
1 min
Lysimeter no. x pump time in direction to Lysimeter, calculated by SFL-Pump controller
Lx-Pump-out
Time
s
SFL-PC
C
1 min
Lysimeter no. x pump time in direction to drainage bottle
Lx-REF-TENS-T4
Matrix Potential
kPa
T8
D,E,F
10 min
Reference Tensiometer Type T8 in depth 4, Matrix Potential or Tension
Lx-VTENS-T4
Matrix Potential
kPa
SFL-SDB
D,E,F
10 min
VTENS sensor in in Lysimeter depth 4, Matrix Potential or Tension
Lx-Echo-T1
Water Content
%
5TE
D,E,F
10 min
Water content in depht 1
Lx-Echo-T2
Water Content
%
5TE
D,E,F
10 min
Water content in depht 2
Lx-Echo-T3
Water Content
%
5TE
D,E,F
10 min
Water content in depht 3
Lx-MPS-T1
Matrix Potential
kPa
MPS2
D,E,F
10 min
Matrix potential in depht 1
Lx-MPS-T2
Matrix Potential
kPa
MPS2
D,E,F
10 min
Matrix potential in depht 2
Lx-MPS-T3
Matrix Potential
kPa
MPS2
D,E,F
10 min
Matrix potential in depht 3
Lx-EC-T1
El. Conductivity
mS/cm
5TE
D,E,F
10 min
Electrical conductivity in depth 1
Lx-EC-T2
El. Conductivity
mS/cm
5TE
D,E,F
10 min
Electrical conductivity in depth 2
Lx-EC-T3
El. Conductivity
mS/cm
5TE
D,E,F
10 min
Electrical conductivity in depth 3
Lx-Temp-T1
Temperature
°C
5TE
D,E,F
10 min
Soil temperature in depth 1, value taken from 5TE
Lx-Temp-T2
Temperature
°C
5TE
D,E,F
10 min
Soil temperature in depth 2, value taken from 5TE
Lx-Temp-T3
Temperature
°C
5TE
D,E,F
10 min
Soil temperature in depth 3, value taken from 5TE
Lx-Field-Temp-T4
Temperature
°C
T8
D,E,F
10 min
Field soil temperature in depth 4, value taken from T8 Tensiometer
Lx-REF-Tens-Refill
Indicator
bool
T8
D,E,F
10 min
Field Tensiomter refill indicator, 0=ok, 1=refill
Seite 61 von 65
Smart Field Lysimeter
I
Table of figures
Figures:
Figure 1: separate parts of the manual dedicated to work in the field ...................................................................................................... 4
Figure 2: overall scheme system and components .................................................................................................................................. 5
Figure 3: logger box and components ..................................................................................................................................................... 6
Figure 4: data logger DT80M ................................................................................................................................................................... 7
Figure 5: solar panel ................................................................................................................................................................................ 8
Figure 6: Field Box ................................................................................................................................................................................... 8
Figure 7: drain water balance with drain water bottle and levelling plate ................................................................................................. 9
Figure 8: apparatus for aliquot sample taking ........................................................................................................................................ 10
Figure 9: Lysimeter ................................................................................................................................................................................ 11
Figure 10: platform balance PL-50......................................................................................................................................................... 12
Figure 11: Lysimeter sensor distribution box ......................................................................................................................................... 13
Figure 12: T8 Tensiometer..................................................................................................................................................................... 13
Figure 13: MPS2 sensor ........................................................................................................................................................................ 13
Figure 14: 5TE sensor ........................................................................................................................................................................... 14
Figure 15: feedback control of the lower hydraulic boundary condition ................................................................................................. 15
Figure 16: air entrance into the suction cup in the Lysimeter bottom ..................................................................................................... 16
Figure 17: USB data read out ................................................................................................................................................................ 18
Figure 18: example of daily transmitted .DBD data on the FTP server .................................................................................................. 19
Figure 19: file structure and sorted Excel files on umsdataview.de ....................................................................................................... 20
Figure 20: “Monitor the logger“ page of dEX .......................................................................................................................................... 21
Figure 21: configuration web-page of dEX ............................................................................................................................................. 22
Figure 22: channel variables by “NAMEDCVS” ..................................................................................................................................... 24
Figure 23: tensioCON ............................................................................................................................................................................ 25
Figure 24: tensioCON configuration register .......................................................................................................................................... 26
Figure 25: tensioCON battery state ....................................................................................................................................................... 27
Figure 26: adjusting and centering the Lysimeter .................................................................................................................................. 29
Seite 62 von 65
Smart Field Lysimeter
Figure 27: orientation and angle of the solar panel depending on the location ...................................................................................... 30
Figure 28: cutting the tubes correctly ..................................................................................................................................................... 31
Figure 29: inserting and removing the tubes .......................................................................................................................................... 32
Figure 30: fill level of the drain water bottle............................................................................................................................................ 34
Figure 31: downwardly installation – the marked pipe is the refilling tube, the unmarked pipe the de-airing pipe ................................. 35
Figure 32: pump head spare part ........................................................................................................................................................... 36
Figure 33: drying cartridge ..................................................................................................................................................................... 36
Figure 34: NAMEDCVS response .......................................................................................................................................................... 39
Figure 35: influence of pump times ........................................................................................................................................................ 43
Figure 36: water balance parameters .................................................................................................................................................... 44
Figure 37: evapotranspiration ................................................................................................................................................................ 46
Figure 38: mechanical contact leads to temperature dependent fluctuations ........................................................................................ 47
Figure 39: spikes and dropouts in measurement series ........................................................................................................................ 49
Figure 40: connections and reset hole ................................................................................................................................................... 50
Figure 41: front panel ............................................................................................................................................................................. 50
Figure 42: analog input .......................................................................................................................................................................... 50
Figure 43: cable connections ................................................................................................................................................................. 51
Figure 44: serial bus scheme ................................................................................................................................................................. 52
Figure 45: bottom view of logger box connections ................................................................................................................................. 53
Tables:
Table 1: SmartField-Lysimeter data logger program .............................................................................................................................. 23
Table 2: switching outputs of tensioCON ............................................................................................................................................... 26
Table 3: variables for battery management............................................................................................................................................ 27
Table 4: LEDs energy supply ................................................................................................................................................................. 37
Table 5: pump system variables ............................................................................................................................................................ 40
Table 6: min and max schedule run times ............................................................................................................................................. 41
Seite 63 von 65
Smart Field Lysimeter
J References
Latest data logger firmware and documentation on DT80M
www.datataker.com/downloads
SmartField-Lysimeter installation manual „Cutting the soil column“
www.ums-muc.de/...
SmartField-Lysimeter installation manual „Earthworks and basic setup“
www.ums-muc.de/...
SmartField-Lysimeter installation manual „Installation and start-up“
www.ums-muc.de/...
SmartField-Lysimeter user manual (this document)
www.ums-muc.de/...
SmartField-Lysimeter service manual
www.ums-muc.de/...
General information on UMS products
www.ums-muc.de
Seite 64 von 65
Smart Field Lysimeter
UMS GmbH
Gmunder Str. 37, 81379 Munich, Germany
www.ums-muc.de
Contact:
Dipl.-Ing. Andreas Steins
Tel.: +49 (0)89-12 66 52-18; [email protected]
Seite 65 von 65