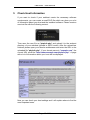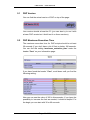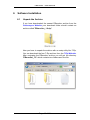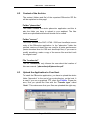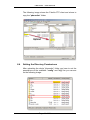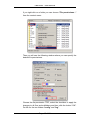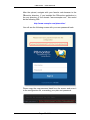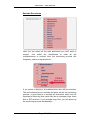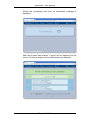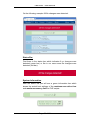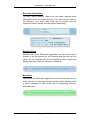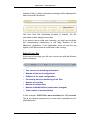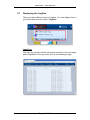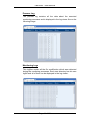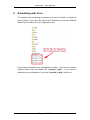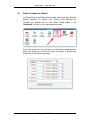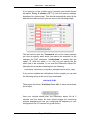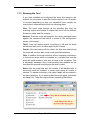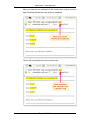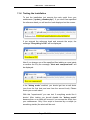
1
Version 1.0 / 31.07.2015 / 17:23 Copyright 2015 - PB-Soft www.pb-soft.com PBmonitor - User Manual Content 1 Introduction................................................................................................. 8 2 Features of PBmonitor ............................................................................... 8 3 System Requirements ................................................................................ 9 3.1 Hardware ................................................................................................ 9 3.2 Software - Host ....................................................................................... 9 3.3 Software - Client ..................................................................................... 9 4 User Requirements ..................................................................................... 9 5 Check Host Information ........................................................................... 10 5.1 PHP Version ......................................................................................... 11 5.2 PHP Maximum Execution Time ............................................................ 11 6 Software Installation................................................................................. 12 6.1 Unpack the Archive............................................................................... 12 6.2 Content of the Archive .......................................................................... 13 Folder "pbmonitor"............................................................................................ 13 Folder "source"................................................................................................. 13 File "readme.txt" ............................................................................................... 13 6.3 Upload the Application to Your Host ..................................................... 13 6.4 Setting the Directory Permissions......................................................... 14 7 Basic Configuration.................................................................................. 16 7.1 Setting an new Password ..................................................................... 16 7.2 Changing the Username ....................................................................... 18 8 Using the PBmonitor Application............................................................ 20 8.1 Starting the Application ......................................................................... 20 8.2 The Overview........................................................................................ 20 8.3 The Navigation Bar ............................................................................... 22 Name and Version ........................................................................................... 22 The Button "Home"........................................................................................... 22 The Menu "Monitoring"..................................................................................... 22 The Menu "Configurations" .............................................................................. 23 The Menu "Logfiles" ......................................................................................... 23 The Button "Manual" ........................................................................................ 23 The Button "Logout" ......................................................................................... 24 Page 3 of 71 PBmonitor - User Manual 8.4 New / Edit Configuration ....................................................................... 25 PHP Max Exec Time ........................................................................................ 26 PHP Memory Limit ........................................................................................... 26 Configuration ID ............................................................................................... 27 Processing Frequency ..................................................................................... 27 Max. Directory Levels....................................................................................... 28 Start Directories ............................................................................................... 28 Exclude Directories .......................................................................................... 29 Hash Algorithm................................................................................................. 30 Display Excluded Files ..................................................................................... 30 Display Modified Files ...................................................................................... 31 E-Mail Width ..................................................................................................... 31 Sending E-Mails ............................................................................................... 31 E-Mail Sender .................................................................................................. 32 E-Mail Receivers .............................................................................................. 32 Archive Diff Files .............................................................................................. 32 Monitored File Types........................................................................................ 33 Saving the Configuration .................................................................................. 33 Types of Form Fields........................................................................................ 34 8.5 Delete a Configuration .......................................................................... 35 8.6 Run a Monitoring Process Manually ..................................................... 37 Status Bar ........................................................................................................ 39 System Information .......................................................................................... 39 Directory Information ........................................................................................ 40 Modified Files ................................................................................................... 40 New Files ......................................................................................................... 40 Deleted Files .................................................................................................... 41 Renamed Files ................................................................................................. 41 Excluded Files: ................................................................................................. 41 Status Footer Bar ............................................................................................. 42 8.7 Displaying the Logfiles .......................................................................... 43 Login log........................................................................................................... 43 Process Log ..................................................................................................... 44 Monitoring Logs................................................................................................ 44 Page 4 of 71 PBmonitor - User Manual 9 Scheduling with Cron............................................................................... 45 9.1 Add a Cronjob in cPanel ....................................................................... 46 9.2 Add a Cronjob via Terminal .................................................................. 48 9.3 Troubleshooting Cron ........................................................................... 49 Check Paths ..................................................................................................... 49 Execute in Terminal ......................................................................................... 49 Check Cron Daemon........................................................................................ 49 Redirect Cron Output ....................................................................................... 49 Check Permissions .......................................................................................... 50 Check Process Log .......................................................................................... 50 10 Advanced Configuration ........................................................................ 51 10.1 Timezone ............................................................................................ 51 10.2 Root Directory ..................................................................................... 52 10.3 Display Start Tree ............................................................................... 53 10.4 Maximum Start Tree Levels ................................................................ 53 10.5 Display Exclude Tree .......................................................................... 54 10.6 Maximum Exclude Tree Levels........................................................... 54 10.7 Process Frequency ............................................................................. 55 10.8 Username / Password......................................................................... 55 10.9 Password Salt..................................................................................... 55 10.10 Send only Cron E-Mails .................................................................... 56 10.11 Session Timeout ............................................................................... 56 10.12 Login Delay ....................................................................................... 57 10.13 Additional Information / Settings ....................................................... 57 11 Securing PBmonitor (Optional) ............................................................. 58 11.1 Installation........................................................................................... 59 11.2 Configuration ...................................................................................... 60 Timezone.......................................................................................................... 60 Host ID ............................................................................................................. 60 Application Path ............................................................................................... 61 Curl Script ........................................................................................................ 61 Files to Check .................................................................................................. 61 Reference Hash ............................................................................................... 62 E-Mail Width ..................................................................................................... 63 E-Mail Sender .................................................................................................. 63 Page 5 of 71 PBmonitor - User Manual E-Mail Recipients ............................................................................................. 63 Debug Mode..................................................................................................... 64 Disable Check .................................................................................................. 64 11.3 Running the Tool................................................................................. 65 11.4 Testing the Installation ........................................................................ 67 12 Customizing PBmonitor ......................................................................... 68 12.1 Modify CSS Styles .............................................................................. 68 12.2 Minify HTML, CSS and JavaScript Files ............................................. 70 13 Support .................................................................................................... 71 14 Feedback ................................................................................................. 71 Page 6 of 71 PBmonitor - User Manual Dear customer Thank you for using PBmonitor! Do you know exactly what happens to your hosted files? Can you be sure that nobody is changing the files on your webhost and takeover the control of your websites, web applications or CMS? Maybe you have also client information stored on your host! PBmonitor can help you to protect your valuable files and get alerted if someone or something is modifying those files! The faster you are informed the better, don't make it easy for intruders to get your information! If your host is compromised, at least you will know it fast and can react! I hope that PBmonitor will help you to protect your information and give you some peace of mind! I hope you will like this application! This manual will show you how to get started with PBmonitor. It provides detailed step by step instructions so that it will be easy for you to install, configure and use this application. One of our objectives is to provide superior support, so that we have happy customers. Therefore, if you have questions or problems while installing or using our software, please do not hesitate to contact us! Sincerely Patrick Biegel Page 7 of 71 PBmonitor - User Manual 1 Introduction The PBmonitor tool is a software for monitoring all file changes inside the subfolders of your web root directory. It can help you to protect your webhost and the files stored there. Constant monitoring will detect all file modifications and can alert you via e-mail. The monitoring process can be scheduled with a cronjob and run all 15 minutes (you can specify the time). It's possible to create different jobs which can run at different times and monitor different directories. If a file modification is detected, an email alert can be sent to the user with a link to the administration panel. The logfiles will protocol all the changes. The tool was made with the Bootstrap framework and therefore is fully responsive and can be used on very different devices like desktop computers, notebooks, tablets and smartphones. 2 Features of PBmonitor Some of the features of the PBmonitor tool are: Monitoring web files for changes. Helps to protect your valuable files! Sends email alerts if changes are detected. Fully responsive user interface (Admin panel). Integrated configuration Editor and logviewer. Bootstrap and jQuery powered for an easy management. Fully customizable PHP / HTML / CSS / JavaScript code. Login function with timeout and delay after failed login. Manual and automatic (cron) execution of monitoring processes. Process scheduling with cronjobs (one per configuration). Logging of processes, file changes and logins. Detailed user manual in PDF format (71 pages / 2.5 MB). Easy to install and configure (copy, permissions and cronjobs). Very well documented PHP / JavaScript code. Small and lightweight installation. Low hard- and software requirements. No MySQL (or any other) database is required. Page 8 of 71 PBmonitor - User Manual 3 System Requirements PBmonitor has very low hard- and software requirements. You can use the little checklist below to see if your hard- and software meet the specific needs. 3.1 Hardware Internet access Linux, Unix or Windows based webserver like Apache PC, Notebook, Tablet (for configuration) 3.2 Software - Host FTP access to your webserver (for installation) Possibility to change directory/file permissions on host Possibility to password protect directories (optional) Possibility to schedule scripts with cron (cronjobs) PHP version >= 5.3 installed PHP 'max_execution_time' set to at least 30 seconds, better 2 or 3 minutes (depending on the number and size of the files) 3.3 Software - Client New webbrowser like IE, Firefox, Opera, Chrome. FTP client application like Filezilla (for installation) PDF-Viewer to read the user manual (like Sumatra Reader) ZIP-Tool to unpack the download archive (like 7-Zip) 4 User Requirements This manual is available before you buy the PBmonitor tool. I would like that you can get the most of the game and therefore please make sure, you are comfortable doing the following actions: Check the hard- and software requirements. Upload files and directories to your webhost. Set directory permissions on the webhost. Edit a configuration file in a text editor. If you have a question about the PBmonitor application, please send me an e-mail message to [email protected]. I'm always glad to help! Page 9 of 71 PBmonitor - User Manual 5 Check Host Information If you want to check if your webhost meets the necessary software requirements, you can create a small PHP file which can show you a lot of information about your host and the installed software. Please create a new text file with the following content: Then save the new file as "phpinfo.php" and upload it to the webroot directory of your webhost (upload in ASCII mode). After the upload has finished, please open your favorite webbrowser and enter the URL to the uploaded file "phpinfo.php". If your domain name is "example.com", the correct URL would be "http://www.example.com/phpinfo.php". A page with a lot of information about your host will be displayed: Now you can check your host settings and I will explain where to find the most important ones. Page 10 of 71 PBmonitor - User Manual 5.1 PHP Version You can find the actual version of PHP on top of the page: Your version should at least be 5.3 (you can also try to run it with a lower PHP version but I didn't test it on those versions). 5.2 PHP Maximum Execution Time The maximum execution time for PHP scripts should be at least 30 seconds (if you don't have a lot of files) or better 180 seconds. You can find this setting 'maximum_execution_time' under the header "Core" on your information page: If you have found the header "Core", scroll down until you find the following setting: Now you can see the value of 300 in this example. If you have the possibility to increase the limit as needed, it would be helpful. For the begin you can start with 30 or 60 seconds. Page 11 of 71 PBmonitor - User Manual 6 Software Installation 6.1 Unpack the Archive If you have downloaded the newest PBmonitor archive from the Codecanyon Website your download folder should contain an archive called "PBmonitor_1.0.zip": Now you have to unpack the archive with an unzip utility like 7-Zip. You can download the free 7-Zip archiver from the 7-Zip Website. After unzipping the PBmonitor archive you will get the directory "PBmonitor_1.0" which contains two folders and one file: Page 12 of 71 PBmonitor - User Manual 6.2 Content of the Archive The content (folders and file) of the unpacked PBmonitor ZIP file will be explained on this page: Folder "pbmonitor" This folder contains the whole pbmonitor application and this is also the folder you have to upload to your webhost. The files inside are optimized/minified and should not be edited. Folder "source" This folder contains the PHP / HTML / CSS and JavaScript source code of the PBmonitor application. In the "pbmonitor" folder the minified versions of those files are used for a better performance (faster download time for CSS and JavaScript files). If you want to modify something, make a copy of the source files and don't edit the original ones! File "readme.txt" The file "readme.txt" only informs the user about the location of this user manual: "pbmonitor/pdf/pbmonitor.pdf". 6.3 Upload the Application to Your Host To install the PBmonitor application, you have to upload the whole folder "pbmonitor" to the root of your web directory on the host. It is easy if you use a graphical FTP client like Filezilla. Please be sure, that you upload the files with the "Transfer type" called "Auto". This makes sure that your files are uploaded the right way. Page 13 of 71 PBmonitor - User Manual The following image shows the Filezilla FTP client and where to copy the "pbmonitor" folder: 6.4 Setting the Directory Permissions After uploading the whole "pbmonitor" folder you have to set the permissions on the subfolder "config" and "log" like you can see on the following image: Page 14 of 71 PBmonitor - User Manual If you right-click on a folder you can choose "File permissions..." from the context menu: Then you will see the following window where you can specify the desired file permissions: Choose the file permission "775", select the checkbox to apply the changes to all files and subfolders and then click the button "OK". Do this for the two folders "config" and "log". Page 15 of 71 PBmonitor - User Manual 7 Basic Configuration You can change the system settings for the PBmonitor application using your favorite text editor or if you don't have a good text editor, you may try one of the free text editors Notepad++ or PSPad. The configuration files are well documented and there should be no problem to change one or more values. 7.1 Setting an new Password For security reasons it's recommendable to set a new password for the administration panel (user interface) as soon as possible. Therefore you have to open the PBmonitor system configuration file "pbmonitor/config/system_config.php" and search for the setting "$login_password" in the configuration file: This setting has the default password "123456789" set and you can change that now. Please enter a good password with at least 8 characters and replace the default hash string: Please be sure to choose a "good" password out of alphabetical characters in upper and lower case, numbers and some special characters like + - @ _ / or similar! A relative strong password would be the following randomly created string of 12 characters: f.2@-L/+DA.d You can use a password manager like Keepass so you don't have to remember all your passwords :-) Then save the configuration file and upload it to your host, overwriting the existing one. Page 16 of 71 PBmonitor - User Manual After the upload, navigate with your favorite web browser to the PBmonitor directory. If you installed the PBmonitor application in the root directory of the domain "www.example.com", this would be the following URL: http://www.example.com/pbmonitor/ You will see the following screen with your new password hash: Please copy the new password hash from the screen and enter it to the configuration file, overwriting your plain text password. Page 17 of 71 PBmonitor - User Manual Then save the PBmonitor system configuration file and upload it to your web host. Your password is now well protected because it's not stored in plain text. Now you can go back to your web browser and refresh the login page and login with your new generated password! 7.2 Changing the Username Changing your password is a good idea and very important! But it's also a good idea to change the default username "Admin" to another username. You can go to the setting "$login_username" in the PBmonitor system configuration file: Page 18 of 71 PBmonitor - User Manual Then change the default username to another one: Then save the PBmonitor system configuration file and upload it to your web host. Your username will now be different but your password is still the same and valid! Page 19 of 71 PBmonitor - User Manual 8 Using the PBmonitor Application 8.1 Starting the Application To start the application navigate in your favorite web browser to the PBmonitor directory on your host. Then enter the username and password into the login form and press the button "Sign in". The overview (homepage) will be displayed: 8.2 The Overview On the overview shows a table with all the existing configurations listed. At the begin, there is only an example configuration called "New Configuration" available: Page 20 of 71 PBmonitor - User Manual For each configuration the last run time is displayed. Because your installation is a new one, the last time can not be displayed: On the right side there are some buttons which allow you to edit, run or delete the corresponding configuration: How to edit, run (start) or delete the configuration will be explained in the following chapters of this user manual. Page 21 of 71 PBmonitor - User Manual 8.3 The Navigation Bar The navigation bar holds all the necessary elements to use the application: On the following pages the different elements will be explained: Name and Version On the left side you can see the name of the application and the actual version. If you click on the name or version, you will be forwarded to the PB-Soft Website. The Button "Home" This button will always bring you back to the overview page with the configuration table: The Menu "Monitoring" Over the menu "Monitoring" you can immediately run (start) the selected monitoring process. This is the same as pressing the green button "Start" on the overview page: Page 22 of 71 PBmonitor - User Manual The Menu "Configurations" From the menu "Configurations" you can create a new and empty configuration, delete and edit an existing configuration: The Menu "Logfiles" Over the menu "Logfiles" you can access the different logfiles for each of the configuration and start directories. You can also view the "Login log" and "Process log": Because you have a new installation, no logfiles are available. The Button "Manual" This button will display the user manual (this document) in PDF format: You will need a PDF viewer to display the user manual. Page 23 of 71 PBmonitor - User Manual If you don't have one, you can get the free Sumatra Reader. The Button "Logout" This button will log you out and display the login form: Page 24 of 71 PBmonitor - User Manual 8.4 New / Edit Configuration To create a new configuration or to edit an existing configuration, choose the corresponding option from the menu "Configurations" or press the blue button "Edit" on the overview page. The configuration editor will be displayed: Page 25 of 71 PBmonitor - User Manual There are quite a lot of settings on this page, so each one of them will be explained on the following pages: PHP Max Exec Time If you don't have access to the PHP configuration of your host, you can try to specify the maximum execution time of a PHP script. It depends on the settings of your host if this setting will succeed or not. If this setting does not help to increase the maximum execution time for PHP scripts, you have to contact your hosting provider and let him increase the value for you. If he does not agree and increase the value for you, you can divide the monitoring process to different configurations. Each of them will run and monitor less files than if you have everything in one configuration file. You can specify the number of seconds for the application to use as the maximum execution time. If the checkbox is activated, this setting is enabled. If the checkbox is not activated, this setting is disabled. As default this setting is disabled. PHP Memory Limit If you don't have access to the PHP configuration of your host, you can try to specify the maximum memory the PBmemory application can use during runtime. It depends on the settings of your host if this setting will succeed or not. If this setting does not help to increase the maximum memory, you have to contact your hosting provider and let him increase the value for you. Normally the memory limit is not a problem and you normally don't have to enable this setting. You can specify the number of megabytes for the application to use during runtime. If the checkbox is activated, this setting is enabled. If the checkbox is not activated, this setting is disabled. As default this setting is disabled. Page 26 of 71 PBmonitor - User Manual Configuration ID Here you can specify an identifier (name or ID) for the actual configuration. This is only used that you can easily identify the different configurations. As an example you can enter a name like "Company Website", "Club CMS", "Web Application" or "Blog". You can change this ID anytime because the PBmonitor application identifies the different configurations by their number. Processing Frequency Normally the cronjob for each of the monitoring starting files is set to 5 minutes. Here you can specify when the actual monitoring process should actually run. An example would be helpful I think. If the starter file is scheduled to run all 5 minutes it will run at: 10:00, 10:05, 10:10, 10:15, 10:20, 10:25 and 10:30 Now if you specify 15 minutes from the dropdown list, the starter file will run all 5 minutes but only trigger the monitoring process all 15 minutes at: 10:00, 10:15 and 10:30 This setting is used to change the frequency of the monitoring processes without having to change the cronjob each time. You can also disable the monitoring process. The default setting is "Process disabled". The following options are available: Page 27 of 71 PBmonitor - User Manual Max. Directory Levels Here you can specify how deep the directories should be scanned (monitored). Normally you want to monitor all directories and the default value of 20 will be all right. If you have extremely deep nested directories you can increase this value. If you don't need to monitor all levels you can decrease this value. Normally you don't have to change this value. Start Directories Here you can select all the start directories to monitor. Just select the checkboxes to mark all the needed (sub)directories: Page 28 of 71 PBmonitor - User Manual Exclude Directories Here you can select all the start directories you don't want to monitor. Just select the checkboxes to mark all the (sub)directories to exclude from the monitoring process like temporary, cache or log directories: If you select a directory, all subdirectories also will be excluded. The more directories you exclude the faster will be the monitoring process. A good idea is to exclude all directories which are not important or have big files inside like (as an example) huge video files or ZIP archives. If you exclude huge files, you will speed up the monitoring process substantially! Page 29 of 71 PBmonitor - User Manual Hash Algorithm Here you can select the algorithm used for comparing the files. You can choose between the "SHA1" and the "MD5" algorithms. While MD5 could be a little bit faster (depends on a lot of things), SHA1 is preferred because it has a longer hash for comparing and therefore should have less collisions. The default value is "SHA1". This is not a security issue just a speed issue! Display Excluded Files This checkbox will specify if you want to have the excluded files displayed if you start the monitoring process manually from the user interface. This can be useful to check if not the wrong files are excluded: If the checkbox is activated, this setting is enabled. If the checkbox is not activated, this setting is disabled. As default this setting is disabled. Page 30 of 71 PBmonitor - User Manual Display Modified Files This checkbox will specify if you want to have the modified files displayed if you start the monitoring process manually from the user interface. This is normally useful. If the checkbox is activated, this setting is enabled. If the checkbox is not activated, this setting is disabled. As default this setting is enabled. E-Mail Width Here you can set the width of the alert e-mails which will be sent by PBmonitor and will specify the width of the "====" bars used to show the information in the e-mails. The default value is set to 70 characters. Normally you don't have to change this setting. Sending E-Mails This checkbox specifies if e-mail alerts will be sent. For testing purposes it can be useful to disable sending of alert e-mails. In normal operation, this setting should always be enabled. If the checkbox is activated, this setting is enabled. If the checkbox is not activated, this setting is disabled. As default this setting is disabled because if you install and test the PBmonitor application you don't want to receive hundreds of e-mails :-) Page 31 of 71 PBmonitor - User Manual E-Mail Sender Here you can enter the sender e-mail address of the alert e-mails. This sender will be visible to the e-mail receivers. If your host is sending this e-mails, you could maybe use the sender address "[email protected]". As default value for this setting an example address is specified. Please change this to a more useful one! E-Mail Receivers Here you can enter all the e-mail addresses of the e-mail receivers which should get the e-mail alerts if file modifications are detected during the monitoring processes. You have to enter only one email address per line. As default, two example addresses are specified. Please replace them with your own address(es). Archive Diff Files This checkbox specifies if the "Diff-Files" will be archived. These files are like snapshots which contain the actual state of the files during the monitoring processes and are used by the PBmonitor application to compare the files. Here an example of a diff file: After the process has finished, those files are not used by the PBmonitor application but maybe can be useful to check some differences manually. Per default this setting is enabled. Page 32 of 71 PBmonitor - User Manual Monitored File Types Here you can enter all file types you want to monitor. This is useful if you want to monitor only some specific types of files like HTML, PHP or CSS. If you want to monitor all files, just delete everything in the text area and leave the field empty. If you enter some values you have to separate them by commas like in the example file endings which are specified as default. Saving the Configuration To save the configuration press the button "Save Configuration": After the configuration was saved successfully an information message will be displayed: Page 33 of 71 PBmonitor - User Manual If there is an error detected an error message will be displayed: If you create a new configuration and save it, the PBmonitor application will also create a starter file which is used to run the new configuration with a cronjob. You will see the following message which shows the successful creation of the starter file: There is a special chapter in this user manual on how to schedule the monitoring functionality with a cronjob. Types of Form Fields The configuration form has fields which are mandatory and the user has to specify an option or enter some text. This fields are identified by a red dot at the right side like you can see on the following image: There are also fields where the input is voluntary and can be left on the default option or without any text. Those fields are identified by a green dot on the right side like on the following image: Page 34 of 71 PBmonitor - User Manual 8.5 Delete a Configuration If you want to delete one or more configurations you can open the menu "Configurations" and choose "Delete Configuration" to open the deletion form: You also can delete a configuration from the overview (home) page by pressing the red "Delete" button like the image below indicates: After that the selection form to delete configurations will be displayed. If you pressed the red "Delete" button of a specific configuration, this configuration is already selected: Page 35 of 71 PBmonitor - User Manual Now you can make some changes if you want and select some more configurations to delete or press the red button "Delete Configurations" to delete the selected configurations. If you delete a monitoring configuration, all the linked files like starter-, backup- and logfiles will also be deleted! Make copies of the data first if necessary! After pressing the button, the configuration and all connected data will be deleted and some success messages will be displayed: Page 36 of 71 PBmonitor - User Manual 8.6 Run a Monitoring Process Manually If you want to run a monitoring process manually, you can open the menu "Monitoring" and choose a configuration to start it: You also can start the monitoring process from the overview (home) page by pressing the green "Start" button like the image below indicates: You also can start the process from the configuration page by pressing the green "Run Monitoring Process Now!" button: Depending on the monitoring configuration, the number of files, the size of the files and the hardware of the host, the process can take some time. Page 37 of 71 PBmonitor - User Manual During this processing time time an information message is displayed: After the process has finished, a report will be displayed on the screen. On this example no file modifications were detected: Page 38 of 71 PBmonitor - User Manual On the following example 28 file changes were detected: Status Bar First there is the status bar which indicates if no changes were detected (green bar) or like in our case some file changes were detected (red bar): System Information After the status bar you will see a green information bar which shows the actual host settings of the maximum execution time and maximum memory limit for PHP scripts: Page 39 of 71 PBmonitor - User Manual Directory Information For each "Start Directory" there is an bar which displays some information about the actual directory. You can see the name of the directory, how many files there are to monitor and the maximum memory usage until this point of monitoring: Modified Files Modified files in the PBmonitor application are files which had a change in the file content but the filename and path are still the same. All the modified files will be displayed with a light blue background right below the directory information: New Files New files in the PBmonitor application are files which did not exist at the last time of scanning. All the new files will be displayed with a green background also below the corresponding directory information bar: Page 40 of 71 PBmonitor - User Manual Deleted Files Deleted files in the PBmonitor application are files which did exist at the last time of scanning but now they do not exist anymore. All the deleted files will be displayed with a red background also below the corresponding directory information bar: Renamed Files If you rename a file, for the application it looks like you deleted a file and then created another file with another name. So in this case you will find those two messages which will indicate this operation. In the following example I did rename a PHP file from "news_config.php" to "news_config2.php": Excluded Files: If you have enabled the setting to show the excluded files or directories, they will be displayed at the bottom of the result page with a gray background: Initial Directory Scan If a directory is scanned the first time, the output will not be displayed because all the files would be marked as new and you would have 10000 files displayed on the screen. Page 41 of 71 PBmonitor - User Manual Instead of that, a yellow information message will be displayed for each of the start directories: The next time the monitoring process is started, the file information will be displayed normally. If you want to run an initial scan manually, you only have to delete the corresponding subdirectory in the "log" directory of the PBmonitor application. If the application does not find the old logfiles it will assume that an initial scan is be running. Status Footer Bar At the and of the page you will see a footer bar with the different status indicators: You can see the following information: Number of the used configuration ID/Name of the used configuration Processing time for monitoring all the files Number of new files Number of deleted files Number of Modified files (content has changed) Total number of monitored files In this example 102978 files were monitored in 197 seconds. This is an extreme example but you see that it's possible to do it with PBmonitor! Page 42 of 71 PBmonitor - User Manual 8.7 Displaying the Logfiles There are three different types of logfiles. You can display them if you select them from the menu "Logfiles": Login log The login log contains all the information related to the user logins and is displayed in the log viewer like on the following image: Page 43 of 71 PBmonitor - User Manual Process Log The process log contains all the data about the executed monitoring processes and is displayed in the log viewer like on the following image: Monitoring Logs This logfiles contain all the file modification which were detected during the monitoring processes. Each start directory has his own logfile and all of them can be displayed in the log viewer: Page 44 of 71 PBmonitor - User Manual 9 Scheduling with Cron To schedule the monitoring processes you have to install a cronjob for each of them. If you open the "pbmonitor" directory you will see different starter files, for each of your configuration one: If you want to schedule your configuration number 1 you have to install a cronjob which runs the starter file "monitor_1.php". If you want to schedule your configuration 2 you start "monitor_2.php" and so on... Page 45 of 71 PBmonitor - User Manual 9.1 Add a Cronjob in cPanel In cPanel there are different themes and styles and also different cPanel versions. So maybe your cPanel looks different but normally you should find an icon called "Cron Jobs" in the "Advanced" section of your administration panel: If you click on the icon you will get to a configuration page and can enter your data into a form and create a cronjob. It should look similar like on the following image: Page 46 of 71 PBmonitor - User Manual If you want to run the cronjob every 5 minutes you should choose the option "Every 5 minutes (*/5****)" from the common settings dropdown list (yellow area). This should automatically enter all the data into the red boxes like you can see on the following image: The last red box with the "Command" will not be ready because you have to specify which script you want to be executed. In the example the PHP interpreter "/usr/bin/php" is started with the option "-f". After the option (-f or --file) you can specify the file which has to be executed, in our case the PBmonitor starter file. Normally this would be something like the following: /usr/bin/php -f /home/your_user/public_html/pbmonitor/monitor_1.php If you want to disable the notifications for the cronjob, you can add the following string at the end of your command: >/dev/null 2>&1 Then press the button "Add New Cron Job" to save and activate the cronjob: Now your cronjob should start the PBmonitor starter file all 5 minutes and the starter file then should trigger the monitoring process depending on how you configured the frequency in your configuration file (15 minutes is a good choice). Page 47 of 71 PBmonitor - User Manual 9.2 Add a Cronjob via Terminal If you don't have an administration panel to add cronjobs you can add them in a terminal session. To create your own crontab file enter "crontab -e" into the terminal: The file will be opened (or created if it does not exist) and you will see the content with the already installed cronjobs. Then you have to add a new line for your cronjob with the following content: */5 * * * path/to/php -f /path/to/pbmonitor/monitor_1.php You also can add the following string after your command if you don't want to receive the notification messages from the cronjob: >/dev/null 2>&1 Then save the crontab file and your cronjob should run! Page 48 of 71 PBmonitor - User Manual 9.3 Troubleshooting Cron Sometimes adding a cronjob can be tricky! Here are some hints on how to find the problem. Check Paths If the cronjob is not working make sure you entered the correct paths for the PHP interpreter and the PBmonitor starter script. Execute in Terminal You can also try to execute the cron command directly from the command line and see if there is an error message or everything runs smooth. If you see nothing try the next step. Check Cron Daemon Enter the following command into the terminal to see if the cron daemon is running: ps -ef | grep cron | grep -v grep You should see something like the following as output: root 1224 1 0 Nov16 ? 00:00:03 cron Redirect Cron Output To direct the cron output to a file you can add the following string to the end of your command line (you have to remove the string for not receiving the e-mail notifications): &>/tmp/cron_output.log Now you can check the file "/tmp"cron_output.log" and see if there are some errors with useful information about the problem. Page 49 of 71 PBmonitor - User Manual Check Permissions It's also possible that there is a permission problem and the user under which the cron is running has no access to the PHP interpreter or the script file. Executing the command in the terminal then should display an error message. Check Process Log If you want to see if the cronjob was executed correctly, you can also check the "Process Log" from the PBmonitor user interface: You should see two lines which indicate when the process was started and when it was ended. If you see both entries, the cronjob was successful. Page 50 of 71 PBmonitor - User Manual 10 Advanced Configuration The PBmonitor system configuration can also be customized. Therefore the different settings will be explained on the following pages. 10.1 Timezone You can specify your timezone which you want to use for the PBmonitor application. You will find more information on how to set the timezone for your region in the PHP manual: PHP manual timezone settings You will see which timezone string you have to enter for your country. The following example shows a part of the the page for the Americas: Page 51 of 71 PBmonitor - User Manual If you live in Chicago, you would have to enter the timezone string "America/Chicago" and replace the existing default timezone string "Europe/Zurich". 10.2 Root Directory If you install the PBmonitor in a subfolder of the web root directory you have to accommodate this setting so that the application can find the directories to scan. For each level of subfolder you have to add "../" to the path like illustrated on the following image: Page 52 of 71 PBmonitor - User Manual 10.3 Display Start Tree If you want to use the green selection tree (start directories) in the configuration editor you have to enable this setting. Normally this is the case and per default this setting is enabled. 10.4 Maximum Start Tree Levels This setting specifies how many levels should be displayed in the green selection tree (start directories). If you have a lot of files you should limit the depth of the directory tree to speed up the page loading time. Per default 3 levels are displayed. Page 53 of 71 PBmonitor - User Manual 10.5 Display Exclude Tree If you want to use the red selection tree (exclude directories) in the configuration editor you have to enable this setting. Normally this is the case and per default this setting is enabled. 10.6 Maximum Exclude Tree Levels This setting specifies how many levels should be displayed in the red selection tree (exclude directories). If you have a lot of files you should limit the depth of the directory tree to speed up the page loading time. Per default 3 levels are displayed. Page 54 of 71 PBmonitor - User Manual 10.7 Process Frequency If you want to use the dropdown list to choose the frequency on which the monitoring process runs, this setting has to be enabled. 10.8 Username / Password You can also change the username and password for the administration panel of PBmonitor. Please refer to the installation section where those steps are explained. 10.9 Password Salt Here you can change the used password salt string, which is a good idea. Just enter a new string and replace the existing one. After changing the salt, you have to generate a new password. This procedure is explained in the installation section of this user manual. Page 55 of 71 PBmonitor - User Manual 10.10 Send only Cron E-Mails Here you can specify if e-mail alerts are sent only if the monitoring process was started automatically by a cronjob (or something similar). If you start the process manually from the PBmonitor administration panel, no alerts will be sent. Per default this setting is enabled. 10.11 Session Timeout Here you can specify the duration of an inactive session. Per default this is set to 15 minutes but you can change it to your needs. After a timeout you will be logged out like on the following image: Page 56 of 71 PBmonitor - User Manual 10.12 Login Delay This setting specifies the login delay after a user made a failed login. Per default this setting is set to 60 seconds. The first time a user enters a wrong password he has to wait 60 seconds before he can login again. If the second login also fails he has to wait twice the time, in this case 120 seconds. The third time 240 seconds and so on (the delay doubles every time)... 10.13 Additional Information / Settings Below there are some settings to specify application parameters like names, versions and links or also some debug settings. This information does not have to be changed for the normal operation of the PBmonitor application. Page 57 of 71 PBmonitor - User Manual 11 Securing PBmonitor (Optional) There is a small tool of two scripts which can monitor the PBmonitor files from outside the application directory and alert if someone (or something like a script) is changing the scanning engine or the configuration itself. You will find the two scripts inside the directory "pbmonitor/tools" and you should copy them to different locations for making it difficult for a intruder to find them. On the following pages you will see how to install, configure and use this tool. Installing this tool is fully optional and the PBmonitor application will also work without this tool! In the configuration section of the script you will see that per default there are five different files specified for monitoring. All of those files are necessary for the PBmonitor application to monitor the files on your host (without the graphical user interface): This tool/script will also detect if someone (including you) makes changes to the configuration file. Therefore you should configure and enable this tool only after you have finished editing and changing your PBmonitor configurations. If you change your PBmonitor configuration after you have enabled this security tool, you have to renew the reference hash in the configuration section of the script, because the script can not check who has changed the configuration, it can only get the information that the configuration file (or another of the monitored files) was modified. Page 58 of 71 PBmonitor - User Manual 11.1 Installation The main script "update_calendar.php" should be placed/hidden in another subfolder of your webroot directory like in the following example. Here the script is hidden inside the directory of a Joomla CMS installation and inside the subdirectory "includes": The names of the two scripts are kind of random and can be renamed to whatever you want. Just choose a name which does not indicate an intruder that the script is monitoring something :-) Page 59 of 71 PBmonitor - User Manual It is not very important where it is placed but it should be in a subdirectory to be kind of hidden. The second script "update_task.php" has to be installed in the web directory or a subdirectory of it on another webhost. The URL to this script will be specified in the configuration of the main script called "update_calendar.php". To run the main script, a cronjob has to be created which runs all 5, 10 or 15 minutes (you can choose any frequency to run the script). Please refer to the section "Scheduling with Cron" for more information on how to install a cronjob. 11.2 Configuration After both scripts are installed (copied) please open the main script "update_calendar.php" in your favorite text editor. At the top there is a configuration section which has to be updated: Timezone Please enter your timezone. Please also check the Section "Advanced Configuration" for how to enter the default timezone. Host ID Here you should enter a unique name or ID for your host. This will identify the host in the alert e-mails. If you have more than one monitored host you will know from which one the alert was sent. Page 60 of 71 PBmonitor - User Manual Application Path This is the most important setting and has to contain the path from this script to the PBmonitor application directory. In this example we have to go up two directory levels and then enter the directory "pbmonitor". Curl Script This setting specifies the URL to the script "update_task.php" which has to be installed on another host from which it is possible to send e-mails. If you don't have another host you have to leave this setting empty like in the following example: $curl_script = ""; Files to Check This array will specify the files to check. These are all necessary files for running the monitoring process from a cronjob. Page 61 of 71 PBmonitor - User Manual If those files are OK the cronjob can run and monitor all the other files on the host. This setting normally does not have to be changed because the default values are the correct ones. Reference Hash This setting has to contain the reference hash which is used to check if the files of the scan engine were not modified. Please configure the rest of the file and leave this setting empty. After you have configured the remaining settings, please call this script from your favorite webbrowser to obtain the reference hash. You have to enter the URL of this script in your webbrowser like in the following example: If you enter the correct URL to the script you will see the reference hash displayed on your screen. Now just copy the hash and paste it into the configuration part of the script and save the file. There is no default value for this setting: Page 62 of 71 PBmonitor - User Manual E-Mail Width Here you can set the width of the alert e-mails which will be sent by PBmonitor and will specify the width of the "====" bars used to show the information in the e-mails. The default value is set to 70 characters. Normally you don't have to change this setting. E-Mail Sender Here you can enter the sender e-mail address of the alert e-mails. This sender will be visible to the e-mail receivers. If your host is sending this e-mails, you could maybe use the sender address "[email protected]". E-Mail Recipients Here you can specify the e-mail addresses of the recipients of the alerts. For every recipient you have to use a new line. As default there are two example addresses specified. Replace them with your own e-mail addresses. Page 63 of 71 PBmonitor - User Manual Debug Mode This setting is used to install and test the script and will also send e-mail alerts if you start the script via browser. If the "debug mode" is disabled later, e-mails are only sent if the script is started from a cronjob. Please don't forget to disable the "debug mode" after testing testing the script! Disable Check With this setting you can disable the tool if you enter the value 1. As default the script is nod disabled (value 0). If you disable the script, you do not have to disable the corresponding cronjob because the cronjob can execute this script all couple of minutes but the script will not do anything until you enable it again. Page 64 of 71 PBmonitor - User Manual 11.3 Running the Tool If you have installed and configured the script like stated in this manual, you only have to start the cronjob and let it run. All couple of minutes (depending on how you scheduled your cronjob) the main script is executed and will do the following steps: First: The script loops through all the specified files from the scanning engine and creates a unique hash out of all the different filenames, paths, and file contents. Second: Then the script will compare the newly generated hash against the reference hash which is stored in the configuration section of the script. Third: If the two hashes match, everything is OK and the script will exit and wait until it is called again by the cronjob. Fourth: If the two hashes do not match, the files were altered and the script will send an alert e-mail to all specified recipients. Fifth: In addition the script will send all the necessary information to the second script which is installed on a remote host and this script will send another e-mail alert to each of the recipients. This is necessary because if the e-mail sending was disabled on the local host the second host will send the alert e-mails. Sixth: After the script has sent the e-mails, it will disable itself. If the script would be enabled, it would send alerts all couple of minutes. To disable the script, a file called "stop" will be created in the same directory. If you want to start the script again, just delete the "stop" file. Then the script will start monitoring like before. Page 65 of 71 PBmonitor - User Manual Here you can see an example of the e-mail alert sent by the first host (localhost where the main script is installed): This is the e-mail alert from the remote host: Page 66 of 71 PBmonitor - User Manual 11.4 Testing the Installation To test the installation just execute the main script from your webbrowser ("update_calendar.php"). If you don't have specified the reference hash you will see the hash displayed on the screen: If you entered the reference hash and execute the script, the message "Everything is OK!" will be displayed: Now if you change one of the specified files (adding a coma inside or rename the file) the message "Host was compromised!" will be displayed: If the "debug mode" enabled, you should get two e-mail alerts (one from the first host and one from the second host). Please check your e-mail inbox! With this "experiments" you can test if everything works like it should. After testing you should disable the "debug mode" because then no e-mails will be sent if you access the script from your webbrowser. Only if the script is executed by a cronjob (or something similar) the alerts will be sent. Page 67 of 71 PBmonitor - User Manual 12 Customizing PBmonitor There are different ways to customize the PBmonitor application. The easiest way is to change the CSS styles and change the colors or fonts. On the following pages this will be explained: 12.1 Modify CSS Styles The PBmonitor application contains CSS styles to specify the look of the HTML output. You can edit this CSS specifications and change them. If you want to edit the CSS styles, please open the stylesheet "pbmonitor.css" from the source folder in your favorite text editor. If you don't have a good text editor, you may try the free text editor Notepad++ or PSPad. The PBmonitor styles are separated into different sections. Each section specifies the settings for a specific component. The description of each section shows for which component(s) the settings are. Here you can see an example of a description: /* =============================================== // This is an example description. // =============================================*/ Below each of the the descriptions, a group of settings are placed. Here you can see such a group of settings: body { background-color: #C3D4E3; color: #003366; font-family: Arial, Helvetica, sans-serif; font-weight: bold; } Each of the settings consist of the "settings-name" and the "settings-value". They are separated by a colon ":". At the end of each setting, a semicolon ";" character is needed to separate it from the next setting. In the following example "font-weight" is the name and "bold" is the value: font-weight: bold; Page 68 of 71 PBmonitor - User Manual Here you can see an example from the CSS file "pbmonitor.css": If you want to know more about HTML and CSS you can visit the HTML Dog Website where you can find a lot of information. There you will find also a CSS Tutorial for Beginners. Page 69 of 71 PBmonitor - User Manual 12.2 Minify HTML, CSS and JavaScript Files As default, the minified versions of the PHP, CSS and JavaScript files are used in the upload folder "pbmonitor". If you want to see or modify the source code for your own use, you can find the files in the directory "source": After you made your changes you can minify these files with one of the following two free tools: For CSS and JavaScript code the "Microsoft Ajax Minifier" For HTML code the "htmlcompressor" There are a lot of other tools around, so feel free to use whatever you like! Be sure to always use a copy of the original files and NEVER minify the original files! Page 70 of 71 PBmonitor - User Manual 13 Support If you have a question or a problem while installing or using PBmonitor, please contact us - we are always glad to help you! You can contact us using the following methods: Website: www.pb-soft.com E-Mail Address: [email protected] 14 Feedback We always like feedback from you so that we can improve our products. If you think there is something missing or there is an error in this manual, please contact our support so we can add the missing information or fix the error in the manual! Thank you a lot for your attention and have a nice day! Patrick Biegel Page 71 of 71