
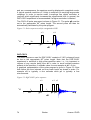
1
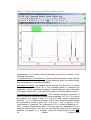
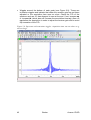
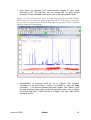
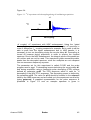
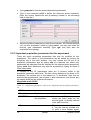
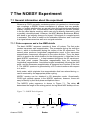
•
After the experiment fourier transform the spectrum with the command
efp. The signals should all be negative.
•
Now the adjustment of d7 can be started. Type gs to get into an
interactive data acquisition mode, where parameters can be changed,
while the sample is continuously measured and displayed, so that the
effect of the change can be judged directly. To see the phased spectrum
click on the
button. Now you can interactively change d7 either by
typing in the command d7 and giving it a value or with the sliders to the
left of the spectral window. Steps of about 100 ms are appropriate. Note
that the experiment is running in the background, so the effect of the
change can only be seen after the next scan! The signals will get smaller
with increasing d7, then they will go through zero intensity and finally to
positive values. The mixing time we are looking for equals the delay that
is needed for minimum signal intensity of all peaks. Note, that the signals
will go through zero intensity at different times, as the relaxation
behaviour depends on the mobility of the group the proton is bonded to.
Hence a methyl group will have a longer relaxation time than a proton that
is bonded to a rather rigid aromatic ring system. Furthermore, remember
that there may be small molecules (solvent, TMS, etc.) giving rise to very
slowly relaxing signals that don’t belong to the molecule of interest.
•
The value of d7 giving minimum signal intensity is the appropriate value
for d8. Note, that for macromolecules (proteins, polymers) the best value
for d8 may be shorter than the value found for d7 to prevent spin
diffusion.
7.3 Spectral processing
After the spectral acquisition has finished, the data has to be processed. You
may do this either automatically using the xaup command or manually.
7.3.1 Automatic processing
The command xaup will invoke the automation AU program that is stored
along with the processing parameters in the aunmp parameter. In this case
the aunmp AU program is called proc_2dsym.
Typing xaup will automatically process the data and thus it will generate a
phase corrected spectrum, it will also perform a baseline correction and it will
do an automatic integration of the peaks. By default, a plot will be created
using the plot-layout which is also stored in the processing parameters. For
the NOESYPHSW parameter-set this layout file is called 2D_hom.xwp.
7.3.2 Manual processing
The acquired data may also be processed manually. The steps that belong to
the spectral processing are all arranged in the NMR data processing guide,
which may be invoked from the Processing Î Data Processing Guide
menu.
Window function: In 2D experiments the window functions can be used to
diminish truncation artefacts, to enhance wanted signals over unwanted (for
example diagonal peaks) and to improve the peak shape.
Avance 1D/2D
Bruker
117


![e-track User`s Manual [FW1.00]](http://vs1.manualzilla.com/store/data/005696177_1-79f2a7130a6208690505d356432cfe5f-150x150.png)