1
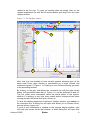
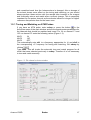
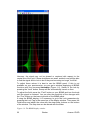
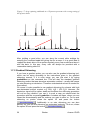
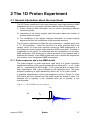
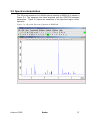
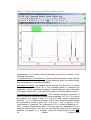
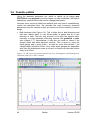
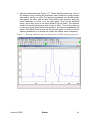
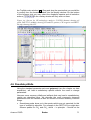
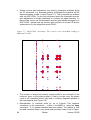
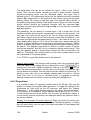
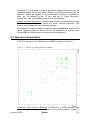
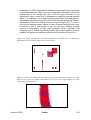
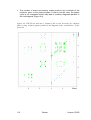
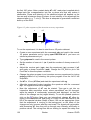
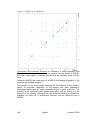
whereas only the region defined by f1p and f2p is used when the command
pps was applied.
The sensitivity can be altered in several ways. First a lower limit for the
smallest intensity that should be recognized as a peak can be entered. You
can type in any value for MI or got to the “Set to” button and choose either
the lowest contour level, the MI value already stored with the dataset or the
MI value used during the last peak picking routine. If the value is too low, too
many peaks will be picked, if it is set to a too high value, weak peaks will be
missed. A similar limitation can be applied to the maximum intensity. If MAXI
is set to a smaller value than 1, every peak that has a higher intensity will not
be picked. The diagonal gap allows to define a certain number of points
around the diagonal, that will not be considered during peak picking. That
way the diagonal peaks of homonuclear spectra will not be entered in the
peak list. The smaller the resolution value is, the closer 2 peaks may be to be
still considered as 2 separate peaks.
For a NOESY positive and negative peaks need to be detected.
Manual peak picking: The manual peak picking mode can be started either
from the peak picking dialog box by pressing the button
or
directly from the main TopSpin window by clicking on the icon
. You will
enter the peak picking window. Set the cursor over a peak, click with the right
mouse button and confirm, that the peak should be added to the peak list. To
delete a peak, right click on an already marked peak and click on “Delete
Peak From List”. If you click on “Annotate Peak” it is possible to add any
desired assignment to the peak. Leave the dialog with the button.
7.4.2 Projections
It is possible to show 1D spectra on either side of the 2D plot. This may be
helpful, to identify cross peaks within spectrum. To toggle the display of the
projections on, right click on the 2D spectrum and select the “Display
Properties…”. In the dialog window toggle on the option “Show projections”.
On the bottom it is possible to choose, whether the projections in F1, in F2 or
in both dimensions should be visible. The moment, the projection display is
turned on the positive projections are displayed above the spectrum and to
the left as a default.
Display of a recorded 1D proton spectrum: Right click with the mouse over
the displayed projection and choose the option “External projection”. A dialog
box will open where you can type in the path information of the dataset that
should be displayed.
Alternatively it is possible to start a projection display dialog box with the
command projd. On top the option “Display 1D spectra along with the 2D
spectrum” should be toggled on. If the checkbox is ticked it is possible to
enter any 1D dataset for the F2 (left) and the F1 (right) dimension,
respectively. After clicking OK the spectra will be displayed.
Display of internal projections: To switch back to the internal projections, right
click over the projections and choose the option “Internal Projection”. The
positive internal projection will be displayed again.
Avance 1D/2D
Bruker
123


![e-track User`s Manual [FW1.00]](http://vs1.manualzilla.com/store/data/005696177_1-79f2a7130a6208690505d356432cfe5f-150x150.png)