1
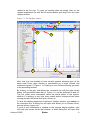
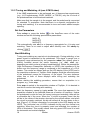
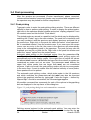
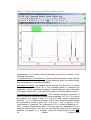
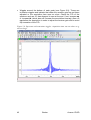
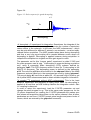
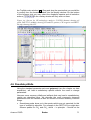
window. The window will now show the spectrum with a cursor cross and
some icons on top. Now some rather strong peaks should be selected that
are spread as far as possible over the spectral range. To do this move the
mouse, until the cursor is over a peak, click the right mouse button and select
Add from the menu. That way, the rows and columns along the cursor cross
will be added to the rows and columns that will be shown when going to the
phasing itself.
To adjust the phasing of the rows, click on the
button. The selected rows
will be displayed as 1D spectra. The position of the reference- or pivot point
is indicated by a red vertical line. By default, the highest peak of the first row
is defined as the pivot point. However, this may be a peak which is located in
the central part of the spectrum. If this is the case it is advisable to define a
peak somewhere close to the edge of one of the rows as pivot point. Move
the cursor over the peak, press the right mouse button and select Set Pivot
Point from the context menu.
Use zero order phase correction to correct the phase around the area of the
pivot point: place the cursor over the
button, hold down the left mouse
button and move the mouse up or down. Thus, adjust the 0 order phase
value until the baseline around the peak at the pivot point is flat and the peak
itself is positive.
Then adjust the first order phase value in the same way by holding down the
left mouse button over the
button. Move the mouse up and down until a
cross peak on the opposite side of the spectral region is phased and the
baseline around this peak is flat as well.
Note that it may not be possible to phase all peaks into pure absorption, as
they may be dephased as well in the indirect dimension. If this is the case,
some peaks will contain a negative part. Therefore it may be more useful to
look at the baseline, than just at the peaks phase.
By clicking the save-and-return button ( ), the phase correction will be
applied to the spectrum and the values for zero- and first order phase
correction will be stored to the corresponding processing parameters of the
F2 dimension: phc0 and phc1. Whenever you type xfb these phase
correction values will be taken into account, as long as the PH_mod under
the ProcPars is set to pk.
Now the spectrum may still be out of phase in the indirect dimension. Press
the button
and proceed with the phasing of the columns exactly the same
way, as with the rows. The resulting phase correction will then be
automatically entered into the parameters phc0 and phc1 of the indirect
dimension F1.
Leave the phasing by clicking the button
.
Calibration and referencing: The chemical shift ppm axis may be calibrated.
The sref command automatically looks for a peak at around 0ppm (±
0.5ppm) and assumes that this is the TMS or another internal reference
substance. It will then calibrate the axes of the spectrum in a way that this
peak is at exactly 0ppm in both dimensions. If sref does not find a peak at
around 0 ppm, it uses the solvent information for the axis calibration.
Avance 1D/2D
Bruker
177


![e-track User`s Manual [FW1.00]](http://vs1.manualzilla.com/store/data/005696177_1-79f2a7130a6208690505d356432cfe5f-150x150.png)