1
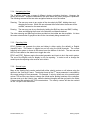
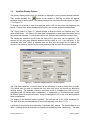
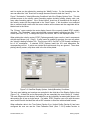
5.4.2.2 Time Series Plots
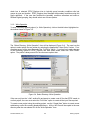
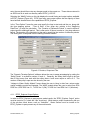
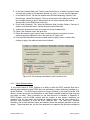
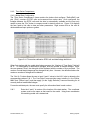
The “Plots” function allows the user to view on screen or export the plots that are currently
defined and enabled (i.e. Use flag = 1). The “Plots” function loads the EFDC model linkage files
(e.g. EE*.out), reads the observed data files and then scans the model linkage files to build the
model-data plots. The user can press ESC during the model output loading process to abort the
loading and plotting. When the data has been loaded the time series plotting utility is displayed.
This is the same utility used for all other time series and X-Y plots. However, when viewing the
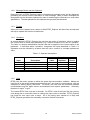
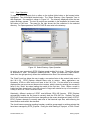
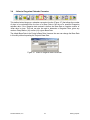
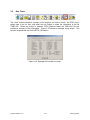
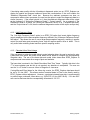
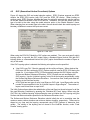
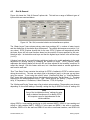
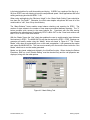
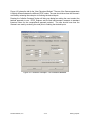
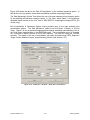
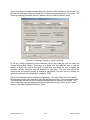
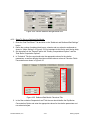
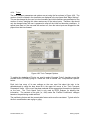
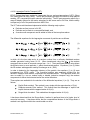
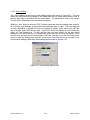
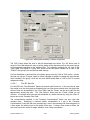
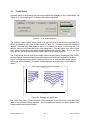
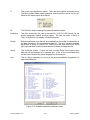
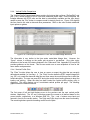
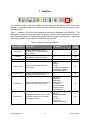
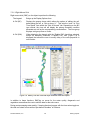
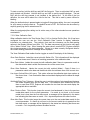
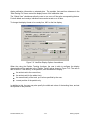
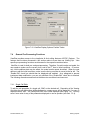
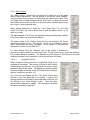
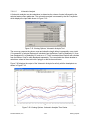
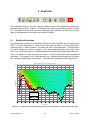
time series calibration plots three (3) additional function are available on the toolbar. The
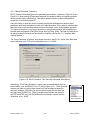
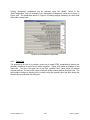
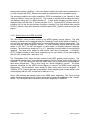
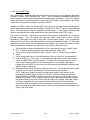
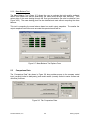
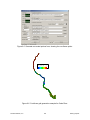
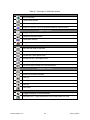
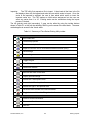
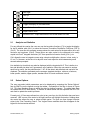
following graphic shows the time series plotting toolbar with the three calibration specific
functions outlined in red.
These buttons all close the current calibration plot and, in order of the buttons shown, move to
the previous plot, move to the next calibration plot or exit the time series calibration viewer.
When moving from one plot to the next, when the last plot has been viewed the user is
requested to either continue viewing the plots (starting over at plot 1) or exit the viewer.
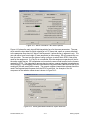
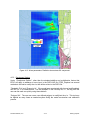
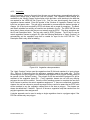
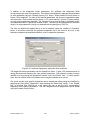
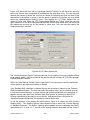
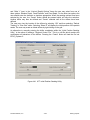
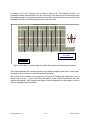
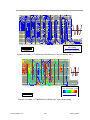
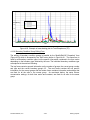
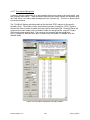
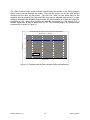
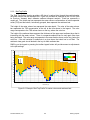
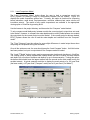
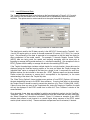
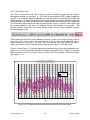
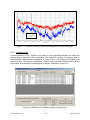
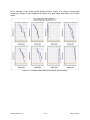
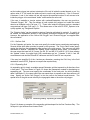
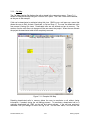
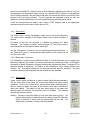
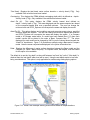
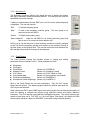
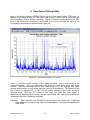
Figure 5-16 and Figure 5-17 provide example plots produced by the time series calibration tool.
Figure 5-16 is for a water surface elevation comparison (layer option K=0). Figure 5-17 shows a
MMA time series plot (the “average” series is turned off for this example) of dissolved oxygen
(layer option = -1).
St. Lucie Estuary, Tide Calibration
Calibration Results: Time Series Summary
1.50
1.40
1.30
1.20
1.10
Legend
Inlet-Model
Inlet-Data
Water Surface (m)
1.00
0.90
0.80
0.70
0.60
0.50
0.40
0.30
0.20
0.10
0.00
-0.10
11-Jan-00
14-Jan-00
17-Jan-00
20-Jan-00
23-Jan-00
26-Jan-00
29-Jan-00
Date
Figure 5-16 Example model-data time series comparison for water levels.
DS-International, LLC.
5-15
EFDC_Explorer