1
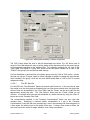
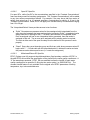
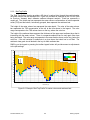
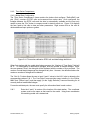
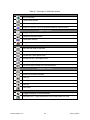
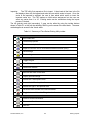
View boundary conditions map and view boundary condition time series.
o View profiles of sediment bed and water column properties with time.
o Store and quickly display time series calibration comparisons.
o Compare velocity data to other model runs or field data (e.g. ADCP)
o Compare model results from two different models to each other.
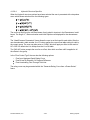
View Sediment Diagenesis concentrations and nutrient fluxes
o View by class or total concentrations of PON, POP & POC
o View concentrations by diagenesis layer or totals
o View nutrient fluxes
Model Metrics
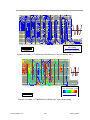
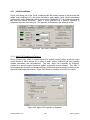
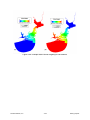
o Grid Orthogonality map & statistics,
o Cell angle maps,
o Courant Number,
o Courant-Friedrichs-Levy (CFL) time step limits,
o Froude Number,
o Densimetric Froude Number,
o Celerity, and
o Richardson Number.
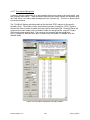
View Longitudinal Profile plots
o Generate longitudinal plots of water column and bottom sediments results.
o User specified layer averaging (e.g. "1-3” will average the bottom three
layers).
o Water column or bottom sediment data can be overlaid with bottom
topography and/or water surface elevation/depth results and/or bed shear.
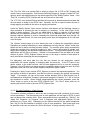
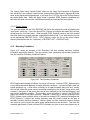
Overlay plan view plots with the following Calibration Data/Information:
o Station ID,
o Date/Time coordinated data values,
o Date/Time coordinated data residuals, and
o Data values and residuals can use the same depth averaging or specified
layer options specified for the model results.
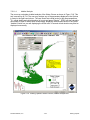
View plotting and animation of Lagrangian Particle Tracking.
o Added the ability to export one or more particle tracks to ASCII files for
linkage to 3rd party applications.
Post-Processor- Vertical Profiles
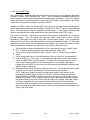
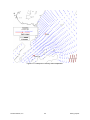
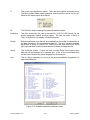
View 2D vertical section plots along any I or J index or user defined polyline.
For any vertical section view/animate:
o Velocities,
o Salinity,
o Temperature,
o Dye or a computed Age of Water (EFDC_DS Only),
o Toxics,
o Sediments, and
o Water quality parameters.
Post-Processor-Miscellaneous
Water flux calculator by layer or totaled for all layers.
Sediment mass balance/sediment mass loadings.
Post-Processor-Calibration Comparisons
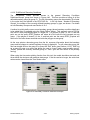
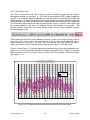
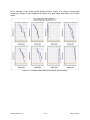
Time series comparisons for water column data of measured to modeled data for any
layer, depth averaged and/or Min-Avg-Max model results.
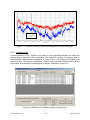
Vertical profile comparisons.
DS-International, LLC
1-6
EFDC_Explorer