1
GGIG Graphical Interface Generator – User Guide
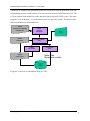
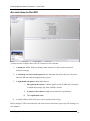
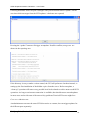
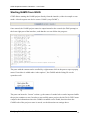
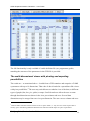
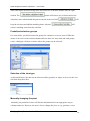
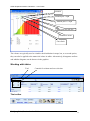
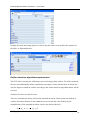
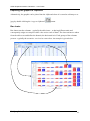
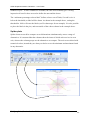
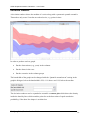
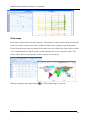
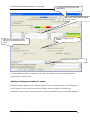
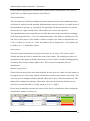
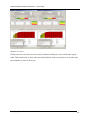
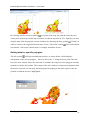
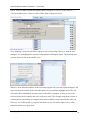
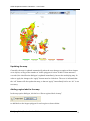
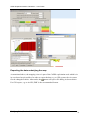
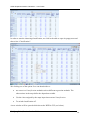
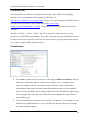
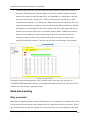
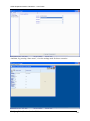
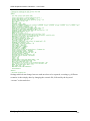
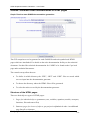
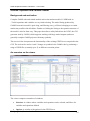
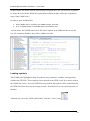
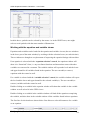
Graph: The interface in ”exploitation” mode
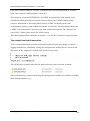
The right hand side comprises a set of drop-down boxes from which up to 15 different
scenarios (or result files) can be selected. The first element in each box is empty.
The left hand side shows, depending on the work step, selection control for countries, the
regional level, base year and simulation year. Operating these control filters out files from the
disk shown in the drop-down boxes. In the example above, only results files for the base “04”,
simulation year “20” and the regional level 2 (= NUTS2) can be selected.
Selecting scenarios
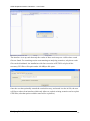
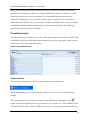
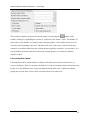
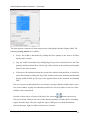
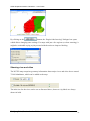
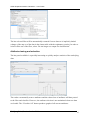
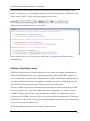
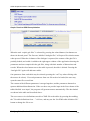
When the user clicks on “Exploit scenarios” in the task selection panel, the drop boxes are
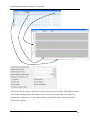
shown on the right hand side. Each box comprises the list of GDX files found in the result
directory registered for that task. The user can select in each box a file, or leave it empty. The
text fields next to the boxes allow the user to replace the file name normally used as a
description of the scenario by a user chosen text.
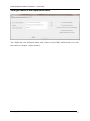
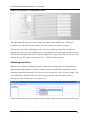
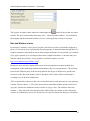
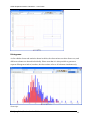
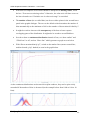
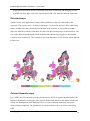
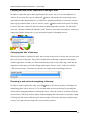
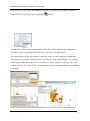
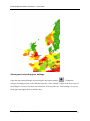
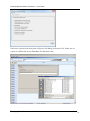
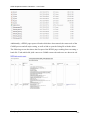
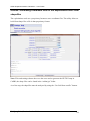
At the bottom of the panel, pressing the “show results” button will open the exploitation tools:
Wolfgang Britz, Version October 2014
21